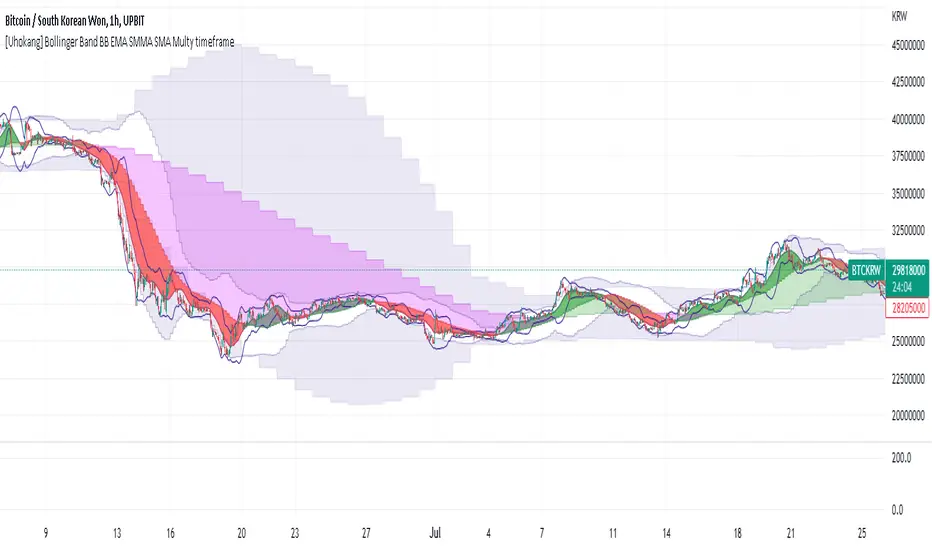
[Uhokang] Bollinger Band BB EMA SMMA SMA Multy timeframeYou can view indicators from the specified upper timeframe together.
( Bollinger Bands, SMMA, EMA, SMA )
If it is based on a 1-hour bar, you can see indicators for 4-hour bars and 1-day bars at the same time.
=> =>
Minutes
1 => 5 => 30
2 => 10 => 60
3 => 15 => 90
4 => 20 => 120
5 => 30 => 120
6 => 30 => 120
10 => 60 => 240
15 => 60 => 240
30 => 120 => 480
45 => 180 => 450
over Hours
1 => 4 => D
2 => 8 => 2D
3 => 12 => 3D
4 => D => W
D => W => M
W => M => Y
스크립트에서 "band"에 대해 찾기
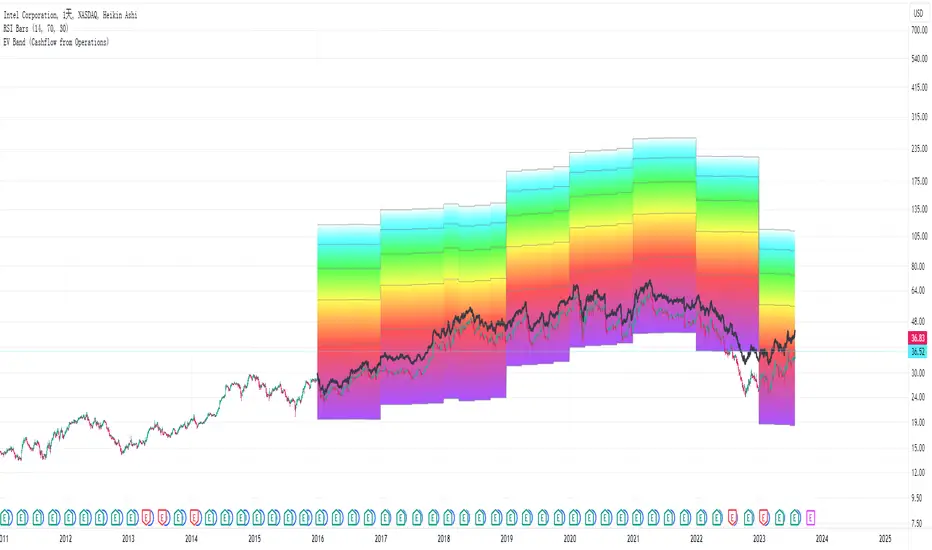
Enterprise Value on Earnings / FCF / FFO Band Enterprise Value per Diluted Share plotted as black line.
Bands start at 5x and stops at 30x, each represents a 5x increment.
Band Options (per Diluted Share, Fiscal Year):
①Free Cash Flow
②Operating Income
③Adjusted Funds from Operations
④Core Earnings
where:
AFfO = FFO - Unusual Income/Expenses + Tax Distortion (dafault 25% tax rate)
Core Earnings = Net Income - Unusual Income/Expenses + Tax Distortion (default 25% tax rate)
These two adjustments are coarse and watered-down, so take them with a grain of salt.
For professional assessments of Core Earnings versus GAAP Earnings you may go to David Trainer at Great Speculations(costs money). I am unaffiliated with these entities.
Tips:
①③ are unapplicable to financials.
③ may work for REIT-like companies whose depreciation is mostly overstated(e.g. hydro-elec utility companies whose dams typically don't wear out in ten years; companies with assets that APPRECIATE in reality but they D&A them anyway).
Probably none works for cyclicals, especially extreme boom-bust cyclicals such as oil, aluminum & shipping etc.
Beware unnaturally low (dividend_payout+buyback)/net_income ratio as some majority shareholders may funnel money to themselves/cronies at the expense of small shareholders.
Disclaimer: Use at your own discretion. No guarantees for any accuracy or usefulness. If you decide to use it, I take no responsibility whatsoever for any consequences. Does not constitute financial advice. Past performance is not Indicative of future results.
VWMA Fibonacci Bands (VFIBs)This is a momentum indicator , utilizing Volume Weighted Moving Averages (VWMAs), Average True Range (ATR), and Fibonacci Levels.
This indicator can be used in most, if not all, financial markets. I have personally found it to be most useful in mid or large cap stocks, index funds, and cryptocurrencies in the top 25 by market cap. I have not tested this indicator in Forex markets, but I imagine that it would function well there, too.
The idea behind proper use of this indicator centers around mean reversion. If price is low compared to previous price action, mean reversion implies that it is likely to revert back to the mean, over time. If price is high, it implies that it will move lower. Generally, the different period VWMAs (center lines) will act as support when in an uptrend and resistance when in a downtrend. Additionally, it is rare for price to go above the upper bounds or lower bounds of the Fibonacci Bollinger Bands . Price action doing so may indicate a potential short or long position, respectively.
This indicator is intended to be used in tandem with the oscillator 'VFIBs Agreement', to be published shortly.
As we can see in the chart, the 50 week VWMA has been acting as resistance and recently dipped down to the bottom range of the band, only to bounce back. Holding above the 50 VWMA might indicate a bullish reversal, treating it as support moving forward.

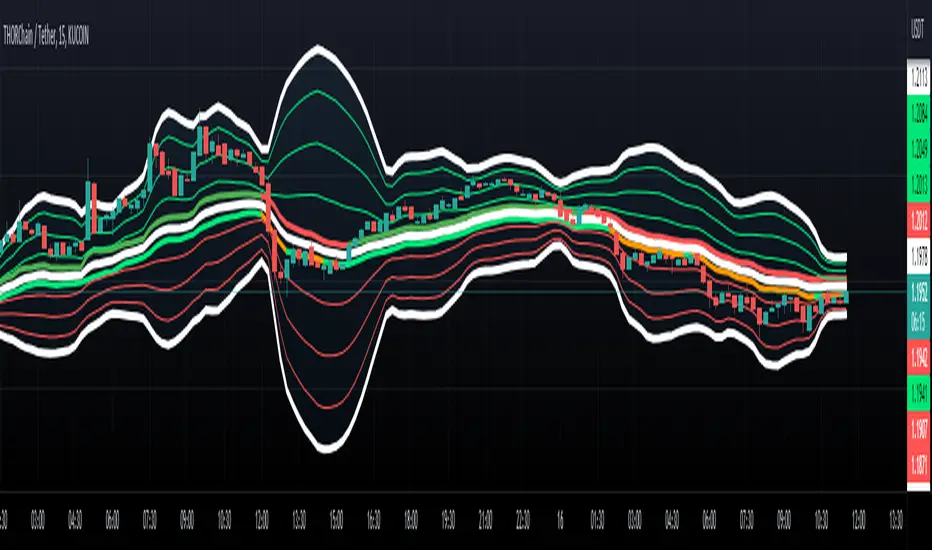
Fibonacci Bollinger Band ClusterThis indicator creates moving averages based on Fibonacci numbers (3-233, divided by 10 to average) sourced by high, low, and ohlc4 and plots lines based on these three. The Fib MA High line is either green or red (Fib High < Close), the Fib MA Low line is either lime or orange (Fib Low < Close), and the Fib MA OHLC4 line is constantly white. A cluster or series of Bollinger Bands is then created using the Fib MA OHLC4 line as the basis. Fibonacci-based deviations (1, 2, 3, 5, 8) are then used to create three upper and three lower Bollinger lines.
Bollinger Bands %B using HMAThe built-in Bollinger Band %b script modified to use the Hull Moving Average as the basis.
Hull Moving Averages have much less lag than a regular moving average.
Do not assume that regular BB interpretation rules apply to this.
This is an experimental indicator at this time.

Bollinger Bands with HMAThe built-in Bollinger Band script modified to use the Hull Moving Average as the basis.
Hull Moving Averages have much less lag than a regular moving average.
Do not assume that regular BB interpretation rules apply to this.
This is an experimental indicator at this time.
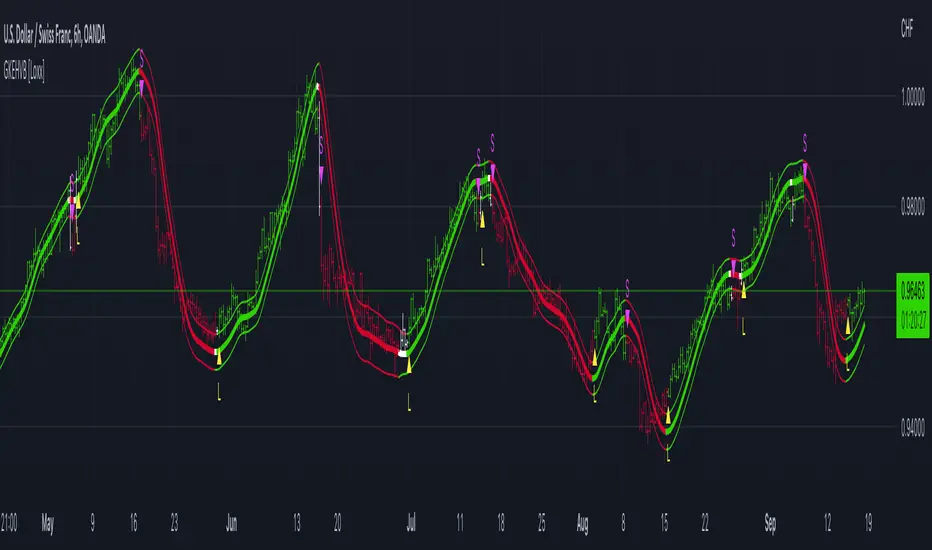
Garman-Klass-Yang-Zhang Historical Volatility Bands [Loxx]Garman-Klass-Yang-Zhang Historical Volatility Bands are constructed using:
Average as the middle line.
Upper and lower bands using the Garman-Klass-Yang-Zhang Historical Volatility Bands for bands calculation.
What is Garman-Klass-Yang-Zhang Historical Volatility?
Yang and Zhang derived an extension to the Garman Klass historical volatility estimator that allows for opening jumps. It assumes Brownian motion with zero drift. This is currently the preferred version of open-high-low-close volatility estimator for zero drift and has an efficiency of 8 times the classic close-to-close estimator. Note that when the drift is nonzero, but instead relative large to the volatility, this estimator will tend to overestimate the volatility. The Garman-Klass-Yang-Zhang Historical Volatility calculation is as follows:
GKYZHV = sqrt((Z/n) * sum((log(open(k)/close(k-1)))^2 + (0.5*(log(high(k)/low(k)))^2) - (2*log(2) - 1)*(log(close(k)/open(2:end)))^2))
The color of the middle line, unlike the bands colors, has 3 colors. When colors of the bands are the same, then the middle line has the same color, otherwise it's white.
Included
Alerts
Signals
Loxx's Expanded Source Types
Bar coloring
Related Indicators
Garman & Klass Estimator Historical Volatility Bands

Garman & Klass Estimator Historical Volatility Bands [Loxx]Garman & Klass Estimator Historical Volatility Bands are constructed using:
Average as the middle line.
Upper and lower bands using the Garman & Klass Estimator Historical Volatility (instead of "regular" Historical Volatility ) for bands calculation.
What is Garman & Klaus Historical Volatility?
Garman Klass is a volatility estimator that incorporates open, low, high, and close prices of a security. The Garman and Klass estimator for estimating historical volatility assumes Brownian motion with zero drift and no opening jumps (i.e. the opening = close of the previous period). This estimator is 7.4 times more efficient than the close-to-close estimator. Garman-Klass volatility extends Parkinson's volatility by taking into account the opening and closing price. As markets are most active during the opening and closing of a trading session, it makes volatility estimation more accurate. Garman and Klass also assumed that the process of price change is a process of continuous diffusion (geometric Brownian motion). However, this assumption has several drawbacks. The method is not robust for opening jumps in price and trend movements. Despite its drawbacks, the Garman-Klass estimator is still more effective than the basic formula since it takes into account not only the price at the beginning and end of the time interval but also intraday price extremums.
The Garman & Klass Estimator is as follows:
GKE = sqrt((Z/n)* sum((0.5*(log(high./low)).^2) - (2*log(2) - 1).*(log(close./open)).^2))
The color of the middle line, unlike the bands colors, has 3 colors. When colors of the bands are the same, then the middle line has the same color, otherwise it's white.
Included
Alerts
Signals
Loxx's Expanded Source Types
Bar coloring
Related indicators:
Parkinson's Historical Volatility Bands
High/Low Historical Volatility Bands [Loxx]High/Low Historical Volatility Bands are constructed using:
Average as the middle line.
Upper and lower bands using the Historical Volatility high/low (instead of "regular" Historical Volatility) for bands calculation.
What is Historical Volatility?
Historical Volatility (HV) is a statistical measure of the dispersion of returns for a given security or market index over a given period of time. Generally, this measure is calculated by determining the average deviation from the average price of a financial instrument in the given time period. Using standard deviation is the most common, but not the only, way to calculate Historical Volatility .
The higher the Historical Volatility value, the riskier the security. However, that is not necessarily a bad result as risk works both ways - bullish and bearish , i.e: Historical Volatility is not a directional indicator and should not be used as other directional indicators are used. Use to to determine the rising and falling price change volatility .
SH is stock's High price in t day.
SL is stock's Low price in t day.
High/Low Return (xt^HL) is calculated as the natural logarithm of the ratio of a stock's High price to stock's Low price.
Return:
And Parkinson's number: 1 / (4 * math.log(2)) * 252 / n * Σ (n, t =1) {math.log(Ht/Lt)^2}
An important use of the Parkinson's number is the assessment of the distribution prices during the day as well as a better understanding of the market dynamics. Comparing the Parkinson's number and periodically sampled volatility helps traders understand the tendency towards mean reversion in the market as well as the distribution of stop-losses.
The color of the middle line, unlike the bands colors, has 3 colors. When colors of the bands are the same, then the middle line has the same color, otherwise it's white.
Included
Alerts
Signals
Loxx's Expanded Source Types
Bar coloring
Related indicators:
Parkinson's Historical Volatility Bands
Historical Volatility Bands

MTF EMA Ribbon & Bands + BBMulti Timeframe Exponential Moving Average Ribbon & Bands + Boillinger Bands
I used the script "EMA Ribbon - low clutter, configurable " by adam24x, I made some color change and I added a few indicators (Boillinger Bands, EMA on multi timeframe and EMA bands from "34 EMA Bands " by VishvaP).
The script can display various EMA from the chart's timeframe but also EMA from other timeframes.
Bollinger Bands and EMA bands can also be added to the chart.

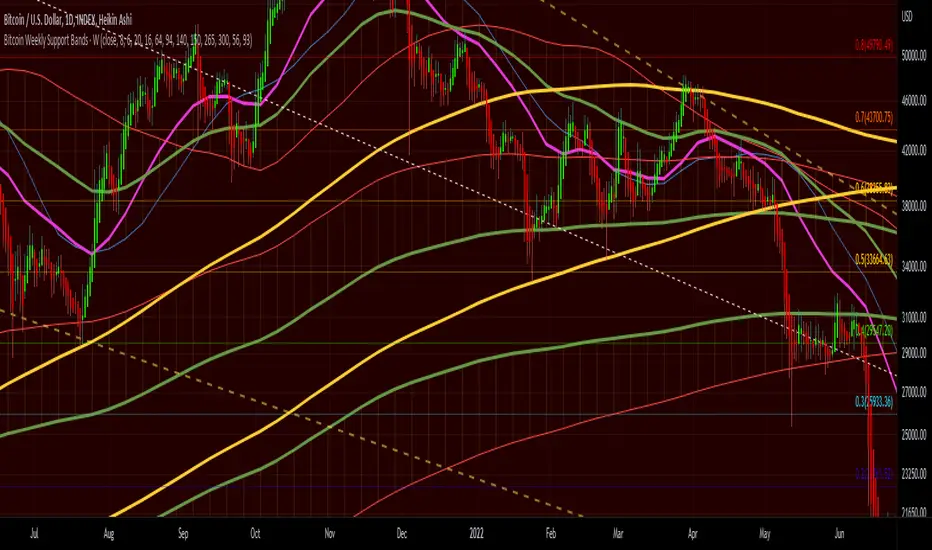
Bitcoin Weekly Support BandsMy first ever attempt at a custom script. I took Benjamin Cowen's concept of the Bitcoin Bull Market Support Band and applied it to the 100 week and 200 week moving averages. I also added in the 300 week sma. I mainly wanted to have all these in one indicator.
double Bollinger BandsThe Double Bollinger Band consists of an average and two Bollingers and two backgrounds, each of which has separate settings and can be approved more strongly for trades. Moves and vice versa. With the price chart coming out of the second band, the price is much more likely to move in the same direction.
To use this feature, we had to use two Bollinger indicators with different settings at the same time, but we no longer need to do this with the Double Bollinger.
Its main use is crypto, but it can be used in all markets

Steven Primo's bollinger bands strategyHi, this strategy is taken from a video made by Steven Primo. You can look it up on YouTube if you want to know about it.
It is a mean-reversion strategy based on the Bollinger Bands, in which we wait for 5 consecutive closes above the upper band, and for a short-term top. Once it happens, we place an entry order on this top, with a stop at the nearest bottom before the movement started, and use the difference from the stop and entry point to determine the target. For shorting, it's the same process, but for the downside. From my testing, only long orders were profitable, but you can configure whichever you want.
It works well for directional markets with a low level of noise, as you can see with the BTCUSD chart. One of its caveats is the short number of occurrences, and the long stop loss and target. You can enable a trailing stop, but from my testings, it just made the results worse.
I made some modifications, like removing the MA requirement, since the entry point was above it almost all the time, and I forced the BB to use a log version of the prices, so that discrepancies are eliminated. You'll also notice that you can't select an extension that is lower than 100, and that is intentional, since you're not supposed to enter a trade in which you can lose more than what you can earn.
I chose not to implement any kind of risk management, but I might do that in the future. You can leave your suggestions in the comments.

Y/Q/M/W aVWAP BandsYearly, Quarterly, Monthly or Weekly VWAP with Standard Deviation Envelope
Previous Y/Q/M/W VWAP and Band are extended forward automatically*
VWAP standard deviation envelope serves as a kind of Value Area, with the boundaries of the envelope acting as support and resistance. Previous envelops often show confluence with price action once price retests them.
Helpful to form a bias on the available time frames, find areas of support and resistance, and determine acceptance/rejection from breakouts or consolidations.
* this is a unique feature of this script

Mobo BandsThis indicator is the Mobo Bands (Momentum Breakout Bands). These bands are bollinger bands that have an adjusted standard deviation. There are Buy signals when it has momentum breakouts above the bands for moves to the upside and Sell signals when it has momentum breakouts below the bands for moves to the downside. The bands simply suggest that all markets have periods of chop which we all know to be true. While the price is inside the bands it is said to be trendless. Once the breakouts happen you can take trades in the breakout direction. I like to use these to swing trade options on the hourly timeframe but the bands should work on most instruments and timeframes. I like to use it to take swings on SPY on the 1 hour chart for entries and use the Daily chart for trend confirmation.
5 SMA Set + Bollinger Bands follow this especially 5 day average5 SMA Set + Bollinger Bands follow this especially 5 day average is important
//@version=5
indicator("5'li SMA Seti + Bollinger Bands", overlay=true, max_lines_count=10)
// === ORİJİNAL 5'Lİ SMA SETİ (HİÇ DOKUNMADIM) ===
len1 = 1
len5 = 5
sma1_low = ta.sma(low, len1)
sma1_high = ta.sma(high, len1)
sma5_low = ta.sma(low, len5)
sma5_high = ta.sma(high, len5)
sma5_close = ta.sma(close, len5)
plot(sma1_low, title="1 Periyot Düşük SMA", color=#8B0000, linewidth=4, style=plot.style_circles)
plot(sma1_high, title="1 Periyot Yüksek SMA", color=#006400, linewidth=4, style=plot.style_circles)
plot(sma5_low, title="5 Periyot Düşük SMA", color=#FF4040, linewidth=2, style=plot.style_line)
plot(sma5_high, title="5 Periyot Yüksek SMA", color=#90EE90, linewidth=2, style=plot.style_line)
plot(sma5_close, title="5 Periyot Kapanış SMA", color=#DA70D6, linewidth=3, style=plot.style_line)
// === KLASİK BOLLINGER BANDS (20-2) - ORİJİNAL HALİYLE ===
length_bb = 20
mult = 2.0
basis = ta.sma(close, length_bb)
dev = mult * ta.stdev(close, length_bb)
upper = basis + dev
lower = basis - dev
plot(basis, title="BB Orta (SMA 20)", color=#787B86, linewidth=2)
p1 = plot(upper, title="BB Üst Bant", color=#2962FF, linewidth=1)
p2 = plot(lower, title="BB Alt Bant", color=#2962FF, linewidth=1)
fill(p1, p2, color=color.new(#2962FF, 94), title="BB Arka Plan")

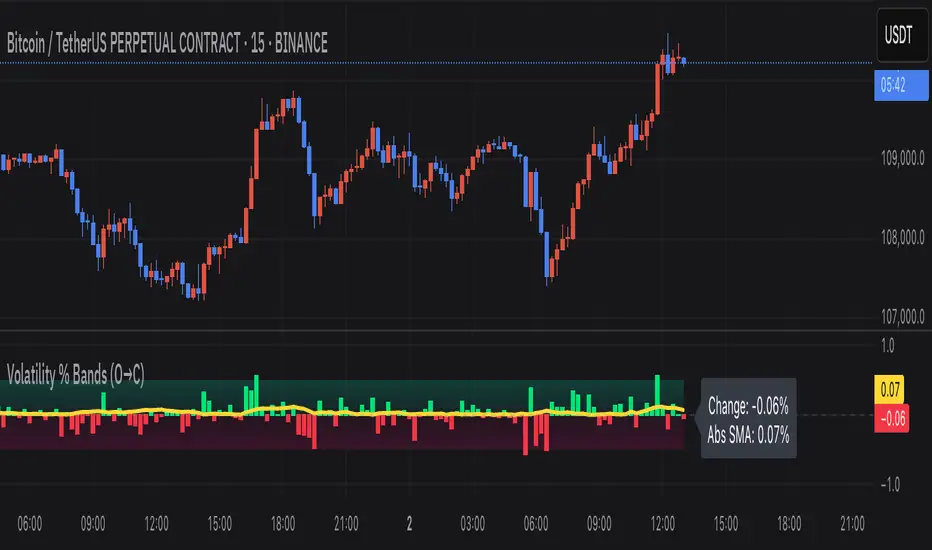
Volatility % Bands (O→C)Volatility % Bands (O→C) is an indicator designed to visualize the percentage change from Open to Close of each candle, providing a clear view of short-term momentum and volatility.
**Histogram**: Displays bar-by-bar % change (Close vs Open). Green bars indicate positive changes, while red bars indicate negative ones, making momentum shifts easy to identify.
**Moving Average Line**: Plots the Simple Moving Average (SMA) of the absolute % change, helping traders track the average volatility over a chosen period.
**Background Bands**: Based on the user-defined Level Step, ±1 to ±5 zones are highlighted as shaded bands, allowing quick recognition of whether volatility is low, moderate, or extreme.
**Label**: Shows the latest candle’s % change and the current SMA value as a floating label on the right, making it convenient for real-time monitoring.
This tool can be useful for volatility breakout strategies, day trading, and short-term momentum analysis.
Multi-Length Quad Bollinger BandsHere is a Pine Script code for TradingView that plots four separate Bollinger Bands on your chart. The lengths are preset to 14, 50, 100, and 200, but every aspect—including lengths, standard deviations, colors, and the source price—is fully customizable through the script's settings menu.
The 14 and 50-period bands are enabled by default, while the 100 and 200-period bands are disabled to keep the chart clean initially. You can easily toggle any of them on or off.

Adaptive Fibonacci Volatility Bands (AFVB)
**Adaptive Fibonacci Volatility Bands (AFVB)**
### **Overview**
The **Adaptive Fibonacci Volatility Bands (AFVB)** indicator enhances standard **Fibonacci retracement levels** by dynamically adjusting them based on market **volatility**. By incorporating **ATR (Average True Range) adjustments**, this indicator refines key **support and resistance zones**, helping traders identify **more reliable entry and exit points**.
**Key Features:**
- **ATR-based adaptive Fibonacci levels** that adjust to changing market volatility.
- **Buy and Sell signals** based on price interactions with dynamic support/resistance.
- **Toggleable confirmation filter** for refining trade signals.
- **Customizable color schemes** and alerts.
---
## **How This Indicator Works**
The **AFVB** operates in three main steps:
### **1️⃣ Detecting Key Fibonacci Levels**
The script calculates **swing highs and swing lows** using a user-defined lookback period. From this, it derives **Fibonacci retracement levels**:
- **0% (High)**
- **23.6%**
- **38.2%**
- **50% (Mid-Level)**
- **61.8%**
- **78.6%**
- **100% (Low)**
### **2️⃣ Adjusting for Market Volatility**
Instead of using **fixed retracement levels**, this indicator incorporates an **ATR-based adjustment**:
- **Resistance levels** shift **upward** based on ATR.
- **Support levels** shift **downward** based on ATR.
- This makes levels more **responsive** to price action.
### **3️⃣ Generating Buy & Sell Signals**
AFVB provides **two types of signals** based on price interactions with key levels:
✔ **Buy Signal**:
Occurs when price **dips below** a support level (78.6% or 100%) and **then closes back above it**.
- **Optionally**, a confirmation buffer can be enabled to require price to close **above an additional threshold** (based on ATR).
✔ **Sell Signal**:
Triggered when price **breaks above a resistance level** (0% or 23.6%) and **then closes below it**.
📌 **Important:**
- The **buy threshold setting** allows traders to **fine-tune** entry conditions.
- Turning this setting **off** generates **more frequent** buy signals.
- Keeping it **on** reduces false signals but may result in **fewer trade opportunities**.
---
## **How to Use This Indicator in Trading**
### 🔹 **Entry Strategy (Buying)**
1️⃣ Look for **buy signals** at the **78.6% or 100% Fibonacci levels**.
2️⃣ Ensure price **closes above** the support level before entering a long trade.
3️⃣ **Enable or disable** the buy threshold filter depending on desired trade strictness.
### 🔹 **Exit Strategy (Selling)**
1️⃣ Watch for **sell signals** at the **0% or 23.6% Fibonacci levels**.
2️⃣ If price **breaks above resistance and then closes below**, consider exiting long positions.
3️⃣ Can be used **alone** or **combined with trend confirmation tools** (e.g., moving averages, RSI).
### 🔹 **Using the Toggleable Buy Threshold**
- **ON**: Buy signal requires **extra confirmation** (reduces false signals but fewer trades).
- **OFF**: Buy triggers as soon as price **closes back above support** (more signals, but may include weaker setups).
---
## **User Inputs**
### **🔧 Customization Options**
- **ATR Length**: Defines the period for **ATR calculation**.
- **Swing Lookback**: Determines how far back to find **swing highs and lows**.
- **ATR Multiplier**: Adjusts the size of **volatility-based modifications**.
- **Buy/Sell Threshold Factor**: Fine-tunes the **entry signal strictness**.
- **Show Level Labels**: Enables/disables **Fibonacci level annotations**.
- **Color Settings**: Customize **support/resistance colors**.
### **📢 Alerts**
AFVB includes built-in **alert conditions** for:
- **Buy Signals** ("AFVB BUY SIGNAL - Possible reversal at support")
- **Sell Signals** ("AFVB SELL SIGNAL - Possible reversal at resistance")
- **Any Signal Triggered** (Useful for automated alerts)
---
## **Who Is This Indicator For?**
✅ **Scalpers & Day Traders** – Helps identify **short-term reversals**.
✅ **Swing Traders** – Useful for **buying dips** and **selling rallies**.
✅ **Trend Traders** – Can be combined with **momentum indicators** for confirmation.
**Best Timeframes:**
⏳ **15-minute, 1-hour, 4-hour, Daily charts** (works across multiple assets).
---
## **Limitations & Considerations**
🚨 **Important Notes**:
- **No indicator guarantees profits**. Always **combine** it with **risk management strategies**.
- Works best **in trending & mean-reverting markets**—may generate false signals in **choppy conditions**.
- Performance may vary across **different assets & timeframes**.
📢 **Backtesting is recommended** before using it for live trading.

Bollinger Bands + EMA 200 + EMA 50This indicator combines three technical analysis tools: the Bollinger Bands (BB), and two Exponential Moving Averages (EMA) with periods of 200 and 50.
Bollinger Bands (BB): This indicator consists of three lines—the middle line being a simple moving average (SMA), and the upper and lower bands representing two standard deviations above and below the SMA. The width of the bands indicates market volatility, with wider bands signifying higher volatility and narrower bands indicating lower volatility.
Exponential Moving Averages (EMA 200 and EMA 50): The EMA is a type of moving average that gives more weight to recent prices, making it more responsive to price changes than the simple moving average. The EMA 200 is considered a long-term trend indicator, often used to identify the overall direction of the market. The EMA 50 is a medium-term trend indicator, helping to spot more immediate market trends. Crossovers between these two EMAs (such as when EMA 50 crosses above EMA 200) are commonly used as buy or sell signals, with the idea that a short-term trend shift is occurring.
By combining these three indicators, this custom Pine Script aims to give a comprehensive view of the market conditions, helping traders to understand both the volatility (via BB), the long-term market trend (via EMA 200), and the medium-term trend (via EMA 50). The interaction between the price and these indicators, along with crossovers, can be used to identify potential entry and exit points.

PFCF Price BandPFCF Price Band shows price calculated using the previous period's high and low P/TTM FCFPS (TTM's price to free cash flow per share over the last 12 months) multiplied by TTM's current FCFPS ( Similar to price theory = P/E x expected earnings per share)
If the current P/FCFPS is lower than the minimum P/FCFPS, it is considered cheap. In other words, above the maximum P/FCFPS is considered expensive.
PFCF Price Band consists of 2 parts.
- Firstly, the historical P/FCFPS value in "Green" (if TTM FCFPS is positive) or "Red" (if TTM FCFPS is negative) status changes based on the latest high or low price of TTM FCFPS.
- Second, the blue line is the closing price divided by TTM FCFPS, which shows the current P/FCF.
P.S. It is recommended to use it together with the PE Band indicator because just net profit does not mean that a company has good cash flow.

SMA Custom Volume BandsThe "SMA Custom Volume Bands" indicator is a custom technical analysis tool designed for use on the TradingView platform. This indicator allows users to analyze and visualize key aspects of a stock's volume within the context of its 200-period Simple Moving Average (SMA). It features the following components:
Volume Bars: The indicator displays the volume of a selected financial instrument using colored bars. Green bars represent days when the trading volume is higher than the previous day, while red bars represent days when the trading volume is lower.
200 SMA of Volume: A blue line on the chart represents the 200-period Simple Moving Average of the trading volume, providing insight into the longer-term volume trend.
Customizable Percentage Line: Users have the flexibility to set a custom percentage value above or below the 200 SMA of trading volume. This line is plotted as a blue line on the chart, allowing traders to identify when volume meets their preferred percentage threshold.
The "SMA Custom Volume Bands" indicator is a simple tool for traders, aiding in the assessment of volume trends and potential price reversals in the context of moving averages. It offers customization options, enhancing its adaptability to individual trading strategies and preferences.

Logarithmic Bollinger Bands [MisterMoTA]The script plot the normal top and bottom Bollinger Bands and from them and SMA 20 it finds fibonacci logarithmic levels where price can find temporary support/resistance.
To get the best results need to change the standard deviation to your simbol value, like current for BTC the Standards Deviation is 2.61, current Standard Deviation for ETH is 2.55.. etc.. find the right current standard deviation of your simbol with a search online.
The lines ploted by indicators are:
Main line is a 20 SMA
2 retracement Logarithmic Fibonacci 0.382 levels above and bellow 20 sma
2 retracement Logarithmic Fibonacci 0.618 levels above and bellow 20 sma
Top and Bottom Bollindger bands (ticker than the rest of the lines)
2 expansion Logarithmic Fibonacci 0.382 levels above Top BB and bellow Bottom BB
2 expansion Logarithmic Fibonacci 0.618 levels above Top BB and bellow Bottom BB
2 expansion Logarithmic Fibonacci level 1 above Top BB and bellow Bottom BB
2 expansion Logarithmic Fibonacci 1.618 levels above Top BB and bellow Bottom BB
Let me know If you find the indicator useful or PM if you need any custom changes to it.
