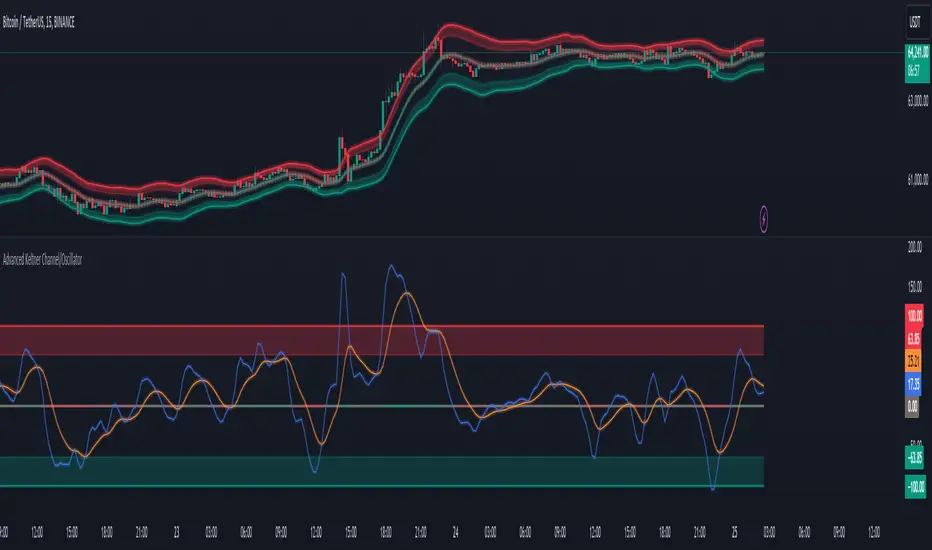
Advanced Keltner Channel/Oscillator [MyTradingCoder]This indicator combines a traditional Keltner Channel overlay with an oscillator, providing a comprehensive view of price action, trend, and momentum. The core of this indicator is its advanced ATR calculation, which uses statistical methods to provide a more robust measure of volatility.
Starting with the overlay component, the center line is created using a biquad low-pass filter applied to the chosen price source. This provides a smoother representation of price than a simple moving average. The upper and lower channel lines are then calculated using the statistically derived ATR, with an additional set of mid-lines between the center and outer lines. This creates a more nuanced view of price action within the channel.
The color coding of the center line provides an immediate visual cue of the current price momentum. As the price moves up relative to the ATR, the line shifts towards the bullish color, and vice versa for downward moves. This color gradient allows for quick assessment of the current market sentiment.
The oscillator component transforms the channel into a different perspective. It takes the price's position within the channel and maps it to either a normalized -100 to +100 scale or displays it in price units, depending on your settings. This oscillator essentially shows where the current price is in relation to the channel boundaries.
The oscillator includes two key lines: the main oscillator line and a signal line. The main line represents the current position within the channel, smoothed by an exponential moving average (EMA). The signal line is a further smoothed version of the oscillator line. The interaction between these two lines can provide trading signals, similar to how MACD is often used.
When the oscillator line crosses above the signal line, it might indicate bullish momentum, especially if this occurs in the lower half of the oscillator range. Conversely, the oscillator line crossing below the signal line could signal bearish momentum, particularly if it happens in the upper half of the range.
The oscillator's position relative to its own range is also informative. Values near the top of the range (close to 100 if normalized) suggest that price is near the upper Keltner Channel band, indicating potential overbought conditions. Values near the bottom of the range (close to -100 if normalized) suggest proximity to the lower band, potentially indicating oversold conditions.
One of the strengths of this indicator is how the overlay and oscillator work together. For example, if the price is touching the upper band on the overlay, you'd see the oscillator at or near its maximum value. This confluence of signals can provide stronger evidence of overbought conditions. Similarly, the oscillator hitting extremes can draw your attention to price action at the channel boundaries on the overlay.
The mid-lines on both the overlay and oscillator provide additional nuance. On the overlay, price action between the mid-line and outer line might suggest strong but not extreme momentum. On the oscillator, this would correspond to readings in the outer quartiles of the range.
The customizable visual settings allow you to adjust the indicator to your preferences. The glow effects and color coding can make it easier to quickly interpret the current market conditions at a glance.
Overlay Component:
The overlay displays Keltner Channel bands dynamically adapting to market conditions, providing clear visual cues for potential trend reversals, breakouts, and overbought/oversold zones.
The center line is a biquad low-pass filter applied to the chosen price source.
Upper and lower channel lines are calculated using a statistically derived ATR.
Includes mid-lines between the center and outer channel lines.
Color-coded based on price movement relative to the ATR.
Oscillator Component:
The oscillator component complements the overlay, highlighting momentum and potential turning points.
Normalized values make it easy to compare across different assets and timeframes.
Signal line crossovers generate potential buy/sell signals.
Advanced ATR Calculation:
Uses a unique method to compute ATR, incorporating concepts like root mean square (RMS) and z-score clamping.
Provides both an average and mode-based ATR value.
Customizable Visual Settings:
Adjustable colors for bullish and bearish moves, oscillator lines, and channel components.
Options for line width, transparency, and glow effects.
Ability to display overlay, oscillator, or both simultaneously.
Flexible Parameters:
Customizable inputs for channel width multiplier, ATR period, smoothing factors, and oscillator settings.
Adjustable Q factor for the biquad filter.
Key Advantages:
Advanced ATR Calculation: Utilizes a statistical method to generate ATR, ensuring greater responsiveness and accuracy in volatile markets.
Overlay and Oscillator: Provides a comprehensive view of price action, combining trend and momentum analysis.
Customizable: Adjust settings to fine-tune the indicator to your specific needs and trading style.
Visually Appealing: Clear and concise design for easy interpretation.
The ATR (Average True Range) in this indicator is derived using a sophisticated statistical method that differs from the traditional ATR calculation. It begins by calculating the True Range (TR) as the difference between the high and low of each bar. Instead of a simple moving average, it computes the Root Mean Square (RMS) of the TR over the specified period, giving more weight to larger price movements. The indicator then calculates a Z-score by dividing the TR by the RMS, which standardizes the TR relative to recent volatility. This Z-score is clamped to a maximum value (10 in this case) to prevent extreme outliers from skewing the results, and then rounded to a specified number of decimal places (2 in this script).
These rounded Z-scores are collected in an array, keeping track of how many times each value occurs. From this array, two key values are derived: the mode, which is the most frequently occurring Z-score, and the average, which is the weighted average of all Z-scores. These values are then scaled back to price units by multiplying by the RMS.
Now, let's examine how these values are used in the indicator. For the Keltner Channel lines, the mid lines (top and bottom) use the mode of the ATR, representing the most common volatility state. The max lines (top and bottom) use the average of the ATR, incorporating all volatility states, including less common but larger moves. By using the mode for the mid lines and the average for the max lines, the indicator provides a nuanced view of volatility. The mid lines represent the "typical" market state, while the max lines account for less frequent but significant price movements.
For the color coding of the center line, the mode of the ATR is used to normalize the price movement. The script calculates the difference between the current price and the price 'degree' bars ago (default is 2), and then divides this difference by the mode of the ATR. The resulting value is passed through an arctangent function and scaled to a 0-1 range. This scaled value is used to create a color gradient between the bearish and bullish colors.
Using the mode of the ATR for this color coding ensures that the color changes are based on the most typical volatility state of the market. This means that the color will change more quickly in low volatility environments and more slowly in high volatility environments, providing a consistent visual representation of price momentum relative to current market conditions.
Using a good IIR (Infinite Impulse Response) low-pass filter, such as the biquad filter implemented in this indicator, offers significant advantages over simpler moving averages like the EMA (Exponential Moving Average) or other basic moving averages.
At its core, an EMA is indeed a simple, single-pole IIR filter, but it has limitations in terms of its frequency response and phase delay characteristics. The biquad filter, on the other hand, is a two-pole, two-zero filter that provides superior control over the frequency response curve. This allows for a much sharper cutoff between the passband and stopband, meaning it can more effectively separate the signal (in this case, the underlying price trend) from the noise (short-term price fluctuations).
The improved frequency response of a well-designed biquad filter means it can achieve a better balance between smoothness and responsiveness. While an EMA might need a longer period to sufficiently smooth out price noise, potentially leading to more lag, a biquad filter can achieve similar or better smoothing with less lag. This is crucial in financial markets where timely information is vital for making trading decisions.
Moreover, the biquad filter allows for independent control of the cutoff frequency and the Q factor. The Q factor, in particular, is a powerful parameter that affects the filter's resonance at the cutoff frequency. By adjusting the Q factor, users can fine-tune the filter's behavior to suit different market conditions or trading styles. This level of control is simply not available with basic moving averages.
Another advantage of the biquad filter is its superior phase response. In the context of financial data, this translates to more consistent lag across different frequency components of the price action. This can lead to more reliable signals, especially when it comes to identifying trend changes or price reversals.
The computational efficiency of biquad filters is also worth noting. Despite their more complex mathematical foundation, biquad filters can be implemented very efficiently, often requiring only a few operations per sample. This makes them suitable for real-time applications and high-frequency trading scenarios.
Furthermore, the use of a more sophisticated filter like the biquad can help in reducing false signals. The improved noise rejection capabilities mean that minor price fluctuations are less likely to cause unnecessary crossovers or indicator movements, potentially leading to fewer false breakouts or reversal signals.
In the specific context of a Keltner Channel, using a biquad filter for the center line can provide a more stable and reliable basis for the entire indicator. It can help in better defining the overall trend, which is crucial since the Keltner Channel is often used for trend-following strategies. The smoother, yet more responsive center line can lead to more accurate channel boundaries, potentially improving the reliability of overbought/oversold signals and breakout indications.
In conclusion, this advanced Keltner Channel indicator represents a significant evolution in technical analysis tools, combining the power of traditional Keltner Channels with modern statistical methods and signal processing techniques. By integrating a sophisticated ATR calculation, a biquad low-pass filter, and a complementary oscillator component, this indicator offers traders a comprehensive and nuanced view of market dynamics.
The indicator's strength lies in its ability to adapt to varying market conditions, providing clear visual cues for trend identification, momentum assessment, and potential reversal points. The use of statistically derived ATR values for channel construction and the implementation of a biquad filter for the center line result in a more responsive and accurate representation of price action compared to traditional methods.
Furthermore, the dual nature of this indicator – functioning as both an overlay and an oscillator – allows traders to simultaneously analyze price trends and momentum from different perspectives. This multifaceted approach can lead to more informed decision-making and potentially more reliable trading signals.
The high degree of customization available in the indicator's settings enables traders to fine-tune its performance to suit their specific trading styles and market preferences. From adjustable visual elements to flexible parameter inputs, users can optimize the indicator for various trading scenarios and time frames.
Ultimately, while no indicator can predict market movements with certainty, this advanced Keltner Channel provides traders with a powerful tool for market analysis. By offering a more sophisticated approach to measuring volatility, trend, and momentum, it equips traders with valuable insights to navigate the complex world of financial markets. As with any trading tool, it should be used in conjunction with other forms of analysis and within a well-defined risk management framework to maximize its potential benefits.
스크립트에서 "averages"에 대해 찾기
Uptrick: FVG Market Zones**Uptrick: FVG Market Zones**
---
### Introduction
**Uptrick: FVG Market Zones** is a cutting-edge technical analysis tool designed to identify and visualize Fair Value Gaps (FVGs) within financial markets. This indicator focuses on pinpointing critical price levels where significant gaps occur, which can act as potential support and resistance zones. By integrating advanced volatility analysis and user-configurable parameters, the **Uptrick: FVG Market Zones** provides traders with a robust framework for understanding market dynamics and making informed trading decisions.
### Purpose and Functionality
The primary purpose of the **Uptrick: FVG Market Zones** indicator is to detect and highlight Fair Value Gaps, which are areas on a price chart where there is a significant price movement without any trading activity in between. These gaps can provide critical insights into market behavior, as they often indicate areas where the market has not fully accounted for the supply and demand dynamics. Traders use these zones to anticipate potential reversals, breakouts, or consolidations, making this tool highly valuable for both short-term and long-term trading strategies.
### Unique Features and Originality
The **Uptrick: FVG Market Zones** indicator is distinguished by its focus on FVGs and its ability to integrate this concept into a broader market analysis framework. Unlike other indicators that may offer generalized support and resistance levels, this tool specifically identifies and visualizes gaps based on volatility-adjusted criteria. This precision allows traders to focus on the most relevant market zones, improving their ability to anticipate market movements.
One of the standout features of this indicator is its user-configurable settings, which provide a high degree of customization. This flexibility ensures that traders can tailor the indicator to suit their specific trading style and the particular market they are analyzing. Additionally, the indicator's visualization capabilities are enhanced with customizable colors and gap-filling options, making it easier for traders to interpret and act on the information presented.
### Inputs and Configurations
**Uptrick: FVG Market Zones** comes with several user inputs that allow traders to customize the indicator's behavior and appearance. Each input plays a crucial role in determining how the indicator identifies and visualizes FVGs on the chart. Here’s a detailed breakdown of each input:
1. **FVG Analysis Period (fvgPeriod):**
- **Description:** This input determines the period over which the indicator analyzes the chart for identifying FVGs. By adjusting this value, traders can control how far back in time the indicator looks to detect significant gaps.
- **Default Value:** 25
- **Purpose:** A shorter period may focus on more recent market activity, making the indicator more sensitive to recent price movements. In contrast, a longer period allows the indicator to identify gaps that have remained unfilled for an extended time, potentially acting as stronger support or resistance levels.
2. **Analysis Mode (mode):**
- **Description:** The Analysis Mode input allows traders to choose between different methods of analyzing the chart for FVGs.
- **Options:** "Recent Gaps" and "Extended View"
- **Default Option:** "Recent Gaps"
- **Purpose:**
- **Recent Gaps:** Focuses on the latest significant gaps, providing traders with up-to-date information on the most relevant market zones.
- **Extended View:** Considers a broader range of gap patterns, which can be useful in markets where historical gaps may still influence current price action.
3. **Volatility Sensitivity (volatilityFactor):**
- **Description:** This input adjusts the sensitivity of the indicator to market volatility. It is used in calculating the threshold for identifying FVGs.
- **Default Value:** 0.3
- **Step Size:** 0.1
- **Purpose:** A higher sensitivity will cause the indicator to detect smaller gaps, which might be more frequent but less significant. Lower sensitivity focuses on larger, more impactful gaps, which are less frequent but potentially more powerful in predicting market behavior.
4. **Highlight Market Gaps (showGaps):**
- **Description:** A boolean input that determines whether the identified FVGs should be highlighted on the chart.
- **Default Value:** True
- **Purpose:** This input allows traders to toggle the visualization of FVGs. When enabled, the indicator highlights gaps using colored boxes, making them visually prominent on the chart.
5. **Bullish Highlight Color (bullColor):**
- **Description:** Sets the color used to highlight bullish FVGs (gaps that may indicate support).
- **Default Value:** #00FF7F (a shade of green)
- **Purpose:** The color choice is crucial for quickly distinguishing bullish zones from bearish ones. Green is typically associated with upward price movement, making it intuitive for traders to identify potential support areas.
6. **Bearish Highlight Color (bearColor):**
- **Description:** Sets the color used to highlight bearish FVGs (gaps that may indicate resistance).
- **Default Value:** #FF4500 (a shade of red)
- **Purpose:** Red is commonly associated with downward price movement, making it easy for traders to identify potential resistance areas. This color coding helps in quickly assessing the chart.
7. **Fill Gap Areas (fillGaps):**
- **Description:** A boolean input that determines whether the FVGs should be filled with a color on the chart.
- **Default Value:** True
- **Purpose:** Filling the gap areas provides a more solid visual cue for traders. It enhances the visibility of the gaps, making it easier to spot these zones during fast-paced trading sessions.
8. **Hidden Color (hidden):**
- **Description:** A color input that is used when certain elements should be hidden from the chart.
- **Default Value:** color.rgb(0,0,0,100) (a semi-transparent black)
- **Purpose:** This input is useful for controlling the visibility of certain plots or elements on the chart, ensuring that the indicator remains clean and uncluttered.
### Market Gap Detection
The core functionality of the **Uptrick: FVG Market Zones** indicator lies in its ability to detect Fair Value Gaps. These gaps occur when the price makes a significant jump from one level to another without any trading activity in between. The indicator uses a combination of price action analysis and volatility thresholds to identify these gaps.
- **Volatility Measurement:** The indicator begins by measuring market volatility using the Average True Range (ATR). This volatility measurement is then adjusted by the user-defined sensitivity factor, which determines the threshold for identifying significant gaps.
- **Gap Identification:** The indicator checks for instances where the current low is higher than the high two bars ago (bullish gap) or where the current high is lower than the low two bars ago (bearish gap). These conditions signify a potential FVG.
- **Gap Storage and Management:** Once a gap is identified, it is stored in an array. The indicator also manages the size of these arrays based on the selected analysis mode, ensuring that only the most relevant gaps are considered in the analysis.
### Visualization
Visualization is a key component of the **Uptrick: FVG Market Zones** indicator. By providing clear and customizable visual cues, the indicator ensures that traders can quickly and easily interpret the information it provides.
- **Gap Highlighting:** When enabled, the indicator highlights the identified FVGs on the chart using colored boxes. Bullish gaps are highlighted in green, while bearish gaps are highlighted in red. This color coding helps traders instantly recognize potential support and resistance zones.
- **Gap Filling:** The indicator can also fill the identified gaps with a semi-transparent color. This option enhances the visibility of the gaps, making them more prominent on the chart. Filled gaps are particularly useful for traders who want to keep track of these zones over multiple trading sessions.
- **Gap Averages:** The indicator calculates the average level of the identified gaps and plots these averages as lines on the chart. These lines represent the general area of support or resistance based on the detected gaps, providing traders with a reference point for setting their stop losses or profit targets.
- **Text Labels:** The indicator also labels each FVG with the text "FVG" inside the highlighted area. This feature ensures that traders can easily identify these zones even in charts with dense price action.
### Practical Applications
The **Uptrick: FVG Market Zones** indicator is versatile and can be applied to a wide range of trading strategies across different markets and timeframes. Here are a few examples of how this indicator can be used in practice:
1. **Support and Resistance Trading:**
- Traders can use the identified FVGs as dynamic support and resistance levels. By placing their trades based on these levels, they can take advantage of potential reversals or continuations at key market zones.
2. **Gap Filling Strategy:**
- Some traders focus on the concept of gap filling, where the market eventually returns to "fill" the gap created by rapid price movements. The **Uptrick: FVG Market Zones** indicator can
help identify such gaps and anticipate when the market might return to these levels.
3. **Breakout Trading:**
- The indicator can be used to identify breakouts from significant gaps. When the price moves beyond the identified FVGs, it may signal a strong trend continuation, providing an opportunity for breakout traders.
4. **Reversal Trading:**
- By monitoring the signals generated by the indicator, traders can identify potential market reversals. A sell signal after a prolonged uptrend or a buy signal after a downtrend may indicate a reversal, allowing traders to position themselves accordingly.
5. **Risk Management:**
- The average levels of the FVGs can be used to set stop-loss and take-profit levels. By aligning these levels with the FVG zones, traders can improve their risk management practices and enhance their trading discipline.
### Customization and Flexibility
One of the standout features of the **Uptrick: FVG Market Zones** indicator is its high level of customization. Traders can adjust various parameters to tailor the indicator to their specific needs and preferences.
- **Customizable Colors:** The indicator allows traders to choose their preferred colors for highlighting bullish and bearish gaps. This flexibility ensures that the indicator can be integrated seamlessly into any trading setup, regardless of the trader's color scheme preferences.
- **Adjustable Periods and Sensitivity:** By allowing traders to adjust the analysis period and volatility sensitivity, the indicator can be fine-tuned to suit different market conditions. For example, a trader might use a shorter analysis period and higher sensitivity in a volatile market, while opting for a longer period and lower sensitivity in a more stable market.
- **Toggling Visual Elements:** Traders can choose to enable or disable various visual elements of the indicator, such as gap highlighting, gap filling, and text labels. This level of control allows traders to declutter their charts and focus on the information that is most relevant to their trading strategy.
### Advantages and Benefits
The **Uptrick: FVG Market Zones** indicator offers several key advantages that make it a valuable tool for traders:
1. **Precision:** By focusing on Fair Value Gaps, the indicator provides highly precise levels of support and resistance, which are often more reliable than traditional horizontal levels.
2. **Clarity:** The clear visual representation of FVGs, along with the text labels and color coding, ensures that traders can quickly interpret the indicator's signals and incorporate them into their trading decisions.
3. **Adaptability:** The indicator's customizable settings allow it to be adapted to different markets, timeframes, and trading styles. Whether you are a day trader, swing trader, or long-term investor, this indicator can be tailored to meet your needs.
4. **Enhanced Decision-Making:** The trading signals generated by the indicator provide actionable insights that can help traders make more informed decisions. By aligning their trades with the identified FVG zones, traders can improve their chances of success.
5. **Risk Management:** The use of FVG zones as reference points for stop-loss and take-profit levels enhances risk management practices, helping traders protect their capital while maximizing their profit potential.
### Conclusion
The **Uptrick: FVG Market Zones** indicator is a powerful and versatile tool for traders seeking to enhance their market analysis and improve their trading outcomes. By focusing on Fair Value Gaps and providing a high level of customization, this indicator offers a unique blend of precision, clarity, and adaptability. Whether you are looking to identify key market zones, generate trading signals, or improve your risk management practices, the **Uptrick: FVG Market Zones** indicator is a valuable addition to any trader's toolkit.
With its innovative approach to market analysis and user-friendly design, **Uptrick: FVG Market Zones** stands out as an essential tool for traders who want to stay ahead of the market and make more informed trading decisions. Whether you are trading stocks, forex, commodities, or cryptocurrencies, this indicator provides the insights you need to navigate the markets with confidence and success.

Artaking 2Components of the Indicator:
Moving Averages:
Short-Term Moving Average (MA): This is a 50-period Simple Moving Average (SMA) applied to the closing price. It is used to track the short-term trend of the market.
Long-Term Moving Average (MA): This is a 200-period SMA used to track the long-term trend.
Day Trading Moving Average: A 20-period SMA is used specifically for day trading signals, focusing on shorter-term price movements.
Purpose:
The crossing of these moving averages (short-term crossing above or below long-term) provides basic buy and sell signals, indicative of potential trend reversals or continuations.
ADX (Average Directional Index) for Trend Strength:
ADX Calculation: The ADX is calculated using a 14-period length with 14-period smoothing. The ADX value indicates the strength of a trend, regardless of direction.
Strong Trend Condition: The indicator considers a trend to be strong if the ADX value is above 25. This threshold helps filter out trades during weak or sideways markets.
Purpose:
To ensure that the strategy only generates signals when there is a strong trend, thus avoiding whipsaws in low volatility or range-bound conditions.
Support Levels:
Support Level Calculation: The indicator calculates the lowest close over the last 100 periods. This level is used to identify significant support zones where the price might find a floor.
Purpose:
Support levels are critical in identifying potential areas where the price might bounce, making them ideal for setting stop losses or identifying buy opportunities.
Volatility Spike (Proxy for News Trading):
ATR (Average True Range) Calculation: The indicator uses a 14-period ATR to measure market volatility. A volatility spike is identified when the ATR is greater than 1.5 times the 14-period SMA of the ATR.
Purpose:
This serves as a proxy for news events or other sudden market movements that could make the market unpredictable. The indicator avoids generating signals during these periods to reduce the risk of being caught in a volatile, potentially news-driven move.
Fibonacci Retracement Levels:
61.8% Fibonacci Level: Calculated from the highest high and lowest low over the long MA period, this retracement level is widely regarded as a significant support or resistance level.
Purpose:
Position traders often use Fibonacci levels to identify potential reversal points. The indicator incorporates the 61.8% level to fine-tune entries and exits.
Candlestick Patterns for Price Action Trading:
Bullish Engulfing Pattern: A bullish reversal pattern where a green candle fully engulfs the previous red candle.
Bearish Engulfing Pattern: A bearish reversal pattern where a red candle fully engulfs the previous green candle.
Purpose:
These patterns are classic signals used in price action trading to identify potential reversals at key levels, especially when they align with other conditions like support/resistance or Fibonacci levels.
Signal Generation:
The indicator generates buy and sell signals by combining the above elements:
Buy Signal:
A buy signal is triggered when:
The short-term MA crosses above the long-term MA (indicating a potential uptrend).
The trend is strong (ADX > 25).
The current price is near or below the 61.8% Fibonacci retracement level, suggesting a potential reversal.
No significant volatility spike is detected, ensuring the market isn’t reacting unpredictably to news.
Sell Signal:
A sell signal is triggered when:
The short-term MA crosses below the long-term MA (indicating a potential downtrend).
The trend is strong (ADX > 25).
The current price is near or above the 61.8% Fibonacci retracement level, suggesting potential resistance.
No significant volatility spike is detected.
Day Trading Signals:
Independent of the main trend signals, the indicator also generates intraday buy and sell signals when the price crosses above or below the 20-period day trading MA.
Price Action Signals:
The indicator can trigger buy or sell signals based purely on price action, such as the occurrence of bullish or bearish engulfing patterns. This is optional and can be enabled or disabled.
Alerts:
The indicator includes built-in alert conditions that notify the trader when a buy or sell signal is generated. This allows traders to act immediately without having to constantly monitor the charts.
Practical Application:
This indicator is versatile and can be used across various trading styles:
Position Trading: The long-term MA, Fibonacci retracement, and ADX provide a solid foundation for identifying long-term trends and potential entry/exit points.
Day Trading: The short-term MA and day trading MA offer quick signals for intraday trading.
Price Action: Candlestick pattern recognition allows for precise entry points based on market sentiment and behavior.
News Trading: The volatility spike filter helps avoid trading during periods of market instability, often driven by news events.
Conclusion:
The Comprehensive Trading Strategy Indicator is a robust tool designed to help traders navigate various market conditions by integrating multiple strategies into a single, coherent framework. It provides clear, actionable signals while filtering out potentially dangerous trades during volatile or weak market conditions. Whether you're a long-term trader, a day trader, or someone who relies on price action, this indicator can be a valuable addition to your trading toolkit.

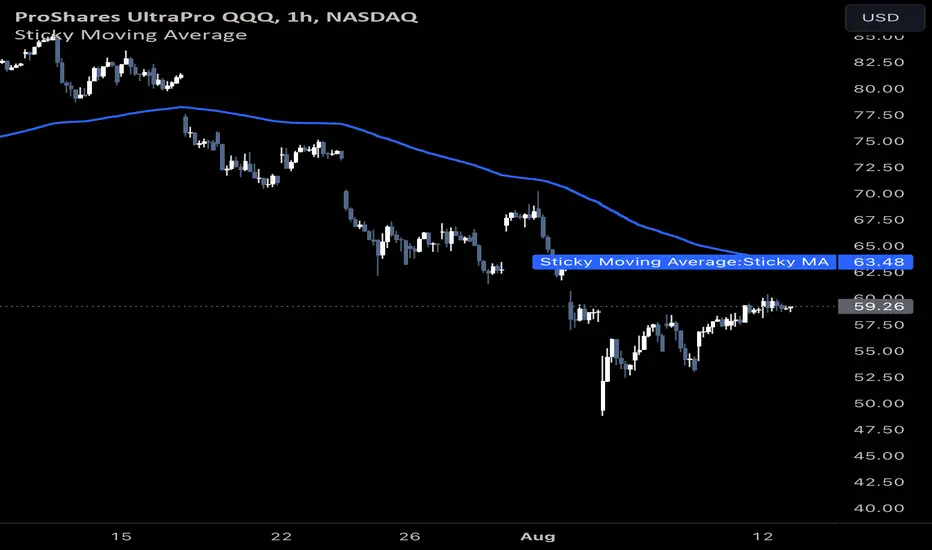
Sticky Moving AverageThe Sticky Moving Average is a custom indicator designed to provide a unique smoothing effect by combining different moving averages derived from a single base period. This indicator creates a single line on the chart, representing the average of the following three moving averages:
1. X-period Simple Moving Average (SMA): A traditional moving average that smooths the price data over the full period.
2. X/2-period Simple Moving Average (SMA): A faster-moving average that smooths the price data over half of the base period.
3. X/4-period Exponential Moving Average (EMA): An exponential moving average that gives more weight to recent prices, calculated over one-fourth of the base period.
The result is a moving average that "sticks" to price action by considering both short-term and long-term trends, offering a balanced view of market momentum.
This indicator is ideal for traders looking to gain a nuanced understanding of price movements by incorporating multiple smoothing periods into a single, easy-to-use line. Adjust the `X` value to suit your trading strategy and enjoy the clarity this composite moving average can bring to your charts.
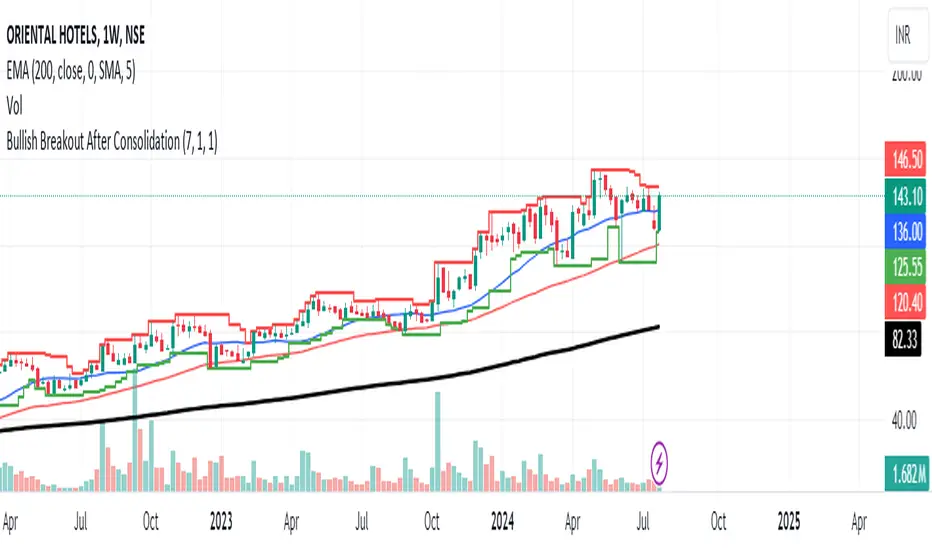
Bullish Breakout After ConsolidationDescription:
The Bullish Breakout After Consolidation Indicator is designed to help traders identify potential bullish breakout opportunities following a period of tight price consolidation. This indicator combines price action and volume analysis to signal when a stock may experience a significant upward movement.
Features:
Consolidation Range Tightness: The indicator identifies periods where the stock price consolidates within a narrow range, defined as a range less than 2% of the lowest low during the consolidation period. This tight consolidation is often a precursor to strong price movements.
Breakout Detection: Once the price breaks above the highest high of the consolidation range, and this breakout occurs after a specified number of days post-consolidation, the indicator marks it as a potential breakout opportunity.
Volume Confirmation: To avoid false breakouts, the indicator requires increased trading volume during the breakout. This ensures that the breakout is supported by substantial market activity.
Visual Cues:
Breakout Label: A "Breakout" label appears above the bar where a valid breakout occurs, making it easy to spot potential entry points.
Support and Resistance Lines: Horizontal lines plot the highest high (resistance) and lowest low (support) during the consolidation period, helping traders visualize the breakout levels.
Moving Averages: Optional 20-day and 50-day simple moving averages are plotted for additional trend confirmation.
How to Use:
Apply the Indicator: Add the indicator to your chart in TradingView to start analyzing potential breakouts.
Observe Consolidation: Look for tight consolidation periods where the price trades within a narrow range.
Identify Breakouts: Watch for breakouts where the price moves above the highest high of the consolidation range, supported by increased volume.
Confirm with Labels: The "Breakout" label will help you quickly identify valid breakout signals.
Parameters:
Consolidation Length: Number of days to consider for consolidation.
Range Percentage: Maximum percentage range for consolidation tightness.
Days After Consolidation: Number of days post-consolidation to check for the breakout.
Note: As with any trading tool, it is important to use this indicator as part of a broader trading strategy and in conjunction with other forms of analysis.
Disclaimer: This indicator is provided for educational purposes and should not be construed as financial advice. Trading involves risk and may not be suitable for all investors.
Volume Insignts AnalyzerDescription:
The Volume Insight Analyzer is an advanced Pine Script designed for traders who want a comprehensive view of volume dynamics on their charts. This script combines multiple volume-based indicators to help identify key trading opportunities, including significant volume days, volume dry-ups, and pocket pivots.
Key Features:
VDU (Volume Dry-Up) Detection: Automatically identifies and marks days when the volume is significantly below its moving average, helping to spot potential breakout or breakdown points. Customizable volume thresholds allow for tailored analysis based on your trading strategy. The Volume Dry-Up label appears when the volume is substantially below its average level and the price is near a key moving average. This condition indicates a period of equilibrium between supply and demand, suggesting a potential low-risk entry point for traders.
Pocket Pivot Analysis using 5 and 10 Length Pocket Pivots: Highlights days with exceptionally high volume compared to recent history, indicating potential pocket pivots. Visual markers on the chart and volume bars color-coded for 5 and 10-day lengths. Pocket pivot points are identified when the volume on a given day exceeds the maximum volume observed over the past several days. Specifically, a 5-day pocket pivot point is marked when today's volume surpasses the highest selling volume of the last 5 days. A cluster of 5-day pocket pivot points within a base is a strong indicator of stock strength. Similarly, a 10-day pocket pivot point following a Volume Dry-Up (VDU) suggests a potential entry opportunity. Moreover, a pre-existing cluster of 5-day pocket pivot points before a 10-day pocket pivot point provides greater conviction in the trade.
Volume Moving Averages: Set different lengths for primary and secondary moving averages to track volume trends over daily, weekly, and monthly timeframes. Options to display moving average lines on the volume chart.
Volume Visualization:
a. Major and Minor Volume Bars: Option to display bars that are either above or below average volume levels. Adjustable settings to show or hide these bars based on user preference.
b. Volume Bar Coloring: Volume bars are color-coded based on significant volume thresholds, including green for bullish signals, red for bearish signals, and orange for volume dry-ups.
Volume Metrics Table: A customizable table that displays real-time volume metrics including Relative Volume (RVOL), Turnover, and the number of high volume days. The table can be oriented horizontally or vertically and styled according to your theme preferences.
Visual Indicators:
a) Volume Dry-Up (VDU) Labels: Clearly marked VDU events with textual annotations on the chart.
b) Bullish and Bearish Arrows: Arrows indicating potential bullish or bearish closes based on volume analysis, enhancing decision-making.
Customization Options:
a) Dark and Light Theme Support: Toggle between dark and light themes to match your chart settings.
b) Adjustable Parameters: Easily configure input settings such as volume thresholds, MA lengths, and table display options to fit your trading style.
How to Use:
Set Parameters: Adjust the script settings such as volume thresholds, moving average lengths, and display preferences according to your analysis needs.
Analyze Volume Patterns: Use the indicators and visual markers provided by the script to identify significant volume patterns and potential trading signals.
Monitor Metrics: Refer to the volume metrics table for a quick overview of key volume-related statistics and trends.
Make Informed Decisions: Utilize the visual cues and volume data provided by the script to enhance your trading strategy and make more informed decisions.
Disclaimer:
This script is for informational purposes only and should not be considered as trading advice. Use it in conjunction with other analysis tools and consult with a financial advisor if needed. Trading involves risk, and past performance does not guarantee future results.

Market Sentiment Technicals [LuxAlgo]The Market Sentiment Technicals indicator synthesizes insights from diverse technical analysis techniques, including price action market structures, trend indicators, volatility indicators, momentum oscillators, and more.
The indicator consolidates the evaluated outputs from these techniques into a singular value and presents the combined data through an oscillator format, technical rating, and a histogram panel featuring the sentiment of each component alongside the overall sentiment.
🔶 USAGE
The Market Sentiment Technicals indicator is a tool able to swiftly and easily gauge market sentiment by consolidating the individual sentiment from multiple technical analysis techniques applied to market data into a single value, allowing users to asses if the market is uptrending, consolidating, or downtrending.
The tool includes various components and presentation formats, each described in the sub-sections below.
🔹Indicators Sentiment Panel
The indicators sentiment panel provides normalized sentiment scores for each supported indicator, along with a synthesized representation derived from the average of all individual normalized sentiments.
🔹Market Sentiment Meter
The market sentiment meter is obtained from the synthesized representation derived from the average of all individual normalized sentiments. It allows users to quickly and easily gauge the overall market sentiment.
🔹Market Sentiment Oscillator
The market sentiment oscillator provides a visual means to monitor the current and historical strength of the market. It assists in identifying the trend direction, trend momentum, and overbought and oversold conditions, aiding in the anticipation of potential trend reversals.
Divergence occurs when there is a difference between what the price action is indicating and what the market sentiment oscillator is indicating, helping traders assess changes in the price trend.
🔶 DETAILS
The indicator employs a range of technical analysis techniques to interpret market data. Each group of indicators provides valuable insights into different aspects of market behavior.
🔹Momentum Indicators
Momentum indicators assess the speed and change of price movements, often indicating whether a trend is strengthening or weakening.
Relative Strength Index (RSI): Measures the magnitude of recent price changes to evaluate overbought or oversold conditions.
Stochastic %K: Compares the closing price to the range over a specified period to identify potential reversal points.
Stochastic RSI Fast: Combines features of Stochastic oscillators and RSI to gauge both momentum and overbought/oversold levels efficiently.
Commodity Channel Index (CCI): Measures the deviation of an asset's price from its statistical average to determine trend strength and overbought and oversold conditions.
Bull Bear Power: Evaluates the strength of buying and selling pressure in the market.
🔹Trend Indicators
Trend indicators help traders identify the direction of a market trend.
Moving Averages: Provides a smoothed representation of the underlying price data, aiding in trend identification and analysis.
Bollinger Bands: Consists of a middle band (typically a simple moving average) and upper and lower bands, which represent volatility levels of the market.
Supertrend: A trailing stop able to identify the current direction of the trend.
Linear Regression: Fits a straight line to past data points to predict future price movements and identify trend direction.
🔹Market Structures
Market Structures: Analyzes the overall pattern of price movements, including Break of Structure (BOS), Market Structure Shifts (MSS), also referred to as Change of Character (CHoCH), aiding in identifying potential market turning and continuation points.
🔹The Normalization Technique
The normalization technique employed for trend indicators relies on buy-sell signals. The script tracks price movements and normalizes them based on these signals.
normalize(buy, sell, smooth)=>
var os = 0
var float max = na
var float min = na
os := buy ? 1 : sell ? -1 : os
max := os > os ? close : os < os ? max : math.max(close, max)
min := os < os ? close : os > os ? min : math.min(close, min)
ta.sma((close - min)/(max - min), smooth) * 100
In this Pine Script snippet:
The variable os tracks market sentiment, taking a value of 1 for buy signals and -1 for sell signals, indicating bullish and bearish sentiments, respectively.
max and min are used to identify extremes in sentiment and are updated based on changes in os . When market sentiment shifts from buying to selling (or vice versa), max and min adjust accordingly.
Normalization is achieved by comparing current price levels to historical extremes in sentiment. The result is smoothed by default using a 3-period simple moving average. Users have the option to customize the smoothing period via the script settings input menu.
🔶 SETTINGS
🔹Generic Settings
Timeframe: This option selects the timeframe for calculating sentiment. If a timeframe lower than the chart's is chosen, calculations will be based on the chart's timeframe.
Horizontal Offset: Determines the distance at which the visual components of the indicator will be displayed from the primary chart.
Gradient Colors: Allows customization of gradient colors.
🔹Indicators Sentiment Panel
Indicators Sentiment Panel: Toggle the visibility of the indicators sentiment panel.
Panel Height: Determines the height of the panel.
🔹Market Sentiment Meter
Market Sentiment Meter: Toggle the visibility of the market sentiment meter (technical ratings in the shape of a speedometer).
🔹Market Sentiment Oscillator
Market Sentiment Oscillator: Toggle the visibility of the market sentiment oscillator.
Show Divergence: Enables detection of divergences based on the selected option.
Oscillator Line Width: Customization option for the line width.
Oscillator Height: Determines the height of the oscillator.
🔹Settings for Individual Components
In general,
Source: Determines the data source for calculations.
Length: The period to be used in calculations.
Smoothing: Degree of smoothness of the evaluated values.
🔹Normalization Settings - Trend Indicators
Smoothing: The period used in smoothing normalized values, where normalization is applied to moving averages, Bollinger Bands, Supertrend, VWAP bands, and market structures.
🔶 LIMITATIONS
Like any technical analysis tool, the Market Sentiment Technicals indicator has limitations. It's based on historical data and patterns, which may not always accurately predict future market movements. Additionally, market sentiment can be influenced by various factors, including economic news, geopolitical events, and market psychology, which may not be fully captured by technical analysis alone.

Adaptive Moving Average (AMA)The Adaptive Moving Average (AMA), also known as Kaufman's Adaptive Moving Average (KAMA), is a trend-following indicator that adapts to market volatility. It was developed by Perry Kaufman in 1972 to improve upon traditional moving averages by making the smoothing period dynamic based on market conditions.
The AMA aims to:
- Smooth out price data to reduce noise, similar to other moving averages.
- Adapt its smoothing based on market volatility and trend strength.
Here's how the Adaptive Moving Average (AMA) works:
1. Calculate the Efficiency Ratio (ER): The AMA begins by calculating the Efficiency Ratio (ER), which measures the efficiency of a price trend. It's calculated as the absolute change in closing prices over a period (`PeriodEfficiencyRatio`) divided by the sum of absolute changes in closing prices over the same period. The ER value ranges from 0 to 1, with higher values indicating a stronger trend.
2. Determine the Smoothing Constant (sc): Using the ER, the AMA calculates the smoothing constant (sc). This constant ranges between a predefined slow EMA (exponential moving average) and fast EMA, depending on the ER.
3. Compute the AMA value: The AMA is then calculated using the smoothing constant (sc) and the previous AMA value, as well as the current close price. This allows the AMA to adapt its smoothing based on the market's volatility.
4. Plot the AMA: The AMA is plotted on the chart, usually as a line, which follows the price action more closely in periods of strong trends and provides more smoothing in periods of lower volatility.
Usage and Interpretation:
- The Adaptive Moving Average can be used to identify trends and potential entry and exit points.
- When the price is above the AMA line, it may indicate an uptrend, and when the price is below the AMA line, it may indicate a downtrend.
- Crossovers of the price with the AMA line can signal potential buy or sell opportunities.
- The adaptability of the AMA makes it more responsive in trending markets and smoother in range-bound markets, providing an advantage over traditional moving averages.
Parameters:
- Period for EfficiencyRatio calculation (`PeriodEfficiencyRatio`):** The period over which the Efficiency Ratio is calculated.
- Fast EMA Length (`fastLength`) and Slow EMA Length (`slowLength`):** These parameters define the range for the smoothing constant. A shorter fast length makes the AMA more responsive, while a longer slow length makes it smoother.
The AMA can be a useful tool in a trader's toolkit for analyzing market trends and making informed trading decisions. Adjusting the parameters can fine-tune the AMA for different trading styles and market conditions.

Custom Swing Index [AstroHub]Custom Swing Index - Unleashing Precision in Trend Analysis
🌟 Overview:
The Custom Swing Index is a meticulously crafted tool that empowers traders with advanced insights into market dynamics, specifically focusing on identifying potential trend reversals. Developed by AstroHub, this indicator stands out for its unique combination of price-related calculations, ratios, and averages, providing a comprehensive and nuanced view of market sentiment.
📈 Key Components:
Price Calculation:
- Price Change: Captures the difference between the current and previous closing prices.
- High and Low Points: Analyzes the high and low points of each bar for crucial price movement data.
Ratios and Averages:
- Upper-Lower Shadow Ratio: Measures the relationship between the upper and lower shadows.
- Open-Close Ratio: Evaluates the ratio of opening to closing prices.
- Sum Price Changes: Sums up price changes over a specified period.
Differences and Shadows:
- Open-Close Difference: Considers the difference between opening and closing prices.
- Upper and Lower Shadow Ratios: Examines the proportions of upper and lower shadows.
Bar Size Metrics:
- Average Bar Size: Determines the average size of each bar.
- High-Low Difference: Measures the difference between the high and low points.
Swing Indicator Calculation:
- The Custom Swing Index is the result of combining these components, creating a dynamic metric that reflects potential trend reversals.
🚥 How to Use:
Understanding the Indicator:
- Bullish signals may be indicated when the swing index surpasses a defined threshold.
- Bearish signals may be indicated when the swing index falls below the negative threshold.
Visual Interpretation:
- Color-coded bars enhance visual interpretation, turning green for bullish conditions and red for bearish conditions.
Entry Points:
- Look for entry points where circle markings are present, indicating potential opportunities.
Alerts:
- Integrated alerts keep traders informed of significant swings, ensuring timely decision-making.

Trend Signals with TP & SL [UAlgo]The "Trend Signals with TP & SL " indicator is a versatile tool designed to assist traders in identifying potential trend continuation opportunities within financial markets Utilizing a combination of technical indicators and user-defined parameters, this indicator aims to provide clear and actionable signals to aid traders in making informed trading decisions.
🔶 Features:
Trend Continuation Signals : The indicator generates signals to identify potential trend continuation points based on the input parameters such as sensitivity, ATR length, and cloud moving average length.
Take-Profit and Stop-Loss Levels: It calculates and plots three levels of take-profit (1R, 2R, 3R) and stop-loss levels based on the entry price of the trade.
Short Position Example:
Long Position Example:
Visualization: The script visualizes the trend signals, entry points, take-profit levels, and stop-loss levels on the price chart, making it easier for traders to interpret the signals.
Alert System: The indicator includes an alert system that notifies the user when there is a change in trend direction or when a buy/sell signal is generated. The alerts provide essential information such as entry price, take-profit levels, and stop-loss levels.
🔶 Calculations :
Trend Calculation: Trend signals are determined based on the comparison between the current closing price and the upper and lower bounds calculated using the Average True Range (ATR) multiplied by a sensitivity factor. A trend is considered bullish if the closing price is above the upper bound and bearish if it's below the lower bound.
Entry, Stop Loss, and Take Profit Calculation: Entry points for long and short positions are identified when there's a change in trend direction.
Stop-loss levels are calculated as a percentage of the entry price, where users can define the percentage based on their risk tolerance.
Take-profit levels are calculated as multiples of the stop-loss level (1R, 2R, 3R).
Cloud Moving Averages: Simple moving averages (SMAs) are calculated for high and low prices over a specified period to create a "cloud" visualization on the chart.
MACD Clouds: Moving Average Convergence Divergence (MACD) indicator is used to determine the market's momentum and trend direction. Positive and negative clouds are plotted based on the MACD line and its signal line, indicating potential bullish or bearish trends.
Signal Generation: Buy and sell signals are generated based on specific conditions such as RSI, CMO (Chande Momentum Oscillator), and pivot points.
Signals are triggered when certain criteria are met, indicating potential opportunities for entering or exiting trades.
🔶 Disclaimer:
Use at Your Own Risk: Trading involves significant risk, and this script is provided for educational and informational purposes only. It does not guarantee profitable trades, and users should exercise caution and perform their own analysis before making trading decisions.
Parameter Sensitivity: The effectiveness of the indicator may vary depending on the chosen parameters, market conditions, and timeframe. Users are encouraged to backtest the script thoroughly and adjust the parameters according to their trading preferences.
Not Financial Advice: The information provided by this script should not be considered as financial advice. Users are solely responsible for their trading decisions and should consult with a qualified financial advisor if needed.
Backtesting and Validation: Before implementing this indicator in live trading, users are strongly encouraged to conduct rigorous backtesting and validation to assess its performance under various market conditions. Past performance is not indicative of future results, and users should carefully evaluate the effectiveness of the indicator based on their individual trading preferences and risk tolerance.

Supertrended RSI [AlgoAlpha]🚀📈 Introducing the Supertrended RSI Indicator by AlgoAlpha!
Designed to empower your trading decisions, this innovative Pine Script™ creation marries the precision of the Relative Strength Index (RSI) with the dynamic prowess of the SuperTrend methodology. Whether you’re charting the course of cryptos, riding the waves of stock markets, or navigating the futures landscape, our SuperTrended RSI Indicator is your go-to tool for uncovering unique trend insights and crafting trading strategies. 🌟
Key Features:
🔍 Enhanced RSI Analysis: Combines the traditional RSI with a supertrend calculation for a dynamic look at market trends.
🔄 Multiple Moving Averages: Offers a selection of moving averages including SMA, HMA, EMA, and more for tailored analysis.
🎨 Customizable Visuals: Choose your own color scheme for uptrends and downtrends to match your trading dashboard.
📊 Flexible Input Settings: Tailor the indicator with customizable lengths, factors, and smoothing options.
⚡ Real-Time Alerts: Set alerts for bullish and bearish reversals to stay ahead of market movements.
Quick Guide to Using the Supertrended RSI Indicator
Maximize your trading with the Supertrended RSI by following these streamlined steps! 🚀✨
🛠 Add the Indicator: Search for "Supertrended RSI " in TradingView's Indicators & Strategies. Customize settings like RSI length, MA type, and Supertrend factors to fit your trading style.
🎨 Visual Customization: Adjust uptrend and downtrend colors for clear trend visualization.
📊 Market Analysis: Watch for the Supertrend color change for trend reversals. Use the 70 and 30 lines to spot overbought/oversold conditions.
🔔 Alerts: Enable notifications for reversal conditions to capture trading opportunities without constant chart monitoring.
How It Works:
At the core of this indicator is the combination of the Relative Strength Index (RSI) and the Supertrend framework, it does so by applying the SuperTrend on the RSI. The RSI settings can be adjusted for length and smoothing, with the option to select the data source. The Supertrend calculation takes into account a specified trend factor and the Average True Range (ATR) over a given period to determine trend direction.
Visual elements include plotting the RSI, its moving average, and the Supertrend line, with customizable colors for clarity. Overbought and oversold conditions are highlighted, and trend changes are filled with distinct colors.
🔔 Alerts: Enable alerts for crossover and crossunder events to catch every trading opportunity.
🌈 Whether you're a seasoned trader or just starting, the Supertrended RSI offers a fresh perspective on market trends. 📈
💡 Tip: Experiment with different settings to find the perfect balance for your trading style!
🔗 Explore, customize, and enhance your trading experience with the Supertrended RSI Indicator! Happy trading! 🎉

MA+ ProjectionThe "MA+ Projection" indicator is designed to visualize the potential future direction of a moving average, taking into account the impact of historical data loss. It is primarily aimed at providing a practical perspective on how moving averages could evolve as older data points are no longer considered.
Key Features:
Supported Moving Averages: SMA, EMA, WMA, VWMA, and VAWMA (Volume Adjusted WMA).
Flexible Time Span Settings: Customize the moving average length in bars, minutes, or days.
Adjustable Projection Scope: Set a percentage of the measurement to project forward.
Projection 'Cone': Show/hide the deviation and control the multiple.
Use Last Source Value: An option to add the latest known value to the moving window instead of only letting the window shrink. (Enabled by default.)
How It Works:
Given the specified parameters, it takes the selected moving average type (a known formula like SMA, EMA, or WMA), and projects the future data points by continuing to move the data 'window' forward without adding any more data. By default, it extends the average by assuming the price hasn't changed after the last bar. Alternatively, the projection can be the result of shrinking the window as it moves forward without adding any new data points.
Note:
This tool is for visual projection, not prediction. Its purpose is to aid in the analysis of potential future trends based on historical data, not to provide definitive market forecasts.

Normalized Price VolumeThe Normalized Price Volume (NPV) indicator is a unique tool designed to offer insights into the relationship between price movements and trading volume. By normalizing these factors, NPV helps traders identify potential price trends and reversals with greater precision.
Key Features:
Normalization: NPV leverages the Average True Range (ATR) to normalize price changes, making them comparable across different assets and timeframes.
Price and Volume Ratios: The indicator calculates the ratio of normalized price changes and volume to provide valuable information about the dynamics between price and trading activity.
Sum of Changes: NPV also presents the sum of normalized price changes over a user-defined period, allowing you to gauge the overall trend strength.
Customizable Averages: Adjust the length of the moving averages used in the price and volume ratios to fine-tune the sensitivity of the indicator to your trading strategy.
NPV is a versatile tool that can be used for various trading and investment approaches. Whether you're a day trader, swing trader, or investor, NPV can help you make more informed decisions by shedding light on the interactions between price and volume in the market.
Disclaimer: This indicator is for educational and informational purposes only. It should be used in conjunction with other analysis techniques and not solely for making trading decisions.
SML SuiteIntroducing the "SML Suite" Indicator
The "SML Suite" is a powerful and easy-to-use trading indicator designed to help traders make informed decisions in the world of financial markets. Whether you're a seasoned trader or a novice, this indicator is your trusty sidekick for evaluating market trends.
Key Features:
Three Moving Averages: The indicator employs three different moving averages, each with a distinct length, allowing you to adapt to various market conditions.
Customizable Parameters: You can easily customize the moving average lengths and source data to tailor the indicator to your specific trading strategy.
Standard Deviation Multiplier: Adjust the standard deviation multiplier to fine-tune the indicator's sensitivity to market fluctuations.
Binary Results: The indicator provides clear binary signals (1 or -1) based on whether the current price is above or below certain bands. This simplifies your decision-making process.
SML Calculation: The SML (Short, Medium, Long) calculation is a smart combination of the binary results, offering you an overall sentiment about the market.
Color-Coded Visualization: Visualize market sentiment with color-coded bars, making it easy to spot trends at a glance.
Interactive Table: A table is displayed on your chart, giving you a quick overview of the binary results and the overall SML sentiment.
With the "SML Suite" indicator, you don't need to be a coding expert to harness the power of technical analysis. Stay ahead of the game and enhance your trading strategy with this user-friendly tool. Make your trading decisions with confidence and clarity, backed by the insights provided by the "SML Suite" indicator.

Volume and Price Z-Score [Multi-Asset] - By LeviathanThis script offers in-depth Z-Score analytics on price and volume for 200 symbols. Utilizing visualizations such as scatter plots, histograms, and heatmaps, it enables traders to uncover potential trade opportunities, discern market dynamics, pinpoint outliers, delve into the relationship between price and volume, and much more.
A Z-Score is a statistical measurement indicating the number of standard deviations a data point deviates from the dataset's mean. Essentially, it provides insight into a value's relative position within a group of values (mean).
- A Z-Score of zero means the data point is exactly at the mean.
- A positive Z-Score indicates the data point is above the mean.
- A negative Z-Score indicates the data point is below the mean.
For instance, a Z-Score of 1 indicates that the data point is 1 standard deviation above the mean, while a Z-Score of -1 indicates that the data point is 1 standard deviation below the mean. In simple terms, the more extreme the Z-Score of a data point, the more “unusual” it is within a larger context.
If data is normally distributed, the following properties can be observed:
- About 68% of the data will lie within ±1 standard deviation (z-score between -1 and 1).
- About 95% will lie within ±2 standard deviations (z-score between -2 and 2).
- About 99.7% will lie within ±3 standard deviations (z-score between -3 and 3).
Datasets like price and volume (in this context) are most often not normally distributed. While the interpretation in terms of percentage of data lying within certain ranges of z-scores (like the ones mentioned above) won't hold, the z-score can still be a useful measure of how "unusual" a data point is relative to the mean.
The aim of this indicator is to offer a unique way of screening the market for trading opportunities by conveniently visualizing where current volume and price activity stands in relation to the average. It also offers features to observe the convergent/divergent relationships between asset’s price movement and volume, observe a single symbol’s activity compared to the wider market activity and much more.
Here is an overview of a few important settings.
Z-SCORE TYPE
◽️ Z-Score Type: Current Z-Score
Calculates the z-score by comparing current bar’s price and volume data to the mean (moving average with any custom length, default is 20 bars). This indicates how much the current bar’s price and volume data deviates from the average over the specified period. A positive z-score suggests that the current bar's price or volume is above the mean of the last 20 bars (or the custom length set by the user), while a negative z-score means it's below that mean.
Example: Consider an asset whose current price and volume both show deviations from their 20-bar averages. If the price's Z-Score is +1.5 and the volume's Z-Score is +2.0, it means the asset's price is 1.5 standard deviations above its average, and its trading volume is 2 standard deviations above its average. This might suggest a significant upward move with strong trading activity.
◽️ Z-Score Type: Average Z-Score
Calculates the custom-length average of symbol's z-score. Think of it as a smoothed version of the Current Z-Score. Instead of just looking at the z-score calculated on the latest bar, it considers the average behavior over the last few bars. By doing this, it helps reduce sudden jumps and gives a clearer, steadier view of the market.
Example: Instead of a single bar, imagine the average price and volume of an asset over the last 5 bars. If the price's 5-bar average Z-Score is +1.0 and the volume's is +1.5, it tells us that, over these recent bars, both the price and volume have been consistently above their longer-term averages, indicating sustained increase.
◽️ Z-Score Type: Relative Z-Score
Calculates a relative z-score by comparing symbol’s current bar z-score to the mean (average z-score of all symbols in the group). This is essentially a z-score of a z-score, and it helps in understanding how a particular symbol's activity stands out not just in its own historical context, but also in relation to the broader set of symbols being analyzed. In other words, while the primary z-score tells you how unusual a bar's activity is for that specific symbol, the relative z-score informs you how that "unusualness" ranks when compared to the entire group's deviations. This can be particularly useful in identifying symbols that are outliers even among outliers, indicating exceptionally unique behaviors or opportunities.
Example: If one asset's price Z-Score is +2.5 and volume Z-Score is +3.0, but the group's average Z-Scores are +0.5 for price and +1.0 for volume, this asset’s Relative Z-Score would be high and therefore stand out. This means that asset's price and volume activities are notably high, not just by its own standards, but also when compared to other symbols in the group.
DISPLAY TYPE
◽️ Display Type: Scatter Plot
The Scatter Plot is a visual tool designed to represent values for two variables, in this case the Z-Scores of price and volume for multiple symbols. Each symbol has it's own dot with x and y coordinates:
X-Axis: Represents the Z-Score of price. A symbol further to the right indicates a higher positive deviation in its price from its average, while a symbol to the left indicates a negative deviation.
Y-Axis: Represents the Z-Score of volume. A symbol positioned higher up on the plot suggests a higher positive deviation in its trading volume from its average, while one lower down indicates a negative deviation.
Here are some guideline insights of plot positioning:
- Top-Right Quadrant (High Volume-High Price): Symbols in this quadrant indicate a scenario where both the trading volume and price are higher than their respective mean.
- Top-Left Quadrant (High Volume-Low Price): Symbols here reflect high trading volumes but prices lower than the mean.
- Bottom-Left Quadrant (Low Volume-Low Price): Assets in this quadrant have both low trading volume and price compared to their mean.
- Bottom-Right Quadrant (Low Volume-High Price): Symbols positioned here have prices that are higher than their mean, but the trading volume is low compared to the mean.
The plot also integrates a set of concentric squares which serve as visual guides:
- 1st Square (1SD): Encapsulates symbols that have Z-Scores within ±1 standard deviation for both price and volume. Symbols within this square are typically considered to be displaying normal behavior or within expected range.
- 2nd Square (2SD): Encapsulates those with Z-Scores within ±2 standard deviations. Symbols within this boundary, but outside the 1 SD square, indicate a moderate deviation from the norm.
- 3rd Square (3SD): Represents symbols with Z-Scores within ±3 standard deviations. Any symbol outside this square is deemed to be a significant outlier, exhibiting extreme behavior in terms of either its price, its volume, or both.
By assessing the position of symbols relative to these squares, traders can swiftly identify which assets are behaving typically and which are showing unusual activity. This visualization simplifies the process of spotting potential outliers or unique trading opportunities within the market. The farther a symbol is from the center, the more it deviates from its typical behavior.
◽️ Display Type: Columns
In this visualization, z-scores are represented using columns, where each symbol is presented horizontally. Each symbol has two distinct nodes:
- Left Node: Represents the z-score of volume.
- Right Node: Represents the z-score of price.
The height of these nodes can vary along the y-axis between -4 and 4, based on the z-score value:
- Large Positive Columns: Signify a high or positive z-score, indicating that the price or volume is significantly above its average.
- Large Negative Columns: Represent a low or negative z-score, suggesting that the price or volume is considerably below its average.
- Short Columns Near 0: Indicate that the price or volume is close to its mean, showcasing minimal deviation.
This columnar representation provides a clear, intuitive view of how each symbol's price and volume deviate from their respective averages.
◽️ Display Type: Circles
In this visualization style, z-scores are depicted using circles. Each symbol is horizontally aligned and represented by:
- Solid Circle: Represents the z-score of price.
- Transparent Circle: Represents the z-score of volume.
The vertical position of these circles on the y-axis ranges between -4 and 4, reflecting the z-score value:
- Circles Near the Top: Indicate a high or positive z-score, suggesting the price or volume is well above its average.
- Circles Near the Bottom: Represent a low or negative z-score, pointing to the price or volume being notably below its average.
- Circles Around the Midline (0): Highlight that the price or volume is close to its mean, with minimal deviation.
◽️ Display Type: Delta Columns
There's also an option to utilize Z-Score Delta Columns. For each symbol, a single column is presented, depicting the difference between the z-score of price and the z-score of volume.
The z-score delta essentially captures the disparity between how much the price and volume deviate from their respective mean:
- Positive Delta: Indicates that the z-score of price is greater than the z-score of volume. This suggests that the price has deviated more from its average than the volume has from its own average. Such a scenario could point to price movements being more significant or pronounced compared to the changes in volume.
- Negative Delta: Represents that the z-score of volume is higher than the z-score of price. This might mean that there are substantial volume changes, yet the price hasn't moved as dramatically. This can be indicative of potential build-up in trading interest without an equivalent impact on price.
- Delta Close to 0: Means that the z-scores for price and volume are almost equal, indicating their deviations from the average are in sync.
◽️ Display Type: Z-Volume/Z-Price Heatmap
This visualization offers a heatmap either for volume z-scores or price z-scores across all symbols. Here's how it's presented:
Each symbol is allocated its own horizontal row. Within this row, bar-by-bar data is displayed using a color gradient to represent the z-score values. The heatmap employs a user-defined gradient scale, where a chosen "cold" color represents low z-scores and a chosen "hot" color signifies high z-scores. As the z-score increases or decreases, the colors transition smoothly along this gradient, providing an intuitive visual indication of the z-score's magnitude.
- Cold Colors: Indicate values significantly below the mean (negative z-score)
- Mild Colors: Represent values close to the mean, suggesting minimal deviation.
- Hot Colors: Indicate values significantly above the mean (positive z-score)
This heatmap format provides a rapid, visually impactful means to discern how each symbol's price or volume is behaving relative to its average. The color-coded rows allow you to quickly spot outliers.
VOLUME TYPE
The "Volume Type" input allows you to choose the nature of volume data that will be factored into the volume z-score calculation. The interpretation of indicator’s data changes based on this input. You can opt between:
- Volume (Regular Volume): This is the classic measure of trading volume, which represents the volume traded in a given time period - bar.
- OBV (On-Balance Volume): OBV is a momentum indicator that accumulates volume on up bars and subtracts it on down bars, making it a cumulative indicator that sort of measures buying and selling pressure.
Interpretation Implications:
- For Volume Type: Regular Volume:
Positive Z-Score: Indicates that the trading volume is above its average, meaning there's unusually high trading activity .
Negative Z-Score: Suggests that the trading volume is below its average, signifying unusually low trading activity.
- For Volume Type: OBV:
Positive Z-Score: Signifies that “buying pressure” is above its average.
Negative Z-Score: Signifies that “selling pressure” is above its average.
When comparing Z-Score of OBV to Z-Score of price, we can observe several scenarios. If Z-Price and Z-Volume are convergent (have similar z-scores), we can say that the directional price movement is supported by volume. If Z-Price and Z-Volume are divergent (have very different z-scores or one of them being zero), it suggests a potential misalignment between price movement and volume support, which might hint at possible reversals or weakness.

Blockchain FundamentalThis indicator is made for traders to harness fundamental blockchain data for better decision-making. Unlike traditional tools, this indicator doesn't depend on standard technical indicators. It offers a novel perspective by focusing on core blockchain metrics like capitalization, miner activity, and other intrinsic data elements. I've designed a distinct scoring logic, exclusive to BF, ensuring it's user-friendly and provides actionable insights for traders at all levels.
Mainly created for Bitcoin , but can be applied to any other crypto assets in cost of losing some metrics in the analysis.
Ethereum chart:
Features:
Customizable Moving Averages:
Choose from an array of moving averages, with the flexibility to adjust the length for a tailored analysis, aiding in pinpointing asset trends.
Blockchain Metrics Integration:
Incorporates a range of blockchain metrics such as Market Cap to Realised Cap ratio, Spent Output Profit Ratio, ATH Drawdown, and more.
Blockchain Metrics Evaluation:
Each metric can be toggled on/off to customize the analysis. Using default settings, traders can use all of the metrics combined.
Every metric is essentially evaluated on a scale from -100 to 100 and then combined with others. If any metric is uncertain about its direction (equals to 0), then the score of it is not accounted in a final calculation.
Kalman Filter:
This indicator offers the option to apply a Kalman filter to the signals, enhancing the smoothness and accuracy of the indicator’s output. This is my approach to mitigate the noise in the final output.
Signal Oscillator:
Displays the aggregated score of all selected blockchain metrics.
Offers visual signals with adjustable upper and lower bounds for easy interpretation based on particular asset observation.
Visual Elements:
Signal Oscillator:
A visual representation of the aggregated blockchain fundamental score.
(White line for a raw calculation, orange line for kalman-filtered one)
Signal Counter:
Displays the count of metrics currently being considered in the fundamental score calculation. (grey line at the middle of an indicator)
Buy/Sell Signal Coloring:
The background color changes to indicate potential buying or selling opportunities based on user-defined bounds.
Usage:
Analysis:
Use the signal oscillator to identify potential market tops and bottoms based on blockchain fundamental data.
Adjust the bounds to customize the sensitivity of buy/sell signals.
Customization:
Enable/disable specific blockchain metrics to tailor the indicator to your analytical needs.
Adjust the moving average type and length for better analysis.
Integration:
Combine with other technical indicators to create a comprehensive trading strategy.
Utilize in conjunction with volume and price action analysis for enhanced decision-making. Every output could be used in traders custom strategies and indicators.

MA Directional Table"MA Directional Table" primary objective is to analyze the direction of the trend based on two Moving Averages (MA) for various timeframes and customizing the inputs to match your preferred style.
Features:
Moving Average Type: You can select which type of Moving Average to use (SMA, EMA, VWMA).
Moving Average Lengths: You can set the lengths for the short-term and long-term moving averages.
Table Position: The indicator provides a table which can be placed at the top or bottom, and to the left or right of the chart. It shows the trend status for multiple timeframes (1 min, 5 min, 15 min, 1 hour, 4 hours, 1 day).
Table Orientation: The table can be oriented either horizontally or vertically.
Price Condition: Optionally, the table color can be set to yellow if the current price deviates from the Moving Average trend and crosses MA1.
Cloud Settings: You can opt to show a cloud between the two moving averages. The color of the cloud changes based on the direction of the trend (bullish or bearish).
Extra MA: Optionally, an extra Moving Average can be plotted on the chart.

Adjustable Bull Bear Candle Indicator (V1.2)Indicator Description: Adjustable Bull Bear Candle Indicator
This indicator, named "Adjustable Bull Bear Candle Indicator ," is designed to assist traders in identifying potential bullish and bearish signals within price charts. It combines candlestick pattern analysis, moving average crossovers, and RSI (Relative Strength Index) conditions to offer insights into potential trading opportunities.
Disclaimer:
Trading involves substantial risk and is not suitable for every investor. This indicator is a tool designed to aid in technical analysis, but it does not guarantee successful trades. Always exercise your own judgment and seek professional advice before making any trading decisions.
Key Features:
Preceding Candles Analysis:
The indicator examines the behavior of the previous 'n' candles to identify specific patterns that indicate bearish or bullish momentum.
Candlestick Pattern and Momentum:
It considers the relationship between the opening and closing prices of the current candle to determine if it's bullish or bearish. The indicator then assesses the absolute price difference and compares it to the cumulative absolute differences of preceding candles.
Moving Averages:
The indicator calculates two Simple Moving Averages (SMAs) – Close SMA and Far SMA – to help identify trends and crossovers in price movement.
Relative Strength Index (RSI):
RSI is used as an additional measure to gauge momentum. It analyzes the current price's magnitude of recent gains and losses and compares it to past data.
Time Constraint:
If enabled, the indicator operates within a specific time window defined by the user. This feature can help traders focus on specific market hours.
Customizable Alerts:
The indicator includes an alert system that can be enabled or disabled. You can also adjust the specific alert conditions to align with your trading strategy.
How to Use:
This indicator generates buy signals when specific conditions are met, including a bullish candlestick pattern, positive price difference, closing price above the SMAs, RSI above a threshold, preceding bearish candles, and optionally within a specified time window. Conversely, short signals are generated under conditions opposite to those of the buy signal.
Disclosure and Risk Warning:
Educational Tool: This indicator is meant for educational purposes and to aid traders in their technical analysis. It's not a trading strategy in itself.
Risk of Loss: Trading carries inherent risks, including the potential for substantial loss. Always manage risk and consider using proper risk management techniques.
Diversification: Do not rely solely on this indicator. A well-rounded trading approach includes fundamental analysis, risk management, and proper diversification.
Consultation: It's strongly advised to consult with a financial professional before making any trading decisions.
Conclusion:
The "Bullish Candle after Bearish Candles with Momentum Indicator" can be a valuable tool in your technical analysis toolkit. However, successful trading requires a deep understanding of market dynamics, risk management, and continual learning. Use this indicator in conjunction with other tools and strategies to enhance your trading decisions.
Remember that past performance is not indicative of future results. Always be cautious and informed when participating in the financial markets.

MACD HTF - Dynamic SmoothingEnhancing Your 1-Minute Trades with Dynamic HTF MACD Smoothing
Ever found yourself glued to a 1-minute chart, trying to catch every minor price movement, yet feeling like you're missing the bigger picture? Picture this: a solid MACD line on that chart, dynamically smoothed from a higher timeframe (HTF). This tool offers two significant benefits over other existing HTF MACD indicators:
User-Friendly Interface: No need to manually adjust input parameters every time you switch to a different timeframe.
Smooth Charting: Say goodbye to the zigzag lines that often result from plotting higher time frame resolutions on a lower time frame.
Understanding the MACD
The Moving Average Convergence Divergence (MACD) is one of the most widely used and trusted technical indicators in the trading community. Invented by Gerald Appel in the late 1970s, the MACD helps traders understand the relationship between two moving averages of a security's price. It consists of the MACD line (difference between a 12-period and 26-period Exponential Moving Average) and the Signal line (9-period EMA of the MACD line). When the MACD line crosses above the Signal line, it's viewed as a bullish signal, and vice versa. The difference between the two lines is represented as a histogram, providing insights into potential buy or sell opportunities.
Features of the Dynamic HTF MACD Smoothing Script
Time Frame Flexibility: Choose a higher timeframe to derive MACD values and apply dynamic smoothing to your current timeframe.
Multiple Moving Averages: The script supports various MA types like EMA, SMA, DEMA, TEMA, WMA and HMA.
Alerts: Get real-time alerts for MACD crossover and crossunder.
Customizability: From the type of moving average to its length, customize as per your strategy.
Visual Indicators: Clearly plots signals when MACD crossover or crossunder occurs for potential entries.
At last
A massive shoutout to all the wizards and generous contributors in the community! You inspire innovations and new tools, paving the path forward. Here's to a community where we learn and build together. Cheers to collective growth!
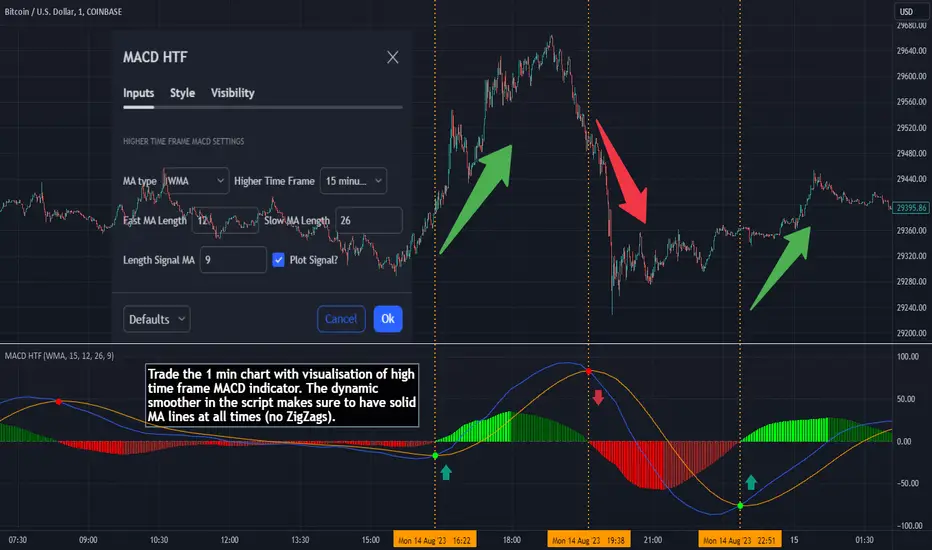
Major and Minor Trend Indicator by Nikhil34a V 2.2Title: Major and Minor Trend Indicator by Nikhil34a V 2.2
Description:
The Major and Minor Trend Indicator v2.2 is a comprehensive technical analysis script designed for use with the TradingView platform. This powerful tool is developed in Pine Script version 5 and helps traders identify potential buying and selling opportunities in the stock market.
Features:
SMA Trend Analysis: The script calculates two Simple Moving Averages (SMAs) with user-defined lengths for major and minor trends. It displays these SMAs on the chart, allowing traders to visualize the prevailing trends easily.
Surge Detection: The indicator can detect buying and selling surges based on specific conditions, such as volume, RSI, MACD, and stochastic indicators. Both Buying and Selling surges are marked in black on the chart.
Option Buy Zone Detection: The script identifies the option buy zone based on SMA crossovers, RSI, and MACD values. The buy zone is categorized as "CE Zone" or "PE Zone" and displayed in the table along with the trigger time.
Two-Day High and Low Range: The script calculates the highest high and lowest low of the previous two trading days and plots them on the chart. The area between these points is shaded in semi-transparent green and red colors.
Crossover Analysis: The script analyzes moving average crossovers on multiple timeframes (2-minute, 3-minute, and 5-minute) and displays buy and sell signals accordingly.
Trend Identification: The script identifies the major and minor trends as either bullish or bearish, providing valuable insights into the overall market sentiment.
Usage:
Customize Major and Minor SMA Periods: Adjust the lengths of major and minor SMAs through input parameters to suit your trading preferences.
Enable/Disable Moving Averages: Choose which SMAs to display on the chart by toggling the "showXMA" input options.
Set Surge and Option Buy Zone Thresholds: Modify the surgeThreshold, volumeThreshold, RSIThreshold, and StochThreshold inputs to refine the surge and buy zone detection.
Analyze Crossover Signals: Monitor the crossover signals in the table, categorized by timeframes (2-minute, 3-minute, and 5-minute).
Explore Market Bias and Distance to 2-Day High/Low: The table provides information on market bias, current price movement relative to the previous two-day high and low, and the option buy zone status.
Additional Use Cases:
Surge Indicator:
The script includes a Surge Indicator that detects sudden buying or selling surges in the market. When a buying surge is identified, the "BSurge" label will appear below the corresponding candle with black text on a white background. Similarly, a selling surge will display the "SSurge" label in white text on a black background. These indicators help traders quickly spot strong buying or selling activities that may influence their trading decisions. These surges can be used to identify sudden premium dump zones.
Option Buy Zone:
The Option Buy Zone is an essential feature that identifies potential zones for buying call options (CE Zone) or put options (PE Zone) based on specific technical conditions. The indicator evaluates SMA crossovers, RSI, and MACD values to determine the current market sentiment. When the option buy zone is triggered, the script will display the respective zone ("CE Zone" or "PE Zone") in the table, highlighted with a white background. Additionally, the time when the buy zone was triggered will be shown under the "Option Buy Zone Trigger Time" column.
Price Movement Relative to 2-Day High/Low:
The script calculates the highest high and lowest low of the previous two trading days (high2DaysAgo and low2DaysAgo) and plots these points on the chart. The area between these two points is shaded in semi-transparent green and red colors. The green region indicates the price range between the highpricetoconsider (highest high of the previous two days) and the lower value between highPreviousDay and high2DaysAgo. Similarly, the red region represents the price range between the lowpricetoconsider (lowest low of the previous two days) and the higher value between lowPreviousDay and low2DaysAgo.
Entry Time and Current Zone:
The script identifies potential entry times for trades within the option buy zone. When a valid buy zone trigger occurs, the script calculates the entryTime by adding the durationInMinutes (user-defined) to the startTime. The entryTime will be displayed in the "Entry Time" column of the table. Depending on the comparison between optionbuyzonetriggertime and entryTime, the background color of the entry time will change. If optionbuyzonetriggertime is greater than entryTime, the background color will be yellow, indicating that a new trigger has occurred before the specified duration. Otherwise, the background color will be green, suggesting that the entry time is still within the defined duration.
Current Zone Indicator:
The script further categorizes the current zone as either "CE Zone" (call option zone) or "PE Zone" (put option zone). When the market is trending upwards and the minor SMA is above the major SMA, the currentZone will be set to "CE Zone." Conversely, when the market is trending downwards and the minor SMA is below the major SMA, the currentZone will be "PE Zone." This information is displayed in the "Current Zone" column of the table.
These additional use cases empower traders with valuable insights into market trends, buying and selling surges, option buy zones, and potential entry times. Traders can combine this information with their analysis and risk management strategies to make informed and confident trading decisions.
Note:
The script is optimized for identifying trends and potential trade opportunities. It is crucial to perform additional analysis and risk management before executing any trades based on the provided signals.
Happy Trading!

Pseudo-Entropy Oscillator with Standard Deviation (modified)Intuition: The Pseudo-Entropy Oscillator with Standard Deviation (PEO_SD) was created to provide traders with a way to analyze market momentum and potential reversals. It combines the concepts of entropy, standard deviation, and moving averages to offer insights into market behavior.The oscillator's core idea is to measure the pseudo-entropy of the market using standard deviation. Pseudo-entropy refers to the degree of disorder or randomness in the price data. By calculating the standard deviation of the closing prices over a specified period, the oscillator quantifies the market's volatility.To enhance the usefulness of the pseudo-entropy measurement, the oscillator incorporates moving averages. The entropy delta is calculated by applying momentum analysis to the pseudo-entropy values. This helps identify short-term changes in the entropy, indicating shifts in market sentiment or momentum.The oscillator further smoothes the pseudo-entropy values by calculating the simple moving average (SMA) over a specified length. This helps filter out noise and provides a clearer representation of the market's overall momentum.
------------------------------------------------------------------------------------------------------------------------------------------------------------------------------------------------------------------------------------------------
The "Pseudo-Entropy Oscillator with Standard Deviation" (PEO_SD) is a custom indicator designed to help traders analyze market momentum and potential reversal points. It can be applied to various markets like stocks, commodities, forex, or cryptocurrencies. By using this indicator, you can gain insights into the market's behavior and make more informed trading decisions.
The PEO_SD indicator plots three lines on your chart: the fast pseudo-entropy line, the medium pseudo-entropy line, and the slow pseudo-entropy line. Each line represents the combined pseudo-entropy values, which are calculated using standard deviation and moving averages.
The lines are color-coded for easy identification. The fast line is represented by blue, the medium line by yellow, and the slow line by red. Additionally, three horizontal reference lines are plotted: the mid line (at 50), the lower bound (at 20), and the upper bound (at 80).
To use this indicator effectively, you can observe the interactions of the lines with the reference lines. For example, when any of the lines cross above the mid line, it might indicate a bullish signal, suggesting an upward price movement. Conversely, a crossover below the mid line could be a bearish signal, indicating a potential downward price movement. If the lines reach the upper bound, it might suggest that the market is overbought, and a reversal could be imminent. Conversely, reaching the lower bound may indicate that the market is oversold, possibly leading to a price reversal.
By applying the PEO_SD indicator and studying the lines' movements, you can gain valuable insights into market momentum, identify potential reversal points, and make more informed trading decisions.

Ratio To Average - The Quant ScienceRatio To Average - The Quant Science is a quantitative indicator that calculates the percentage ratio of the market price in relation to a reference average. The indicator allows the calculation of the ratio using four different types of averages: SMA, EMA, WMA, and HMA. The ratio is represented by a series of histograms that highlight periods when the ratio is positive (in green) and periods when the ratio is negative (in red).
What is the Ratio to Average?
The Ratio to Average is a measure that tracks the price movements with one of its averages, calculating how much the price is above or below its own average, in percentage terms.
USER INTERFACE
Lenght: it adjusts the number of bars to include in the calculation of the average.
Moving Average: it allows you to choose the type of average to use.
Color Up/Color Down : it allows you to choose the color of the indicator for positive and negative ratios.

Scalping Strategy (5min)This indicator is designed for scalping strategies on a 5-minute timeframe. It generates signals based on two RSI crossovers and incorporates moving averages to identify trends. Additionally, a Bollinger Band is included to eliminate the need for an additional Bollinger Band on the chart.
Please note that this indicator does not guarantee 100% accurate signals and may produce false signals. It is recommended to use this indicator in conjunction with other indicators such as Stochastic, MACD, SuperTrend, or any other suitable indicators to enhance the accuracy of trading decisions.
1) Signal Generation: The indicator generates buy and sell signals based on two RSI crossovers. A buy signal is generated when the fast RSI crosses above the slow RSI, indicating potential bullish momentum. Conversely, a sell signal is generated when the fast RSI crosses below the slow RSI, suggesting potential bearish momentum.
2) To adjust the indicator to your specific chart and trading preferences, you have the flexibility to modify the RSI and moving average (MA) values. By changing the RSI values (slow RSI length and fast RSI length), you can fine-tune the sensitivity of the RSI crossovers to suit different timeframes and market conditions. Similarly, adjusting the MA values (slow MA period and fast MA period) allows you to adapt the indicator to the desired trend identification and short-term trend confirmation.
3) Pay attention to trades that are confirmed by the short-term moving average (MA) aligning with the desired direction. For buy signals, ensure that the short MA is tending upward, indicating a potential uptrend. For sell signals, confirm that the short MA is trending downward, suggesting a potential downtrend.
4) Moving Averages: The indicator uses a 200-period moving average (MA) to identify the overall trend and a short-term MA for additional confirmation.
5) Bollinger Band: The included Bollinger Band is not directly used in the indicator's calculations. However, it is provided for convenience so that users don't need to add another Bollinger Band to their chart separately.
6) Exercise caution when the short MA is below the 200-period MA but showing signs of attempting an upward move. These situations may indicate a potential reversal or consolidation, and it is advisable to avoid taking trades solely based on the 200-period MA crossover in such cases.
Remember that these guidelines are intended to provide additional insights and should be used in combination with your trading judgment and analysis.
