Dynamic Range Filter with Trend Candlesticks (Zeiierman)█ Overview
Dynamic Range Filter with Trend Candlesticks (Zeiierman) is a volatility-responsive trend engine that adapts in real-time to market structure, offering a clean and intelligent visualization of directional bias. It blends dynamic range calculation with customizable smoothing techniques and layered trend confirmation logic, making it ideal for traders who rely on clear trend direction, structural range analysis, and momentum-based candlestick signals.
By measuring scaled volatility over configurable lengths and applying advanced moving average techniques, this indicator filters out market noise while preserving true directional intent. Complementing this, a dual-trend system (range-based and candle-based) enhances clarity and responsiveness, particularly during shifting market conditions.
█ How It Works
⚪ Scaled Volatility Band Calculation
At the core lies a volatility engine that constructs adaptive range bands around price using smoothed high/low calculations. The bands are dynamically adjusted using:
High/Low Smoothing – Applies a moving average to the raw high and low data before calculating the range.
Scaled Range Volatility – A 2.618 multiplier scales the distance between smoothed highs and lows, forming a responsive volatility envelope.
Band Multiplier – Controls how wide the upper/lower range bands extend from the mean.
This filtering process minimizes false signals and highlights only structurally meaningful moves.
⚪ Multi-Type Smoothing Engine
Users can choose from a wide array of smoothing algorithms for trend construction, including:
HMA (default), SMA, EMA, RMA
KAMA – Adapts to market volatility using efficiency ratios.
VIDYA – Momentum-sensitive smoothing using CMO logic.
FRAMA – Dynamically adjusts to fractal dimension in price.
Super Smoother – Ideal for eliminating aliasing in range signals.
This provides the trader with fine-tuned control over reactivity vs. smoothness.
⚪ Trend Detection (Dual Engine)
The indicator includes two independent trend tracking systems:
Main Trend Filter – Based on adaptive volatility band shifts.
Candle Trend Filter – A second-tier confirmation using smoothed candle data, ideal for directional candles and confirmation entries.
█ How to Use
⚪ Trend Confirmation
Use the Trend Line and colored candlesticks for high-probability entries in the trend direction. The more trend layers that align, the higher the confidence.
⚪ Reversal Zones
When the price reaches the outer bands or fails to break them, look for candle color shifts or a crossover in the range to anticipate possible reversals or consolidations.
█ Settings
Scaled Volatility Length – Controls the lookback used to stabilize the base volatility band.
MA Type & Length – Choose and fine-tune the smoothing method (HMA, EMA, KAMA, etc.)
High/Low Smoother – Pre-smoothing for structural high/low banding.
Band Multiplier – Adjusts the width of the dynamic bands.
Trend Length (Candles) – Length used for candle-based trend confirmation.
-----------------
Disclaimer
The content provided in my scripts, indicators, ideas, algorithms, and systems is for educational and informational purposes only. It does not constitute financial advice, investment recommendations, or a solicitation to buy or sell any financial instruments. I will not accept liability for any loss or damage, including without limitation any loss of profit, which may arise directly or indirectly from the use of or reliance on such information.
All investments involve risk, and the past performance of a security, industry, sector, market, financial product, trading strategy, backtest, or individual's trading does not guarantee future results or returns. Investors are fully responsible for any investment decisions they make. Such decisions should be based solely on an evaluation of their financial circumstances, investment objectives, risk tolerance, and liquidity needs.
스크립트에서 "algo"에 대해 찾기

ErrorFunctionsLibrary "ErrorFunctions"
A collection of functions used to approximate the area beneath a Gaussian curve.
Because an ERF (Error Function) is an integral, there is no closed-form solution to calculating the area beneath the curve. Meaning all ERFs are approximations; precisely wrong, but mostly accurate. How close you need to get to the actual area depends entirely on your use case, with more precision being less efficient.
The internal precision of floats in Pine Script is 1e-16 (16 decimals, aka. double precision). This library adapts well known algorithms designed to efficiently reach double precision. Single precision alternates are also included. All of them were made free to use, modify, and distribute by their original authors.
HASTINGS
Adaptation of a single precision ERF by Cecil Hastings Jr, published through Princeton University in 1955. It was later documented by Abramowitz and Stegun as equation 7.1.26 in their 1972 Handbook of Mathematical Functions. Fast, efficient, and ideal when precision beyond a few decimals is unnecessary.
GILES
Adaptation of a single precision Inverse ERF by Michael Giles, published through the University of Oxford in 2012. It reverses the ERF, estimating an X coordinate from an area. It too is fast, efficient, and ideal when precision beyond a few decimals is unnecessary.
LIBC
Adaptation of the double precision ERF & ERFC in the standard C library (aka. libc). It is also the same ERF & ERFC that SciPy uses. While not quite as efficient as the Hastings approximation, it's still very fast and fully maximizes Pines precision.
BOOST
Adaptation of the double precision Inverse ERF & Inverse ERFC in the Boost Math C++ library. SciPy uses these as well. These reverse the ERF & ERFC, estimating an X coordinate from an area. It too isn't quite as efficient as the Giles approximation, but still fast and fully maximizes Pines precision.
While these algorithms are not exported directly, they are available through their exported counterparts.
- - -
ERROR FUNCTIONS
erf(x, precise)
An Error Function estimates the theoretical error of a measurement.
Parameters:
x (float) : (float) Upper limit of the integration.
precise (bool) : Double precision (true) or single precision (false).
Returns: (float) Between -1 and 1.
erfc(x, precise)
A Complementary Error Function estimates the difference between a theoretical error and infinity.
Parameters:
x (float) : (float) Lower limit of the integration.
precise (bool) : Double precision (true) or single precision (false).
Returns: (float) Between 0 and 2.
erfinv(x, precise)
An Inverse Error Function reverses the erf() by estimating the original measurement from the theoretical error.
Parameters:
x (float) : (float) Theoretical error.
precise (bool) : Double precision (true) or single precision (false).
Returns: (float) Between 0 and ± infinity.
erfcinv(x, precise)
An Inverse Complementary Error Function reverses the erfc() by estimating the original measurement from the difference between the theoretical error and infinity.
Parameters:
x (float) : (float) Difference between the theoretical error and infinity.
precise (bool) : Double precision (true) or single precision (false).
Returns: (float) Between 0 and ± infinity.
- - -
DISTRIBUTION FUNCTIONS
pdf(x, m, s)
A Probability Density Function estimates the probability density . For clarity, density is not a probability .
Parameters:
x (float) : (float) X coordinate for which a density will be estimated.
m (float) : (float) Mean
s (float) : (float) Sigma
Returns: (float) Between 0 and ∞.
cdf(z, precise)
A Cumulative Distribution Function estimates the area under a Gaussian curve between negative infinity and the Z Score.
Parameters:
z (float) : (float) Z Score.
precise (bool) : Double precision (true) or single precision (false).
Returns: (float) Between 0 and 1.
cdfinv(a, precise)
An Inverse Cumulative Distribution Function reverses the cdf() by estimating the Z Score from an area.
Parameters:
a (float) : (float) Area between 0 and 1.
precise (bool) : Double precision (true) or single precision (false).
Returns: (float) Between -∞ and +∞
cdfab(z1, z2, precise)
A Cumulative Distribution Function from A to B estimates the area under a Gaussian curve between two Z Scores (A and B).
Parameters:
z1 (float) : (float) First Z Score.
z2 (float) : (float) Second Z Score.
precise (bool) : Double precision (true) or single precision (false).
Returns: (float) Between 0 and 1.
ttt(z, precise)
A Two-Tailed Test estimates the area under a Gaussian curve between symmetrical ± Z scores and ± infinity.
Parameters:
z (float) : (float) One of the symmetrical Z Scores.
precise (bool) : Double precision (true) or single precision (false).
Returns: (float) Between 0 and 1.
tttinv(a, precise)
An Inverse Two-Tailed Test reverses the ttt() by estimating the absolute Z Score from an area.
Parameters:
a (float) : (float) Area between 0 and 1.
precise (bool) : Double precision (true) or single precision (false).
Returns: (float) Between 0 and ∞.
ott(z, precise)
A One-Tailed Test estimates the area under a Gaussian curve between an absolute Z Score and infinity.
Parameters:
z (float) : (float) Z Score.
precise (bool) : Double precision (true) or single precision (false).
Returns: (float) Between 0 and 1.
ottinv(a, precise)
An Inverse One-Tailed Test Reverses the ott() by estimating the Z Score from a an area.
Parameters:
a (float) : (float) Area between 0 and 1.
precise (bool) : Double precision (true) or single precision (false).
Returns: (float) Between 0 and ∞.

Vector Candles [v6 Optimized + EMA]
Vector Candles represent an innovative technical analysis approach that transforms traditional candlestick charting by integrating volume dynamics, color-coded momentum, and multi-dimensional market insights. Unlike standard candlesticks that merely display price movement, Vector Candles encode additional market information through sophisticated color and volume algorithms.
Key Features:
-Dynamic Volume-Based Coloring: Candles change color based on trading volume intensity
-Volume Categories:
High Volume (Lime/Red): Significant market activity (200%+- Vol of Previous 10 Candles)
Above Average Volume (Blue/Fuchsia): Moderate market momentum (150%+- Vol of Previous 10 Candles).
Normal Volume (Gray Scales): Standard market conditions.
Stopping Volume Candles - Typically Pinbar/Doji candles. Stops volume in the current direction of delivery & can help forecast impending reversals or end to the current trend.
-Integrated EMA (Exponential Moving Average) Option:
-Customizable EMA Length (Default: 50 periods) (I use 33)
Configurable EMA Source (e.g., close price)
Optional EMA Overlay for Trend Confirmation

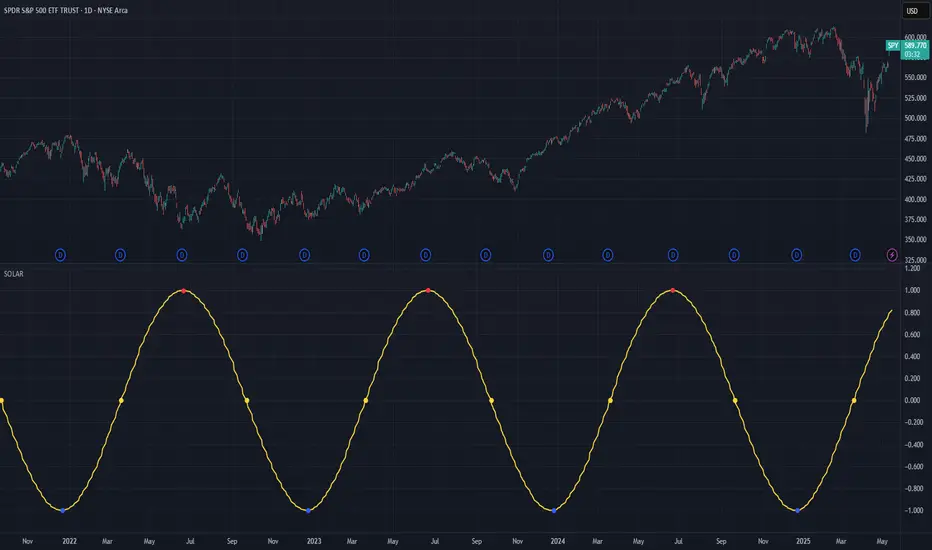
Solar Cycle (SOLAR)SOLAR: SOLAR CYCLE
🔍 OVERVIEW AND PURPOSE
The Solar Cycle indicator is an astronomical calculator that provides precise values representing the seasonal position of the Sun throughout the year. This indicator maps the Sun's position in the ecliptic to a normalized value ranging from -1.0 (winter solstice) through 0.0 (equinoxes) to +1.0 (summer solstice), creating a continuous cycle that represents the seasonal progression throughout the year.
The implementation uses high-precision astronomical formulas that include orbital elements and perturbation terms to accurately calculate the Sun's position. By converting chart timestamps to Julian dates and applying standard astronomical algorithms, this indicator achieves significantly greater accuracy than simplified seasonal approximations. This makes it valuable for traders exploring seasonal patterns, agricultural commodities trading, and natural cycle-based trading strategies.
🧩 CORE CONCEPTS
Seasonal cycle integration: Maps the annual solar cycle (365.242 days) to a continuous wave
Continuous phase representation: Provides a normalized -1.0 to +1.0 value
Astronomical precision: Uses perturbation terms and high-precision constants for accurate solar position
Key points detection: Identifies solstices (±1.0) and equinoxes (0.0) automatically
The Solar Cycle indicator differs from traditional seasonal analysis tools by incorporating precise astronomical calculations rather than using simple calendar-based approximations. This approach allows traders to identify exact seasonal turning points and transitions with high accuracy.
⚙️ COMMON SETTINGS AND PARAMETERS
Pro Tip: While the indicator itself doesn't have adjustable parameters, it's most effective when used on higher timeframes (daily or weekly charts) to visualize seasonal patterns. Consider combining it with commodity price data to analyze seasonal correlations.
🧮 CALCULATION AND MATHEMATICAL FOUNDATION
Simplified explanation:
The Solar Cycle indicator calculates the Sun's ecliptic longitude and transforms it into a sine wave that peaks at the summer solstice and troughs at the winter solstice, with equinoxes at the zero crossings.
Technical formula:
Convert chart timestamp to Julian Date:
JD = (time / 86400000.0) + 2440587.5
Calculate Time T in Julian centuries since J2000.0:
T = (JD - 2451545.0) / 36525.0
Calculate the Sun's mean longitude (L0) and mean anomaly (M), including perturbation terms:
L0 = (280.46646 + 36000.76983T + 0.0003032T²) % 360
M = (357.52911 + 35999.05029T - 0.0001537T² - 0.00000025T³) % 360
Calculate the equation of center (C):
C = (1.914602 - 0.004817T - 0.000014*T²)sin(M) +
(0.019993 - 0.000101T)sin(2M) +
0.000289sin(3M)
Calculate the Sun's true longitude and convert to seasonal value:
λ = L0 + C
seasonal = sin(λ)
🔍 Technical Note: The implementation includes terms for the equation of center to account for the Earth's elliptical orbit. This provides more accurate timing of solstices and equinoxes compared to simple harmonic approximations.
📈 INTERPRETATION DETAILS
The Solar Cycle indicator provides several analytical perspectives:
Summer Solstice (+1.0): Maximum solar elevation, longest day
Winter Solstice (-1.0): Minimum solar elevation, shortest day
Vernal Equinox (0.0 crossing up): Day and night equal length, spring begins
Autumnal Equinox (0.0 crossing down): Day and night equal length, autumn begins
Transition rates: Steepest near equinoxes, flattest near solstices
Cycle alignment: Market cycles that align with seasonal patterns may show stronger trends
Confirmation points: Solstices and equinoxes often mark important seasonal turning points
⚠️ LIMITATIONS AND CONSIDERATIONS
Geographic relevance: Solar cycle timing is most relevant for temperate latitudes
Market specificity: Seasonal effects vary significantly across different markets
Timeframe compatibility: Most effective for longer-term analysis (weekly/monthly)
Complementary tool: Should be used alongside price action and other indicators
Lead/lag effects: Market reactions to seasonal changes may precede or follow astronomical events
Statistical significance: Seasonal patterns should be verified across multiple years
Global markets: Consider opposite seasonality in Southern Hemisphere markets
📚 REFERENCES
Meeus, J. (1998). Astronomical Algorithms (2nd ed.). Willmann-Bell.
Hirshleifer, D., & Shumway, T. (2003). Good day sunshine: Stock returns and the weather. Journal of Finance, 58(3), 1009-1032.
Hong, H., & Yu, J. (2009). Gone fishin': Seasonality in trading activity and asset prices. Journal of Financial Markets, 12(4), 672-702.
Bouman, S., & Jacobsen, B. (2002). The Halloween indicator, 'Sell in May and go away': Another puzzle. American Economic Review, 92(5), 1618-1635.
Bober XM v2.0# ₿ober XM v2.0 Trading Bot Documentation
**Developer's Note**: While our previous Bot 1.3.1 was removed due to guideline violations, this setback only fueled our determination to create something even better. Rising from this challenge, Bober XM 2.0 emerges not just as an update, but as a complete reimagining with multi-timeframe analysis, enhanced filters, and superior adaptability. This adversity pushed us to innovate further and deliver a strategy that's smarter, more agile, and more powerful than ever before. Challenges create opportunity - welcome to Cryptobeat's finest work yet.
## !!!!You need to tune it for your own pair and timeframe and retune it periodicaly!!!!!
## Overview
The ₿ober XM v2.0 is an advanced dual-channel trading bot with multi-timeframe analysis capabilities. It integrates multiple technical indicators, customizable risk management, and advanced order execution via webhook for automated trading. The bot's distinctive feature is its separate channel systems for long and short positions, allowing for asymmetric trade strategies that adapt to different market conditions across multiple timeframes.
### Key Features
- **Multi-Timeframe Analysis**: Analyze price data across multiple timeframes simultaneously
- **Dual Channel System**: Separate parameter sets for long and short positions
- **Advanced Entry Filters**: RSI, Volatility, Volume, Bollinger Bands, and KEMAD filters
- **Machine Learning Moving Average**: Adaptive prediction-based channels
- **Multiple Entry Strategies**: Breakout, Pullback, and Mean Reversion modes
- **Risk Management**: Customizable stop-loss, take-profit, and trailing stop settings
- **Webhook Integration**: Compatible with external trading bots and platforms
### Strategy Components
| Component | Description |
|---------|-------------|
| **Dual Channel Trading** | Uses either Keltner Channels or Machine Learning Moving Average (MLMA) with separate settings for long and short positions |
| **MLMA Implementation** | Machine learning algorithm that predicts future price movements and creates adaptive bands |
| **Pivot Point SuperTrend** | Trend identification and confirmation system based on pivot points |
| **Three Entry Strategies** | Choose between Breakout, Pullback, or Mean Reversion approaches |
| **Advanced Filter System** | Multiple customizable filters with multi-timeframe support to avoid false signals |
| **Custom Exit Logic** | Exits based on OBV crossover of its moving average combined with pivot trend changes |
### Note for Novice Users
This is a fully featured real trading bot and can be tweaked for any ticker — SOL is just an example. It follows this structure:
1. **Indicator** – gives the initial signal
2. **Entry strategy** – decides when to open a trade
3. **Exit strategy** – defines when to close it
4. **Trend confirmation** – ensures the trade follows the market direction
5. **Filters** – cuts out noise and avoids weak setups
6. **Risk management** – controls losses and protects your capital
To tune it for a different pair, you'll need to start from scratch:
1. Select the timeframe (candle size)
2. Turn off all filters and trend entry/exit confirmations
3. Choose a channel type, channel source and entry strategy
4. Adjust risk parameters
5. Tune long and short settings for the channel
6. Fine-tune the Pivot Point Supertrend and Main Exit condition OBV
This will generate a lot of signals and activity on the chart. Your next task is to find the right combination of filters and settings to reduce noise and tune it for profitability.
### Default Strategy values
Default values are tuned for: Symbol BITGET:SOLUSDT.P 5min candle
Filters are off by default: Try to play with it to understand how it works
## Configuration Guide
### General Settings
| Setting | Description | Default Value |
|---------|-------------|---------------|
| **Long Positions** | Enable or disable long trades | Enabled |
| **Short Positions** | Enable or disable short trades | Enabled |
| **Risk/Reward Area** | Visual display of stop-loss and take-profit zones | Enabled |
| **Long Entry Source** | Price data used for long entry signals | hl2 (High+Low/2) |
| **Short Entry Source** | Price data used for short entry signals | hl2 (High+Low/2) |
The bot allows you to trade long positions, short positions, or both simultaneously. Each direction has its own set of parameters, allowing for fine-tuned strategies that recognize the asymmetric nature of market movements.
### Multi-Timeframe Settings
1. **Enable Multi-Timeframe Analysis**: Toggle 'Enable Multi-Timeframe Analysis' in the Multi-Timeframe Settings section
2. **Configure Timeframes**: Set appropriate higher timeframes based on your trading style:
- Timeframe 1: Default is now 15 minutes (intraday confirmation)
- Timeframe 2: Default is 4 hours (trend direction)
3. **Select Sources per Indicator**: For each indicator (RSI, KEMAD, Volume, etc.), choose:
- The desired timeframe (current, mtf1, or mtf2)
- The appropriate price type (open, high, low, close, hl2, hlc3, ohlc4)
### Entry Strategies
- **Breakout**: Enter when price breaks above/below the channel
- **Pullback**: Enter when price pulls back to the channel
- **Mean Reversion**: Enter when price is extended from the channel
You can enable different strategies for long and short positions.
### Core Components
### Risk Management
- **Position Size**: Control risk with percentage-based position sizing
- **Stop Loss Options**:
- Fixed: Set a specific price or percentage from entry
- ATR-based: Dynamic stop-loss based on market volatility
- Swing: Uses recent swing high/low points
- **Take Profit**: Multiple targets with percentage allocation
- **Trailing Stop**: Dynamic stop that follows price movement
## Advanced Usage Strategies
### Moving Average Type Selection Guide
- **SMA**: More stable in choppy markets, good for higher timeframes
- **EMA/WMA**: More responsive to recent price changes, better for entry signals
- **VWMA**: Adds volume weighting for stronger trends, use with Volume filter
- **HMA**: Balance between responsiveness and noise reduction, good for volatile markets
### Multi-Timeframe Strategy Approaches
- **Trend Confirmation**: Use higher timeframe RSI (mtf2) for overall trend, current timeframe for entries
- **Entry Precision**: Use KEMAD on current timeframe with volume filter on mtf1
- **False Signal Reduction**: Apply RSI filter on mtf1 with strict KEMAD settings
### Market Condition Optimization
| Market Condition | Recommended Settings |
|------------------|----------------------|
| **Trending** | Use Breakout strategy with KEMAD filter on higher timeframe |
| **Ranging** | Use Mean Reversion with strict RSI filter (mtf1) |
| **Volatile** | Increase ATR multipliers, use HMA for moving averages |
| **Low Volatility** | Decrease noise parameters, use pullback strategy |
## Webhook Integration
The strategy features a professional webhook system that allows direct connectivity to your exchange or trading platform of choice through third-party services like 3commas, Alertatron, or Autoview.
The webhook payload includes all necessary parameters for automated execution:
- Entry price and direction
- Stop loss and take profit levels
- Position size
- Custom identifier for webhook routing
## Performance Optimization Tips
1. **Start with Defaults**: Begin with the default settings for your timeframe before customizing
2. **Adjust One Component at a Time**: Make incremental changes and test the impact
3. **Match MA Types to Market Conditions**: Use appropriate moving average types based on the Market Condition Optimization table
4. **Timeframe Synergy**: Create logical relationships between timeframes (e.g., 5min chart with 15min and 4h higher timeframes)
5. **Periodic Retuning**: Markets evolve - regularly review and adjust parameters
## Common Setups
### Crypto Trend-Following
- MLMA with EMA or HMA
- Higher RSI thresholds (75/25)
- KEMAD filter on mtf1
- Breakout entry strategy
### Stock Swing Trading
- MLMA with SMA for stability
- Volume filter with higher threshold
- KEMAD with increased filter order
- Pullback entry strategy
### Forex Scalping
- MLMA with WMA and lower noise parameter
- RSI filter on current timeframe
- Use highest timeframe for trend direction only
- Mean Reversion strategy
## Webhook Configuration
- **Benefits**:
- Automated trade execution without manual intervention
- Immediate response to market conditions
- Consistent execution of your strategy
- **Implementation Notes**:
- Requires proper webhook configuration on your exchange or platform
- Test thoroughly with small position sizes before full deployment
- Consider latency between signal generation and execution
### Backtesting Period
Define a specific historical period to evaluate the bot's performance:
| Setting | Description | Default Value |
|---------|-------------|---------------|
| **Start Date** | Beginning of backtest period | January 1, 2025 |
| **End Date** | End of backtest period | December 31, 2026 |
- **Best Practice**: Test across different market conditions (bull markets, bear markets, sideways markets)
- **Limitation**: Past performance doesn't guarantee future results
## Entry and Exit Strategies
### Dual-Channel System
A key innovation of the Bober XM is its dual-channel approach:
- **Independent Parameters**: Each trade direction has its own channel settings
- **Asymmetric Trading**: Recognizes that markets often behave differently in uptrends versus downtrends
- **Optimized Performance**: Fine-tune settings for both bullish and bearish conditions
This approach allows the bot to adapt to the natural asymmetry of markets, where uptrends often develop gradually while downtrends can be sharp and sudden.
### Channel Types
#### 1. Keltner Channels
Traditional volatility-based channels using EMA and ATR:
| Setting | Long Default | Short Default |
|---------|--------------|---------------|
| **EMA Length** | 37 | 20 |
| **ATR Length** | 13 | 17 |
| **Multiplier** | 1.4 | 1.9 |
| **Source** | low | high |
- **Strengths**:
- Reliable in trending markets
- Less prone to whipsaws than Bollinger Bands
- Clear visual representation of volatility
- **Weaknesses**:
- Can lag during rapid market changes
- Less effective in choppy, non-trending markets
#### 2. Machine Learning Moving Average (MLMA)
Advanced predictive model using kernel regression (RBF kernel):
| Setting | Description | Options |
|---------|-------------|--------|
| **Source MA** | Price data used for MA calculations | Any price source (low/high/close/etc.) |
| **Moving Average Type** | Type of MA algorithm for calculations | SMA, EMA, WMA, VWMA, RMA, HMA |
| **Trend Source** | Price data used for trend determination | Any price source (close default) |
| **Window Size** | Historical window for MLMA calculations | 5+ (default: 16) |
| **Forecast Length** | Number of bars to forecast ahead | 1+ (default: 3) |
| **Noise Parameter** | Controls smoothness of prediction | 0.01+ (default: ~0.43) |
| **Band Multiplier** | Multiplier for channel width | 0.1+ (default: 0.5-0.6) |
- **Strengths**:
- Predictive rather than reactive
- Adapts quickly to changing market conditions
- Better at identifying trend reversals early
- **Weaknesses**:
- More computationally intensive
- Requires careful parameter tuning
- Can be sensitive to input data quality
### Entry Strategies
| Strategy | Description | Ideal Market Conditions |
|----------|-------------|-------------------------|
| **Breakout** | Enters when price breaks through channel bands, indicating strong momentum | High volatility, emerging trends |
| **Pullback** | Enters when price retraces to the middle band after testing extremes | Established trends with regular pullbacks |
| **Mean Reversion** | Enters at channel extremes, betting on a return to the mean | Range-bound or oscillating markets |
#### Breakout Strategy (Default)
- **Implementation**: Enters long when price crosses above the upper band, short when price crosses below the lower band
- **Strengths**: Captures strong momentum moves, performs well in trending markets
- **Weaknesses**: Can lead to late entries, higher risk of false breakouts
- **Optimization Tips**:
- Increase channel multiplier for fewer but more reliable signals
- Combine with volume confirmation for better accuracy
#### Pullback Strategy
- **Implementation**: Enters long when price pulls back to middle band during uptrend, short during downtrend pullbacks
- **Strengths**: Better entry prices, lower risk, higher probability setups
- **Weaknesses**: Misses some strong moves, requires clear trend identification
- **Optimization Tips**:
- Use with trend filters to confirm overall direction
- Adjust middle band calculation for market volatility
#### Mean Reversion Strategy
- **Implementation**: Enters long at lower band, short at upper band, expecting price to revert to the mean
- **Strengths**: Excellent entry prices, works well in ranging markets
- **Weaknesses**: Dangerous in strong trends, can lead to fighting the trend
- **Optimization Tips**:
- Implement strong trend filters to avoid counter-trend trades
- Use smaller position sizes due to higher risk nature
### Confirmation Indicators
#### Pivot Point SuperTrend
Combines pivot points with ATR-based SuperTrend for trend confirmation:
| Setting | Default Value |
|---------|---------------|
| **Pivot Period** | 25 |
| **ATR Factor** | 2.2 |
| **ATR Period** | 41 |
- **Function**: Identifies significant market turning points and confirms trend direction
- **Implementation**: Requires price to respect the SuperTrend line for trade confirmation
#### Weighted Moving Average (WMA)
Provides additional confirmation layer for entries:
| Setting | Default Value |
|---------|---------------|
| **Period** | 15 |
| **Source** | ohlc4 (average of Open, High, Low, Close) |
- **Function**: Confirms trend direction and filters out low-quality signals
- **Implementation**: Price must be above WMA for longs, below for shorts
### Exit Strategies
#### On-Balance Volume (OBV) Based Exits
Uses volume flow to identify potential reversals:
| Setting | Default Value |
|---------|---------------|
| **Source** | ohlc4 |
| **MA Type** | HMA (Options: SMA, EMA, WMA, RMA, VWMA, HMA) |
| **Period** | 22 |
- **Function**: Identifies divergences between price and volume to exit before reversals
- **Implementation**: Exits when OBV crosses its moving average in the opposite direction
- **Customizable MA Type**: Different MA types provide varying sensitivity to OBV changes:
- **SMA**: Traditional simple average, equal weight to all periods
- **EMA**: More weight to recent data, responds faster to price changes
- **WMA**: Weighted by recency, smoother than EMA
- **RMA**: Similar to EMA but smoother, reduces noise
- **VWMA**: Factors in volume, helpful for OBV confirmation
- **HMA**: Reduces lag while maintaining smoothness (default)
#### ADX Exit Confirmation
Uses Average Directional Index to confirm trend exhaustion:
| Setting | Default Value |
|---------|---------------|
| **ADX Threshold** | 35 |
| **ADX Smoothing** | 60 |
| **DI Length** | 60 |
- **Function**: Confirms trend weakness before exiting positions
- **Implementation**: Requires ADX to drop below threshold or DI lines to cross
## Filter System
### RSI Filter
- **Function**: Controls entries based on momentum conditions
- **Parameters**:
- Period: 15 (default)
- Overbought level: 71
- Oversold level: 23
- Multi-timeframe support: Current, MTF1 (15min), or MTF2 (4h)
- Customizable price source (open, high, low, close, hl2, hlc3, ohlc4)
- **Implementation**: Blocks long entries when RSI > overbought, short entries when RSI < oversold
### Volatility Filter
- **Function**: Prevents trading during excessive market volatility
- **Parameters**:
- Measure: ATR (Average True Range)
- Period: Customizable (default varies by timeframe)
- Threshold: Adjustable multiplier
- Multi-timeframe support
- Customizable price source
- **Implementation**: Blocks trades when current volatility exceeds threshold × average volatility
### Volume Filter
- **Function**: Ensures adequate market liquidity for trades
- **Parameters**:
- Threshold: 0.4× average (default)
- Measurement period: 5 (default)
- Moving average type: Customizable (HMA default)
- Multi-timeframe support
- Customizable price source
- **Implementation**: Requires current volume to exceed threshold × average volume
### Bollinger Bands Filter
- **Function**: Controls entries based on price relative to statistical boundaries
- **Parameters**:
- Period: Customizable
- Standard deviation multiplier: Adjustable
- Moving average type: Customizable
- Multi-timeframe support
- Customizable price source
- **Implementation**: Can require price to be within bands or breaking out of bands depending on strategy
### KEMAD Filter (Kalman EMA Distance)
- **Function**: Advanced trend confirmation using Kalman filter algorithm
- **Parameters**:
- Process Noise: 0.35 (controls smoothness)
- Measurement Noise: 24 (controls reactivity)
- Filter Order: 6 (higher = more smoothing)
- ATR Length: 8 (for bandwidth calculation)
- Upper Multiplier: 2.0 (for long signals)
- Lower Multiplier: 2.7 (for short signals)
- Multi-timeframe support
- Customizable visual indicators
- **Implementation**: Generates signals based on price position relative to Kalman-filtered EMA bands
## Risk Management System
### Position Sizing
Automatically calculates position size based on account equity and risk parameters:
| Setting | Default Value |
|---------|---------------|
| **Risk % of Equity** | 50% |
- **Implementation**:
- Position size = (Account equity × Risk %) ÷ (Entry price × Stop loss distance)
- Adjusts automatically based on volatility and stop placement
- **Best Practices**:
- Start with lower risk percentages (1-2%) until strategy is proven
- Consider reducing risk during high volatility periods
### Stop-Loss Methods
Multiple stop-loss calculation methods with separate configurations for long and short positions:
| Method | Description | Configuration |
|--------|-------------|---------------|
| **ATR-Based** | Dynamic stops based on volatility | ATR Period: 14, Multiplier: 2.0 |
| **Percentage** | Fixed percentage from entry | Long: 1.5%, Short: 1.5% |
| **PIP-Based** | Fixed currency unit distance | 10.0 pips |
- **Implementation Notes**:
- ATR-based stops adapt to changing market volatility
- Percentage stops maintain consistent risk exposure
- PIP-based stops provide precise control in stable markets
### Trailing Stops
Locks in profits by adjusting stop-loss levels as price moves favorably:
| Setting | Default Value |
|---------|---------------|
| **Stop-Loss %** | 1.5% |
| **Activation Threshold** | 2.1% |
| **Trailing Distance** | 1.4% |
- **Implementation**:
- Initial stop remains fixed until profit reaches activation threshold
- Once activated, stop follows price at specified distance
- Locks in profit while allowing room for normal price fluctuations
### Risk-Reward Parameters
Defines the relationship between risk and potential reward:
| Setting | Default Value |
|---------|---------------|
| **Risk-Reward Ratio** | 1.4 |
| **Take Profit %** | 2.4% |
| **Stop-Loss %** | 1.5% |
- **Implementation**:
- Take profit distance = Stop loss distance × Risk-reward ratio
- Higher ratios require fewer winning trades for profitability
- Lower ratios increase win rate but reduce average profit
### Filter Combinations
The strategy allows for simultaneous application of multiple filters:
- **Recommended Combinations**:
- Trending markets: RSI + KEMAD filters
- Ranging markets: Bollinger Bands + Volatility filters
- All markets: Volume filter as minimum requirement
- **Performance Impact**:
- Each additional filter reduces the number of trades
- Quality of remaining trades typically improves
- Optimal combination depends on market conditions and timeframe
### Multi-Timeframe Filter Applications
| Filter Type | Current Timeframe | MTF1 (15min) | MTF2 (4h) |
|-------------|-------------------|-------------|------------|
| RSI | Quick entries/exits | Intraday trend | Overall trend |
| Volume | Immediate liquidity | Sustained support | Market participation |
| Volatility | Entry timing | Short-term risk | Regime changes |
| KEMAD | Precise signals | Trend confirmation | Major reversals |
## Visual Indicators and Chart Analysis
The bot provides comprehensive visual feedback on the chart:
- **Channel Bands**: Keltner or MLMA bands showing potential support/resistance
- **Pivot SuperTrend**: Colored line showing trend direction and potential reversal points
- **Entry/Exit Markers**: Annotations showing actual trade entries and exits
- **Risk/Reward Zones**: Visual representation of stop-loss and take-profit levels
These visual elements allow for:
- Real-time strategy assessment
- Post-trade analysis and optimization
- Educational understanding of the strategy logic
## Implementation Guide
### TradingView Setup
1. Load the script in TradingView Pine Editor
2. Apply to your preferred chart and timeframe
3. Adjust parameters based on your trading preferences
4. Enable alerts for webhook integration
### Webhook Integration
1. Configure webhook URL in TradingView alerts
2. Set up receiving endpoint on your trading platform
3. Define message format matching the bot's output
4. Test with small position sizes before full deployment
### Optimization Process
1. Backtest across different market conditions
2. Identify parameter sensitivity through multiple tests
3. Focus on risk management parameters first
4. Fine-tune entry/exit conditions based on performance metrics
5. Validate with out-of-sample testing
## Performance Considerations
### Strengths
- Adaptability to different market conditions through dual channels
- Multiple layers of confirmation reducing false signals
- Comprehensive risk management protecting capital
- Machine learning integration for predictive edge
### Limitations
- Complex parameter set requiring careful optimization
- Potential over-optimization risk with so many variables
- Computational intensity of MLMA calculations
- Dependency on proper webhook configuration for execution
### Best Practices
- Start with conservative risk settings (1-2% of equity)
- Test thoroughly in demo environment before live trading
- Monitor performance regularly and adjust parameters
- Consider market regime changes when evaluating results
## Conclusion
The ₿ober XM v2.0 represents a significant evolution in trading strategy design, combining traditional technical analysis with machine learning elements and multi-timeframe analysis. The core strength of this system lies in its adaptability and recognition of market asymmetry.
### Market Asymmetry and Adaptive Approach
The strategy acknowledges a fundamental truth about markets: bullish and bearish phases behave differently and should be treated as distinct environments. The dual-channel system with separate parameters for long and short positions directly addresses this asymmetry, allowing for optimized performance regardless of market direction.
### Targeted Backtesting Philosophy
It's counterproductive to run backtests over excessively long periods. Markets evolve continuously, and strategies that worked in previous market regimes may be ineffective in current conditions. Instead:
- Test specific market phases separately (bull markets, bear markets, range-bound periods)
- Regularly re-optimize parameters as market conditions change
- Focus on recent performance with higher weight than historical results
- Test across multiple timeframes to ensure robustness
### Multi-Timeframe Analysis as a Game-Changer
The integration of multi-timeframe analysis fundamentally transforms the strategy's effectiveness:
- **Increased Safety**: Higher timeframe confirmations reduce false signals and improve trade quality
- **Context Awareness**: Decisions made with awareness of larger trends reduce adverse entries
- **Adaptable Precision**: Apply strict filters on lower timeframes while maintaining awareness of broader conditions
- **Reduced Noise**: Higher timeframe data naturally filters market noise that can trigger poor entries
The ₿ober XM v2.0 provides traders with a framework that acknowledges market complexity while offering practical tools to navigate it. With proper setup, realistic expectations, and attention to changing market conditions, it delivers a sophisticated approach to systematic trading that can be continuously refined and optimized.

Multi-VWAP System🚀 Multi-VWAP System — Anchored VWAP & Deviation Bands
Overview
The Multi-VWAP System provides traders with a professional-grade approach to anchored VWAP analysis. Inspired by Brian Shannon's pioneering work on Anchored VWAP, this indicator automatically calculates and plots:
Current Session VWAP
Previous Session VWAP (also known as "2-Day VWAP")
High-of-Day (HOD) Anchored VWAP
Each VWAP can also display optional Standard Deviation Bands to highlight statistically significant deviations from the volume-weighted average price.
🔍 Why Anchored VWAP Matters
Volume Weighted Average Price (VWAP) is among the most critical institutional indicators, as it represents the average price paid for a stock adjusted by trading volume. This makes VWAP crucial for identifying fair value and significant areas of institutional activity.
Institutions utilize VWAP extensively to guide their execution algorithms. For instance, if price dips below a 2-day anchored VWAP (anchored to the previous session's open), many institutions interpret this as a discounted entry, potentially triggering large-scale buy programs. Conversely, sustained movement above VWAP signals strong buying pressure and bullish sentiment.
📌 Why Multiple Anchors?
Traders commonly anchor VWAPs at critical reference points:
Current Session VWAP:
Essential for day traders as a reference for intraday sentiment. Price action above this line generally indicates bullish sentiment, while price below signals bearish sentiment.
Previous Session (2-Day) VWAP:
Heavily used by institutions and swing traders, it provides insight into multi-session sentiment. Institutions commonly activate buy or sell programs based on whether price is trading at a premium or discount relative to this VWAP.
High-of-Day (HOD) VWAP:
Frequently used by momentum traders, this anchor captures sentiment after the most recent intraday high. Price above the HOD VWAP suggests sustained bullish momentum, while price below might signal weakening momentum.
🌟 Standard Deviation Bands
Each anchored VWAP in this indicator includes optional Standard Deviation Bands, highlighting statistical extremes. Traders use these bands to:
Identify potentially overextended moves (beyond +2σ or +3σ).
Gauge momentum strength (holding above +1σ).
Spot mean-reversion setups when price returns to VWAP after extreme moves.
🎨 Dynamic Background and Momentum Colorization
To visually highlight strength or weakness in price action relative to VWAP:
Dynamic Background Fill between Current and Previous VWAPs:
Green background appears when the Current VWAP is above the Previous VWAP and the linear regression slope (adjustable length) is positive, indicating bullish sentiment.
Red background appears when the Current VWAP is below the Previous VWAP and the slope is negative, indicating bearish sentiment.
No fill when conditions are mixed or momentum is uncertain.
Gold Fill above HOD VWAP:
When price action is above the High-of-Day VWAP and momentum (linear regression slope) is positive, a subtle gold shading appears, quickly highlighting bullish momentum.
⚙ Fully Customizable Settings
Session Times: Adjust session start and end times to match your specific market hours.
Standard Deviation Bands: Enable or disable each VWAP’s deviation bands individually and select how many bands (1σ, 2σ, or 3σ) you'd like to display.
Momentum Slope Length: Adjustable lookback for linear regression slope calculation—giving you full control of trend sensitivity.
🎯 Who Should Use This Indicator?
This indicator is perfect for:
Day Traders who want quick insights into intraday sentiment shifts.
Swing Traders tracking institutional footprints and seeking optimal entry/exit points.
Momentum Traders who rely on clearly visible momentum signals from HOD anchored VWAPs.
Institutional Traders and Professionals seeking sophisticated, institutionally-inspired VWAP analysis without manual anchoring.
📈 Summary of Features
✅ Automatic VWAP Anchors (Current Session, Previous Session, High-of-Day)
✅ Optional Standard Deviation Bands for each VWAP anchor
✅ Dynamic Background Coloring based on price action and momentum conditions
✅ Gold Momentum Highlight for quick bullish momentum identification above HOD VWAP
✅ Fully Customizable Inputs for precise personalization and flexibility
📢 Conclusion
The Multi-VWAP System isn't just another VWAP indicator. It's an institutional-level, dynamic, multi-dimensional analysis tool inspired by the work of Brian Shannon and leading institutional traders. It takes the guesswork out of anchoring and analysis, leaving you free to focus on identifying and executing high-probability trade setups.
Enjoy trading smarter—not harder. Happy Trading! 🚀📊

Adaptive ATR Limits█ OVERVIEW
This indicator plots adaptive ATR limits for intraday trading. A key feature of this indicator, which makes it different from other ATR limit indicators, is that the top and bottom ATR limit lines are always exactly one ATR apart from each other (in "auto" mode; there is also a "basic" mode, which plots the limits in the more traditional way—i.e., one ATR above the low and one ATR below the high at all times—and this can be used for comparison).
█ FEATURES
Provides an algorithm to plot the most reasonable intraday ATR top/bottom limits based on currently available information
Dynamically adapts limits as the price evolves during the day
Works correctly and consistently on both RTH and ETH charts
Has a user-selected ADR mode to base the limits on ADR instead of ATR
Option to include the current pre-market and previous day's post-market range in the calculation
Configurable ATR/ADR averaging length
Provides a visual smoothing option
Provides an information box showing the current numerical ATR/ADR values
Reasonable defaults that work well if the user changes nothing
Well-documented, high-quality, open-source code for those interested
█ HOW TO USE
At a minimum, there is nothing that needs to be set. The defaults work well. The ATR top line (red, configurable) gives you the most reasonable move given the currently available information. The line will move away from the price as the price approaches it; that is normal—it is reacting to new information. This happens until the ATR bottom limit hits the lower of the daily low and the previous day's close (in ATR mode). The ATR bottom line (green, configurable) works the same way, with reversed logic.
There is an option to use ADR instead of ATR. The ATR includes the previous day's RTH close in the range, whereas ADR does not. Another option allows the user to add the current day's pre-market range or the previous day's post-market into the current day's range, which has an effect if either of those went outside of today's RTH range, plus yesterday's RTH close (in the default ATR mode). Pre-market and post-market range is not typically included in the daily true range, so only change it if you really know you want it.
█ CONCEPTS
Most traditional ATR limit indicators plot the top ATR limit one ATR above the current daily low, and the bottom ATR limit one ATR below the current daily high. This indicator can also do that (in "basic" mode), but its value lies in its default "auto" mode, which uses an algorithm to dynamically adapt the ATR limits throughout the day, keeping them one ATR apart at all times. It tries to plot the most sensible ATR limits based on the current daily ATR, in order to provide a reasonable visual intraday target, given the available information at that point in time.
"Auto" mode is actually a weighted average of two methods: midpoint and relative (both of which can also be explicitly selected). The midpoint method places the midpoint of the ATR limit equal to the midpoint of the currently established daily range. The relative method measures the currently established daily range and calculates the position of the current price within it (as a ratio between 0 and 1). It then uses that value as a weight in a weighted average of extreme locations for the ATR limits, which are: the ATR top anchored to one ATR above the daily low, and the ATR bottom anchored to one ATR below the daily high.
The relative method is more advanced and better for most of the day; however, it can cause wild swings in the early market or pre-market before a reasonable range (as a percentage of ATR) has been established. "Auto" mode therefore takes another weighted average between the two methods, with the weight determined by the percentage of the ATR currently established within the day, more strongly weighting the calmer midpoint method before a good range is established. Once the full ATR has been achieved, the algorithm in "auto" mode will have fully switched to the relative method and will remain with that method for the rest of the day.
To explain the effect further, as an example, imagine that the price is approaching the full ATR range on the high side. At this point, the indicator will have almost fully transitioned to the second (relative) method. The lower ATR limit will now be anchored to the daily low as the price hits the upper ATR limit. If the price goes beyond the upper ATR, the lower ATR limit will stay anchored to the daily low, and the upper limit will stay anchored to one ATR above the lower limit. This allows you to see how far the price is going beyond the upper ATR limit. If the price then returns and backs off the upper ATR limit, the lower ATR limit will un-anchor from the daily low (it will actually rise, since the daily ATR range has been exceeded, so the lower ATR limit needs to come up because the actual daily range can’t fit into the ATR range anymore). The overall effect is to give you the best visual indication of where the price is in relation to a possible upper ATR-based target. Reverse this example for when the price low approaches the ATR range on the low side.
Care was taken so that the code uses no hard-coded time zones, exchanges, or session times. For this reason, it can in principle work globally. However, it very much depends on the information provided by the exchange, which is reflected in built-in Pine Script variables (see Limitations below).
█ LIMITATIONS
The indicator was developed for US/European equities and is tested on them only. It is also known to work on US futures; in this case, the whole 23-hour session is used, and the "Sessions to include in range" setting has no effect. It may or may not work as intended on security types and equities/futures for other countries.

Time-Based Fair Value Gaps (FVG) with Inversions (iFVG)Overview
The Time-Based Fair Value Gaps (FVG) with Inversions (iFVG) (ICT/SMT) indicator is a specialized tool designed for traders using Inner Circle Trader (ICT) methodologies. Inspired by LuxAlgo's Fair Value Gap indicator, this script introduces significant enhancements by integrating ICT principles, focusing on precise time-based FVG detection, inversion tracking, and retest signals tailored for institutional trading strategies. Unlike LuxAlgo’s general FVG approach, this indicator filters FVGs within customizable 10-minute windows aligned with ICT’s macro timeframes and incorporates ICT-specific concepts like mitigation, liquidity grabs, and session-based gap prioritization.
This tool is optimized for 1–5 minute charts, though probably best for 1 minute charts, identifying bullish and bearish FVGs, tracking their mitigation into inverted FVGs (iFVGs) as key support/resistance zones, and generating retest signals with customizable “Close” or “Wick” confirmation. Features like ATR-based filtering, optional FVG labels, mitigation removal, and session-specific FVG detection (e.g., first FVG in AM/PM sessions) make it a powerful tool for ICT traders.
Originality and Improvements
While inspired by LuxAlgo’s FVG indicator (credit to LuxAlgo for their foundational work), this script significantly extends the original concept by:
1. Time-Based FVG Detection: Unlike LuxAlgo’s continuous FVG identification, this script filters FVGs within user-defined 10-minute windows each hour (:00–:10, :10–:20, etc.), aligning with ICT’s emphasis on specific periods of institutional activity, such as hourly opens/closes or kill zones (e.g., New York 7:00–11:00 AM EST). This ensures FVGs are relevant to high-probability ICT setups.
2. Session-Specific First FVG Option: A unique feature allows traders to display only the first FVG in ICT-defined AM (9:30–10:00 AM EST) or PM (1:30–2:00 PM EST) sessions, reflecting ICT’s focus on initial market imbalances during key liquidity events.
3. ICT-Driven Mitigation and Inversion Logic: The script tracks FVG mitigation (when price closes through a gap) and converts mitigated FVGs into iFVGs, which serve as ICT-style support/resistance zones. This aligns with ICT’s view that mitigated gaps become critical reversal points, unlike LuxAlgo’s simpler gap display.
4. Customizable Retest Signals: Retest signals for iFVGs are configurable for “Close” (conservative, requiring candle body confirmation) or “Wick” (faster, using highs/lows), catering to ICT traders’ need for precise entry timing during liquidity grabs or Judas swings.
5. ATR Filtering and Mitigation Removal: An optional ATR filter ensures only significant FVGs are displayed, reducing noise, while mitigation removal declutters the chart by removing filled gaps, aligning with ICT’s principle that mitigated gaps lose relevance unless inverted.
6. Timezone and Timeframe Safeguards: A timezone offset setting aligns FVG detection with EST for ICT’s New York-centric strategies, and a timeframe warning alerts users to avoid ≥1-hour charts, ensuring accuracy in time-based filtering.
These enhancements make the script a distinct tool that builds on LuxAlgo’s foundation while offering ICT traders a tailored, high-precision solution.
How It Works
FVG Detection
FVGs are identified when a candle’s low is higher than the high of two candles prior (bullish FVG) or a candle’s high is lower than the low of two candles prior (bearish FVG). Detection is restricted to:
• User-selected 10-minute windows (e.g., :00–:10, :50–:60) to capture ICT-relevant periods like hourly transitions.
• AM/PM session first FVGs (if enabled), focusing on 9:30–10:00 AM or 1:30–2:00 PM EST for key market opens.
An optional ATR filter (default: 0.25× ATR) ensures only gaps larger than the threshold are displayed, prioritizing significant imbalances.
Mitigation and Inversion
When price closes through an FVG (e.g., below a bullish FVG’s bottom), the FVG is mitigated and becomes an iFVG, plotted as a support/resistance zone. iFVGs are critical in ICT for identifying reversal points where institutional orders accumulate.
Retest Signals
The script generates signals when price retests an iFVG:
• Close: Triggers when the candle body confirms the retest (conservative, lower noise).
• Wick: Triggers when the candle’s high/low touches the iFVG (faster, higher sensitivity). Signals are visualized with triangular markers (▲ for bullish, ▼ for bearish) and can trigger alerts.
Visualization
• FVGs: Displayed as colored boxes (green for bullish, red for bearish) with optional “Bull FVG”/“Bear FVG” labels.
• iFVGs: Shown as extended boxes with dashed midlines, limited to the user-defined number of recent zones (default: 5).
• Mitigation Removal: Mitigated FVGs/iFVGs are removed (if enabled) to keep the chart clean.
How to Use
Recommended Settings
• Timeframe: Use 1–5 minute charts for precision, avoiding ≥1-hour timeframes (a warning label appears if misconfigured).
• Time Windows: Enable :00–:10 and :50–:60 for hourly open/close FVGs, or use the “Show only 1st presented FVG” option for AM/PM session focus.
• ATR Filter: Keep enabled (multiplier 0.25–0.5) for significant gaps; disable on 1-minute charts for more FVGs during volatility.
• Signal Preference: Use “Close” for conservative entries, “Wick” for aggressive setups.
• Timezone Offset: Set to -5 for EST (or -4 for EDT) to align with ICT’s New York session.
Trading Strategy
1. Macro Timeframes: Focus on New York (7:00–11:00 AM EST) or London (2:00–5:00 AM EST) kill zones for high institutional activity.
2. FVG Entries: Trade bullish FVGs as support in uptrends or bearish FVGs as resistance in downtrends, especially in :00–:10 or :50–:60 windows.
3. iFVG Retests: Enter on retest signals (▲/▼) during liquidity grabs or Judas swings, using “Close” for confirmation or “Wick” for speed.
4. Session FVGs: Use the “Show only 1st presented FVG” option to target the first gap in AM/PM sessions, often tied to ICT’s market maker algorithms.
5. Risk Management: Combine with ICT concepts like order blocks or breaker blocks for confluence, and set stops beyond FVG/iFVG boundaries.
Alerts
Set alerts for:
• “Bullish FVG Detected”/“Bearish FVG Detected”: New FVGs in selected windows.
• “Bullish Signal”/“Bearish Signal”: iFVG retest confirmations.
Settings Description
• Show Last (1–100, default: 5): Number of recent iFVGs to display. Lower values reduce clutter.
• Show only 1st presented FVG : Limits FVGs to the first in 9:30–10:00 AM or 1:30–2:00 PM EST sessions (overrides time window checkboxes).
• Time Window Checkboxes: Enable/disable FVG detection in 10-minute windows (:00–:10, :10–:20, etc.). All enabled by default.
• Signal Preference: “Close” (default) or “Wick” for iFVG retest signals.
• Use ATR Filter: Enables ATR-based size filtering (default: true).
• ATR Multiplier (0–∞, default: 0.25): Sets FVG size threshold (higher values = larger gaps).
• Remove Mitigated FVGs: Removes filled FVGs/iFVGs (default: true).
• Show FVG Labels: Displays “Bull FVG”/“Bear FVG” labels (default: true).
• Timezone Offset (-12 to 12, default: -5): Aligns time windows with EST.
• Colors: Customize bullish (green), bearish (red), and midline (gray) colors.
Why Use This Indicator?
This indicator empowers ICT traders with a tool that goes beyond generic FVG detection, offering precise, time-filtered gaps and inversion tracking aligned with institutional trading principles. By focusing on ICT’s macro timeframes, session-specific imbalances, and customizable signal logic, it provides a clear edge for scalping, swing trading, or reversal setups in high-liquidity markets.

Volume-Weighted Pivot BandsThe Volume-Weighted Pivot Bands are meant to be a dynamic, rolling pivot system designed to provide traders with responsive support and resistance levels that adapt to both price volatility and volume participation. Unlike traditional daily pivot levels, this tool recalculates levels bar-by-bar using a rolling window of volume-weighted averages, making it highly relevant for intraday traders, scalpers, swing traders, and algorithmic systems alike.
-- What This Indicator Does --
This tool calculates a rolling VWAP-based pivot level, and surrounds that central pivot with up to five upper bands (R1–R5) and five lower bands (S1–S5). These act as dynamic zones of potential resistance (R) and support (S), adapting in real time to price and volume changes.
Rather than relying on static session or daily data, this indicator provides continually evolving levels, offering more relevant levels during sideways action, trending periods, and breakout conditions.
-- How the Bands Are Calculated --
Pivot (VWAP Pivot):
The core of this system is a rolling Volume-Weighted Average Price, calculated over a user-defined window (default 20 bars). This ensures that each bar’s price impact is weighted by its volume, giving a more accurate view of fair value during the selected lookback.
Volume-Weighted Range (VW Range):
The highest high and lowest low over the same window are used to calculate the volatility range — this acts as a spread factor.
Support & Resistance Bands (S1–S5, R1–R5):
The bands are offset above and below the pivot using multiples of the VW Range:
R1 = Pivot + (VW Range × multiplier)
R2 = R1 + (VW Range × multiplier)
R3 = R2 + (VW Range x multiplier)
...
S1 = Pivot − (VW Range × multiplier)
S2 = S1 − (VW Range × multiplier)
S3 = S2 - (VW Range x multiplier)
...
You can control the multiplier manually (default is 0.25), to widen or tighten band spacing.
Smoothing (Optional):
To prevent erratic movements, you can optionally toggle on/off a simple moving average to the pivot line (default length = 20), providing a smoother trend base for the bands.
-- How to Use It --
This indicator can be used for:
Support and resistance identification:
Price often reacts to R1/S1, and the outer bands (R4/R5 or S4/S5) act as overshoot zones or strong reversal areas.
Trend context:
If price is respecting upper bands (R2–R3), the trend is likely bullish. If price is pressing into S3 or lower, it may indicate sustained selling pressure or a breakdown.
Volatility framing:
The distance between bands adjusts based on price range over the rolling window. In tighter markets, the bands compress — in volatile moves, they expand. This makes the indicator self-adaptive.
Mean reversion trades:
A move into R4/R5 or S4/S5 without continuation can be a sign of exhaustion — potential for reversal toward the pivot.
Alerting:
Built-in alerts are available for crosses of all major bands (R1–R5, S1–S5), enabling trade automation or scalp alerts with ease.
-- Visual Features --
Fuchsia Lines: Mark all Resistance (R1–R5) levels.
Lime Lines: Mark all Support (S1–S5) levels.
Gray Circle Line: Marks the rolling pivot (VWAP-based).
-- Customizable Settings --
Rolling Length: Number of bars used to calculate VWAP and VW Range.
Multiplier: Controls how wide the bands are spaced.
Smooth Pivot: Toggle on/off to smooth the central pivot.
Pivot Smoothing Length: Controls how many bars to average when smoothing is enabled.
Offset: Visually shift all bands forward/backward in time.
-- Why Use This Over Standard Pivots? --
Traditional pivots are based on previous session data and remain fixed. That’s useful for static setups, but may become irrelevant as price action evolves. In contrast:
This system updates every bar, adjusting to current price behavior.
It includes volume — a key feature missing from most static pivots.
It shows multiple bands, giving a full view of compression, breakout potential, or trend exhaustion.
-- Who Is This For? --
This tool is ideal for:
Day traders & scalpers who need relevant intraday levels.
Swing traders looking for evolving areas of confluence.
Algorithmic/systematic traders who rely on quantifiable, volume-aware support/resistance.
Traders on all assets: works on crypto, stocks, futures, forex — any chart that has volume.

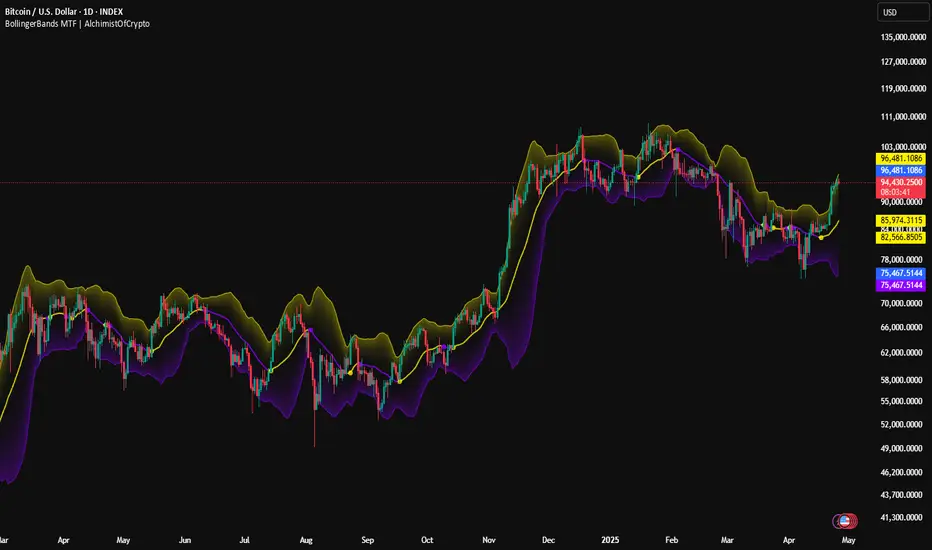
BollingerBands MTF | AlchimistOfCrypto🌌 Bollinger Bands – Unveiling Market Volatility Fields 🌌
"The Bollinger Bands, reimagined through quantum mechanics principles, visualizes the probabilistic distribution of price movements within a multi-dimensional volatility field. This indicator employs principles from wave function mathematics where standard deviation creates probabilistic boundaries, similar to electron cloud models in quantum physics. Our implementation features algorithmically enhanced visualization derived from extensive mathematical modeling, creating a dynamic representation of volatility compression and expansion cycles with adaptive glow effects that highlight the critical moments where volatility phase transitions occur."
📊 Professional Trading Application
The Bollinger Bands Quantum transcends traditional volatility measurement with a sophisticated gradient illumination system that reveals the underlying structure of market volatility fields. Scientifically calibrated for multiple timeframes and featuring eight distinct visual themes, it enables traders to perceive volatility contractions and expansions with unprecedented clarity.
⚙️ Indicator Configuration
- Volatility Field Parameters 📏
Python-optimized settings for specific market conditions:
- Period: 20 (default) - The quantum time window for volatility calculation
- StdDev Multiplier: 2.0 - The probabilistic boundary coefficient
- MA Type: SMA/EMA/VWMA/WMA/RMA - The quantum field smoothing algorithm
- Visual Theming 🎨
Eight scientifically designed visual palettes optimized for volatility pattern recognition:
- Neon (default): High-contrast green/red scheme enhancing volatility transition visibility
- Cyan-Magenta: Vibrant palette for maximum volatility boundary distinction
- Yellow-Purple: Complementary colors for enhanced compression/expansion detection
- Specialized themes (Green-Red, Forest Green, Blue Ocean, Orange-Red, Grayscale): Each calibrated for different market environments
- Opacity Control 🔍
- Variable transparency system (0-100) allowing seamless integration with price action
- Adaptive glow effect that intensifies during volatility phase transitions
- Quantum field visualization that reveals the probabilistic nature of price movements
🚀 How to Use
1. Select Visualization Parameters ⏰: Adjust period and standard deviation to match market conditions
2. Choose MA Type 🎚️: Select the appropriate smoothing algorithm for your trading strategy
3. Select Visual Theme 🌈: Choose a color scheme that enhances your personal pattern recognition
4. Adjust Opacity 🔎: Fine-tune visualization intensity to complement your chart analysis
5. Identify Volatility Phases ✅: Monitor band width to detect compression (pre-breakout) and expansion (trend)
6. Trade with Precision 🛡️: Enter during band contraction for breakouts, or trade mean reversion using band boundaries
7. Manage Risk Dynamically 🔐: Use band width as volatility-based position sizing parameter
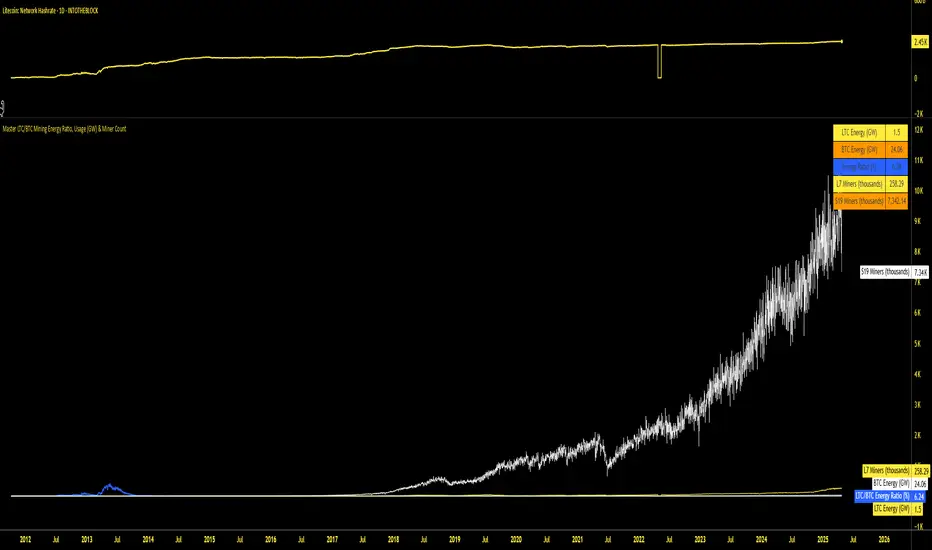
Master LTC/BTC Mining Energy Ratio, Usage (GW) & Miner CountThis Pine Script indicator, "Master LTC/BTC Mining Energy Ratio, Usage (GW) & Miner Count," calculates and visualizes key metrics for Litecoin (LTC) and Bitcoin (BTC) mining operations. Using IntoTheBlock hashrate data, it estimates the number of L7 (LTC) and S19 (BTC) miners, computes energy consumption in gigawatts (GW) based on calibrated efficiency values, and derives the LTC/BTC energy ratio as a percentage. The script plots these metrics—energy ratio, LTC/BTC energy usage, and miner counts (in thousands)—and displays a concise table summarizing the results. Assuming most miners use previous-generation hardware, it provides a clear comparison of the energy dynamics between LTC’s Scrypt and BTC’s SHA-256 algorithms.
Anchored VWAP Pro (Final Visibility Enhanced)This is a fully customizable Anchored VWAP (Volume Weighted Average Price) indicator designed for traders who prioritize precision, clarity, and macro trend analysis.
Unlike traditional VWAPs tied to daily or session data, this version allows you to manually anchor the VWAP to any candle in history—ideal for macro swing trading, cycle lows, breakouts, and reaccumulation phases.
Features:
• Manual Anchor Date: Set the exact year, month, and day for your VWAP to begin
• Custom Price Source: Choose between HLC3, close, or any OHLC-based input
• VWAP Bands: Two standard deviation bands for identifying overextension or fair value zones
• Full Visual Control:
• Toggle each band on/off individually
• Adjust color, line width, and line style (solid, dotted, dashed)
• Built for Clarity: Designed to stand out on both light and dark charts
This script is ideal for:
• Identifying macro confluence zones
• Defining risk during trend pullbacks
• Confirming breakout legitimacy
• Layering with other tools like Market Cipher, VRVP, and Fib levels
Inspired by the work of LonesomeTheBlue, Algokid, and other pros—this is a cleaner, more flexible and updated alternative for precision trading.
Script created and published by @ImmortalEmerson
For advanced swing traders, crypto analysts, and macro trend specialists.
TQ's Support & Resistance(My goal creating this indicator): Provide a way to categorize and label key structures on multiple different levels so I can create a plan based on those observable facts.
The Underlying Concept / What is Momentum?
Momentum indicates transaction pressure. If the algorithm detects price is going up, that would be considered positive momentum. If the algorithm detects price is going down negative momentum would be detected.
The Momentum shown is derived from a price action pattern. Unlike my previous Support & Resistance indicator that used Super Trend, this indicator uses a unique pattern I created. On the first bar bearish momentum is detected a resistance Level is made at the highest point of the previous bullish condition. On the first bar bullish momentum is detected a support Level is made at the lowest point of the previous bearish condition. This happens on 5 different Momentum Levels, (short-term to long-term). I currently use this pattern to trade so the source code is protected.
What is Severity?
Severity is How we differentiate the importance of different Highs and Lows. If Momentum is detected on a higher level the Supply or Demand Level is updated. The Color and Size representing that Level will be shown. Demand and Supply Levels made by higher levels are more SEVERE than a demand level made by a lower level.
Technical Inputs
- to ensure the correct calculation of Support and Resistance levels change BAR_INDEX. BAR_INDEX creates a buffer at the start of the chart. For example: If you set BAR_INDEX to 300. The script will wait for 300 bars to elapse on the current chart before running. This allows the script more time to gather data. Which is needed in order for our dynamic lookback length to never return an error (Dynamic lookback length can't be negative or zero). The lower the timeframe the greater the number of bars need. For Example, if I open up a 1min chart I would enter 5000 as my BAR_INDEX since that will provide enough data to ensure the correct calculation of Support and Resistance levels. If I was on a daily chart, I would enter a lower number such as 800. Don't be afraid to play around with this.
- Toggle options (Close) or (High & Low) creates Support and Resistance Levels using the Lowest close and Highest close or using the Lowest low and Highest high.
Level Inputs
- The indicator has 5 Different Levels indicating SEVEREITY of a Supply and Demand Levels. The higher the Level the more SEVERE the Level.
Display Inputs
- You have the option to customize the Length, Width, Line Style, and Colors of all 5 different
- This indicator includes a Trend Chart. To Easily verify the current trend of any displayed by this indicator toggle on Chart On/Off. You also get the option to change the Chart Position and the size of the Trend Chart
How Trend Is being Determined?
(Close > Current Supply Level) if this statement is true technically price made a HH, so the trend is bullish.
(Close < Current Demand Level) if this statement is true technically price made a LL, so the trend is bearish.
- Fully customize how you display Market Structure on different levels. Line Length, Line Width, Line Style, and Line color can all be customized.
How it can be used?
(Examples of Different ways you can use this indicator): Easily categorize the severity of each and every Supply or Demand Level in the market (The higher Level the stronger the level)
: Quickly Determine the trend of any Level.
: Get a consistent view of a market and how different Levels are behaving but just use one chart.
: Take the discretion from hand drawing support and resistance lines out of your trading.
: Find and categorize strong levels for potential breakouts.
: Trend Analysis, use Levels to create a narrative based on observable facts from these Levels.
: Different Targets to take money off the table.
: Use Severity to differentiate between different trend line setups.
: Find Great places to move your stop loss too.

Advanced HFT Detection with VWAP & SpreadsExplanation of the HFT Detection Strategy
🔹 1. Key Indicators Used in the Strategy
It's works by combining VWAP, moving averages (SMA), volume spikes, and price jumps to detect potential HFT activity.
✅ (A) VWAP (Volume Weighted Average Price)
VWAP acts as a benchmark price that professional traders and institutions use to execute large orders.
If price is above VWAP, buyers are in control → Bullish trend
If price is below VWAP, sellers are in control → Bearish trend
HFT algorithms often place buy orders above VWAP and sell orders below VWAP to follow momentum.
➡️ Why VWAP? It ensures that signals follow the institutional trading trend.
✅ (B) Moving Averages (SMA)
Moving averages smooth out price data and help in detecting short-term momentum changes.
Fast Moving Average (5-period SMA): Reacts quickly to price changes
Slow Moving Average (20-period SMA): Identifies trend direction
➡️ Why SMA? It filters noise and confirms short-term trend shifts.
✅ (C) Volume Spike Detection
High-frequency trading is often accompanied by large volume surges. We define a volume spike as:
📌 Current Volume > 2× Average Volume of last 20 bars
➡️ Why Volume? HFTs execute rapid buy/sell orders when they detect liquidity, leading to sudden volume bursts.
✅ (D) Price Jump Detection (Sudden Volatility)
HFT algorithms often exploit quick price movements. We check if the price has moved more than twice the ATR (Average True Range) in the last 5 bars.
➡️ Why ATR? It helps to detect abnormal price movements compared to normal volatility.
🔹 2. Trading Signal Logic
Now that we have VWAP, moving averages, volume, and price movement filters, we generate buy and sell signals based on conditions.
✅ (A) Buy Signal Condition
A BUY signal is triggered when:
✔ Fast SMA crosses above Slow SMA → Short-term trend is turning bullish
✔ Volume spike occurs → HFTs are active
✔ Sudden price jump detected → High volatility
✔ Price is above VWAP → Confirms bullish trend
➡️ Why this works? It confirms that institutional traders & HFTs are buying aggressively.
✅ (B) Sell Signal Condition
A SELL signal is triggered when:
✔ Fast SMA crosses below Slow SMA → Short-term trend is turning bearish
✔ Volume spike occurs → HFTs are selling aggressively
✔ Sudden price drop detected → High volatility
✔ Price is below VWAP → Confirms bearish trend
➡️ Why this works? It confirms that institutional traders & HFTs are selling aggressively.
🔹 3. Visual Representation (Plotting Signals & VWAP)
Once we detect buy and sell signals, we mark them on the chart.
✅ (A) Buy/Sell Markers
🟢 Buy → Green upward arrow below the candle
🔴 Sell → Red downward arrow above the candle
✅ (B) VWAP Line on Chart
We also plot VWAP as a blue line to visualize trend direction.
✅ (C) Highlighting Volume Spikes
To easily spot HFT activity, we highlight volume spike bars with a blue background.
🔹 4. How to Use This Strategy?
1️⃣ Apply this script on a 1-minute or 5-minute intraday chart.
2️⃣ Look for BUY signals above VWAP and SELL signals below VWAP.
3️⃣ Verify that the volume spikes before taking action.
4️⃣ Use stop-loss & risk management (e.g., stop-loss at recent low/high).
🚀 Summary: Why This Strategy Works?
✅ VWAP ensures we follow institutional traders
✅ Volume spikes confirm sudden liquidity inflows
✅ Price jumps detect fast market moves caused by HFT bots
✅ Moving averages smooth out short-term trend shifts
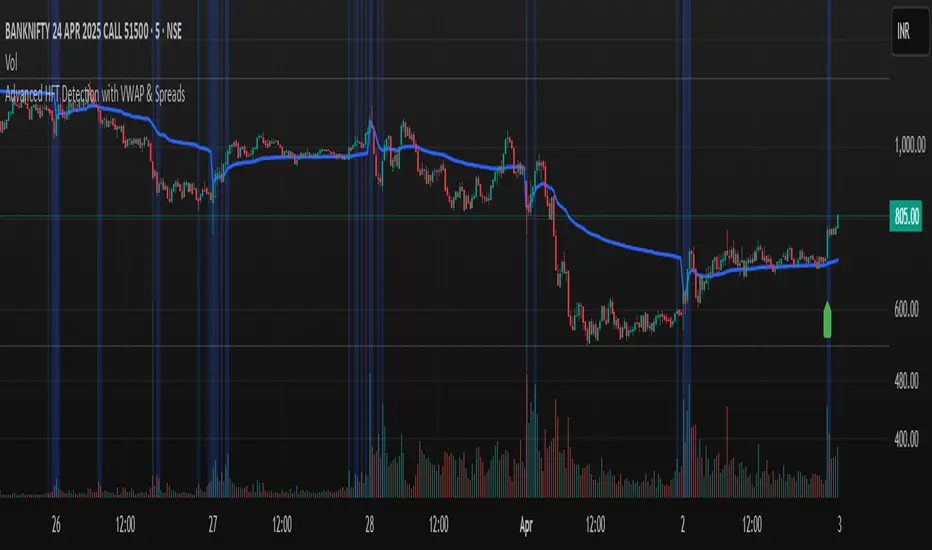
Cycle Biologique Strategy // (\_/)
// ( •.•)
// (")_(")
//@fr33domz
Experimental Research: Cycle Biologique Strategy
Overview
The "Cycle Biologique Strategy" is an experimental trading algorithm designed to leverage periodic cycles in price movements by utilizing a sinusoidal function. This strategy aims to identify potential buy and sell signals based on the behavior of a custom-defined biological cycle.
Key Parameters
Cycle Length: This parameter defines the duration of the cycle, set by default to 30 periods. The user can adjust this value to optimize the strategy for different asset classes or market conditions.
Amplitude: The amplitude of the cycle influences the scale of the sinusoidal wave, allowing for customization in the sensitivity of buy and sell signals.
Offset: The offset parameter introduces phase shifts to the cycle, adjustable within a range of -360 to 360 degrees. This flexibility allows the strategy to align with various market rhythms.
Methodology
The core of the strategy lies in the calculation of a periodic cycle using a sinusoidal function.
Trading Signals
Buy Signal: A buy signal is generated when the cycle value crosses above zero, indicating a potential upward momentum.
Sell Signal: Conversely, a sell signal is triggered when the cycle value crosses below zero, suggesting a potential downtrend.
Execution
The strategy executes trades based on these signals:
Upon receiving a buy signal, the algorithm enters a long position.
When a sell signal occurs, the strategy closes the long position.
Visualization
To enhance user experience, the periodic cycle is plotted visually on the chart in blue, allowing traders to observe the cyclical nature of the strategy and its alignment with market movements.
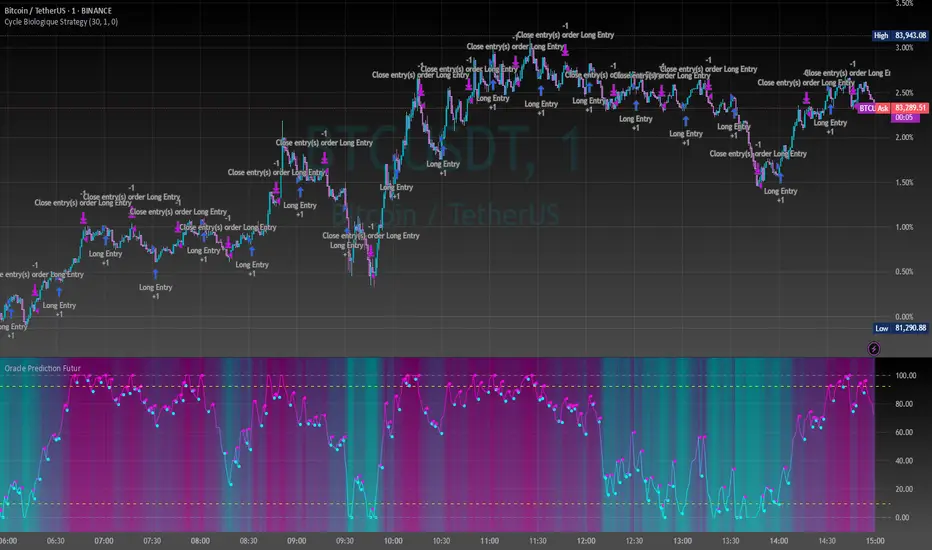
Multi-Oscillator Adaptive Kernel | AlphaAlgosMulti-Oscillator Adaptive Kernel | AlphaAlgos
Overview
The Multi-Oscillator Adaptive Kernel (MOAK) is an advanced technical analysis tool that combines multiple oscillators through sophisticated kernel-based smoothing algorithms. This indicator is designed to provide clearer trend signals while filtering out market noise, offering traders a comprehensive view of market momentum across multiple timeframes.
Key Features
• Fusion of multiple technical oscillators (RSI, Stochastic, MFI, CCI)
• Advanced kernel smoothing technology with three distinct mathematical models
• Customizable sensitivity and lookback periods
• Clear visual signals for trend shifts and reversals
• Overbought/oversold zones for precise entry and exit timing
• Adaptive signal that responds to varying market conditions
Technical Components
The MOAK indicator utilizes a multi-layer approach to signal generation:
1. Oscillator Fusion
The core of the indicator combines normalized readings from up to four popular oscillators:
• RSI (Relative Strength Index) - Measures the speed and change of price movements
• Stochastic - Compares the closing price to the price range over a specific period
• MFI (Money Flow Index) - Volume-weighted RSI that includes trading volume
• CCI (Commodity Channel Index) - Measures current price level relative to an average price
2. Kernel Smoothing
The combined oscillator data is processed through one of three kernel functions:
• Exponential Kernel - Provides stronger weighting to recent data with exponential decay
• Linear Kernel - Applies a linear weighting from most recent to oldest data points
• Gaussian Kernel - Uses a bell curve distribution that helps filter out extreme values
3. Dual Signal Lines
• Fast Signal Line - Responds quickly to price changes
• Slow Signal Line - Provides confirmation and shows the underlying trend direction
Configuration Options
Oscillator Selection:
• Enable/disable each oscillator (RSI, Stochastic, MFI, CCI)
• Customize individual lookback periods for each oscillator
Kernel Settings:
• Kernel Type - Choose between Exponential, Linear, or Gaussian mathematical models
• Kernel Length - Adjust the smoothing period (higher values = smoother line)
• Sensitivity - Fine-tune the indicator's responsiveness (higher values = more responsive)
Display Options:
• Color Bars - Toggle price bar coloring based on indicator direction
How to Interpret the Indicator
Signal Line Direction:
• Upward movement (teal) indicates bullish momentum
• Downward movement (magenta) indicates bearish momentum
Trend Shifts:
• Small circles mark the beginning of new uptrends
• X-marks indicate the start of new downtrends
Overbought/Oversold Conditions:
• Values above +50 suggest overbought conditions (potential reversal or pullback)
• Values below -50 suggest oversold conditions (potential reversal or bounce)
Trading Strategies
Trend Following:
• Enter long positions when the signal line turns teal and shows an uptrend
• Enter short positions when the signal line turns magenta and shows a downtrend
• Use the slow signal line (area fill) as confirmation of the underlying trend
Counter-Trend Trading:
• Look for divergences between price and the indicator
• Consider profit-taking when the indicator reaches overbought/oversold areas
• Wait for trend shift signals before entering counter-trend positions
Multiple Timeframe Analysis:
• Use the indicator across different timeframes for confirmation
• Higher timeframe signals carry more weight than lower timeframe signals
Best Practices
• Experiment with different kernel types for various market conditions
• Gaussian kernels often work well in ranging markets
• Exponential kernels can provide earlier signals in trending markets
• Combine with volume analysis for higher probability trades
• Use appropriate stop-loss levels as the indicator does not guarantee price movements
This indicator is provided as-is with no guarantees of profit. Always use proper risk management when trading with any technical indicator. Nothing is financial advise.
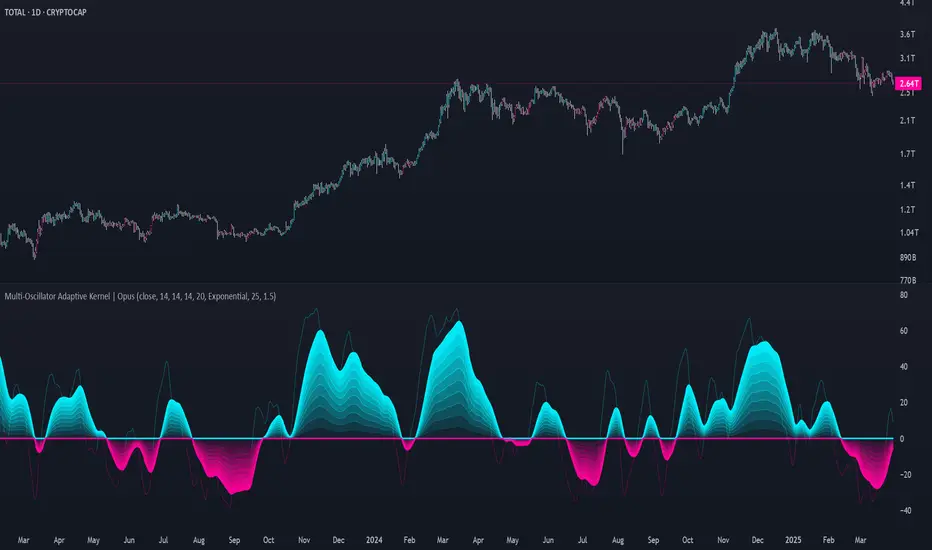
Market Structure Break with Volume & ATR#### Indicator Overview:
The *Market Structure Break with Volume & ATR (MSB+VolATR)* indicator is designed to identify significant market structure breakouts and breakdowns using a combination of price action, volume analysis, and volatility (ATR). It is particularly useful for traders who rely on higher timeframes for swing trading or positional trading. The indicator highlights bullish and bearish breakouts, retests, fakeouts, and potential buy/sell signals based on RSI overbought/oversold conditions.
---
### Key Features:
1. *Market Structure Analysis*:
- Identifies swing highs and lows on a user-defined higher timeframe.
- Detects breakouts and breakdowns when price exceeds these levels with volume and ATR validation.
2. *Volume Validation*:
- Ensures breakouts are accompanied by above-average volume, reducing the likelihood of false signals.
3. *ATR Filter*:
- Filters out insignificant breakouts by requiring the breakout size to exceed a multiple of the ATR.
4. *RSI Integration*:
- Adds a momentum filter by considering overbought/oversold conditions using RSI.
5. *Visual Enhancements*:
- Draws colored boxes to highlight breakout zones.
- Labels breakouts, retests, and fakeouts for easy interpretation.
- Displays stop levels for potential trades.
6. *Alerts*:
- Provides alert conditions for buy and sell signals, enabling real-time notifications.
---
### Input Settings and Their Effects:
1. **Timeframe (tf):
- Determines the higher timeframe for market structure analysis.
- *Effect*: A higher timeframe (e.g., 1D) reduces noise and provides more reliable swing points, while a lower timeframe (e.g., 4H) may generate more frequent but less reliable signals.
2. **Lookback Period (length):
- Defines the number of historical bars used to identify significant highs and lows.
- *Effect*: A longer lookback period (e.g., 50) captures broader market structure, while a shorter period (e.g., 20) reacts faster to recent price action.
3. **ATR Length (atr_length):
- Sets the period for ATR calculation.
- *Effect*: A shorter ATR length (e.g., 14) reacts faster to recent volatility, while a longer length (e.g., 21) smooths out volatility spikes.
4. **ATR Multiplier (atr_multiplier):
- Filters insignificant breakouts by requiring the breakout size to exceed ATR × multiplier.
- *Effect*: A higher multiplier (e.g., 0.2) reduces false signals but may miss smaller breakouts.
5. **Volume Multiplier (volume_multiplier):
- Sets the volume threshold for breakout validation.
- *Effect*: A higher multiplier (e.g., 1.0) ensures stronger volume confirmation but may reduce the number of signals.
6. **RSI Length (rsi_length):
- Defines the period for RSI calculation.
- *Effect*: A shorter RSI length (e.g., 10) makes the indicator more sensitive to recent price changes, while a longer length (e.g., 20) smooths out RSI fluctuations.
7. *RSI Overbought/Oversold Levels*:
- Sets the thresholds for overbought (default: 70) and oversold (default: 30) conditions.
- *Effect*: Adjusting these levels can make the indicator more or less conservative in generating signals.
8. **Stop Loss Multiplier (SL_Multiplier):
- Determines the distance of the stop-loss level from the entry price based on ATR.
- *Effect*: A higher multiplier (e.g., 2.0) provides wider stops, reducing the risk of being stopped out prematurely but increasing potential losses.
---
### How It Works:
1. *Breakout Detection*:
- A bullish breakout occurs when the close exceeds the highest high of the lookback period, with volume above the threshold and breakout size exceeding ATR × multiplier.
- A bearish breakout occurs when the close falls below the lowest low of the lookback period, with similar volume and ATR validation.
2. *Retest Logic*:
- After a breakout, if price retests the breakout zone without closing beyond it, a retest label is displayed.
3. *Fakeout Detection*:
- If price briefly breaks out but reverses back into the range, a fakeout label is displayed.
4. *Buy/Sell Signals*:
- A sell signal is generated when price reverses below a bullish breakout zone and RSI is overbought.
- A buy signal is generated when price reverses above a bearish breakout zone and RSI is oversold.
5. *Stop Levels*:
- Stop-loss levels are plotted based on ATR × SL_Multiplier, providing a visual guide for risk management.
---
### Who Can Use It and How:
1. *Swing Traders*:
- Use the indicator on daily or 4-hour timeframes to identify high-probability breakout trades.
- Combine with other technical analysis tools (e.g., trendlines, Fibonacci levels) for confirmation.
2. *Positional Traders*:
- Apply the indicator on weekly or daily charts to capture long-term trends.
- Use the stop-loss levels to manage risk over extended periods.
3. *Algorithmic Traders*:
- Integrate the buy/sell signals into automated trading systems.
- Use the alert conditions to trigger trades programmatically.
4. *Risk-Averse Traders*:
- Adjust the ATR and volume multipliers to filter out low-probability trades.
- Use wider stop-loss levels to avoid premature exits.
---
### Where to Use It:
- *Forex*: Identify breakouts in major currency pairs.
- *Stocks*: Spot trend reversals in high-volume stocks.
- *Commodities*: Trade breakouts in gold, oil, or other commodities.
- *Crypto*: Apply to Bitcoin, Ethereum, or other cryptocurrencies for volatile breakout opportunities.
---
### Example Use Case:
- *Timeframe*: 1D
- *Lookback Period*: 50
- *ATR Length*: 14
- *ATR Multiplier*: 0.1
- *Volume Multiplier*: 0.5
- *RSI Length*: 14
- *RSI Overbought/Oversold*: 70/30
- *SL Multiplier*: 1.5
In this setup, the indicator will:
1. Identify significant swing highs and lows on the daily chart.
2. Validate breakouts with volume and ATR filters.
3. Generate buy/sell signals when price reverses and RSI confirms overbought/oversold conditions.
4. Plot stop-loss levels for risk management.
---
### Conclusion:
The *MSB+VolATR* indicator is a versatile tool for traders seeking to capitalize on market structure breakouts with added confirmation from volume and volatility. By customizing the input settings, traders can adapt the indicator to their preferred trading style and risk tolerance. Whether you're a swing trader, positional trader, or algorithmic trader, this indicator provides actionable insights to enhance your trading strategy.

Machine Learning Trendlines Cluster [LuxAlgo]The ML Trendlines Cluster indicator allows traders to automatically identify trendlines using a machine learning algorithm based on k-means clustering and linear regression, highlighting trendlines from clustered prices.
For trader's convenience, trendlines can be filtered based on their slope, allowing them to filter out trendlines that are too horizontal, or instead keep them depending on the user-selected settings.
🔶 USAGE
Traders only need to set the number of trendlines (clusters) they want the tool to detect and the algorithm will do the rest.
By default the tool is set to detect 4 clusters over the last 500 bars, in the image above it is set to detect 10 clusters over the same period.
This approach only focuses on drawing trendlines from prices that share a common trading range, offering a unique perspective to traditional trendlines. Trendlines with a significant slope can highlight higher dispersion within its cluster.
🔹 Trendline Slope Filtering
Traders can filter trendlines by their slope to display only steep or flat trendlines relative to a user-defined threshold.
The image above shows the three different configurations of this feature:
Filtering disabled
Filter slopes above threshold
Filter slopes below threshold
🔶 DETAILS
K-means clustering is a popular machine-learning algorithm that finds observations in a data set that are similar to each other and places them in a group.
The process starts by randomly assigning each data point to an initial group and calculating the centroid for each. A centroid is the center of the group. K-means clustering forms the groups in such a way that the variances between the data points and the centroid of the cluster are minimized.
The trendlines are displayed according to the linear regression function calculated for each cluster.
🔶 SETTINGS
Window Size: Maximum number of bars to get data from
Clusters: Maximum number of clusters (trendlines) to detect
🔹 Optimization
Maximum Iteration Steps: Maximum loop iterations for cluster computation
🔹 Slope Filter
Threshold Multiplier: Multiplier applied to a volatility measure, higher multiplier equals higher threshold
Filter Slopes: Enable/Disable Trendline Slope Filtering, select to filter trendlines with slopes ABOVE or BELOW the threshold
🔹 Style
Upper Zone: Color to display in the top zone
Lower Zone: Color to display in the bottom zone
Lines: Style for the lines
Size: Line size

EZ_Algo Copyright label
This script overlays a fully adjustable watermark on your chart, featuring:
A bold Main Title (e.g., your brand or name) and Subtitle (e.g., a tagline or ID).
Optional extras like a copyright notice, logo symbol, warning message, and chart info (symbol, timeframe, timestamp, or close price).
A subtle repeating overlay pattern to deter theft.
Flexible positioning, sizing, and color options to match your vib
e
It’s built for traders who want to protect their charts and make them stand out, all in a few clicks.
How to Use It
Add to Chart: Click "Add to Chart" and watch the default watermark appear (e.g., "EZ ALGO" at the top).
Customize It:
Main Title: Set your brand (e.g., "EZ ALGO") under "Main Title". Tweak color, size, and alignment.
Subtitle: Add a tagline (e.g., "Algo Trading") and trader ID (e.g., "@EZ_Algo
") with matching style options.
Text Opacity: Adjust "Text Opacity" in "Appearance" to control title and subtitle transparency (0 = solid, 100 = invisible).
Chart Info: Toggle "Show Chart Info" to display symbol and timestamp, or add "Show Close Price" for extra data.
Extras: Enable "Show Copyright" for a © notice, "Show Logo" for a symbol (e.g., ★), or "Show Warning" to shout "DO NOT COPY".
Overlay Pattern: Turn on "Show Overlay Pattern" to repeat a phrase (e.g., "EZ Algo") across the chart.
Positioning: Pick vertical/horizontal spots (top, middle, bottom; left, center, right) or try "Randomize Main Position" for a surprise placement.
Appearance: Set a "Background Color" and "Background Opacity" for the watermark’s backdrop.
Cell Size: Adjust "Cell Width (%)" and "Cell Height (%)" to resize the watermark (0 = auto-fit).
Apply & Share: Hit "OK" to save settings, then screenshot or share your branded chart with confidence!
Tips
Use a semi-transparent background (e.g., 50 opacity) to keep the chart readable.
Experiment with "Randomize Main Position" for a dynamic look.
Pair a bold logo with a faint overlay pattern for max branding power.
Credits
Inspired by @KristaKT
thanks for the great ideas!
Enjoy marking your charts with flair and protection! Questions? Drop a comment below.

[GYTS-CE] Market Regime Detector🧊 Market Regime Detector (Community Edition)
🌸 Part of GoemonYae Trading System (GYTS) 🌸
🌸 --------- INTRODUCTION --------- 🌸
💮 What is the Market Regime Detector?
The Market Regime Detector is an advanced, consensus-based indicator that identifies the current market state to increase the probability of profitable trades. By distinguishing between trending (bullish or bearish) and cyclic (range-bound) market conditions, this detector helps you select appropriate tactics for different environments. Instead of forcing a single strategy across all market conditions, our detector allows you to adapt your approach based on real-time market behaviour.
💮 The Importance of Market Regimes
Markets constantly shift between different behavioural states or "regimes":
• Bullish trending markets - characterised by sustained upward price movement
• Bearish trending markets - characterised by sustained downward price movement
• Cyclic markets - characterised by range-bound, oscillating behaviour
Each regime requires fundamentally different trading approaches. Trend-following strategies excel in trending markets but fail in cyclic ones, while mean-reversion strategies shine in cyclic markets but underperform in trending conditions. Detecting these regimes is essential for successful trading, which is why we've developed the Market Regime Detector to accurately identify market states using complementary detection methods.
🌸 --------- KEY FEATURES --------- 🌸
💮 Consensus-Based Detection
Rather than relying on a single method, our detector employs two complementary detection methodologies that analyse different aspects of market behaviour:
• Dominant Cycle Average (DCA) - analyzes price movement relative to its lookback period, a proxy for the dominant cycle
• Volatility Channel - examines price behaviour within adaptive volatility bands
These diverse perspectives are synthesised into a robust consensus that minimises false signals while maintaining responsiveness to genuine regime changes.
💮 Dominant Cycle Framework
The Market Regime Detector uses the concept of dominant cycles to establish a reference framework. You can input the dominant cycle period that best represents the natural rhythm of your market, providing a stable foundation for regime detection across different timeframes.
💮 Intuitive Parameter System
We've distilled complex technical parameters into intuitive controls that traders can easily understand:
• Adaptability - how quickly the detector responds to changing market conditions
• Sensitivity - how readily the detector identifies transitions between regimes
• Consensus requirement - how much agreement is needed among detection methods
This approach makes the detector accessible to traders of all experience levels while preserving the power of the underlying algorithms.
💮 Visual Market Feedback
The detector provides clear visual feedback about the current market regime through:
• Colour-coded chart backgrounds (purple shades for bullish, pink for bearish, yellow for cyclic)
• Colour-coded price bars
• Strength indicators showing the degree of consensus
• Customizable colour schemes to match your preferences or trading system
💮 Integration in the GYTS suite
The Market Regime Detector is compatible with the GYTS Suite , i.e. it passes the regime into the 🎼 Order Orchestrator where you can set how to trade the trending and cyclic regime.
🌸 --------- CONFIGURATION SETTINGS --------- 🌸
💮 Adaptability
Controls how quickly the Market Regime detector adapts to changing market conditions. You can see it as a low-frequency, long-term change parameter:
Very Low: Very slow adaptation, most stable but may miss regime changes
Low: Slower adaptation, more stability but less responsiveness
Normal: Balanced between stability and responsiveness
High: Faster adaptation, more responsive but less stable
Very High: Very fast adaptation, highly responsive but may generate false signals
This setting affects lookback periods and filter parameters across all detection methods.
💮 Sensitivity
Controls how sensitive the detector is to market regime transitions. This acts as a high-frequency, short-term change parameter:
Very Low: Requires substantial evidence to identify a regime change
Low: Less sensitive, reduces false signals but may miss some transitions
Normal: Balanced sensitivity suitable for most markets
High: More sensitive, detects subtle regime changes but may have more noise
Very High: Very sensitive, detects minor fluctuations but may produce frequent changes
This setting affects thresholds for regime detection across all methods.
💮 Dominant Cycle Period
This parameter allows you to specify the market's natural rhythm in bars. This represents a complete market cycle (up and down movement). Finding the right value for your specific market and timeframe might require some experimentation, but it's a crucial parameter that helps the detector accurately identify regime changes. Most of the times the cycle is between 20 and 40 bars.
💮 Consensus Mode
Determines how the signals from both detection methods are combined to produce the final market regime:
• Any Method (OR) : Signals bullish/bearish if either method detects that regime. If methods conflict (one bullish, one bearish), the stronger signal wins. More sensitive, catches more regime changes but may produce more false signals.
• All Methods (AND) : Signals only when both methods agree on the regime. More conservative, reduces false signals but might miss some legitimate regime changes.
• Weighted Decision : Balances both methods with equal weighting. Provides a middle ground between sensitivity and stability.
Each mode also calculates a continuous regime strength value that's used for colour intensity in the 'unconstrained' display mode.
💮 Display Mode
Choose how to display the market regime colours:
• Unconstrained regime: Shows the regime strength as a continuous gradient. This provides more nuanced visualisation where the intensity of the colour indicates the strength of the trend.
• Consensus only: Shows only the final consensus regime with fixed colours based on the detected regime type.
The background and bar colours will change to indicate the current market regime:
• Purple shades: Bullish trending market (darker purple indicates stronger bullish trend)
• Pink shades: Bearish trending market (darker pink indicates stronger bearish trend)
• Yellow: Cyclic (range-bound) market
💮 Custom Colour Options
The Market Regime Detector allows you to customize the colour scheme to match your personal preferences or to coordinate with other indicators:
• Use custom colours: Toggle to enable your own colour choices instead of the default scheme
• Transparency: Adjust the transparency level of all regime colours
• Bullish colours: Define custom colours for strong, medium, weak, and very weak bullish trends
• Bearish colours: Define custom colours for strong, medium, weak, and very weak bearish trends
• Cyclic colour: Define a custom colour for cyclic (range-bound) market conditions
🌸 --------- DETECTION METHODS --------- 🌸
💮 Dominant Cycle Average (DCA)
The Dominant Cycle Average method forms a key part of our detection system:
1. Theoretical Foundation :
The DCA method builds on cycle analysis and the observation that in trending markets, price consistently remains on one side of a moving average calculated using the dominant cycle period. In contrast, during cyclic markets, price oscillates around this average.
2. Calculation Process :
• We calculate a Simple Moving Average (SMA) using the specified lookback period - a proxy for the dominant cycle period
• We then analyse the proportion of time that price spends above or below this SMA over a lookback window. The theory is that the price should cross the SMA each half cycle, assuming that the dominant cycle period is correct and price follows a sinusoid.
• This lookback window is adaptive, scaling with the dominant cycle period (controlled by the Adaptability setting)
• The different values are standardised and normalised to possess more resolving power and to be more robust to noise.
3. Regime Classification :
• When the normalised proportion exceeds a positive threshold (determined by Sensitivity setting), the market is classified as bullish trending
• When it falls below a negative threshold, the market is classified as bearish trending
• When the proportion remains between these thresholds, the market is classified as cyclic
💮 Volatility Channel
The Volatility Channel method complements the DCA method by focusing on price movement relative to adaptive volatility bands:
1. Theoretical Foundation :
This method is based on the observation that trending markets tend to sustain movement outside of normal volatility ranges, while cyclic markets tend to remain contained within these ranges. By creating adaptive bands that adjust to current market volatility, we can detect when price behaviour indicates a trending or cyclic regime.
2. Calculation Process :
• We first calculate a smooth base channel center using a low pass filter, creating a noise-reduced centreline for price
• True Range (TR) is used to measure market volatility, which is then smoothed and scaled by the deviation factor (controlled by Sensitivity)
• Upper and lower bands are created by adding and subtracting this scaled volatility from the centreline
• Price is smoothed using an adaptive A2RMA filter, which has a very flat and stable behaviour, to reduce noise while preserving trend characteristics
• The position of this smoothed price relative to the bands is continuously monitored
3. Regime Classification :
• When smoothed price moves above the upper band, the market is classified as bullish trending
• When smoothed price moves below the lower band, the market is classified as bearish trending
• When price remains between the bands, the market is classified as cyclic
• The magnitude of price's excursion beyond the bands is used to determine trend strength
4. Adaptive Behaviour :
• The smoothing periods and deviation calculations automatically adjust based on the Adaptability setting
• The measured volatility is calculated over a period proportional to the dominant cycle, ensuring the detector works across different timeframes
• Both the center line and the bands adapt dynamically to changing market conditions, making the detector responsive yet stable
This method provides a unique perspective that complements the DCA approach, with the consensus mechanism synthesising insights from both methods.
🌸 --------- USAGE GUIDE --------- 🌸
💮 Starting with Default Settings
The default settings (Normal for Adaptability and Sensitivity, Weighted Decision for Consensus Mode) provide a balanced starting point suitable for most markets and timeframes. Begin by observing how these settings identify regimes in your preferred instruments.
💮 Finding the Optimal Dominant Cycle
The dominant cycle period is a critical parameter. Here are some approaches to finding an appropriate value:
• Start with typical values, usually something around 25 works well
• Visually identify the average distance between significant peaks and troughs
• Experiment with different values and observe which provides the most stable regime identification
• Consider using cycle-finding indicators to help identify the natural rhythm of your market
💮 Adjusting Parameters
• If you notice too many regime changes → Decrease Sensitivity or increase Consensus requirement
• If regime changes seem delayed → Increase Adaptability
• If a trending regime is not detected, the market is automatically assigned to be in a cyclic state
• If you want to see more nuanced regime transitions → Try the "unconstrained" display mode (note that this will not affect the output to other indicators)
💮 Trading Applications
Regime-Specific Strategies:
• Bullish Trending Regime - Use trend-following strategies, trail stops wider, focus on breakouts, consider holding positions longer, and emphasize buying dips
• Bearish Trending Regime - Consider shorts, tighter stops, focus on breakdown points, sell rallies, implement downside protection, and reduce position sizes
• Cyclic Regime - Apply mean-reversion strategies, trade range boundaries, apply oscillators, target definable support/resistance levels, and use profit-taking at extremes
Strategy Switching:
Create a set of rules for each market regime and switch between them based on the detector's signal. This approach can significantly improve performance compared to applying a single strategy across all market conditions.
GYTS Suite Integration:
• In the GYTS 🎼 Order Orchestrator, select the '🔗 STREAM-int 🧊 Market Regime' as the market regime source
• Note that the consensus output (i.e. not the "unconstrained" display) will be used in this stream
• Create different strategies for trending (bullish/bearish) and cyclic regimes. The GYTS 🎼 Order Orchestrator is specifically made for this.
• The output stream is actually very simple, and can possibly be used in indicators and strategies as well. It outputs 1 for bullish, -1 for bearish and 0 for cyclic regime.
🌸 --------- FINAL NOTES --------- 🌸
💮 Development Philosophy
The Market Regime Detector has been developed with several key principles in mind:
1. Robustness - The detection methods have been rigorously tested across diverse markets and timeframes to ensure reliable performance.
2. Adaptability - The detector automatically adjusts to changing market conditions, requiring minimal manual intervention.
3. Complementarity - Each detection method provides a unique perspective, with the collective consensus being more reliable than any individual method.
4. Intuitiveness - Complex technical parameters have been abstracted into easily understood controls.
💮 Ongoing Refinement
The Market Regime Detector is under continuous development. We regularly:
• Fine-tune parameters based on expanded market data
• Research and integrate new detection methodologies
• Optimise computational efficiency for real-time analysis
Your feedback and suggestions are very important in this ongoing refinement process!
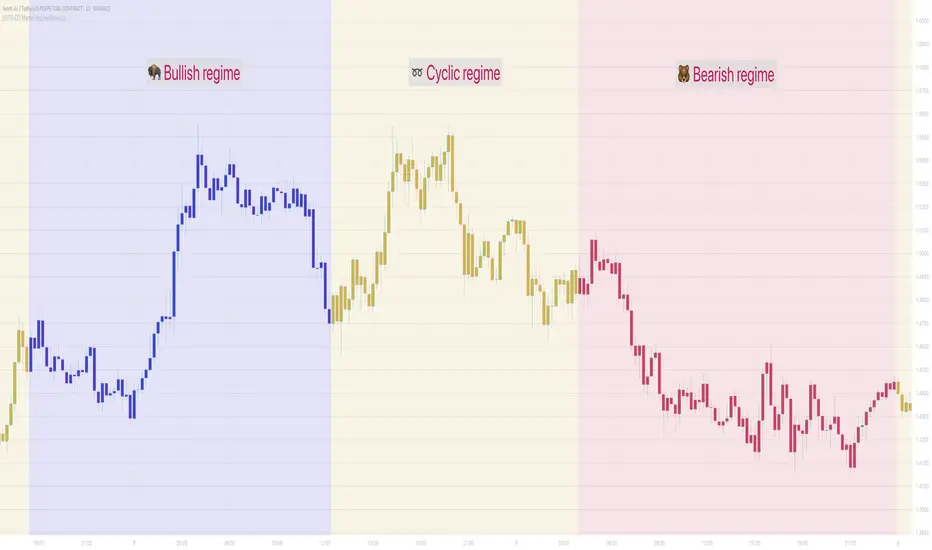
Mehul - ADX Zero LagThis script combines two popular technical indicators into a single visualization:
1. **Average Directional Index (ADX)**:
- Measures trend strength on a scale from 0-100 (now normalized to 0-1 by dividing by 100)
- Displayed as a red line
- Adjustable smoothing and length parameters
2. **Zero Lag MACD (Modified Moving Average Convergence Divergence)**:
- An enhanced version of the traditional MACD with reduced lag
- Shows the relationship between fast and slow moving averages
- Main components include:
- MACD line (black)
- Signal line (gray)
- Histogram (green for positive, purple for negative)
- EMA of the MACD line (red)
- Optional crossing dots
Key features of the combined indicator:
- **Scale Adjustment**: Both indicators can be scaled independently (adxScale and macdScale parameters)
- **Visibility Toggles**: Each indicator can be shown or hidden
- **Advanced Customization**: Parameters for both indicators can be fine-tuned
- **Algorithm Selection**: Option to choose between the "Glaz" algorithm or the "real" zero lag algorithm
- **Display Options**: Toggles for visualization elements like crossing dots
The most significant technical aspect is that both indicators are displayed in the same pane with compatible scaling, achieved by normalizing the ADX values and applying user-defined scale factors to both indicators.
This combined indicator is designed to give traders a comprehensive view of both trend strength (from ADX) and momentum/direction (from Zero Lag MACD) in a single, easy-to-read visualization.
Hierarchical + K-Means Clustering Strategy===== USER GUIDE =====
Hierarchical + K-Means Clustering Strategy
OVERVIEW:
This strategy combines hierarchical clustering and K-means algorithms to analyze market volatility patterns
and generate trading signals. It uses a modified SuperTrend indicator with ATR-based volatility clustering
to identify potential trend changes and market conditions.
KEY FEATURES:
- Advanced volatility analysis using hierarchical clustering and K-means algorithms
- Modified SuperTrend indicator for trend identification
- Multiple filter options including moving average and ADX trend strength
- Volume-based exit mechanism to protect profits
- Customizable appearance settings
SETTINGS EXPLANATION:
1. SuperTrend Settings:
- ATR Length: Period for ATR calculation (default: 11)
- SuperTrend Factor: Multiplier for ATR to determine trend bands (default: 3)
2. Hierarchical Clustering Settings:
- Training Data Length: Number of bars used for clustering analysis (default: 200)
3. Appearance Settings:
- Transparency 1 & 2: Control the opacity of trend lines and fills
- Bullish/Bearish Color: Colors for uptrend and downtrend visualization
4. Time Settings:
- Start Year/Month: Define when the strategy should start executing trades
5. Filter Settings:
- Moving Average Filter: Uses SMA to filter trades (only enter when price is on correct side of MA)
- Trend Strength Filter: Uses ADX to ensure trades are taken in strong trend conditions
6. Volume Stop Loss Settings:
- Volume Ratio Threshold: Controls sensitivity of volume-based exits
- Monitoring Delay Bars: Number of bars to wait before monitoring volume for exit signals
HOW TO USE:
1. Apply the indicator to your chart
2. Adjust settings according to your trading preferences and timeframe
3. Long signals appear when price crosses above the SuperTrend line (▲k marker)
4. Short signals appear when price crosses below the SuperTrend line (▼k marker)
5. The strategy automatically manages exits based on volume balance conditions
INTERPRETATION:
- Green line/area: Bullish trend - consider long positions
- Red line/area: Bearish trend - consider short positions
- Yellow line: Moving average for additional trend confirmation
- Volume balance exits occur when buying/selling pressure equalizes
RECOMMENDED TIMEFRAMES:
This strategy works best on 1H, 4H, and daily charts for most markets.
For highly volatile assets, shorter timeframes may also be effective.
RISK MANAGEMENT:
Always use proper position sizing and consider setting additional stop losses
beyond the strategy's built-in exit mechanisms.
===== END OF USER GUIDE =====

Profit Hunter @DaviddTechProfit Hunter @DaviddTech is an advanced multi-strategy indicator designed to give traders a significant edge in identifying high-probability trading opportunities across all market conditions. By combining the power of T3 adaptive moving averages, ADX-based trend strength analysis, SuperTrend trailing stops, and dynamic support/resistance detection, this indicator delivers a complete trading system in one powerful package.
## 📊 Recommended Usage
Timeframes: Most effective on 1H, 4H, and Daily charts for swing trading; 5M and 15M for day trading
Markets: Works across all markets including Forex, Crypto, Indices, and Stocks
Setup Guidelines: Look for T3 crossovers with strong ADX readings (>25) coinciding with breakout signals (yellow dots/red crosses) near key support/resistance levels for highest probability entries
## 🔥 Key Features:
### T3 Adaptive Trend Detection:
Utilizes premium T3 adaptive indicators instead of standard EMAs for superior smoothing and accuracy
Dynamic color-shifting cloud formation between fast and slow T3 lines reveals immediate trend direction
Proprietary transparency algorithm intensifies cloud colors during strong trends based on real-time ADX readings
### Advanced Support & Resistance Mapping:
Automatically identifies and marks key market structure levels during T3 crossovers
Dynamic horizontal level plotting with optional extension for monitoring future price interactions
Intelligent level validation - converts to dotted lines when price breaks through, maintaining visual clarity
### SuperTrend Trailing Stoploss System:
Professional-grade white trailing stop indicator adapts to market volatility using ATR calculations
Generates precise entry and exit signals with optional buy/sell labels at critical reversal points
Visual trend state highlighting for immediate assessment of current market position
### Breakout Detection & Confirmation:
Sophisticated dual-algorithm breakout system combining Bollinger Bands and Keltner Channels
Visual breakout alerts with yellow dots (bullish) and red crosses (bearish) for instant pattern recognition
Validates breakouts against T3 trend direction to minimize false signals
### Alpha Edge Color System:
Utilizes DaviddTech's signature color scheme with bullish green and bearish pink
Revolutionary transparency algorithm translates ADX readings into precise visual intensity
Higher ADX values produce more vivid colors, instantly communicating trend strength without additional indicators
## 💰 Trading Applications:
Alpha Discovery: Identify emerging trends before the majority of market participants
Precision Entry/Exit: Use SuperTrend signals combined with support/resistance levels for optimal trade execution
Risk Management: Set stops based on the white trailing stoploss line for mathematically-optimized protection
Trend Confirmation: Validate setups using the T3 cloud direction and ADX-based intensity
Breakout Trading: Capture explosive moves with confirmed Bollinger/Keltner breakout signals
Swing Position Management: Monitor extended support/resistance levels for multi-day positioning
## ✨ Strategy Example
As shown in the chart image, ideal entries occur when:
The T3 cloud turns bullish (green) or bearish (pink) with strong color intensity
A yellow dot (bullish) or red cross (bearish) breakout signal appears
Price respects the white SuperTrend line as support/resistance
The trade aligns with key horizontal support/resistance levels identified by the indicator
## 📝 Attribution
This indicator builds upon and enhances concepts from:
Market Trend Levels Detector by BigBeluga (support/resistance detection framework)
T3 indicator implementation by DaviddTech (adaptive moving average system)
Average Directional Index (ADX) methodology for trend strength measurement
Profit Hunter @DaviddTech represents the culmination of advanced technical analysis methodologies in one seamless system.
