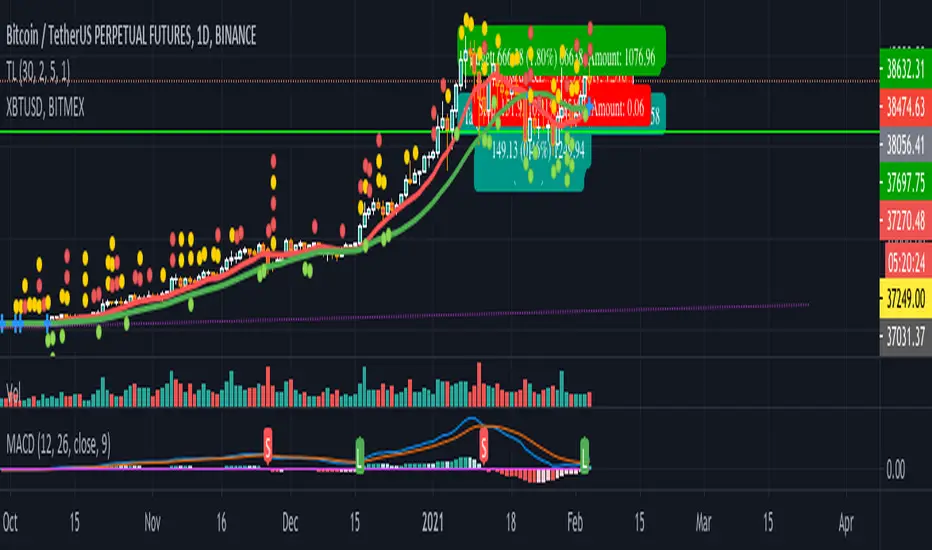
MultiPrice AlertThis is an alert script using Pinescript version 4. This enables one to set 5 alerts (1 StopLoss, 4 Targets), on 3 different symbols, at using a single alert in the UI.
Every visible line will only appear on the symbols that are selected. After setting targets when making an alert, select this indicator as a condition. Change the name to whatever you want, usually the names of the set of tickers.
The Alert message is dyanmic showing which Symbol with each type of alert, at whatever price.
Ability to disable the targets + symbols.
Alerts work by Stop Loss crossing under price and Targets Cross Over. Enabling the "Short" Targets reverses this.
The line that is being displayed is actually the price of the asset being moved over x number of bars. I have not found a way to plot a traditional horizontal line, as the code for it uses a fixed price.
As it being a user input, it is a variable. Any help with this would be appreicated.
Alerts are set to once per bar.
Known bug that sometimes if the prices that you set are inside the current candle stick, then your alert will immeaditally fire, either change the timeframe or let it fire and wait fo
After a target is hit, I reccomend setting the alert to 0 and REMAKING the alert. You MUST REMAKE THE ALERT AFTER ANY CHANGES. This script WILL NOT CHANGE ALERTS AS YOU CHANGE SETTINGS.
TradingView Alerts are not this smart , at least I haven't found a way to do this yet.
스크립트에서 "alert"에 대해 찾기

MACD signal with alert (long/short/close) for TV free accountSend MACD alert through email (available for free/pro user):
// 3 - buy
// -2 - short
// 0 - close position
// 1 - ignore
Example buy signal
Alert: STRAT3. BINANCE:BTCUSDTPERP, price = 31080
Example sell signal
Alert: STRAT-2. BINANCE:BTCUSDTPERP, price = 31080
Example close signal
Alert: STRAT0. BINANCE:BTCUSDTPERP, price = 31080
Example ignore signal
Alert: STRAT1. BINANCE:BTCUSDTPERP, price = 31080
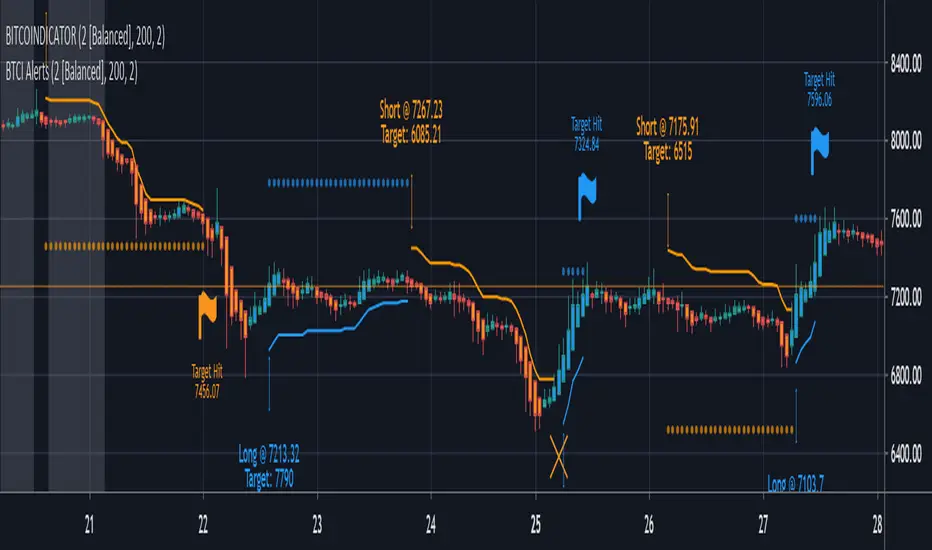
BITCOINDICATOR AlertsAdd this indicator to your chart to set up alerts for BITCOINDICATOR.
Alerts will tell you when to buy long and when to sell short.
They can also be used simply as entry/exit notifications or trend confirmation.
Unless you are a day trader, we recommend you only set up alerts for higher time frames to limit notifications.
How to use:
- In the top right of your chart, click the alarm clock symbol.
- Click the set alert "+" symbol next to Manage Alerts.
- In the pop-up box, change the condition to BTCI Alerts.
- Choose the alert you want - Buy Long or Sell Short.
- Choose ONLY either Once Per Bar or Once Per Bar Close.
Note: If you choose Once Per Bar, you will receive an alert the instant the trade condition is met. However, if the trade condition is unmet again in the same bar and stays unmet until the bar closes, the real-time price label generated by BITCOINDICATOR will have flickered out and the trade signal will be invalidated. This option is for more aggressive traders as it gets you into the trade earlier, but adds some risk.
- Adjust additional inputs and a custom message (we recommend to add your time frame to your message if you have multiple alerts set up).
- Click Create
*Bitcoindicator Alerts is part of the Bitcoindicator package and should only be used with BITCOINDICATOR.
For detailed information on Bitcoindicator and how to add it to your charts, please visit:
www.bitcoindicator.com
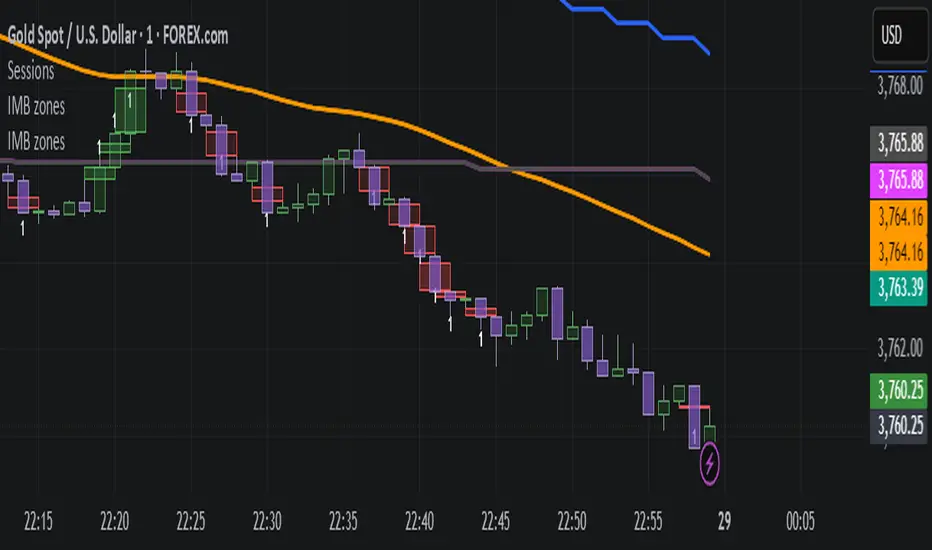
IMB zones, alerts, 8 EMAs, DO lvlThis indicator was created to be a combined indicator for those who use DO levels, IMBs, and EMAs in their daily trading, helping them by providing a script that allows them to customize these indicators to their liking.
Here you can set the IMBs, DO levels, and EMAs. Its special feature is that it uses alerts to indicate which IMB zones have been created, along with the invalidation line for the new potential IMB.
The program always calculates the Daily Opening (DO) level from the opening of the broker, and you can set how many hours the line should be drawn.
Help for use:
There are 3 types of alerts:
- Use the "Bullish IMB formed" alert if you are looking for Bull IMBs.
- Use the "Bearish IMB formed" alert if you are looking for Bear IMBs.
- Use the "Either IMB" alert if you are looking for Bull and Bear IMBs.
Tip: Set the alert type "Once per bar close" if you do not want to set new alerts after an IMB is formed.
IMBs:
- Customizable IMB quantity (1-500 pcs)
- Zone colors and borders can be customized
- Potential IMB line can be customized
EMAs:
- You can set and customize 8 EMA lengths
- Only the current and higher timeframe EMAs are displayed
Daily Open Level:
- Displays today's Daily Open level
- Note: The DO level does not work in Replay mode
Last OFR:
"Show True OFR" checkbox added.
It displays the latest OFR, and hides the old ones.
BTC & ETH Alert SystemWith Tradingview's free plan, only one alert is allowed. The purpose of this indicator is to allow for two alerts--one for BTC and one for ETH.
How to use the alert system:
1. Set the desired value for BTC and ETH that you want to be alerted for
2. Set an alert on the indicator by clicking the three ellipses and then "Add Alert"
3. Set the alert to go off if the value of the indicator is greater than 0.
The example is of BTC using an alert of $10,000 and an alert of ETH at $2,000 (untriggered)
The script can be easily modified to be used for different assets

inwCoin HMA AlertSimple alert to go along with the inwCoin HMA Strategy
Please not that the alerts are persistent 2.70% , if you already enter the position,
just ignore the rest of the same alert until the opposite alert show up
( long then short / or short then long , if change, just close and enter opposite position )
You can set the alert and let it tell you to iOS app via TradingView app ( yey! )
Please note that, if you don't have bot to track your trailing start/stop. you have to enter the TP/SL manually ( also tracking the position )
So... be careful to follow this alert. just try it with small amount of money first.
and make sure to set stop loss every time because OKEX is a portfolio killer if you don't have any stop loss.
** if you cannot trailing stop bot, just uncheck the "Aggressive Strategy" in both strategy and alert to reduce alert to minimum level.

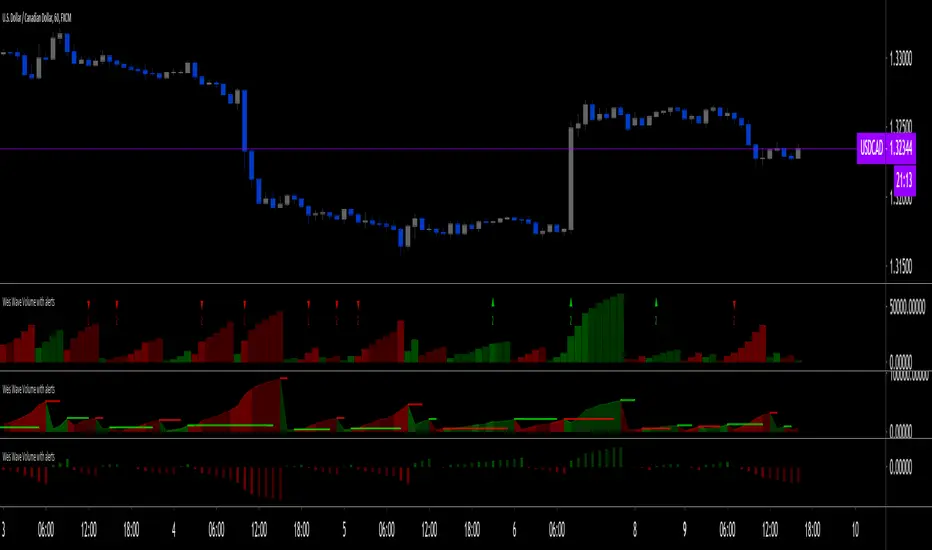
Weis Wave Volume with alert [LazyBear]LFI added alert conditions to LazyBear's indicator on the second bar of a turn to bullish or bearish.
To use alerts:
be sure you are on the interval you want to create your alert,
be sure the indicator inputs are the way you want them,
create an alert, choose this indicator and then choose one of the 2 conditions.
Changes to the inputs after an alert was created require alerts to be recreated.
The alerts trigger on the second bar to avoid noise.
I also changed the default aesthetics, but more importantly the default period (from 2 to 5, because that's what I use most often).
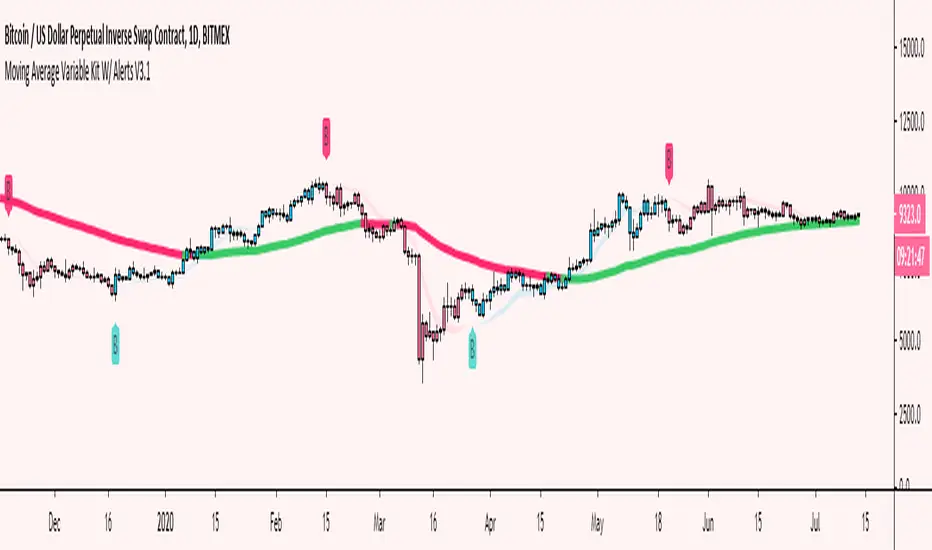
Moving Average Variable Kit W/ Alerts V3 [Moon]Create your own MA system
5 basic kinds of Moving Average types available for now
DEMA
EMA
SMA
TEMA
WMA
Mix and match moving average types and lengths.
Create your own alerts built into Tradingview.
Turn alerts or MAs off or on with 1 click.
Choose visual transparency and alert coloration - everything is customizable.
Trend candles on crossovers.
Choose your MA input source.
Create your own MA cloud or cloud ribbons.
Trend MA coloration on candle or bar interactions.
It really empowers you to experiment and create your own trading system or strategy.
Don't be afraid to use Renko or Heikin Ashi for trend spotting or reversals.
Copy built in exchange bands or indicators for an edge up on the competition or exchange users (these are heavily watched and in my opinion do affect the price action especially on smaller coins like alts).
This is Binance's default kit that you can easily make (7/25/99) SMAs.
Works well on traditional markets or Forex | Should be cross compatible on any asset or timeframe.
Turn off a majority of signals except for "buy" or "sell" alerts. Use these clusters to DCA, short, long or take profit.
Use it to monitor classic "Golden" or "Death" crosses - Set a TV alert to get a notification when it official goes off.
These are just a few of the things you can create. I encourage you to explore further.
Send me a DM if interested.
BB and RSI Indicator Alert v0.3 by JustUncleLI have just recently revised this indicator alert for public release. This is for the 60sec Bollinger Band break Binary Option traders.
This indicator alert is a variation of one found in a well known Broker's marketing videos. It uses Bollinger bands, RSI and moving averages. Included is a pre-warning alert condition. The strategy and settings are designed for 1min charts and Binary Options, but it could work for up to 15 min charts.
The default settings are BB(14,2) and RSI(11) with 75/25 Levels boundaries. To be a valid trade the RSI needs to be within 75/25 channel. The optional Market direction filter is enabled by default and is calculated by two EMA (200 and 50):
When 200ema rising and 50ema above 200ema then market going up.
When 200ema falling and 50ema below 200ema then market going down.
A potential Bollinger Break reversal trades identified by shapes: The purple diamond is the pre-warning purple alert and the green and red pointers with the PUT/CALL labels are the trade alerts. Make Binary Option trade in specified direction 60sec (or can also use 120sec trade without Martingale).
* Notes and Hints *
The original videos specified a Martingale money management strategy, be careful using this management. When I use Martingale I recommend go to 3 levels: 10, 25, 65 if no win at 65 stop trading this alert and start next alert back at 10, you should recovery loss by future wins given you are able to get a reasonable ITM rate with this strategy. Alternatively instead of using Martingale use 120sec Binary Option trade.
Be wary of break alerts on a steep Bollinger, they tend to keep running away for awhile, especially if steep on both sides of Bollinger channel.
As with most of this style of indicator the alert conditions will redraw until the candle is closed. For me this is okay, as it is an Alert is only to a potential trade and final decision to trade is made by me.
You need to practise this and be aware of market news, sessions boundaries, slow trading periods etc. Plan your periods of when you should trade, I prefer Asian session before lunch and London sessions.

EMA 8/21 Crossover Alert IndicatorOverview of the Indicator
This is a custom Pine Script v5 indicator for TradingView titled "EMA 8/21/50 + VWAP Crossover Alert Indicator" (short title: "EMA+VWAP Cross Alert"). It's designed as an overlay indicator, meaning it plots directly on your price chart rather than in a separate pane. The primary purpose is to detect and alert on crossovers between the 8-period Exponential Moving Average (EMA) and the 21-period EMA, which can signal potential bullish or bearish momentum shifts. These are classic short-term trend reversal or continuation signals often used in trading strategies like momentum or swing trading.
To enhance analysis, it also includes:
A 50-period EMA for medium-term trend context (e.g., to confirm if the overall trend aligns with the crossover).
A Volume Weighted Average Price (VWAP) line, which provides a benchmark for the average price weighted by volume, useful for identifying intraday value areas or fair price levels.
The indicator works across all timeframes (e.g., Daily, 4H, 1H, 15M, 5M, 3M) because the calculations are based on the chart's current bars and adapt to volatility and data resolution. It's not a trading strategy (no entry/exit logic or backtesting), but an alert tool—signals are visual and can trigger notifications in TradingView. Always combine it with risk management, as crossovers can produce false signals in ranging or choppy markets.
How It Behaves Across Timeframes
Higher Timeframes (e.g., Daily/4H): Fewer crossovers, focusing on major trends. EMAs smooth out noise; VWAP might represent session averages.
Lower Timeframes (e.g., 3M/5M): More frequent signals due to sensitivity, but higher risk of whipsaws. VWAP resets per session, making it great for intraday trading.
Adaptability: All components scale with bar data—no manual adjustments needed, though tweaking inputs can optimize for specific frames.
In TradingView, you can set up these alerts to notify via popup, sound, email, SMS, or webhook (e.g., to a trading bot). Go to the chart's "Alert" button, select this indicator, and choose conditions like "Bullish Cross" or use the script's built-in alerts.

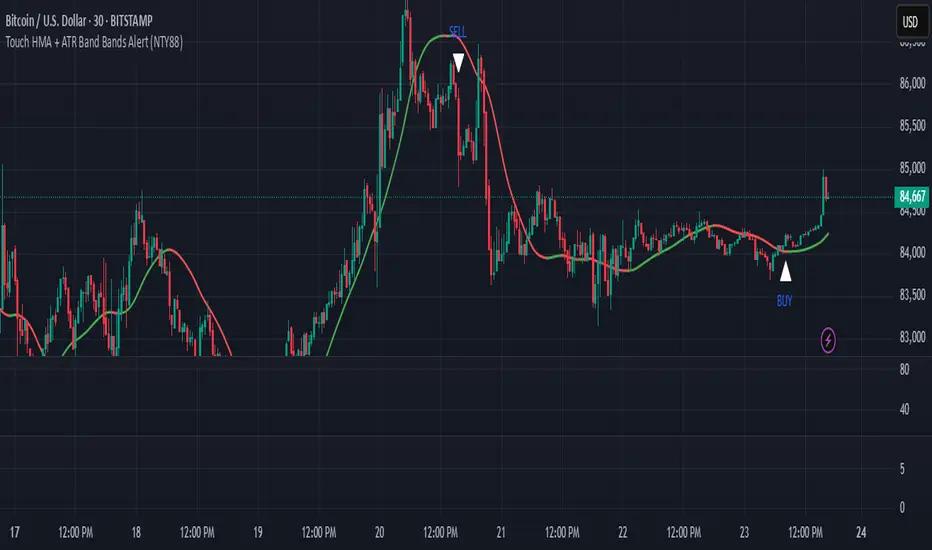
Touch HMA + ATR Band Bands Alert (NTY88)🔔 Precision Alerts | No Repainting | ATR-Based Touch Detection | HMA Trend Coloring
This script is a clean and powerful tool designed to help you catch precise market reversals using ATR Band touches combined with trend-following logic.
📌 How It Works
A custom Hull Moving Average (HMA) is used to track the trend.
Two dynamic ATR-based bands are drawn above and below the HMA.
A signal is generated when the closing price touches the upper or lower ATR band within a small tolerance zone.
✅ Key Features
🔁 Alternating Signals: Only one Buy → then one Sell → then Buy again. No signal spam.
🟢🔴 Color-Changing HMA Line: Green = HMA rising | Red = HMA falling
📏 Price Tolerance Input: Define how close the candle must be to the ATR band to trigger a signal.
🔔 Real-Time Alerts: Easily set alerts for Buy and Sell signals — works in live markets.
🚫 No Repainting: All signals are confirmed at candle close and will not change afterward.
🎯 When to Use
Great for trend reversals, scalping zones, or identifying potential exhaustion points.
Works well on any timeframe or market (crypto, stocks, forex).
💬 Pro Tip:
Combine this with RSI, Volume, or ADX filters to build a complete confluence system.
📈 Built for traders who love clean logic, precision entries, and visual clarity.
Timed AlertTradingView doesn't offer a way easily set timed alerts. This script solves that problem and also allows you to set variables in the script similar to other alerts.
The variables can be found here .

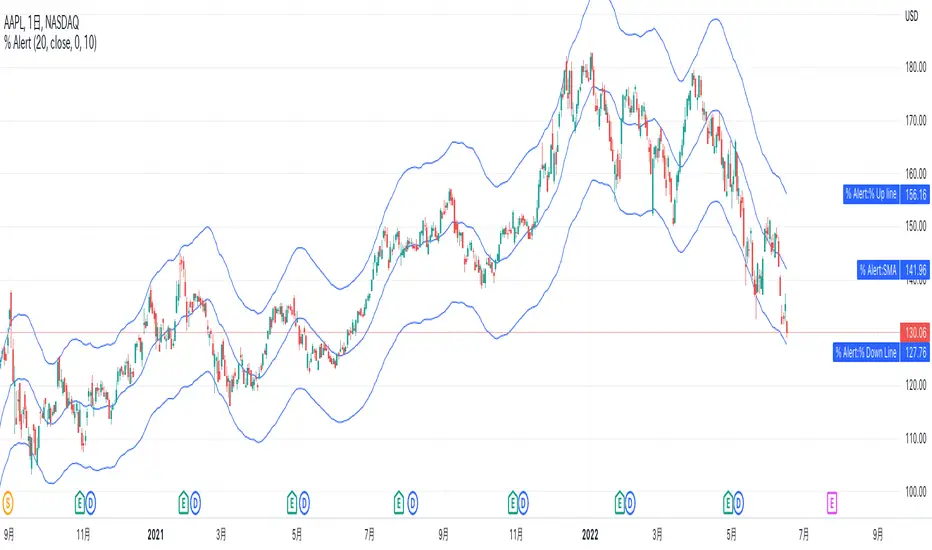
% up/down from SMA AlertsHi all! This script allows an alert option for conditions when the price increase 10% from the SMA and when price decrease 10% from the SMA.
The SMA length defaults to 20, but can be set to any length of your preference at “length” in the inputs tab of the script settings.
Value that increase and decrease 10% from SMA is able to visualize with a line but it can also be hidden in the Style tab.
Also, the default is 10%, but you can set % value of your preference such as 2%, 5%, at "% value" in the inputs tab.
For example with the default settings, if you set the alert condition "% up SMA" in the Alert settings dialog, this alert will be triggered when the price increase 10% from SMA. "% down SMA" will be triggered when the price decrease 10% from SMA.
-----------
このスクリプトは、価格がSMAから10%上昇した時と、10%下降した時の条件のアラートオプションを可能にします。
SMAの期間はデフォルトで20ですが、スクリプト設定のパラメータータブにある「期間」でお好みの期間に設定できます。
そしてこのSMAから10%上昇した値と下降した値は、ラインで視覚的に表示されますが、タイルタブで非表示に指定することも可能です。
また、デフォルトは10%ですが、2%や5%などと、パラメータータブにある「% value」でお好みの%値を設定する事ができます。
例えばデフォルト設定の場合、アラート設定ダイアログで条件を「% up SMA」で設定した場合は、もし価格がSMAから10%上昇したらアラートがトリガーされます。
「% down SMA」を指定した場合は、もし価格がSMAから10%下降したらアラートがトリガーされます。
Box Range AlertSimple Script for getting alerts on the crossing of Upper & Lower levels either way.
Good for Free users as they can only use 1 alert at a time. So this indicator will be useful to get alerts on both Breakout Or Breakdowns.
Just add input Price manually and set alerts.

WaveTrend Oscillator w/ Short/Long/Close Alerts - WIPHigh TFs work best, but it works on any TF. I plan to continue releasing updates to it to improve overall form and function. Green Circles are Long Alerts, Red Circles are Short Alerts. Blue and Yellow Circles are Close Position Alerts. First Blue Circle After Red Circle would be Short Exit. First Yellow Circle After Green Circle would be Long Exit.
Original script was based on Lazybear Indicator-WaveTrend-Oscillator-WT Script. I have added and modified some code to my personal liking.

Renko Chart Alerts with PivotsAdd alerts to renko charts to be notified when:
new brick
brick up
brick down
direction change
direction change up
direction change down
Also shows pivots based on brick reversals. Alerts also available for:
pivot breakout
pivot high breakout
pivot low breakout
You can hide the plots for pivot high/low and breakouts in the style tab of the settings for the indicator.
To add the alerts:
add the indicator to your renko chart
click add alert
click the condition dropdown and choose Renko Alerts
you should see all the alerts there and you can add any one or more to your chart

Neo BitMEX Futures Hedge Grid Alerts Premium v1.0This indicator was made to streamline finding the optimal entry to cash and carry/hedge on a futures contract when margin trading.
Explanation of the indicator:
This indicator has built-in alert conditions that you can use to give you email alerts, in-browser sound alerts, or SMS alerts. These alerts are based upon futures prices being in contango or backwardation.
From top to bottom, the grid shows XBTU18, XBTZ18, OkEx's Quarterlies (OKCOIN:BTCUSD3M), and CME's futures.
Red: Futures are trading above your defined range (default 1%) of spot
Maroon: Futures are trading above twice your defined range of spot
Lime: Futures are trading below your defined range (default 1%) of spot
Green: Futures are trading below twice your defined range of spot
What's configurable:
% to trigger
Grid size
Bar color toggle
Label toggle
Spot/index source (Bitfinex's BTCUSD, BitMEX's XBTUSD, and BitMEX's XBT Index are available)
Pricing:
Currently this standalone indicator is 0.007 BTC for lifetime use.
Example of use:
On 4 May 2018, BitMEX's XBTU18 was trading >2% above perpetual swap. The grid alerts signaled that and if one were long on bitcoin spot on any exchange, then it would have been a good idea to hedge a short on XBTU18. Eventually from there the premium gap was closed while bitcoin fell.
Here is the indicator shown with bar coloring and labels.

RSI-CCI Fusion + AlertsThe "RSI-CCI Fusion" indicator combines the Relative Strength Index (RSI) and Commodity Channel Index (CCI) from TradingView.
RSI-CCI Fusion: Unlocking Synergies in Technical Analysis
Technical analysis plays a crucial role in understanding market dynamics and making informed trading decisions. I often rely on a combination of indicators to gain insights into price movements and identify potential trade opportunities. In the lines below, I will explore the "RSI-CCI Fusion" indicator, a powerful tool that combines the strengths of the Relative Strength Index (RSI) and the Commodity Channel Index (CCI) to provide enhanced trading insights.
1. Understanding the RSI and CCI Indicators
Before delving into the fusion of these indicators, let's briefly review their individual characteristics. The RSI is a widely used momentum oscillator that measures the speed and change of price movements. It oscillates between 0 and 100, with readings above 70 indicating overbought conditions and readings below 30 indicating oversold conditions.
On the other hand, the CCI is a versatile indicator designed to identify cyclical trends in prices. It measures the distance between the price and its statistical average, thereby providing valuable insights into overbought and oversold levels.
2. The Concept of RSI-CCI Fusion
The RSI-CCI Fusion indicator is born out of my desire to harness the collective power of the RSI and CCI. By combining these indicators, I can benefit from a more comprehensive trading signal that captures both momentum and cyclical trend dynamics.
The fusion process involves assigning weights to the RSI and CCI, creating a blended indicator that reflects their relative importance. The weighted combination ensures that both indicators contribute meaningfully to the final result.
To maintain consistency, the RSI and CCI values are standardized using the z-score technique. This normalization process brings the values to a common scale, making them directly comparable. Rescaling is then applied to bring the combined indicator back to its original scale, facilitating intuitive interpretation.
3. Interpreting the RSI-CCI Fusion Indicator
When plotting the RSI-CCI Fusion indicator on a chart, I gain valuable insights into market dynamics and potential trading opportunities. The indicator's plot typically includes dynamic upper and lower bands, which are calculated based on the indicator's standard deviation. These bands provide boundaries for evaluating overbought and oversold conditions.
When the RSI-CCI Fusion indicator crosses above the lower band, it suggests oversold conditions and potential buying opportunities. Conversely, when the indicator crosses below the upper band, it indicates overbought conditions and potential selling opportunities. I also pay attention to the baseline, which represents the neutral level and may signal potential trend reversals.
4. Utilizing Alerts for Trading Decisions
The RSI-CCI Fusion indicator can be further enhanced by incorporating alerts. These alerts notify me when the indicator generates buy or sell signals, enabling me to take prompt action. I can customize the alerts based on my preferred thresholds and timeframes.
However, it is crucial to remember that the RSI-CCI Fusion indicator should not be relied upon in isolation. To increase the robustness of my trading decisions, it is recommended to combine the indicator with other analysis techniques such as trend lines, support and resistance levels, or additional indicators. This convergence of analysis methodologies enhances the overall accuracy of my trade signals.
Conclusion: The RSI-CCI Fusion indicator represents a compelling approach to technical analysis by synergizing the strengths of the RSI and CCI. By combining momentum and cyclical trend dynamics, I gain a more comprehensive view of market conditions. The fusion of these indicators, accompanied by timely alerts, equips me with valuable insights and facilitates well-informed trading decisions.
As with any technical analysis tool, it is essential for me to backtest the RSI-CCI Fusion indicator to evaluate its performance across different market conditions and timeframes. Additionally, applying proper risk management strategies is crucial to ensure consistent and disciplined trading practices.

[Rygel] MACD 4C with divergences, crossovers and alertsThis indicator is a reliable, exhaustive, instant, simple divergence detector for the MACD 4C oscillator.
I've struggled for months to find a MACD divergence indicator I can rely on, I've tinkered with the ones I found and never was satisfied by the final result. For all of them important divergences were not shown, for some divergences was shown too late, for others divergence lines was not drawn, some even shown some strange exotic divergences... I played will all the parameters and something was always wrong or missing at the end.
It was even worse for the MACD 4C indicator, the 4-color MACD, which I prefer to use.
So I finally decided to write my own divergence algorithm and to create my own indicator. After a few attempts, here's the result.
This MACD indicator is using the same divergence detection algorithm I wrote for my RSI indicator. You'll find on its description page a comparison of my divergence algorithm with other ones to see how it differs.
When I built this indicator, my objectives were to create one that is:
Reliable. I didn't want to have to double-check an indicator to make sure it's doing what I expect it to do. I want to be able to look at it for one second and know I can rely on it.
Exhaustive. I didn't want to have to rely on multiple indicators to be sure I'm not missing a divergence.
Instant. I wanted the divergences to be shown as soon as soon as they form and not after a pivot is confirmed. For some indicator, when the divergence is displayed, it's already too late to act on it.
Simple. I wanted my indicator to be clean, readable and not visually aggressive. The main objective of this indicator is to show divergences and I didn't want to visually overload it with unrequired information.
I wanted my indicator to be a simple as possible, nonetheless you'll find a few parameters to tinker with. Many of them will need no explanation but here's the list.
Show signal line: disabled by default. Show the MACD signal line.
Color signal line: disabled by default. Show the signal line as green when it goes up and read when it goes down.
Show signal crossovers: enabled by default. Show a green dot when MACD crosses up its signal line and a red dot when it crosses down.
Show zero line: enabled by default. Show a line at the 0 value.
Show zero crossovers: disabled by default. Show a green triangle when MACD crosses up the 0 line and a red triangle when it crosses down.
Show regular divergences: enabled by default.
Show hidden divergences: disabled by default for readability. I try to keep the indicator as clean as possible by default.
Bullish regular divergence color : no explanation needed I suppose.
Bullish hidden divergence color : same.
Bearish regular divergence color : ditto.
Bearish hidden divergence color : uhh.
Show overbought and oversell backgrounds : when RSI is oversold or oversell, the background color changes to red or green. The indicator uses two levels of oversold/overbought. When the RSI is strongly oversold/overbought the background color gets brighter. You can configure these levels in the advanced parameters.
Advanced parameters:
MACD fast moving average length: 12 by default.
MACD slow moving average length: 26 by default.
MACD signal moving average length: 9 by default.
Show divergences before pivot confirmation : enabled by default. Divergences will appear as soon as possible, before the pivot is confirmed by another candlestick. Unconfirmed divergences will appear as dashed lines then disappear if not confirmed or turn to solid lines if confirmed. This may create false positives with alerts as the divergence may disappear.
Minimum bars to check: 5 by default. As this indicator detects absolutely all the divergences, some may be insignificant and it may become unreadable without some filtering. If you want to see absolutely all the divergences, you may lower this value. Please note TradingView limits to 50 how many lines are displayed at the same time on an indicator. So when you display more divergences, some in the past disappear. It's not usually an issue but if you scroll back in time, divergences will stop to show at one point in the past.
Maximum bars to check: 75 by default. Divergences may go far in the past, this parameters limit how old a divergence may be. You can higher it to show more divergences.
Show pivots: disabled by default. Show the pivot points used for divergence detections.
This indicator offers the following alerts:
Any divergence
Bearish divergence
Bullish divergence
Regular bearish divergence
Regular bullish divergence
Hidden bearish divergence
Hidden bullish divergence
MACD becoming positive
MACD becoming negative
MACD crossing up signal line
MACD crossing down signal line
Please note TradingView limits for performance reason to 50 the number of lines you can display on an indicator at the same time. So when you scroll back in time, at one point divergences will stop to show. If you want to see divergences far in the past, you may need to use the replay feature or to configure stronger filtering settings.
I hope you'll enjoy this indicator as much as I do! :)
Feel free to comment if you experience a bug or if an important feature is missing for you. (Please note the core of this indicator is divergence detection, I want to keep it simple so I will probably not add many unrelated features to it.)

08-18 EMA Watson [ALERT SETUP][INDICATOR]Hello here is the Alert Setup of my Strategy EMA Watson, I published a backtest version on my profile two days ago.
The big triangles correspond to the buy/sell alerts.
I give access for free, just leave a comment.
More info about the script, such as inputs description, how to configure the script, strategy explanation, alert configuration can be found here : blockchainfiesta.com
--------------------------------------------------------------------------------------------------------------
Commission Work: TradingView development, Reverse Engineering, Pine Script. contact@blockchainfiesta.com.. You can also send me a message in TradingView or Discord
If you have too much crypto and want to help me out:
BTC -2.19% address: 19sVQvCDmVfEACq7BiMnWSMqFPZ8qfSQ2K
ETH address: 0xc8a5d3a63a05db0c2363ea1c08b37a01cce9ebfb

Bollinger Awesome Alert R1 by JustUncleLThis indicator is an implementation of the Bollinger Band and Awesome Oscillator Scalping system.
This technique is for those who want the most simple method that is very effective. It is BEST traded during the busiest trading hours, 3am to 12am EST NY time. This method doesn't work in sideways markets, only in volatile trending markets.
Time Frames: 1, 5, 10, 15 ,30 min.
Currency pairs: majors.
Other Chart indicators:
Add Awesome Oscillator.
Optionally Add Squeeze Indicator.
Here's the strategy:
Going LONG:
Enter a long position when the black 3 EMA has crossed up through the Bollinger red middle band MA. At the same time, the Awesome should be approaching or crossing it's zeroline, going up. This is indicated by "Buy" alert.
Going SHORT:
Enter a short position when the black 3 EMA has crossed down through the Bollinger red middle band MA. At the same time, the Awesome should be approaching or crossing it's zero line, going down. This is indicated by the "Sell" Alert.
Take profit:
10-20 pips depending on pair or When Awesome Oscillator turns a different colour.
HINTS: Best trades tend to occur when price reversing bounce off outer band and outside the Optional Bollinger Squeeze indication.

Open Close Cross Alert R6 by JustUncleLThis revision of this indicator is an Open Public release. The indicator alert based on JayRogers "Open Close Cross Strategy R2" and is used in conjunction with the revised "Open Close Cross Strategy R5".
Description:
This indicator alert created for TradingView alarm sub-system (via the alertcondition() function, which currently does not work in a "Strategy" script). Also this indicator plots the Difference Factor between the Close and Open Moving Averages, this gives a good indication of strength of move. Also included in this release is optional Divergence finder with variable width channel.

[Rygel] RSI with divergences and alertsThis indicator is a reliable, exhaustive, instant, simple divergence detector for the RSI oscillator.
I've struggled for months to find a RSI divergence indicator I can rely on, I've tinkered with the ones I found and never was satisfied by the final result. For all of them important divergences were not shown, for some divergences was shown too late, for others divergence lines was not drawn, some even shown some strange exotic divergences... I played will all the parameters and something was always wrong or missing at the end.
So I finally decided to write my own divergence algorithm and to create my own indicator. After a few attempts, here's the result.
At first. Please find below a quick comparison of this indicator with some of the most popular RSI divergence indicators on TradingView. I've hidden their names as it's not my intention to show them in a bad light. These indicators are great and some of you may even find them better than this one, they were just not what I was looking for.
You will most likely notice all of them are missing divergences but not always the same. You'll have to combine all of them to get (almost) all the divergences.
When I built this indicator, my objectives were to create one that is :
Reliable. I didn't want to have to double-check an indicator to make sure it's doing what I expect it to do. I want to be able to look at it for one second and know I can rely on it.
Exhaustive. I didn't want to have to rely on multiple indicators to be sure I'm not missing a divergence.
Instant. I wanted the divergences to be shown as soon as soon as they form and not after a pivot is confirmed. For some indicator, when the divergence is displayed, it's already too late to act on it.
Simple. I wanted my indicator to be clean, readable and not visually aggressive. The main objective of this indicator is to show divergences and I didn't want to visually overload it with unrequired information.
I wanted my indicator to be a simple as possible, nonetheless you'll find a few parameters to tinker with. Many of them will need no explanation but here's the list.
Show regular divergences : enabled by default.
Show hidden divergences : disabled by default for readability. I try to keep the indicator as clean as possible by default.
Bullish regular divergence color : no explanation needed I suppose.
Bullish hidden divergence color : same.
Bearish regular divergence color : ditto.
Bearish hidden divergence color : uhh.
Show overbought and oversell backgrounds : when RSI is oversold or overbought, the background color changes to red or green. The indicator uses two levels of oversold/overbought. When the RSI is strongly oversold/overbought the background color gets brighter. You can configure these levels in the advanced parameters.
Advanced parameters:
RSI source: "close" by default.
RSI length: 14 by default.
Show divergences before pivot confirmation : enabled by default. Divergences will appear as soon as possible, before the pivot is confirmed by another candlestick. Unconfirmed divergences will appear as dashed lines then disappear if not confirmed or turn to solid lines if confirmed. This may create false positives with alerts as the divergence may disappear.
Minimum bars to check: 5 by default. As this indicator detects absolutely all the divergences, some may be insignificant and it may become unreadable without some filtering. If you want to see absolutely all the divergences, you may lower this value. Please note TradingView limits to 50 how many lines are displayed at the same time on an indicator. So when you display more divergences, some in the past disappear. It's not usually an issue but if you scroll back in time, divergences will stop to show at one point in the past.
Maximum bars to check: 50 by default. Divergences may go far in the past, this parameters limit how old a divergence may be. You can higher it to show more divergences.
Use limits for divergences: enabled by default. Don't show divergences when they are above or below a threshold. Another filtering options to make sure only relevant divergences are shown.
Minimum value for bearish divergence: 40 by default.
Maximum value for bullish divergence: 60 by default.
Show pivots: disabled by default. Show the pivot points used for divergence detections.
Oversold level: 30 by default. A red background is shown when the indicator goes below this level.
Overbought level: 70 by default. A green background is shown when the indicator goes above this level.
Strongly oversold level: 20 by default. A brighter red background is shown when the indicator goes below this level.
Strongly overbought level: 80 by default. A brighter green background is shown when the indicator goes above this level.
Show moving average: disabled by default. Add a moving average to the indicator.
Moving average type: SMA by default. You may choose between Bollinger Bands, EMA, SMA, SMMA (RMA), VWMA and WMA.
Moving average length: 14 by default.
Bollinger Band standard deviation 2 by default.
This indicator has the following alerts:
Any divergence
Bearish divergence
Bullish divergence
Regular bearish divergence
Regular bullish divergence
Hidden bearish divergence
Hidden bullish divergence
Please note TradingView limits for performance reason to 50 the number of lines you can display on an indicator at the same time. So when you scroll back in time, at one point divergences will stop to show. If you want to see divergences far in the past, you may need to use the replay feature or to configure stronger filtering settings.
I hope you'll enjoy this indicator as much as I do! :)
Feel free to comment if you experience a bug or if an important feature is missing for you. (Please note the core of this indicator is divergence detection, I want to keep it simple so I will probably not add many unrelated features to it.)
