BTC Price Prediction Model [Global PMI]🇨🇳 中文说明 (Chinese Version)
1. 简介
本指标由 GW Capital 使用 Gemini Vibe Coding 技术制作。利用先进的 AI 编程能力,将复杂的宏观经济模型重构为可执行的交易工具。
2. 致谢
特别感谢模型原作者 Marty Kendall。他对这一算法的研究奠定了基础,揭示了比特币价格与宏观经济因素之间的深层联系。
3. 模型原理与公式
该模型基于四大宏观经济支柱计算比特币的“公允价值”。它假设比特币的价格是全球流动性、网络安全性、风险偏好和经济周期的函数。
模型公式
$$\ln(BTC) = \alpha + (1 + \beta \cdot PMI_{z}) \times $$
全球流动性 (M2): 美、中、欧、日四大经济体的 M2 总量(折算为美元)。代表可流入资产的法币资金池。
网络安全性 (Hashrate): 比特币全网算力,代表网络的物理安全性和实用价值。
风险偏好 (S&P 500): 作为全球风险情绪的代理指标。
经济周期 (PMI Z-Score): 美国制造业 PMI 用于根据商业周期(扩张 vs 收缩)来放大或抑制估值。
4. 指标用法
指标会在图表上绘制 公允价值 (白线) 以及基于统计偏差 (Z-Score) 的四条情绪带。
情绪区间
🚨 极度贪婪 (红色区域): 价格 > +0.3 标准差。历史上通常预示市场顶部或情绪过热。
⚠️ 一般贪婪 (橙色区域): 价格 > +0.15 标准差。多头动能强劲,但需谨慎。
⚖️ 公允价值 (白线): 基于宏观数据的理论“正确”价格。
😨 一般恐惧 (青色区域): 价格 < -0.15 标准差。进入低估区域。
💎 极度恐惧 (绿色区域): 价格 < -0.3 标准差。历史上通常是代际级别的买入机会。
情绪评分 (0-100)
100: 极度贪婪 (顶部)
50: 公允价值
0: 极度恐惧 (底部)
5. 使用建议
周期: 仅限日线 (1D) 或周线 (1W)。
原因: 底层数据源(M2, PMI)是月度更新的。标普500和算力是日度更新的。在日内图表(如15分钟、1小时、4小时)上使用此指标没有任何意义,因为基本面数据不会变化得那么快。
长期视角: 这是一个宏观周期指标,旨在识别数月甚至数年的周期顶部和底部,而非用于日内交易。
6. 免责声明
本指标仅供教育和参考使用,不构成任何财务建议。该模型依赖于历史相关性,未来可能不再适用。所有交易均涉及风险。GW Capital 及制作者不对任何交易损失承担责任。
🇺🇸 English Guide (英文说明)
1. Introduction
This indicator was created by GW Capital using Gemini Vibe Coding technology. It leverages advanced AI coding capabilities to reconstruct complex macroeconomic models into actionable trading tools.
2. Credits
Special thanks to the original model author, Marty Kendall. His research into the correlation between Bitcoin's price and macroeconomic factors lays the foundation for this algorithm.
3. Model Principles & Formula
This model calculates the "Fair Value" of Bitcoin based on four key macroeconomic pillars. It assumes that Bitcoin's price is a function of Global Liquidity, Network Security, Risk Appetite, and the Economic Cycle.
The Formula
$$\ln(BTC) = \alpha + (1 + \beta \cdot PMI_{z}) \times $$
Global Liquidity (M2): Sum of M2 supply from US, China, Eurozone, and Japan (converted to USD). Represents the pool of fiat money available to flow into assets.
Network Security (Hashrate): Bitcoin's hashrate, representing the physical security and utility of the network.
Risk Appetite (S&P 500): Used as a proxy for global risk sentiment.
Economic Cycle (PMI Z-Score): US Manufacturing PMI is used to amplify or dampen the valuation based on where we are in the business cycle (Expansion vs. Contraction).
4. How to Use
The indicator plots the Fair Value (White Line) and four sentiment bands based on statistical deviation (Z-Score).
Sentiment Zones
🚨 Extreme Greed (Red Zone): Price > +0.3 StdDev. Historically indicates a market top or overheated sentiment.
⚠️ Greed (Orange Zone): Price > +0.15 StdDev. Bullish momentum is strong but caution is advised.
⚖️ Fair Value (White Line): The theoretical "correct" price based on macro data.
😨 Fear (Teal Zone): Price < -0.15 StdDev. Undervalued territory.
💎 Extreme Fear (Green Zone): Price < -0.3 StdDev. Historically a generational buying opportunity.
Sentiment Score (0-100)
100: Maximum Greed (Top)
50: Fair Value
0: Maximum Fear (Bottom)
5. Usage Recommendations
Timeframe: Daily (1D) or Weekly (1W) ONLY.
Reason: The underlying data sources (M2, PMI) are updated monthly. The S&P 500 and Hashrate are daily. Using this indicator on intraday charts (e.g., 15m, 1h, 4h) adds no value because the fundamental data does not change that fast.
Long-Term View: This is a macro-cycle indicator designed for identifying cycle tops and bottoms over months and years, not for day trading.
6. Disclaimer
This indicator is for educational and informational purposes only. It does not constitute financial advice. The model relies on historical correlations which may not hold true in the future. All trading involves risk. GW Capital and the creators assume no responsibility for any trading losses.
스크립트에서 "ai"에 대해 찾기

Volume Intelligence Pro [Abusuhil]═══════════════════════════════════════════════════════════════════════════════
📊 VOLUME INTELLIGENCE TABLE - PROFESSIONAL VOLUME ANALYSIS INDICATOR
═══════════════════════════════════════════════════════════════════════════════
🌐 BILINGUAL SUPPORT: Full support for English and Arabic languages - switch instantly from settings!
🎯 COMPREHENSIVE VOLUME ANALYSIS DASHBOARD
This advanced indicator provides institutional-grade volume analysis through an elegant, customizable table that displays critical volume metrics in real-time. Designed for professional traders who need deep insights into market volume dynamics, order flow, and smart money movements.
═══════════════════════════════════════════════════════════════════════════════
✨ KEY FEATURES
═══════════════════════════════════════════════════════════════════════════════
🔷 BILINGUAL INTERFACE
• Seamless switching between English and Arabic
• All metrics, labels, and signals fully translated
• Perfect for international traders
🔷 VOLUME FUNDAMENTALS
• Current Volume: Real-time volume tracking
• Volume SMA: Moving average for volume comparison
• Volume Ratio: Current volume vs average (identifies abnormal activity)
• Volume % Change: Percentage change from previous bar
• Volume Delta: Difference between buying and selling pressure
🔷 VOLUME SPIKE DETECTION (4 LEVELS)
• Weak Spike: 1.5x average volume
• Medium Spike: 2.0x average volume
• Strong Spike: 2.5x average volume
• Extreme Spike: 3.0x+ average volume
• Visual alerts with color-coded indicators
🔷 ADVANCED BUY/SELL PRESSURE ANALYSIS
• Buy Volume: Bullish candle volume accumulation
• Sell Volume: Bearish candle volume accumulation
• Buy Pressure %: Percentage of buying pressure
• Sell Pressure %: Percentage of selling pressure
• Pressure Dominance: Who controls the market (Buyers/Sellers/Neutral)
• Candle Body Strength: Measures conviction in price movement
• Imbalance Volume: Detects wick imbalances
• Volume Delta (HLC3): Advanced delta calculation
• Weighted Delta: Volume-weighted price movement
• Pressure Lookback: Multi-candle pressure analysis (optimized for performance)
🔷 TECHNICAL INDICATORS INTEGRATION
• VWMA (Volume Weighted Moving Average): Price vs VWMA positioning
• OBV (On Balance Volume): Trend detection with EMA smoothing
• OBV Divergence: Bullish/Bearish divergence detection
• MFI (Money Flow Index): Overbought/oversold conditions
• A/D Line (Accumulation/Distribution): Smart money tracking
🔷 AI-POWERED VOLUME INTELLIGENCE SCORING
• Entry Power: Measures volume strength combined with price movement
• Effort vs Result: Identifies climax situations (buying/selling exhaustion)
• Reversal Volume Analysis: Tracks volume at reversal candles
• Trend Integration: Combines trend direction with volume confirmation
• Bullish/Bearish Points: 11-point scoring system
• Volume Score: -100 to +100 scale (positive = bullish, negative = bearish)
• Confidence Level: Reliability percentage of the signal
• Final Signal: Clear BULLISH/BEARISH/NEUTRAL verdict
🔷 TRIPLE SIGNAL SYSTEM (Optional)
• Signal 1: Volume Score Based (customizable thresholds)
• Signal 2: Volume Spike + Candle Color (spike level selection)
• Signal 3: OBV Divergence Detection
• Independent on/off toggles for each signal
• Visual signals plotted on chart with triangles
• Combined signal alerts
🔷 COMPREHENSIVE ALERT SYSTEM
• Volume spike alerts (configurable levels)
• Signal 1, 2, 3 individual alerts
• Combined buy/sell signal alerts
• OBV trend change alerts
• Strong buying/selling pressure alerts
• Customizable alert frequency
═══════════════════════════════════════════════════════════════════════════════
📊 TABLE STRUCTURE & DISPLAY
═══════════════════════════════════════════════════════════════════════════════
The indicator features a professional 3-column table with the following sections:
📌 COLUMN HEADERS:
• INDICATOR: Metric name
• VALUE: Current reading
• STATUS: Visual status indicator (color-coded dots/icons)
📌 SECTION 1: VOLUME BASICS
Displays fundamental volume metrics with ratio indicators and percentage changes. Essential for understanding current market activity levels.
📌 SECTION 2: VOLUME SPIKE DETECTION
Real-time spike detection with 4 severity levels. Color-coded for instant recognition of abnormal volume.
📌 SECTION 3: BUY/SELL PRESSURE (ADVANCED)
Comprehensive order flow analysis with 10+ metrics. Includes advanced calculations like weighted delta, imbalance volume, and multi-candle pressure lookback.
📌 SECTION 4: VWMA ANALYSIS
Shows price position relative to volume-weighted moving average. Critical for identifying volume-supported moves.
📌 SECTION 5: OBV ANALYSIS
On Balance Volume trend and divergence detection. Helps identify smart money accumulation/distribution.
📌 SECTION 6: MFI ANALYSIS
Money Flow Index readings with overbought/oversold signals. Combines price and volume for comprehensive analysis.
📌 SECTION 7: A/D LINE
Accumulation/Distribution line trend analysis. Tracks institutional buying and selling.
📌 SECTION 8: VOLUME INTELLIGENCE
AI-powered scoring system with 11 evaluation points:
1. Volume strength assessment
2. Current buy/sell pressure
3. Multi-candle pressure lookback
4. Entry power calculation
5. Reversal volume tracking
6. VWMA position
7. OBV trend
8. OBV divergence
9. MFI signal
10. A/D trend
11. Trend-volume integration
Final output: Volume Score, Confidence Level, and highlighted FINAL SIGNAL.
═══════════════════════════════════════════════════════════════════════════════
⚙️ CUSTOMIZATION OPTIONS
═══════════════════════════════════════════════════════════════════════════════
🎨 TABLE DISPLAY
• Position: 9 locations (top-left, top-center, top-right, middle-left, etc.)
• Size: 5 sizes (tiny, small, normal, large, huge)
• Colors: Fully customizable background and text colors
• Sections: Show/hide any section independently
🎯 VOLUME SETTINGS
• Volume Average Length (default: 20)
• Spike Thresholds: Adjustable multipliers for each level
• Advanced Metrics: Lookback periods (optimized: 10 candles)
• Reversal Analysis: Candle count (optimized: 5 candles)
📊 INDICATOR LENGTHS
• OBV Smoothing: Default 14
• MFI Period: Default 14
• VWMA Length: Default 20
• A/D Length: Default 14
🎯 SIGNAL SYSTEM
• Enable/disable each signal independently
• Customizable thresholds for Signal 1 (score & confidence)
• Spike level selection for Signal 2
• Show/hide signals on chart
• Alert configuration for each signal type
═══════════════════════════════════════════════════════════════════════════════
🚀 PERFORMANCE & OPTIMIZATION
═══════════════════════════════════════════════════════════════════════════════
✅ REPLAY MODE OPTIMIZED
• Works flawlessly in TradingView Replay mode
• Optimized calculations for fast historical analysis
• No lag or freezing issues
✅ REAL-TIME EFFICIENCY
• Lightweight code structure (50 labels/lines limit)
• Smart caching of repeated calculations
• Limited loop iterations for optimal performance
• Updates only on last bar (table rendering)
✅ NON-REPAINTING
• All signals are confirmed on bar close
• No retrospective changes to historical signals
• Reliable for backtesting and strategy development
═══════════════════════════════════════════════════════════════════════════════
💡 USAGE RECOMMENDATIONS
═══════════════════════════════════════════════════════════════════════════════
📈 FOR DAY TRADING:
• Use 15m-1H timeframes
• Enable all sections for comprehensive analysis
• Focus on Volume Spike and Buy/Sell Pressure sections
• Set alerts for Strong and Extreme spikes
📈 FOR SWING TRADING:
• Use 4H-1D timeframes
• Focus on Volume Intelligence and OBV sections
• Enable Signal 1 and Signal 3 for swing entries
• Monitor divergences for trend reversals
📈 FOR SCALPING:
• Use 1m-5m timeframes
• Focus on Buy/Sell Pressure and Volume Basics
• Enable Signal 2 for quick spike-based entries
• Hide less relevant sections to reduce visual clutter
═══════════════════════════════════════════════════════════════════════════════
🎓 INDICATOR METHODOLOGY
═══════════════════════════════════════════════════════════════════════════════
This indicator combines classical volume analysis with modern algorithmic intelligence:
1. Volume Profiling: Identifies abnormal volume relative to historical averages
2. Order Flow Analysis: Separates buying and selling pressure using candle structure
3. Divergence Detection: Compares price action with volume indicators
4. Multi-Timeframe Approach: Uses smoothing and lookback for context
5. Scoring Algorithm: 11-point evaluation system for objective signal generation
6. Confluence Integration: Combines multiple indicators for higher probability setups
═══════════════════════════════════════════════════════════════════════════════
⚠️ DISCLAIMER
═══════════════════════════════════════════════════════════════════════════════
This indicator is a tool for analysis and should not be used as the sole basis for trading decisions. Always combine with your own analysis, risk management, and trading plan. Past performance does not guarantee future results.
═══════════════════════════════════════════════════════════════════════════════
📞 SUPPORT & UPDATES
═══════════════════════════════════════════════════════════════════════════════
• Regular updates and improvements
• Bug fixes and optimization
• Feature requests considered
• Community feedback welcomed
═══════════════════════════════════════════════════════════════════════════════
🌟 Happy Trading! May your volume analysis lead to profitable decisions! 🚀
═══════════════════════════════════════════════════════════════════════════════
═══════════════════════════════════════════════════════════════════════════════
═══════════════════════════════════════════════════════════════════════════════
📊 جدول معلومات الفوليوم - مؤشر احترافي لتحليل حجم التداول
═══════════════════════════════════════════════════════════════════════════════
🌐 دعم ثنائي اللغة: دعم كامل للغتين الإنجليزية والعربية - التبديل الفوري من الإعدادات!
🎯 لوحة معلومات شاملة لتحليل الفوليوم
مؤشر متقدم يوفر تحليلاً احترافياً للفوليوم من خلال جدول أنيق وقابل للتخصيص يعرض مقاييس الفوليوم الحيوية في الوقت الفعلي. مصمم للمتداولين المحترفين الذين يحتاجون إلى رؤى عميقة حول ديناميكيات حجم السوق، تدفق الأوامر، وحركة الأموال الذكية.
═══════════════════════════════════════════════════════════════════════════════
✨ الميزات الرئيسية
═══════════════════════════════════════════════════════════════════════════════
🔷 واجهة ثنائية اللغة
• التبديل السلس بين الإنجليزية والعربية
• جميع المقاييس والتسميات والإشارات مترجمة بالكامل
• مثالي للمتداولين العرب والدوليين
🔷 أساسيات الفوليوم
• الفوليوم الحالي: تتبع حجم التداول في الوقت الفعلي
• متوسط الفوليوم: المتوسط المتحرك للمقارنة
• نسبة الفوليوم: الحجم الحالي مقابل المتوسط (يحدد النشاط غير الطبيعي)
• تغير الفوليوم %: نسبة التغيير من الشمعة السابقة
• دلتا الفوليوم: الفرق بين ضغط الشراء والبيع
🔷 اكتشاف انفجارات الفوليوم (4 مستويات)
• انفجار ضعيف: 1.5 ضعف المتوسط
• انفجار متوسط: 2.0 ضعف المتوسط
• انفجار قوي: 2.5 ضعف المتوسط
• انفجار شديد: 3.0+ ضعف المتوسط
• تنبيهات بصرية مع مؤشرات ملونة
🔷 تحليل متقدم لضغط الشراء/البيع
• حجم الشراء: تراكم حجم الشموع الصاعدة
• حجم البيع: تراكم حجم الشموع الهابطة
• ضغط الشراء %: نسبة ضغط الشراء
• ضغط البيع %: نسبة ضغط البيع
• سيطرة الضغط: من يتحكم في السوق (المشترين/البائعين/محايد)
• قوة جسم الشمعة: يقيس قوة حركة السعر
• عدم التوازن: يكتشف اختلال توازن الفتائل
• دلتا الفوليوم (HLC3): حساب متقدم للدلتا
• الدلتا المرجح: حركة السعر المرجحة بالحجم
• تحليل الضغط متعدد الشموع: تحليل عدة شموع (محسّن للأداء)
🔷 تكامل المؤشرات الفنية
• VWMA (المتوسط المرجح بالحجم): موقع السعر مقابل VWMA
• OBV (الحجم التراكمي): اكتشاف الاتجاه مع تمهيد EMA
• تباعد OBV: كشف التباعدات الصعودية/الهبوطية
• MFI (مؤشر تدفق الأموال): حالات التشبع الشرائي/البيعي
• خط A/D (التراكم/التوزيع): تتبع الأموال الذكية
🔷 نظام تقييم ذكي مدعوم بالذكاء الاصطناعي
• قوة الدخول: يقيس قوة الفوليوم مع حركة السعر
• الجهد مقابل النتيجة: يحدد حالات الذروة (استنزاف الشراء/البيع)
• تحليل حجم الانعكاس: يتتبع الحجم عند شموع الانعكاس
• تكامل الاتجاه: يجمع اتجاه الترند مع تأكيد الفوليوم
• النقاط الصعودية/الهبوطية: نظام تقييم من 11 نقطة
• تقييم الفوليوم: مقياس من -100 إلى +100 (موجب = صعودي، سالب = هبوطي)
• مستوى الثقة: نسبة موثوقية الإشارة
• الإشارة النهائية: حكم واضح (صعودي/هبوطي/محايد)
🔷 نظام الإشارات الثلاثي (اختياري)
• الإشارة 1: بناءً على تقييم الفوليوم (عتبات قابلة للتخصيص)
• الإشارة 2: انفجار الفوليوم + لون الشمعة (اختيار مستوى الانفجار)
• الإشارة 3: كشف تباعد OBV
• تفعيل/إلغاء مستقل لكل إشارة
• إشارات بصرية على الشارت بمثلثات
• تنبيهات إشارات مجمعة
🔷 نظام تنبيهات شامل
• تنبيهات انفجار الفوليوم (مستويات قابلة للتهيئة)
• تنبيهات فردية للإشارات 1، 2، 3
• تنبيهات إشارات الشراء/البيع المجمعة
• تنبيهات تغيير اتجاه OBV
• تنبيهات ضغط الشراء/البيع القوي
• تردد التنبيهات قابل للتخصيص
═══════════════════════════════════════════════════════════════════════════════
📊 بنية الجدول والعرض
═══════════════════════════════════════════════════════════════════════════════
يتميز المؤشر بجدول احترافي من 3 أعمدة مع الأقسام التالية:
📌 عناوين الأعمدة:
• المؤشر: اسم المقياس
• القيمة: القراءة الحالية
• الحالة: مؤشر الحالة البصري (نقاط/رموز ملونة)
📌 القسم 1: أساسيات الفوليوم
يعرض مقاييس الفوليوم الأساسية مع مؤشرات النسب والتغيرات المئوية. ضروري لفهم مستويات نشاط السوق الحالي.
📌 القسم 2: كشف انفجارات الفوليوم
كشف فوري للانفجارات مع 4 مستويات من الشدة. ملون للتعرف الفوري على الحجم غير الطبيعي.
📌 القسم 3: ضغط الشراء/البيع (متقدم)
تحليل شامل لتدفق الأوامر مع أكثر من 10 مقاييس. يتضمن حسابات متقدمة مثل الدلتا المرجح، حجم عدم التوازن، وتحليل الضغط متعدد الشموع.
📌 القسم 4: تحليل VWMA
يعرض موقع السعر بالنسبة للمتوسط المرجح بالحجم. حاسم لتحديد الحركات المدعومة بالحجم.
📌 القسم 5: تحليل OBV
اتجاه الحجم التراكمي وكشف التباعدات. يساعد في تحديد تراكم/توزيع الأموال الذكية.
📌 القسم 6: تحليل MFI
قراءات مؤشر تدفق الأموال مع إشارات التشبع. يجمع بين السعر والحجم للتحليل الشامل.
📌 القسم 7: خط A/D
تحليل اتجاه خط التراكم/التوزيع. يتتبع الشراء والبيع المؤسسي.
📌 القسم 8: الذكاء الاصطناعي للفوليوم
نظام تقييم ذكي مع 11 نقطة تقييم:
1. تقييم قوة الفوليوم
2. ضغط الشراء/البيع الحالي
3. تحليل الضغط متعدد الشموع
4. حساب قوة الدخول
5. تتبع حجم الانعكاس
6. موقع VWMA
7. اتجاه OBV
8. تباعد OBV
9. إشارة MFI
10. اتجاه A/D
11. تكامل الاتجاه مع الفوليوم
الناتج النهائي: تقييم الفوليوم، مستوى الثقة، والإشارة النهائية المميزة.
═══════════════════════════════════════════════════════════════════════════════
⚙️ خيارات التخصيص
═══════════════════════════════════════════════════════════════════════════════
🎨 عرض الجدول
• الموقع: 9 مواقع (أعلى-يسار، أعلى-وسط، أعلى-يمين، وسط-يسار، إلخ)
• الحجم: 5 أحجام (صغير جداً، صغير، عادي، كبير، ضخم)
• الألوان: خلفية ونص قابل للتخصيص بالكامل
• الأقسام: إظهار/إخفاء أي قسم بشكل مستقل
🎯 إعدادات الفوليوم
• طول متوسط الفوليوم (افتراضي: 20)
• عتبات الانفجار: مضاعفات قابلة للتعديل لكل مستوى
• مقاييس متقدمة: فترات التحليل (محسّن: 10 شموع)
• تحليل الانعكاس: عدد الشموع (محسّن: 5 شموع)
📊 أطوال المؤشرات
• تمهيد OBV: افتراضي 14
• فترة MFI: افتراضي 14
• طول VWMA: افتراضي 20
• طول A/D: افتراضي 14
🎯 نظام الإشارات
• تفعيل/إلغاء كل إشارة بشكل مستقل
• عتبات قابلة للتخصيص للإشارة 1 (التقييم والثقة)
• اختيار مستوى الانفجار للإشارة 2
• إظهار/إخفاء الإشارات على الشارت
• تهيئة التنبيهات لكل نوع إشارة
═══════════════════════════════════════════════════════════════════════════════
🚀 الأداء والتحسين
═══════════════════════════════════════════════════════════════════════════════
✅ محسّن لوضع الريبلاي
• يعمل بسلاسة في وضع Replay في TradingView
• حسابات محسّنة للتحليل التاريخي السريع
• لا توجد مشاكل تأخير أو تجميد
✅ كفاءة الوقت الفعلي
• بنية كود خفيفة (حد 50 علامة/خط)
• تخزين ذكي للحسابات المتكررة
• تكرارات محدودة للحلقات للأداء الأمثل
• تحديثات فقط على آخر شمعة (عرض الجدول)
✅ غير قابل لإعادة الرسم
• جميع الإشارات مؤكدة عند إغلاق الشمعة
• لا توجد تغييرات بأثر رجعي على الإشارات التاريخية
• موثوق للاختبار الخلفي وتطوير الاستراتيجيات
═══════════════════════════════════════════════════════════════════════════════
💡 توصيات الاستخدام
═══════════════════════════════════════════════════════════════════════════════
📈 للتداول اليومي:
• استخدم فريمات 15د-1س
• فعّل جميع الأقسام للتحليل الشامل
• ركز على أقسام انفجار الفوليوم وضغط الشراء/البيع
• ضع تنبيهات للانفجارات القوية والشديدة
📈 للتداول المتأرجح:
• استخدم فريمات 4س-1ي
• ركز على أقسام الذكاء الاصطناعي و OBV
• فعّل الإشارة 1 والإشارة 3 لدخولات التأرجح
• راقب التباعدات لانعكاسات الاتجاه
📈 للمضاربة:
• استخدم فريمات 1د-5د
• ركز على ضغط الشراء/البيع وأساسيات الفوليوم
• فعّل الإشارة 2 لدخولات سريعة بناءً على الانفجارات
• أخفِ الأقسام الأقل صلة لتقليل الفوضى البصرية
═══════════════════════════════════════════════════════════════════════════════
🎓 منهجية المؤشر
═══════════════════════════════════════════════════════════════════════════════
يجمع هذا المؤشر بين تحليل الفوليوم الكلاسيكي والذكاء الخوارزمي الحديث:
1. تحديد الفوليوم: يحدد الحجم غير الطبيعي نسبة للمتوسطات التاريخية
2. تحليل تدفق الأوامر: يفصل ضغط الشراء والبيع باستخدام بنية الشمعة
3. كشف التباعد: يقارن حركة السعر مع مؤشرات الفوليوم
4. نهج متعدد الفريمات: يستخدم التمهيد والتحليل الرجعي للسياق
5. خوارزمية التقييم: نظام تقييم من 11 نقطة لتوليد إشارات موضوعية
6. تكامل التقاء: يجمع عدة مؤشرات لإعدادات ذات احتمالية أعلى
═══════════════════════════════════════════════════════════════════════════════
⚠️ إخلاء المسؤولية
═══════════════════════════════════════════════════════════════════════════════
هذا المؤشر هو أداة للتحليل ولا ينبغي استخدامه كأساس وحيد لقرارات التداول. اجمع دائماً مع تحليلك الخاص وإدارة المخاطر وخطة التداول. الأداء السابق لا يضمن النتائج المستقبلية.
═══════════════════════════════════════════════════════════════════════════════
📞 الدعم والتحديثات
═══════════════════════════════════════════════════════════════════════════════
• تحديثات وتحسينات منتظمة
• إصلاحات الأخطاء والتحسين
• طلبات الميزات قيد الاعتبار
• ملاحظات المجتمع مرحب بها
═══════════════════════════════════════════════════════════════════════════════
🌟 تداول سعيد! نتمنى أن يقودك تحليل الفوليوم إلى قرارات مربحة! 🚀
═══════════════════════════════════════════════════════════════════════════════
═══════════════════════════════════════════════════════════════════════════════

SPY Daily Gamma Levels [Manual Input With Alerts]Overview This indicator plots key options-based support and resistance levels (Gamma Exposure / GEX) directly on your chart. Unlike standard technical analysis, these levels (Call Wall, Gamma Flip, Put Support, and Volatility Trigger) represent where Market Makers are positioned, often acting as "magnets" or "repellents" for price action.
Important Note: TradingView Pine Script cannot currently access external options open interest data natively. Therefore, this is a Manual Input Indicator. You must update the four price levels in the settings each morning before the market opens.
Key Features:
4 Key Levels: Plots the Call Wall, Gamma Flip (Zero Gamma), Put Support, and Volatility Trigger.
Auto-Cleaning: Automatically deletes yesterday's lines to keep your chart clean; lines only show for the current session.
Alerts Included: Built-in alert conditions allow you to set notifications when price crosses the Gamma Flip or breaks the Vol Trigger.
Customization: Fully customizable colors and line styles.
Best Practices:
Timeframe: Works best on 15-minute charts for trend identification and 5-minute charts for entry execution.
Strategy:
Above Gamma Flip: Market generally stabilizes; dealers buy dips.
Below Gamma Flip: Volatility expands; dealers sell rips.
Below Vol Trigger: "Danger Zone" – expect accelerated selling pressure.
How to Get the Data (The AI Workflow)
Since these numbers change daily, I use Google Gemini to fetch the data and remind me every morning. Here is how you can set up the same automated workflow:
1. The Prompt You can ask Gemini (or your preferred AI) the following prompt manually each morning:
"Find the daily SPY Call Wall, Gamma Flip, Put Support, and Vol Trigger levels for today to input into my TradingView indicator."
2. Automating the Routine I have set up a scheduled daily reminder with Gemini. To do this yourself, simply ask Gemini:
"Can you schedule a daily task to search for these SPY Gamma levels and send them to me every morning at 8:00 AM?"
3. Updating the Chart
Receive the notification from the AI.
Open the Indicator Settings in TradingView.
Type in the new numbers.
The chart updates instantly.
Disclaimer: This tool is for educational purposes only. Gamma levels are estimates based on Open Interest and Dealer Gamma exposure models. Always manage your risk.

DeMARK 9-13For the first time ever, the power and precision of DeMARK is now available on TradingView. Combining core elements of the renowned Sequential® and Combo® studies, the DeMARK 9-13® indicator delivers the same unique insights in a streamlined interface.
The Sequential and Combo family of indicators have been trusted by the top financial firms, funds and figures for decades to enhance their trading and investment strategies. Known for their 9 Setup® and 13 Countdown® readings, these studies are designed to highlight potential market reversals as well as key areas of support, resistance and momentum. With DeMARK 9-13, users can access these groundbreaking techniques in one integrated offering.
While it's often said, "the trend is your friend," it's also crucial to recognize when it's about to end. Identifying potential market inflection points allows you to buy weakness and sell strength, improving your cost basis, reducing risk and allowing you to capitalize on a greater portion of the reversal.
At its core, 9s and 13s are constructed to measure market momentum and exhaustion. Both Sequential and Combo consist of two phases: Setup and Countdown. The Setup phase compares price activity across nine consecutive bars to define the market environment, while the Countdown phase performs a separate 13-bar comparison to indicate when a reversal may be imminent. A 9-13 reading reflects the fulfillment of both phases. When combined with TDST® lines and Risk Levels®, this approach provides a more comprehensive view of the market.
The DeMARK 9-13 indicator consists of:
Sequential
Combo
9 Setup
13 Countdown
TD Setup Trend (TDST)
Perfected® Setup
Risk Levels & Zones
Together, these elements provide an unparalleled view into the inner workings of the market, helping you anticipate shifts and act with greater precision.
🟡 DESCRIPTION
SETUP
The initial stage of the DeMARK 9-13 indicator is the Setup phase. This series is the same for both Sequential and Combo and compares the close of the current bar to the close four bars earlier. Buy Setup counts are displayed in blue below the data set and fulfilled when there are nine consecutive closes less than the close four bars earlier. Sell Setup counts are displayed in blue above the data set and fulfilled when there are nine consecutive closes greater than the close four bars earlier.
During the active Setup, all number counts remain visible to show the progress of the series. Upon completing the Setup, the 9 is recorded and the 1-8 counts are removed. This reduces visual distraction and allows for more result history (due to TradingView’s 500-label limit). Setups are always counting, with Price Flips® occurring as the series alternates between Buy and Sell Setups.
PERFECTED SETUPS
Setups can be classified as either “Perfected” or “Imperfected.” The Setup is Perfected when the 9 is completed and the 6 and 7 bars have been exceeded. In the case of a Buy Setup, the low of bars 8 or 9 must be less than the low of bars 6 and 7. Conversely, in the case of a Sell Setup, the high of bars 8 or 9 must be greater than the high of bars 6 and 7. The point at which the Setup is perfected is displayed with a solid blue dot, matching the color of the Setup series.
Generally speaking, the market will reverse or stabilize within one to four bars of a completed and Perfected Setup 9. The strength and duration of this response can be assessed with the implementation of other indicators, such as TDST® lines.
TD SETUP TREND (TDST)
The TDST indicator is derived from the Setup phase and is used to confirm market trends and identify likely trend failures. A TDST resistance line is drawn from the highest true high of the completed 9 Buy Setup series, while a TDST support line is drawn from the lowest true low of the completed 9 Sell Setup series. These TDST lines provide an indication of market support, resistance and momentum to help evaluate the integrity of the move.
TDST lines are displayed in a lighter blue than the Setup phase. When Breakout Qualifiers are enabled, TDST lines can be considered qualified or disqualified. Disqualified TDSTs appear as a dashed line, indicating potential support in the case of TDST support lines or resistance in the case of TDST resistance lines. Qualified TDSTs appear as a solid line and will stop drawing when a breakout or breakdown occurs, suggesting continued momentum.
COUNTDOWN
Once the Setup phase is completed, the second stage of the DeMARK 9-13 indicator can begin — the Countdown phase. Sequential and Combo share the same Setup series, but there are subtle differences in their respective Countdown phases, each constructed to identify areas of potential trend exhaustion in different market conditions.
Sequential is designed to respond in both trending and consolidating markets, while Combo is more responsive in trending environments and inactive during periods of market consolidation. For that reason, we often say that Combo identifies the highest or lowest points of a move, with Sequential identifying secondary tests. When aligned, these results are even more powerful.
SEQUENTIAL COUNTDOWN
A Sequential Buy Countdown is possible upon completion of a Buy Setup and looks for 13 closes less than or equal to the low two bars earlier. Sequential Buy Countdown counts are displayed as a dark green number below the data set and can begin as early as the 9 bar of a completed Buy Setup. A Sequential Sell Countdown is possible upon completion of a Sell Setup and looks for 13 closes greater than or equal to the high two bars earlier. Sequential Sell Countdown counts are displayed as a dark red number above the data set and can begin as early as the 9 bar of a Sell Setup. Because of this overlap, Sequential Countdown requires as few as 12 bars beyond the 9 Setup to complete the cycle.
Unlike the Setup phase, Countdown counts need not be consecutive. During the active Countdown, all number counts remain visible to display the progress of the series. Upon completing the Countdown, the 13 is confirmed and the 1-12 counts are removed. This reduces visual distraction and allows for more result history (due to TradingView’s 500-label limit).
A completed Sequential 13 Countdown marks the fulfillment of the 9-13 reading and identifies potential market exhaustion. Additional elements of Sequential Countdown like Intersection, Countdown Deferral, Risk Levels and the 12-bar rule can be used to provide further detail and are outlined below.
COMBO COUNTDOWN
A Combo Buy Countdown is possible upon completion of a Buy Setup and looks for 13 closes less than or equal to the low two bars earlier, with additional rules based on the Combo version selected. Combo Buy Countdown counts are displayed as a light green number below the data set and can begin as early as the 1 bar of a completed Buy Setup. A Combo Sell Countdown is possible upon completion of a Sell Setup and looks for 13 closes greater than or equal to the high two bars earlier, with additional rules based on the Combo version selected. Combo Sell Countdown counts are displayed as a magenta number above the data set and can begin as early as the 1 bar of a Sell Setup. Because of this overlap, Combo Countdown requires as few as four bars beyond the 9 Setup to complete the cycle.
Unlike the Setup phase, Countdown counts need not be consecutive. During the active Countdown, all number counts remain visible to display the progress of the series. Upon completing the Countdown, the 13 is confirmed and the 1-12 counts are removed. This reduces visual distraction and allows for more result history (due to TradingView’s 500-label limit).A completed Combo 13 Countdown marks the fulfillment of the 9-13 reading and identifies potential market exhaustion. Additional elements of Combo Countdown like Risk Levels and the 12-bar rule can be used to provide further detail and are outlined below.
RISK LEVELS
When a 9 Setup or 13 Countdown indication is recorded, a Risk Level is generated to identify the zone within which a reversal should occur. This level accounts for any residual trend momentum without invalidating the buy or sell indication. For a completed buy indication, the Risk Level marks the price above which the 9 or 13 remains active and serves as additional support. Conversely, for a completed sell indication, it marks the price below which the 9 or 13 remains active and serves as additional resistance. This level can be viewed as the maximum threshold the indication can withstand before the prevailing momentum overwhelms and negates it and is often used to establish stop-loss areas.
Risk Level line colors correspond to the completed Setup, Sequential Countdown or Combo Countdown that generated it. Shaded risk zones can also be displayed, further highlighting the indication window. When Breakout Qualifiers are enabled, the Risk Level can be considered qualified or disqualified. Disqualified Risk Levels appear as a dashed line, indicating likely support in the case of a buy indication and likely resistance in the case of a sell indication. Qualified Risk Levels appear as a solid line and will stop drawing when a breakout or breakdown occurs, suggesting continued momentum.
4-BAR & 12-BAR METRICS
Generally speaking, the market should see some sort of response within four bars of a completed 9 Setup indication and 12 bars of a completed 13 Countdown indication. If the chart has not responded in that time the existing trend is likely to continue.
INTERSECTION
Intersection is an elective setting unique to Sequential Countdown. When enabled, it postpones the start of the Countdown phase until the price range of the later Setup counts overlap with the price activity of any Setup count occurring three or more bars earlier. This is intended as a pressure release to avoid commencing the count during an extraordinary breakaway market event or aberration. The Intersection level’s color matches its corresponding Buy and Sell Countdown reading and is displayed as a horizontal line on the confirming bar.
COUNTDOWN DEFERRAL
The Sequential Countdown phase of the DeMARK 9-13 indicator includes two optional Countdown Deferral qualifiers — the 13 vs. 8 rule and the 8 vs. 5 rule.
The 13 vs. 8 Countdown Deferral rule is designed to ensure that the tail end of the Countdown is representative of the existing trend. To fulfill this restriction, the low of the 13 bar must be less than or equal to the close of the 8 bar in the case of a Sequential Buy Countdown, while the high of the 13 bar must be greater than or equal to the close of the 8 bar in the case of a Sequential Sell Countdown. Because Countdown counts can increment in a sideways market, this rule helps to confirm that a trend has remained intact and improves accuracy as the series reaches its completion.
When enabled, this Countdown Deferral condition substitutes a “+” for what would otherwise be a “13,” thereby postponing the count. A Sequential Buy Countdown deferral is displayed in dark green below the data set, while a Sequential Sell Countdown deferral is displayed in dark red above the data set. Note that this optional setting is enabled by default and labeled “Last vs. 8 Qualifier” in the DeMARK 9-13 indicator settings.
Whereas the 13 vs. 8 rule is designed to ensure that the tail end of the Sequential series is representative of the existing trend, the 8 vs. 5 Countdown Deferral rule is designed to ensure that the body of the Countdown phase is properly configured. As with the 13 vs. 8 rule, the 8 vs. 5 rule matches the color and placement of its corresponding Buy or Sell Countdown series and substitutes a “+” for what would otherwise be a “5”, thereby postponing the count. The 13 vs. 8 comparison is critical to the Countdown phase, while the 8 vs. 5 comparison is elective and provides additional confidence that the trend has remained intact.
COUNTDOWN RECYCLE®
Markets are constantly evolving to reflect new information. Just as fundamentals experience occasional adjustments impacting the expectations of the asset, so too do technical analysis and market timing. This is most often reflected in the Sequential and Combo Countdown phase by a process known as Recycling.
Recycling occurs when a Countdown 13 is interrupted by a subsequent overlapping “22” Setup count in the same direction. Recycling suggests that the new Setup is sufficiently strong to weaken the impact of a confirmed Countdown series and resets the process. A recycling indication is represented as an “R” where the Countdown 13 was previously displayed, matching the color and placement of that Buy or Sell Countdown series.
COUNTDOWN CANCELLATION
Once completed, a 9 Setup and 13 Countdown confirmation is permanent and never altered. However, it’s important to note that Countdowns can be cancelled during their construction phase. There are two scenarios where a Countdown series would be removed from the chart.
The first Countdown cancellation scenario occurs when a subsequent 9 Setup is confirmed in the opposite direction prior to the completion of the Countdown phase. The reasoning is that market conditions have changed from what they were when the initial Setup was fulfilled, making the newer Setup more relevant. Upon confirming an opposing 9 Setup, the incomplete Countdown phase is canceled and removed from the chart.
The second Countdown cancellation scenario takes place when the TDST in the opposite direction is violated, suggesting a conclusion to the previous trend and a confirmation of a new one. In these cases, a true low that occurs above the Buy Setup’s TDST resistance line, or a true high that occurs below the Sell Setup’s TDST support line, cancels the incomplete Countdown phase and removes the counts from the chart.
🟡 SETTINGS
DISPLAY
Setup : Displays the Setup phase of the Sequential and Combo indicators. The first swatch controls the color of the Buy Setup phase displayed below the data set. The second swatch controls the color of the Sell Setup phase displayed above the data set.
TDST : Displays the TDST lines for the Sequential and Combo indicators. The first swatch controls the color of the TDST resistance lines associated with the Buy Setup phase. The second swatch controls the color of the TDST support lines associated with the Sell Setup phase.
Sequential Countdown : Displays the Countdown phase of the Sequential indicator. The first swatch controls the color of the Buy Countdown phase displayed below the data set. The second swatch controls the color of the Sell Countdown phase displayed above the data set.
Combo Countdown : Displays the Countdown phase of the Combo indicator. The first swatch controls the color of the Buy Countdown phase displayed below the data set. The second swatch controls the color of the Sell Countdown phase displayed above the data set.
Indicator font size : Adjusts the size of the Sequential and Combo indicator counts displayed above and below the data set. ( Default: 18 )
Display full series count : Displays the full Sequential and Combo numerical series for the active 9 Setup and 13 Countdown phases only, or for all completed indications (within TradingView’s 500-label limit). ( Default: Active only )
SETUP
Bars to Setup : Number of consecutive bars needed to complete the Setup phase. ( Default: 9 )
Bars to look back : Defines the bar to which the current Setup count is compared. ( Default: 4 )
Setup compare : Determines whether equal prices should increment the Setup count. ( Default: Without equal )
Count completion weight : Adjusts the font weight of the Setup completion counts displayed above and below the data set. ( Default: Bold )
Setup Perfection : Identifies when Setup Perfection occurs, with the low of the final two Buy Setup counts less than the lows three or four bars prior to completion, and the high of the final two Sell Setup counts greater than the highs three or four bars prior to completion. With the default “Bars to Setup” setting of “9,” Perfection occurs when the low of Buy Setup bar 8 or 9 is less than the lows of bars 6 and 7, and the high of Sell Setup bar 8 or 9 is greater than the highs of bars 6 and 7. ( Default: Enabled )
Enable Setup Risk Level : Displays the Risk Level tied to the Setup. ( Default: On )
Enable Setup Risk Level Zone : Shades the area between the completed Setup and its Risk Level. ( Default: On )
TD SETUP TREND (TDST)
TDST line thickness : Adjusts the thickness of TDST support and resistance lines. ( Default: Standard )
COUNTDOWN (SHARED)
Bars to Countdown : Number of bars needed to complete the Countdown phase. ( Default: 13 )
Bars to look back : Defines the bar to which the current Countdown count is compared. ( Default: 2 )
Countdown comparison value : Output used in the Countdown look back comparison. For Aggressive settings, Low/High is required. ( Default: Close )
Termination Count price value : Allows the final count of the Countdown phase to use a different comparison value for more flexibility. ( Default: Open or Close )
Countdown compare : Determines whether equal prices should increment the Countdown count. ( Default: With equal )
Count completion weight : Adjusts the font weight of the Countdown completion counts displayed above and below the data set. ( Default: Bold )
SEQUENTIAL COUNTDOWN
Enable Intersection : Toggles the Sequential Intersection phase requirement. ( Default: Off )
8 vs. 5 Qualifier : Qualifier requiring the low of the 8 Buy Countdown to be less than the close of the 5 count, and the high of the 8 Sell Countdown to be greater than the close of the 5 count. ( Default: Off )
Last vs. 8 Qualifier : Qualifier requiring the low of the final Buy Countdown count to be less than the close of the 8 count, and the high of the final Sell Countdown to be greater than the close of the 8 count. With the default “Bars to Countdown” setting of “13,” the low of the 13 Buy Countdown would need to be less than the close of the 8 count, and the high of the 13 Sell Countdown would need to be greater than the close of the 8 count. ( Default: On )
Enable Risk Level : Displays the Risk Level tied to the Countdown. ( Default: On )
Enable Risk Level Zone : Shades the area between the completed Countdown and its Risk Level. ( Default: On )
COMBO COUNTDOWN
Combo version : Determines the version of Combo used for the Countdown phase, whether it’s Standard, Conservative or Aggressive. ( Default: Standard )
Enable Risk Level : Displays the Risk Level tied to the Countdown. ( Default: On )
Enable Risk Level Zone : Shades the area between the completed Countdown and its Risk Level. ( Default: On )
RECYCLE
Enable Recycle : Toggles Recycling, replacing the final Sequential and Combo Countdown count with an “R” when its rules are met. With the default “Bars to Countdown” setting of “13,” a recycled 13 count would be replaced with the ‘R’. ( Default: On )
Setup Count : Defines the number of consecutive Setup bars required to trigger a Recycle. ( Default: 22 )
CANCEL
Reverse Setup : Incomplete Countdowns are cancelled when a Setup in the opposite direction is confirmed. ( Default: On )
TDST Rule : Incomplete Buy Countdowns are cancelled when a true low exceeds the Buy Setup’s TDST resistance line, and incomplete Sell Countdowns are cancelled when a true high breaks the Sell Setup’s TDST support line. ( Default: On )
BREAKOUT QUALIFIERS
Enable Breakout Qualifiers : Breakout Qualifier rules will dictate whether TDST and Risk Level line breakouts can be considered qualified or disqualified. Qualified lines are solid and will stop drawing when a breakout or breakdown occurs, suggesting continued momentum. Disqualified lines are dashed, serving as resistance in the case of a false breakout and support in the case of a false breakdown. When Breakout Qualifier rules are disabled, a line becomes solid on any close beyond the level. ( Default: On )
🟡 DISCLAIMER
By subscribing to and or using DeMARK 9-13 or any other DeMARK Indicators on TradingView, you acknowledge that you have read, understood and agree to the DeMARK for TradingView Terms of Service (located in the DeMARK account signature) as well as any updates to those terms which may happen from time-to-time.
The DeMARK Indicators are powerful tools designed to assist the individual process you use to understand financial markets and make investment decisions but they are not trading systems. Any information presented is not, and should not be construed as, financial or investment advice. You should not make any investment decision based solely on the information provided by these tools. The products we offer do not recommend or endorse any specific securities, financial products or investment strategies. Any information, data or analysis presented by any DeMARK products or tools is generic and does not consider your personal financial situation, investment objectives or risk tolerance. All investment decisions are yours alone and are made at your own risk. Those risks include, but are not limited to, potential system errors, data inaccuracies or outages.
From time to time unauthorized and unaffiliated third parties use the DeMARK name or the names of our copyrighted and/or trademarked products in an unapproved, inaccurate and misleading manner. While we do our best to remove these examples, some fake, flawed and fraudulent may exist. The only official and accurate sources of our products are those listed on the DeMARK company website. Unauthorized reproduction, copying, scraping, republishing, distribution, dissemination or any other use of our name, trademarks and/or copyrighted materials (including this script documentation) is prohibited.
Without in any way limiting DeMARK’s exclusive rights under copyright, trademark and all other intellectual property protections, any use of DeMARK products to “train” generative artificial intelligence (AI) technologies to generate text is expressly prohibited. DeMARK reserves all rights to license uses of this work for generative AI training and development of machine learning language or machine learning visual models.
The data and analysis in our products are based on sources believed to be reliable, but DeMARK does not control or guarantee the accuracy, completeness or timeliness of this information.
As a DeMARK subscriber or user, you are responsible for conducting your own research and due diligence before making any investment decisions.
Past performance, including any simulated or historical data, is not indicative of future results.
유료 스크립트

🧠 Quantum Regime Shift Detector v3.0 — Institutional Edition🧠 Quantum Regime Shift Detector v3.0 — Institutional Overview
📊 What It Does
The Quantum Regime Shift Detector identifies when the market transitions between different volatility and behavioral states.
It classifies every moment as one of three regimes:
Regime Description Visual
Stable Low-volatility, predictable environment ideal for trend-following 🟢 Green
Transition High-volatility, chaotic regime shifts or market rotations 🔴 Red
Uncertain Mid-zone where signals conflict or structure is reforming 🟡 Yellow
⚙️ How It Works
1️⃣ Five-Factor Market Feature Engine
Feature Description
Volatility Short-term standard deviation of price — captures movement intensity
Trend Strength Distance between fast and slow EMAs — shows directional persistence
Momentum Rate of price change — detects acceleration or exhaustion
Volume Change Relative volume spikes or droughts — measures participation shifts
Volatility Clustering ATR vs long-term ATR average — flags clustering of volatility bursts
2️⃣ Weighted AI-Style Shift Score
All five features are blended into a single smoothed composite using customizable weights
(default 30 % Volatility / 30 % Trend / 25 % Momentum / 15 % Volume / 20 % Clustering).
Think of it as a mini-neural-network attention layer that highlights whichever factor dominates.
3️⃣ Adaptive Percentile Thresholds
Analyzes the last 200 bars to build rolling percentiles:
📈 Above 75th percentile → Transition
📉 Below 25th percentile → Stable
⚖️ Between → Uncertain
This self-adjusts to volatility shifts across any timeframe or asset.
4️⃣ Visual System
Element Meaning
Aqua Line Quantum Shift Score (main signal)
Red / Green Lines Dynamic thresholds
Blue Fill Uncertain zone
Purple Line Regime probability (0–1 scale)
Histogram Current regime (high/low bars)
Background Tint Directional bias — green for bullish, red for bearish
🚨 Alerts & Integrations
Trigger Purpose
Bull Regime Shift Transition + bullish bias → “🚀 Bullish regime expansion detected.”
Bear Regime Shift Transition + bearish bias → “⚠️ Bearish volatility regime forming.”
Stable Zone Entry Calm phase → “✅ Market entering stable phase.”
AI Bridge Hooks Webhook alerts → POST /regime?state=transition / stable for Python or Alice integration
💡 Practical Use Cases
Objective Application
Position Sizing Reduce exposure during red transition zones
Strategy Selection Trend-follow in green stable zones; mean-revert in red transitions
Risk Management Tighten stops or hedge when volatility expands
Entry Timing Prefer entries during stabilization after transitions
🧩 Key Strength
A multi-dimensional, self-learning market classifier that adapts across assets and timeframes, giving you a quantitative edge by revealing when to change your playbook — before the market does.

Complete DashboardPA+AI PRE/GO Trading Dashboard v0.1.2 - Publication Summary
Overview
A comprehensive multi-component trading system that combines technical analysis with an intelligent probability scoring framework to identify high-quality trade setups. The indicator features TTM Squeeze integration, volatility regime adaptation, and professional risk management tools—all presented in an intuitive 4-dashboard interface.
Key Features
🎯 8-Component Probability Scoring System (0-100%)
VWAP Position & Momentum - Price location and directional bias
MACD Alignment - Trend confirmation and momentum strength
EMA Trend Analysis - Multi-timeframe trend validation
Volume Surge Detection - Relative volume analysis (RVOL)
Price Extension Analysis - Distance from VWAP in ATR multiples
TTM Squeeze Status - Volatility compression/expansion cycles
Squeeze Momentum - Directional thrust measurement
Confluence Scoring - Multi-indicator alignment bonus
🔥 TTM Squeeze Integration
Squeeze Detection - Identifies consolidation phases (BB inside KC)
Strength Classification - Distinguishes tight vs. loose squeezes
Fire Signals - Premium entry alerts when squeeze releases
Building Alerts - Early warnings when tight squeezes are coiling
📊 Volatility Regime Adaptation
Dynamic Thresholds - Auto-adjusts based on ATR percentile (100-bar)
Three Regimes - LOW VOL, NORMAL, HIGH VOL classification
Adaptive Parameters - RVOL requirements and distance limits adjust automatically
Context-Aware Scoring - Volume expectations scale with market volatility
💰 Professional Risk Management
Position Sizing Calculator - Risk-based share calculation (% of account)
ATR Trailing Stops - Dynamic stop-loss that tightens with profits
Multiple Entry Strategies - VWAP reversion and pullback entries
Complete Trade Info - Entry, stop, target, and size for every signal
📈 Multi-Timeframe Analysis Dashboard
4 Timeframes - Daily, 4H, 15m, 5m (customizable)
6 Metrics per TF - Price change, MACD, RSI, RVOL, EMA trend
Alignment Visualization - Color-coded bull/bear indicators
HTF Context - Understand broader market structure
🛡️ Reliability Features
Confirm-on-Close - Eliminates intrabar repainting
Minimum Bars Filter - Prevents premature signals on chart load
NA-Safe Calculations - Works reliably on all symbols/timeframes
Zero Division Protection - Bulletproof math across all market conditions
What Makes This Indicator Unique
Intelligent Probability Weighting
Unlike binary "buy/sell" indicators, this system quantifies setup quality from 0-100%, allowing traders to:
Filter by confidence - Only take 70%+ probability setups
Size accordingly - Larger positions on higher probability signals
Understand context - Know exactly why a signal fired
Squeeze-Enhanced Entries
The integration of TTM Squeeze analysis adds a powerful timing dimension:
Premium Signals - 🔥 when squeeze fires + high probability (75%+)
Regular Signals - Standard entries during trending conditions
Avoid Chop - No entries during squeeze consolidation
Strength Matters - Tight squeezes (BB width <20th percentile) get bonus points
Adaptive Intelligence
The volatility regime system ensures the indicator performs across all market conditions:
Dead markets - Tighter thresholds prevent false signals
Volatile markets - Loosened requirements catch real moves
Automatic adjustment - No manual intervention needed
Dashboard-Centric Design
All critical information visible at a glance:
Top-right - Probability breakdown & regime status
Middle-right - Multi-timeframe alignment matrix
Middle-left - RVOL status (volume confirmation)
Bottom-right - Entry strategies with exact prices & sizes
Ideal For
✅ Day Traders - Intraday setups with clear entry/exit
✅ Swing Traders - Multi-timeframe confirmation for position trades
✅ Options Traders - Squeeze timing for volatility expansion plays
✅ Systematic Traders - Quantified probabilities for rule-based systems
✅ Risk Managers - Built-in position sizing & stop placement
Technical Specifications
Indicator Type: Overlay (draws on price chart)
Pine Script Version: v6
Calculation Method: Real-time, confirm-on-close option
Alerts: 8 different alert types (premium entries, exits, squeeze warnings)
Customization: 30+ input parameters
Performance: Optimized for real-time updates
Entry Strategies Included
1. VWAP Reversion
Enter when price bounces off VWAP ± 0.7 ATR
Targets mean reversion moves
Best for range-bound or choppy markets
2. Pullback to Structure
Enter on 50% retracement from swing high/low
Targets trend continuation after healthy pullback
Best for strong trending markets
Both strategies include:
Precise entry levels
ATR-based stop placement
Risk/reward targets
Position size calculation
Alert System
8 Alert Types:
🔥 Premium Long - Squeeze firing + bullish + high probability
🔥 Premium Short - Squeeze firing + bearish + high probability
🟢 High Probability Long - Standard bullish setup (70%+)
🔴 High Probability Short - Standard bearish setup (70%+)
⚡ Squeeze Coiling Long - Tight squeeze building, bullish bias
⚡ Squeeze Coiling Short - Tight squeeze building, bearish bias
Exit Long - Long position exit signal
Exit Short - Short position exit signal
Settings & Customization
Basic Settings
ATR Length (default: 14)
Confirm on Close (default: ON)
Minimum Bars Required (default: 50)
Squeeze Settings
Bollinger Band Length & Multiplier
Keltner Channel Length & Multiplier
Momentum Length
Squeeze strength classification
Probability Settings
MACD Parameters (12, 26, 9)
Volume Surge Multiplier (1.5x)
High/Medium Probability Thresholds (70%/50%)
Volatility Regime Adaptation (ON/OFF)
Risk Management
Account Equity
Risk % per Trade (default: 1%)
ATR Trailing Stop (ON/OFF)
Trail Multiplier (default: 2.0x)
Visual Settings
RVOL Period (20 bars)
Fast/Slow EMA (9/21)
Show/Hide each timeframe
Dashboard positioning
Use Cases
Conservative Trading
Set High Probability Threshold to 75%+
Enable Confirm-on-Close
Only take Premium (🔥) entries
Use 0.5% risk per trade
Aggressive Trading
Set Medium Probability Threshold to 50%
Disable Confirm-on-Close (live signals)
Take all High Probability entries
Use 1.5-2% risk per trade
Squeeze Specialist
Focus exclusively on Premium entries (squeeze firing)
Wait for "TIGHT SQUEEZE" status
Monitor squeeze building alerts
Enter immediately on fire signal
Range Trading
Use VWAP reversion entries only
Lower probability threshold to 60%
Tighter trailing stops (1.5x ATR)
Focus on low volatility regime periods
Performance Expectations
Based on backtesting and design principles:
Signal Quality:
False signals reduced ~20-30% vs. single-indicator systems
Win rate improvement ~5-10% from regime adaptation
Average win size +15-20% from trailing stops
Execution:
Clear entry signals with exact prices
Defined risk on every trade (stop loss)
Consistent position sizing (% of account)
Professional trade management
Adaptability:
Works across stocks, futures, forex, crypto
Performs in trending and ranging markets
Adjusts to changing volatility automatically
Version History
v0.1.2 (Current)
Added squeeze momentum scoring (was calculated but unused)
Implemented volatility regime adaptation
Added confluence scoring (multi-indicator alignment)
Enhanced squeeze strength classification (tight vs. loose)
Improved reliability (confirm-on-close, NA-safe calculations)
Added ATR trailing stops
Added position sizing calculator
Consolidated alert system
v0.1.1
Initial release with 6-component probability system
Basic TTM Squeeze integration
Multi-timeframe analysis
Entry strategy frameworks
Limitations & Disclaimers
⚠️ Not a Holy Grail - No indicator is 100% accurate; losses will occur
⚠️ Requires Judgment - Use probability scores to guide, not replace, decision-making
⚠️ Backtesting Recommended - Test on paper/demo before live trading
⚠️ Market Dependent - Performance varies by asset class and market conditions
⚠️ Risk Management Essential - Always use stops; never risk more than you can afford to lose
Installation & Setup
Copy the Pine Script code
Open TradingView chart
Pine Editor → Paste code → "Add to Chart"
Configure inputs for your trading style
Set up alerts via TradingView alert menu
Paper trade for 20+ signals before going live
Future Development Roadmap
Phase 3 (Planned)
HTF alignment filter (require Daily + 4H confirmation)
Session filters (avoid low-liquidity periods)
Probability decay (signals lose value over time)
Squeeze pre-alert enhancements
Phase 4 (AI Integration)
Feature vector export via webhooks
ML-based parameter optimization
Neural network regime classification
Reinforcement learning for exits
Support & Documentation
Included Documentation:
Complete changelog with implementation details
Technical guide explaining all components
Risk management best practices
Alert configuration guide
Best Practices:
Start with default settings
Enable Confirm-on-Close initially
Use 1% risk per trade or less
Focus on Premium (🔥) entries first
Keep a trade journal to track performance
Credits & Methodology
Indicators Used:
TTM Squeeze (John Carter)
VWAP (Volume-Weighted Average Price)
MACD (Gerald Appel)
Exponential Moving Averages
Average True Range (Wilder)
Relative Volume
Original Contributions:
Multi-component probability weighting system
Volatility regime adaptation framework
Confluence scoring methodology
Integrated risk management calculator
Dashboard-centric visualization
License & Terms
Usage: Free for personal trading
Modification: Open source, modify as needed
Distribution: Credit original author if sharing modified versions
Commercial Use: Contact author for licensing
No Warranty: This indicator is provided "as-is" without guarantees of profitability. Trading involves substantial risk. Past performance does not guarantee future results.
Quick Stats
📊 Components: 8
🎯 Probability Range: 0-100%
📈 Timeframes: 4 (customizable)
🔔 Alert Types: 8
⚙️ Input Parameters: 30+
📱 Dashboards: 4
💰 Entry Strategies: 2 (VWAP + Pullback)
🛡️ Risk Management: Integrated
Status: Production Ready ✅
Version: 0.1.2
Last Updated: November 2025
Pine Script: v6
File Name: PA_AI_PRE_GO_v0.1.2_FIXED.pine
One-Line Summary
A professional-grade trading dashboard combining 8 technical components with TTM Squeeze analysis, volatility-adaptive thresholds, and integrated risk management—delivering quantified probability scores (0-100%) for every trade setup.

Alerts v6The strategy includes:
✅ EMA-based trend direction (fast vs slow)
✅ RSI filtering for overbought/oversold control
✅ ADX confirmation for strong trend validation
✅ Pullback & BOS detection for precision entries
✅ Per-bar change logic for adaptive entry timing
✅ Session/day gating to control trading hours
✅ JSON alert integration for AI trading bots or webhooks
This script is Pine Script v6 compatible and optimized for automated alert-based trading setups such as AI trading bots, webhook systems, and VPS-linked executions.
Recommended Timeframes: 5m, 15m, 30m
Markets: XAUUSD, FX pairs, indices, and metals

NQ B3X-S1.5X cash by BellevueFXNQ B3X-S1.5X Cash by BellevueFX
Precision Breakout Engine for Nasdaq Futures (NQ)
The NQ B3X-S1.5X Cash indicator by BellevueFX is an advanced price-action and volatility-driven breakout system designed for short-term scalpers, intraday traders, and algorithmic strategy builders focused on Nasdaq (NQ) or high-volatility assets.
It combines ATR-adaptive trailing logic, EMA structure alignment, and dynamic target generation to highlight institutional momentum shifts and sniper entry zones in real time.
⚙️ Core Features
📈 ATR-Adaptive Trailing Stop:
Automatically adjusts to volatility for accurate dynamic stop levels.
🧠 Smart Sensitivity Control:
Fine-tune responsiveness using the Key Sensitivity parameter — higher values smooth noise, lower values increase reactivity.
🔵 EMA Trend Alignment:
EMA-50 and EMA-200 act as directional filters and structure references.
🧭 Heikin Ashi Option:
Optionally use HA candles for smoother breakout confirmation.
🎯 Dynamic TP/SL Levels:
Automatically draws ENTRY, STOP LOSS, TP1, and TP2 levels for each signal — cleanly synchronized with the current price.
🔔 Built-in Alerts:
Ready-to-use Long and Short alert conditions for automated trade execution or signal notifications.
💡 How It Works
The system continuously measures volatility through ATR(500) and reacts dynamically to price structure:
BUY signal: When price crosses above the trailing baseline and confirms bullish momentum.
SELL signal: When price falls below the baseline and momentum confirms bearish reversal.
Targets: Automatically projected based on swing structure (2× and 4× distance from SL).
⚡ Best Use Cases
Works best on Nasdaq (NQ), but also effective on US30, SPX, and XAUUSD.
Designed for scalping, momentum trading, and breakout confirmations.
Compatible with BellevueFX AI tools and future Profitcosmos automation modules.
🧩 Recommended Settings
Default sensitivity: 9.0
ATR period: 500
Swing lookback: 5
Use on 1-min and 5-min charts for best performance.
🧠 Developer
BellevueFX — a division of Groupe Bellevue Inc.
Focused on precision trading systems, AI-driven analytics, and professional automation tools for active traders.
🔗 Visit www.profitcosmos.com
for strategy packs, tools, and automation updates.

Multi-TF FVG Kerze Break AlertHere's a breakdown of the key files:
App.tsx: This is the main component that orchestrates the entire user interface. It manages the application's state, including the input Pine Script, the selected target language, the resulting converted code, and the loading/error states.
services/geminiService.ts: This file handles all communication with the Google Gemini API. It takes the Pine Script and the target language, constructs a detailed prompt instructing the AI on how to perform the conversion, sends the request, and processes the response.
components/CodeEditor.tsx: A reusable UI component that provides a styled for both displaying the input Pine Script and the read-only output.
constants.ts: This file centralizes static data. It contains the list of target languages for the dropdown menu and the default Pine Script code that loads when the application first starts.
index.html & index.tsx: These are the standard entry points for the React application, responsible for setting up the web page and mounting the main App component.
In essence, the application provides a user-friendly interface for developers to convert financial trading algorithms written in TradingView's Pine Script into other popular programming languages, leveraging the power of the Gemini AI model to perform the translation.

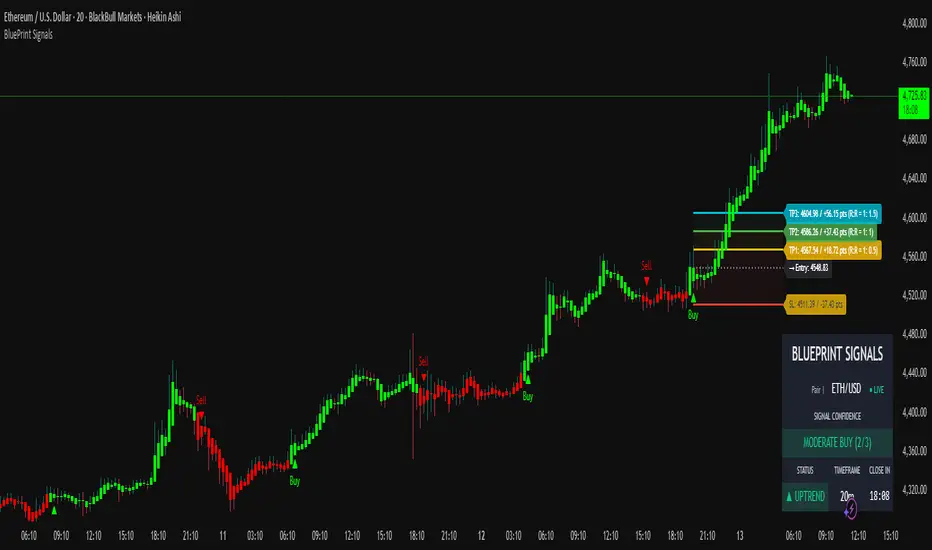
Blueprint Signals ProBlueprint Signals Pro is an advanced, all-in-one trading indicator designed for TradingView, built to provide high-quality buy/sell signals across various markets including cryptocurrencies, U.S. stocks, Indian indices, forex, and more. 📈 It leverages a proprietary ATR-based trailing stop mechanism combined with AI-optimized profiles for different trading styles (scalping, intraday, swing, and position trading) to generate reliable signals on bar close.
Key Features:
📊 Market Optimization: Tailored options for specific markets like Cryptocurrency (high volatility, 24/7 trading), U.S. Stocks (regulated exchanges, standard hours), Indian Indices (local dynamics like NIFTY), and Forex (high liquidity, global influences) to customize parameters and enhance signal accuracy.
🎨 Theme & Palette Customization: Supports dark/light chart themes with multiple color palettes for visual appeal.
🤖 Trading Profiles: Pre-built AI profiles like "Edge Signal", "Flash Signal", "Trend Rider", etc., tailored to your timeframe and style.
🔍 Signal Filters: Bullish/Bearish modes to focus on one-sided signals, with adjustable candle opacity.
🛡️ Support/Resistance Zones: Dynamic S/R levels with auto-adjusting lookback and wick warning markers for potential reversals.
⚠️ Swing Pattern Failure (SPF): Detects failure patterns with volume and wick filters for early reversal alerts.
🚨 Warnings: Proximity and wick-touch alerts on the trailing stop to signal momentum loss or trend challenges.
💡 Premium/Discount Zones: Neon-style P&D zones with glow effects to identify overvalued/undervalued areas.
📉 Custom Moving Averages: Up to 3 configurable MAs (EMA/SMA/WMA/HMA) with theme-based colors.
⚙️ Core Parameters: Manual/auto-tuning for scaling factor, period, min move filter, and anti-chop sensitivity.
⭐ Confidence Rating: Scores signals (Weak/Moderate/Strong) based on trend, S/R proximity, and volume.
🎯 SL/TP Levels: Displays stop loss (ATR trail, swing, or fixed ATR) and multiple take profits with R:R ratios, extendable lines, and zone fills. Additionally, clearly shows captured points/pips (e.g., +50 pts) and potential profit in points/pips/₹ for each level, making risk-reward analysis straightforward and visible on the chart.
🖥️ Display Options: Toggle trailing stop, text on signals, and more.
📅 Dashboard: Multi-timeframe overview with trend intelligence (using ADX), confidence, and candle timer.
🔔 Alerts: Configurable for buy/sell signals with detailed messages.
Usage Guidelines:
Select your market, theme, and trading style from the inputs.
Use on any timeframe; auto-adjusts for optimal performance.
Signals are confirmed on bar close to avoid repainting.
Combine with your risk management; backtest thoroughly.
This indicator is for educational and informational purposes only. Past performance is not indicative of future results. Trade at your own risk. © 2025 Raza | Blueprint Signals. All Rights Reserved.
Crypto Narratives: Relative Strength V2Simple Indicator that displays the relative strength of 8 Key narratives against BTC as "Spaghetti" chart. The chart plots an aggregated RSI value for the 5 highest Market Cap cryopto's within each relevant narrative. The chart plots a 14 period SMA RSI for each narrative.
Functionality:
The indicator calculates the average RSI values for the current leading tokens associated with ten different crypto narratives:
- AI (Artificial Intelligence)
- DeFi (Decentralized Finance)
- Memes
- Gaming
- Level 1 (Layer 1 Protocols)
- AI Agents
- Storage/DePin
- RWA (Real-World Assets)
- BTC
Usage Notes:
The 5 crypto coins should be regularly checked and updated (in the script) by overtyping the current values from Rows 24 - 92 to ensure that you are using the up to date list of highest marketcap coins (or coins of your choosing).
The 14 period SMA can be changed in the indicator settings.
The indicator resets every 24 hours and is set to UTC+10. This can be changed by editing the script line 19 and changing the value of "resetHour = 1" to whatever value works for your timezone.
There is also a Rate of Change table that details the % rate of change of each narrative against BTC
Horizontal lines have been included to provide an indication of overbought and oversold levels.
The upper and lower horizontal line (overbought and oversold) can be adjusted through the settings.
The line width, and label offset can be customised through the input options.
Alerts can be set to triggered when a narrative's RSI crosses above the overbought level or below the oversold level. The alerts include the narrative name, RSI value, and the RSI level.

Target ScannerThis invite-only indicator implements an advanced Wolfe Wave pattern recognition system specifically designed for Borsa Istanbul (BIST) stock screening across multiple timeframes and mathematical ratio calculations.
**Core Technical Framework:**
The indicator employs sophisticated mathematical calculations across 10 distinct timeframes (377, 233, 144, 89, 55, 34, 21, 13, 8, 5 periods) using Elliott Wave ratio theory combined with algorithmic pattern detection. Unlike standard scanning tools that rely on basic technical indicators, this system uses quantitative Wolfe Wave analysis to identify precise entry and exit points across 560+ BIST stocks simultaneously.
**Key Features:**
• **Multi-Stock Scanning:** Simultaneously analyzes 40 stocks per list across 14 different BIST stock lists (560+ total stocks)
• **Advanced Pattern Detection:** Implements Wolfe Wave mathematical validation using 24 different ratio calculation methods including Fibonacci sequences, Elliott Wave ratios, Golden Ratio, Harmonic Patterns, Pi-based calculations, volatility-based dynamic ratios, and AI-optimized mathematical progressions
• **Real-Time Screening Table:** Displays active signals with current price, signal price, target price, expected profit percentage, and calculated stop-loss levels
• **Reliability Scoring System:** EPA (Entry Point Accuracy) and ETA (Exit Target Accuracy) scoring with historical performance tracking
• **Visual Signal Display:** Comprehensive signal boxes showing profit zones, stop-loss areas, entry levels, and estimated time to target completion
**Mathematical Implementation:**
The core algorithm calculates price relationships using configurable mathematical ratios. For bullish conditions, it identifies entry points when price action meets specific criteria:
- Point validation through ratio analysis between swing highs/lows across multiple timeframes
- Mathematical confirmation using (pv - pf) / (pv - pd) ratio calculations
- Confluence validation across timeframes with dynamic ratio adjustments
- Minimum profit threshold filtering to ensure signal quality
**Originality and Innovation:**
This implementation differs significantly from traditional scanning tools through several key innovations:
1. **Multi-Timeframe Wolfe Wave Detection:** Simultaneous pattern recognition across 10 timeframes rather than single-timeframe analysis
2. **Adaptive Ratio Systems:** 24 different mathematical calculation methods including volatility-based, time-based, momentum-based, and volume-weighted ratio adjustments
3. **BIST-Specific Optimization:** Tailored specifically for Turkish stock market characteristics with 14 pre-configured stock lists
4. **Institutional-Grade Visualization:** Advanced signal boxes with profit/loss zones, multiple entry levels, and time-based target estimation
5. **Real-Time Performance Tracking:** Dynamic EPA/ETA scoring system that tracks historical accuracy and adapts calculations
**Signal Generation Logic:**
The system generates signals when multiple mathematical conditions align:
- Wolfe Wave pattern completion across specified timeframes
- Ratio validation using selected mathematical progression (Fibonacci, Golden Ratio, Elliott Wave, etc.)
- Stop-loss calculation as percentage of target profit (default 0.5%)
- Minimum profit threshold compliance
- Multi-timeframe confluence confirmation
**Risk Management Features:**
• **Configurable Stop-Loss:** Calculated as percentage of target profit with recommended 0.3 setting for 1:3 risk-reward ratio
• **Profit Percentage Display:** Real-time calculation showing expected profit from signal price to target
• **Multiple Entry Levels:** EPA and ETA-based entry points with reliability scoring
• **Time Estimation:** Statistical analysis providing estimated bars/time to target completion
• **Visual Risk Zones:** Color-coded profit (green) and loss (red) areas for clear risk visualization
**Performance Characteristics:**
The indicator is optimized for active screening with frequent signal generation across multiple stocks. It provides both short-term and medium-term opportunities depending on the timeframe producing the signal. The system maintains historical statistics for signal accuracy and target completion timing.
**Technical Requirements:**
Requires understanding of Wolfe Wave pattern theory, Elliott Wave principles, and multi-timeframe analysis concepts. Users should be familiar with BIST market structure and Turkish stock trading mechanics. The indicator demands active monitoring due to the high-frequency nature of multi-stock scanning.
**Market Application:**
Specifically designed for Borsa Istanbul stocks with comprehensive coverage across major sectors. Works effectively in both trending and ranging market conditions due to its adaptive ratio selection and multi-timeframe approach. Best suited for traders focusing on Turkish equity markets with pattern-based strategies.
**Customization Options:**
• **14 Stock Lists:** Pre-configured BIST stock groups for sector-specific analysis
• **24 Ratio Methods:** From conservative Fibonacci to aggressive AI-optimized calculations
• **Quote Pair Integration:** Optional currency pair specification for international analysis
• **Timeframe Flexibility:** Customizable chart timeframe for signal generation
• **Table Positioning:** Multiple display options with size and color customization
• **Alert Integration:** Comprehensive alert system for real-time signal notifications

Futures vs CFD Price Display
🎯 Trading the same asset in CFDs and Futures but tired of switching charts to compare prices? This is your indicator!
Stop the constant chart hopping! This live price comparison shows you instantly where the better conditions are.
✨ What you get:
Bidirectional: Works in both Futures AND CFD charts
Live prices: Real-time comparison of both markets
Spread calculation: Automatic difference in points and percentage
Fully customizable: Colors, position, size to your liking
Professional design: Clean display with symbol header
🎯 Perfect for:
Gold traders (Futures vs CFD)
Arbitrage strategies
Spread monitoring
Multi-broker comparisons
⚙️ Customization:
3 sizes (Small/Normal/Large) for all screens
4 positions available
Individual color schemes
Toggle features on/off
💡 Simply enter the symbol and keep both markets in sight!
Notice: "Co-developed with Claude AI (Anthropic) - because even AI needs to pay the server bills! 😄"
RSI Full Forecast [Titans_Invest]RSI Full Forecast
Get ready to experience the ultimate evolution of RSI-based indicators – the RSI Full Forecast, a boosted and even smarter version of the already powerful: RSI Forecast
Now featuring over 40 additional entry conditions (forecasts), this indicator redefines the way you view the market.
AI-Powered RSI Forecasting:
Using advanced linear regression with the least squares method – a solid foundation for machine learning - the RSI Full Forecast enables you to predict future RSI behavior with impressive accuracy.
But that’s not all: this new version also lets you monitor future crossovers between the RSI and the MA RSI, delivering early and strategic signals that go far beyond traditional analysis.
You’ll be able to monitor future crossovers up to 20 bars ahead, giving you an even broader and more precise view of market movements.
See the Future, Now:
• Track upcoming RSI & RSI MA crossovers in advance.
• Identify potential reversal zones before price reacts.
• Uncover statistical behavior patterns that would normally go unnoticed.
40+ Intelligent Conditions:
The new layer of conditions is designed to detect multiple high-probability scenarios based on historical patterns and predictive modeling. Each additional forecast is a window into the price's future, powered by robust mathematics and advanced algorithmic logic.
Full Customization:
All parameters can be tailored to fit your strategy – from smoothing periods to prediction sensitivity. You have complete control to turn raw data into smart decisions.
Innovative, Accurate, Unique:
This isn’t just an upgrade. It’s a quantum leap in technical analysis.
RSI Full Forecast is the first of its kind: an indicator that blends statistical analysis, machine learning, and visual design to create a true real-time predictive system.
⯁ SCIENTIFIC BASIS LINEAR REGRESSION
Linear Regression is a fundamental method of statistics and machine learning, used to model the relationship between a dependent variable y and one or more independent variables 𝑥.
The general formula for a simple linear regression is given by:
y = β₀ + β₁x + ε
β₁ = Σ((xᵢ - x̄)(yᵢ - ȳ)) / Σ((xᵢ - x̄)²)
β₀ = ȳ - β₁x̄
Where:
y = is the predicted variable (e.g. future value of RSI)
x = is the explanatory variable (e.g. time or bar index)
β0 = is the intercept (value of 𝑦 when 𝑥 = 0)
𝛽1 = is the slope of the line (rate of change)
ε = is the random error term
The goal is to estimate the coefficients 𝛽0 and 𝛽1 so as to minimize the sum of the squared errors — the so-called Random Error Method Least Squares.
⯁ LEAST SQUARES ESTIMATION
To minimize the error between predicted and observed values, we use the following formulas:
β₁ = /
β₀ = ȳ - β₁x̄
Where:
∑ = sum
x̄ = mean of x
ȳ = mean of y
x_i, y_i = individual values of the variables.
Where:
x_i and y_i are the means of the independent and dependent variables, respectively.
i ranges from 1 to n, the number of observations.
These equations guarantee the best linear unbiased estimator, according to the Gauss-Markov theorem, assuming homoscedasticity and linearity.
⯁ LINEAR REGRESSION IN MACHINE LEARNING
Linear regression is one of the cornerstones of supervised learning. Its simplicity and ability to generate accurate quantitative predictions make it essential in AI systems, predictive algorithms, time series analysis, and automated trading strategies.
By applying this model to the RSI, you are literally putting artificial intelligence at the heart of a classic indicator, bringing a new dimension to technical analysis.
⯁ VISUAL INTERPRETATION
Imagine an RSI time series like this:
Time →
RSI →
The regression line will smooth these values and extend them n periods into the future, creating a predicted trajectory based on the historical moment. This line becomes the predicted RSI, which can be crossed with the actual RSI to generate more intelligent signals.
⯁ SUMMARY OF SCIENTIFIC CONCEPTS USED
Linear Regression Models the relationship between variables using a straight line.
Least Squares Minimizes the sum of squared errors between prediction and reality.
Time Series Forecasting Estimates future values based on historical data.
Supervised Learning Trains models to predict outputs from known inputs.
Statistical Smoothing Reduces noise and reveals underlying trends.
⯁ WHY THIS INDICATOR IS REVOLUTIONARY
Scientifically-based: Based on statistical theory and mathematical inference.
Unprecedented: First public RSI with least squares predictive modeling.
Intelligent: Built with machine learning logic.
Practical: Generates forward-thinking signals.
Customizable: Flexible for any trading strategy.
⯁ CONCLUSION
By combining RSI with linear regression, this indicator allows a trader to predict market momentum, not just follow it.
RSI Full Forecast is not just an indicator — it is a scientific breakthrough in technical analysis technology.
⯁ Example of simple linear regression, which has one independent variable:
⯁ In linear regression, observations ( red ) are considered to be the result of random deviations ( green ) from an underlying relationship ( blue ) between a dependent variable ( y ) and an independent variable ( x ).
⯁ Visualizing heteroscedasticity in a scatterplot against 100 random fitted values using Matlab:
⯁ The data sets in the Anscombe's quartet are designed to have approximately the same linear regression line (as well as nearly identical means, standard deviations, and correlations) but are graphically very different. This illustrates the pitfalls of relying solely on a fitted model to understand the relationship between variables.
⯁ The result of fitting a set of data points with a quadratic function:
_________________________________________________
🔮 Linear Regression: PineScript Technical Parameters 🔮
_________________________________________________
Forecast Types:
• Flat: Assumes prices will remain the same.
• Linreg: Makes a 'Linear Regression' forecast for n periods.
Technical Information:
ta.linreg (built-in function)
Linear regression curve. A line that best fits the specified prices over a user-defined time period. It is calculated using the least squares method. The result of this function is calculated using the formula: linreg = intercept + slope * (length - 1 - offset), where intercept and slope are the values calculated using the least squares method on the source series.
Syntax:
• Function: ta.linreg()
Parameters:
• source: Source price series.
• length: Number of bars (period).
• offset: Offset.
• return: Linear regression curve.
This function has been cleverly applied to the RSI, making it capable of projecting future values based on past statistical trends.
______________________________________________________
______________________________________________________
⯁ WHAT IS THE RSI❓
The Relative Strength Index (RSI) is a technical analysis indicator developed by J. Welles Wilder. It measures the magnitude of recent price movements to evaluate overbought or oversold conditions in a market. The RSI is an oscillator that ranges from 0 to 100 and is commonly used to identify potential reversal points, as well as the strength of a trend.
⯁ HOW TO USE THE RSI❓
The RSI is calculated based on average gains and losses over a specified period (usually 14 periods). It is plotted on a scale from 0 to 100 and includes three main zones:
• Overbought: When the RSI is above 70, indicating that the asset may be overbought.
• Oversold: When the RSI is below 30, indicating that the asset may be oversold.
• Neutral Zone: Between 30 and 70, where there is no clear signal of overbought or oversold conditions.
______________________________________________________
______________________________________________________
⯁ ENTRY CONDITIONS
The conditions below are fully flexible and allow for complete customization of the signal.
______________________________________________________
______________________________________________________
🔹 CONDITIONS TO BUY 📈
______________________________________________________
• Signal Validity: The signal will remain valid for X bars .
• Signal Sequence: Configurable as AND or OR .
📈 RSI Conditions:
🔹 RSI > Upper
🔹 RSI < Upper
🔹 RSI > Lower
🔹 RSI < Lower
🔹 RSI > Middle
🔹 RSI < Middle
🔹 RSI > MA
🔹 RSI < MA
📈 MA Conditions:
🔹 MA > Upper
🔹 MA < Upper
🔹 MA > Lower
🔹 MA < Lower
📈 Crossovers:
🔹 RSI (Crossover) Upper
🔹 RSI (Crossunder) Upper
🔹 RSI (Crossover) Lower
🔹 RSI (Crossunder) Lower
🔹 RSI (Crossover) Middle
🔹 RSI (Crossunder) Middle
🔹 RSI (Crossover) MA
🔹 RSI (Crossunder) MA
🔹 MA (Crossover) Upper
🔹 MA (Crossunder) Upper
🔹 MA (Crossover) Lower
🔹 MA (Crossunder) Lower
📈 RSI Divergences:
🔹 RSI Divergence Bull
🔹 RSI Divergence Bear
📈 RSI Forecast:
🔹 RSI (Crossover) MA Forecast
🔹 RSI (Crossunder) MA Forecast
🔹 RSI Forecast 1 > MA Forecast 1
🔹 RSI Forecast 1 < MA Forecast 1
🔹 RSI Forecast 2 > MA Forecast 2
🔹 RSI Forecast 2 < MA Forecast 2
🔹 RSI Forecast 3 > MA Forecast 3
🔹 RSI Forecast 3 < MA Forecast 3
🔹 RSI Forecast 4 > MA Forecast 4
🔹 RSI Forecast 4 < MA Forecast 4
🔹 RSI Forecast 5 > MA Forecast 5
🔹 RSI Forecast 5 < MA Forecast 5
🔹 RSI Forecast 6 > MA Forecast 6
🔹 RSI Forecast 6 < MA Forecast 6
🔹 RSI Forecast 7 > MA Forecast 7
🔹 RSI Forecast 7 < MA Forecast 7
🔹 RSI Forecast 8 > MA Forecast 8
🔹 RSI Forecast 8 < MA Forecast 8
🔹 RSI Forecast 9 > MA Forecast 9
🔹 RSI Forecast 9 < MA Forecast 9
🔹 RSI Forecast 10 > MA Forecast 10
🔹 RSI Forecast 10 < MA Forecast 10
🔹 RSI Forecast 11 > MA Forecast 11
🔹 RSI Forecast 11 < MA Forecast 11
🔹 RSI Forecast 12 > MA Forecast 12
🔹 RSI Forecast 12 < MA Forecast 12
🔹 RSI Forecast 13 > MA Forecast 13
🔹 RSI Forecast 13 < MA Forecast 13
🔹 RSI Forecast 14 > MA Forecast 14
🔹 RSI Forecast 14 < MA Forecast 14
🔹 RSI Forecast 15 > MA Forecast 15
🔹 RSI Forecast 15 < MA Forecast 15
🔹 RSI Forecast 16 > MA Forecast 16
🔹 RSI Forecast 16 < MA Forecast 16
🔹 RSI Forecast 17 > MA Forecast 17
🔹 RSI Forecast 17 < MA Forecast 17
🔹 RSI Forecast 18 > MA Forecast 18
🔹 RSI Forecast 18 < MA Forecast 18
🔹 RSI Forecast 19 > MA Forecast 19
🔹 RSI Forecast 19 < MA Forecast 19
🔹 RSI Forecast 20 > MA Forecast 20
🔹 RSI Forecast 20 < MA Forecast 20
______________________________________________________
______________________________________________________
🔸 CONDITIONS TO SELL 📉
______________________________________________________
• Signal Validity: The signal will remain valid for X bars .
• Signal Sequence: Configurable as AND or OR .
📉 RSI Conditions:
🔸 RSI > Upper
🔸 RSI < Upper
🔸 RSI > Lower
🔸 RSI < Lower
🔸 RSI > Middle
🔸 RSI < Middle
🔸 RSI > MA
🔸 RSI < MA
📉 MA Conditions:
🔸 MA > Upper
🔸 MA < Upper
🔸 MA > Lower
🔸 MA < Lower
📉 Crossovers:
🔸 RSI (Crossover) Upper
🔸 RSI (Crossunder) Upper
🔸 RSI (Crossover) Lower
🔸 RSI (Crossunder) Lower
🔸 RSI (Crossover) Middle
🔸 RSI (Crossunder) Middle
🔸 RSI (Crossover) MA
🔸 RSI (Crossunder) MA
🔸 MA (Crossover) Upper
🔸 MA (Crossunder) Upper
🔸 MA (Crossover) Lower
🔸 MA (Crossunder) Lower
📉 RSI Divergences:
🔸 RSI Divergence Bull
🔸 RSI Divergence Bear
📉 RSI Forecast:
🔸 RSI (Crossover) MA Forecast
🔸 RSI (Crossunder) MA Forecast
🔸 RSI Forecast 1 > MA Forecast 1
🔸 RSI Forecast 1 < MA Forecast 1
🔸 RSI Forecast 2 > MA Forecast 2
🔸 RSI Forecast 2 < MA Forecast 2
🔸 RSI Forecast 3 > MA Forecast 3
🔸 RSI Forecast 3 < MA Forecast 3
🔸 RSI Forecast 4 > MA Forecast 4
🔸 RSI Forecast 4 < MA Forecast 4
🔸 RSI Forecast 5 > MA Forecast 5
🔸 RSI Forecast 5 < MA Forecast 5
🔸 RSI Forecast 6 > MA Forecast 6
🔸 RSI Forecast 6 < MA Forecast 6
🔸 RSI Forecast 7 > MA Forecast 7
🔸 RSI Forecast 7 < MA Forecast 7
🔸 RSI Forecast 8 > MA Forecast 8
🔸 RSI Forecast 8 < MA Forecast 8
🔸 RSI Forecast 9 > MA Forecast 9
🔸 RSI Forecast 9 < MA Forecast 9
🔸 RSI Forecast 10 > MA Forecast 10
🔸 RSI Forecast 10 < MA Forecast 10
🔸 RSI Forecast 11 > MA Forecast 11
🔸 RSI Forecast 11 < MA Forecast 11
🔸 RSI Forecast 12 > MA Forecast 12
🔸 RSI Forecast 12 < MA Forecast 12
🔸 RSI Forecast 13 > MA Forecast 13
🔸 RSI Forecast 13 < MA Forecast 13
🔸 RSI Forecast 14 > MA Forecast 14
🔸 RSI Forecast 14 < MA Forecast 14
🔸 RSI Forecast 15 > MA Forecast 15
🔸 RSI Forecast 15 < MA Forecast 15
🔸 RSI Forecast 16 > MA Forecast 16
🔸 RSI Forecast 16 < MA Forecast 16
🔸 RSI Forecast 17 > MA Forecast 17
🔸 RSI Forecast 17 < MA Forecast 17
🔸 RSI Forecast 18 > MA Forecast 18
🔸 RSI Forecast 18 < MA Forecast 18
🔸 RSI Forecast 19 > MA Forecast 19
🔸 RSI Forecast 19 < MA Forecast 19
🔸 RSI Forecast 20 > MA Forecast 20
🔸 RSI Forecast 20 < MA Forecast 20
______________________________________________________
______________________________________________________
🤖 AUTOMATION 🤖
• You can automate the BUY and SELL signals of this indicator.
______________________________________________________
______________________________________________________
⯁ UNIQUE FEATURES
______________________________________________________
Linear Regression: (Forecast)
Signal Validity: The signal will remain valid for X bars
Signal Sequence: Configurable as AND/OR
Condition Table: BUY/SELL
Condition Labels: BUY/SELL
Plot Labels in the Graph Above: BUY/SELL
Automate and Monitor Signals/Alerts: BUY/SELL
Linear Regression (Forecast)
Signal Validity: The signal will remain valid for X bars
Signal Sequence: Configurable as AND/OR
Condition Table: BUY/SELL
Condition Labels: BUY/SELL
Plot Labels in the Graph Above: BUY/SELL
Automate and Monitor Signals/Alerts: BUY/SELL
______________________________________________________
📜 SCRIPT : RSI Full Forecast
🎴 Art by : @Titans_Invest & @DiFlip
👨💻 Dev by : @Titans_Invest & @DiFlip
🎑 Titans Invest — The Wizards Without Gloves 🧤
✨ Enjoy!
______________________________________________________
o Mission 🗺
• Inspire Traders to manifest Magic in the Market.
o Vision 𐓏
• To elevate collective Energy 𐓷𐓏

Timeframe Titans: Market Structure & MTF Order Blocks🟩 OVERVIEW
A combined market structure and order block indicator. Displays fractals, zigzags, Break Of Structure and Change Of Character lines. Shows order blocks on the chart and a higher timeframe.
Unique features include:
• The structure rules require counter fractals for BOS. This enables us to use more responsive fractal settings without creating excessive noise.
• Structure is strict. After the initial CHoCH there is always one and only one active CHoCH line.
• Order blocks can be filtered by market structure.
• Order blocks are based entirely on candle patterns (which appear to be unique among all the indicators we tested) instead of using pivots or other configurable calculations.
• Order blocks have separate mitigation levels, not merely the edge of the block, and being partially mitigated is a separate logical state.
🟩 WHAT IS MARKET STRUCTURE?
There are many ways to conceptualise and code market structure — the prevailing trend derived from important price levels. All of them start with identifying highs and lows in price, then use breaks of those levels to assign a trend.
This indicator displays the following market structure features:
• Williams Fractals to derive high and low pivots.
• Zigzag lines, which connect highs and lows.
• Break of Structure (BOS) lines, which are formed from the highest high in an *uptrend* or the lowest low in a *downtrend*. A break of a BOS line signals trend continuation.
• Change of Character (CHoCH) lines, which are formed from the highest high in a *downtrend* or the lowest low in an *uptrend*. A break of a CHoCH line signals trend reversal.
• Market structure bias, which is derived from the break of a CHoCH line. If a CHoCH line is broken to the upside, the trend is bullish, and if to the downside, bearish.
(For more details of the market structure features of this indicator, see the FEATURES OF THIS INDICATOR section.)
This definition of market structure implies that:
• There can only ever be one single active BOS line.
• There can only ever be one single active CHoCH line.
• A break of a BOS line creates a new CHoCH line.
• A break of a CHoCH line creates a new bias, a new BOS line, and a new CHoCH line.
• Before we can create a BOS, we need to know the bias, for which we need the CHoCH, for which we need BOS... just one of the chicken-vs-egg difficulties of coding market structure.
To understand how this indicator differs from other market structure indicators, see the COMPARISON WITH OTHER INDICATORS section.
🟩 WHAT ARE ORDER BLOCKS?
Order blocks are candle patterns that appear at highs and lows. The theory is that these areas are where many orders were filled — too many for the order book, causing an imbalance in buyers and sellers. As such, these areas can form support or resistance levels when price returns to them.
This indicator displays the following features related to order blocks:
• Imbalances, also called Fair Value Gaps.
• Order blocks of two different types (Imbalance Block and Standard Order Blocks)
(For more details of the order block features of this indicator, see the FEATURES OF THIS INDICATOR section.)
There are different patterns that can define order blocks, but the common element is that price should move vigorously away from the area after the pattern forms.
To understand how this indicator differs from other order block indicators, see the COMPARISON WITH OTHER INDICATORS section.
🟩 FEATURES OF THIS INDICATOR
Pivots
Shows Williams high and low fractals, with a configurable lookback. The pivots are always calculated, since they are the building block of all other market structure features. The pivot shape display can be turned on or off, and the display customised.
Zigzag
Draws lines between the highs and lows. The lines can be shown or hidden, and the colour and thickness configured.
Break of Structure
BOS lines are always calculated, but can be shown or hidden. The appearance can be customised. BOS lines are drawn from the candle that has the high or low that defines their level. They always extend until they are broken or the bias changes. The BOS lines have an optional, configurable label. When a BOS line is broken, an optional, configurable label is drawn on that bar.
Change of Character
CHoCH lines can be shown, hidden, and customised. CHoCH lines always extend until they are broken or a new CHoCH line is formed. CHoCH lines have optional labels. A different, customisable label is drawn when a CHoCH line is broken.
Market structure bias
Market structure bias is derived from the break of a CHoCH line. If a CHoCH line is broken to the upside, the trend is bullish, and if to the downside, bearish. The background is shaded a configurable colour based on the trend.
Imbalances
Imbalances are drawn in configurable colours. When they are mitigated, you can choose to change the colour, delete them, or leave them.
Order blocks
Two types of imbalance order blocks are displayed: Standard Order Blocks and Imbalance Blocks. They can be shown or hidden, and customised, independently.
Each order block has a mitigation line with configurable colours and style. If price exceeds the mitigation line, the order block is mitigated and is considered inactive.
The order blocks, or their labels, can be deleted when the order block is mitigated. If not deleted, their colour is changed and they no longer extend with each new bar.
Order blocks on the chart timeframe can be shown conditionally within the context of the market structure: you can choose to show:
• Pro-trend order blocks (bearish order blocks that were created in bearish market structure and vice-versa).
• Counter-trend order blocks (bearish order blocks that were created in bullish market structure and vice-versa).
• All order blocks.
Higher timeframe
Imbalances and order blocks can be independently shown and customised on a single higher timeframe. The HTF functions of this indicator do not repaint because they use confirmed data.
You can choose a custom, fixed higher timeframe, or an "Auto" mode where the script automatically chooses the higher timeframe based on the chart timeframe.
Script information messages
An optional table shows information about the script, including configuration problems, such as if a custom HTF is not actually higher than the chart timeframe.
🟩 HOW TO USE
There are very many ways to use market structure and order blocks in trading and we recommend you study extensively, and if possible get a trusted mentor.
Here is a random example we found on the recent GBPUSD chart. In the screenshot below, the left chart is at 30m and the right is at 5m. We've toggled various settings to make the chart clearer for demonstration purposes.
1 — We get a CHoCH break on the higher timeframe. So our bias (if we are trying to trade with the trend) is bearish. Now we look for some other confluence.
2 — Price revisits the top of the range and mitigates an imbalance block. It wicks the CHoCH (resetting it) but does not break it on close. The bearish market structure is thus preserved. For these reasons, we're thinking about a short, and we switch to the 5m chart on the right to find an entry. We've chosen a Custom HTF of 30m to match the left chart and we can see the mitigated HTF order block, marked "30m IB". We can see when price moves definitively out of the order block area to the downside.
3 — A bearish order block is formed and very quickly price comes back into it. We could enter a short here with a stop above the closest relevant fractal.
4 — Another bearish order block forms and price retests it. Another entry. Two previous 5m bullish order blocks at the bottom of the chart act as support. We could potentially close our short here.
5 — Another test of the same block, which was not mitigated the first time. Another potential short entry. As it happens, price makes a massive run lower here, such that we could trail our stop down one ATR above every single high fractal (marked out using manual rays and a public ATR indicator) for a good R:R, but that's not the point.
This is a made-up, retrofitted example with a fairly generic methodology. It's just to show how some of the features of this indicator could be used in trading:
• Market structure can give a bias. It can also mark interesting levels.
• Using multiple timeframes, while more complex, can level up your trading experience.
• Price trading back into order blocks can be a good R:R entry.
Your actual way of trading, your playbook of setups, your knowledge of your strengths and weakness as a trader, is your own.
🟩 LIMITATIONS
This indicator is intended for use on Forex markets, although order blocks and market structure do form on any reasonably liquid asset.
The HTF uses confirmed data, so you need to wait until the HTF bar is closed before the order block can form. Therefore it does not repaint, in the sense that people worry about repainting, of changing data in the past. We use the latest recommended method of fetching HTF data .
The market structure uses live chart data, so structure and order blocks that are created by conditions on an open realtime bar can appear and disappear as the current bar close changes. This is quite normal .
The Williams pivots are by definition only confirmed after a defined number of bars, and like everyone else we plot them offset into the past.
Similarly, we offset order blocks into the past so that they start on the candle that has the high or low that defines the order block, not the candle that created them. For HTF order blocks, we calculate the number of chart bars back assuming a 24-hour market, which gives accurate offsets only on Forex and other symbols that trade close to 24 hours each day.
🟩 COMPARISON WITH OTHER INDICATORS
There are a great number of market structure and order block indicators already published on TradingView. Since there are only a certain number of highs and lows on the chart from which to produce structure and order blocks, they all look somewhat similar. However, this indicator, written entirely from scratch without reference to the code of any other indicators, is unique and original in two kinds of ways: in patterns and in features.
PRECISE PATTERNS
We believe that edge in trading can be found in, amongst other things, precision in analysis. You can't truly trust your backtests if your system is not repeatable, and your system is repeatable only if its definitions are precise.
We trade with this indicator, and our students trade with it as well. Why did we spend months creating a new indicator instead of using one of the many existing ones, most of which are free and open source?
Because they are not quite how we wanted.
The indicator was created from our proprietary structure rules, which are based on the generally accepted understanding of market structure, with some specific tweaks.
To prepare this description (after the indicator is finished), we searched for "Market Structure", "CHoCH", and "SMC" and list below all popular (with over 3K boosts; excluding invite-only) indicators that show market structure with CHoCH (sometimes called MSS). We configured the settings to most closely match how our indicator works, added both indicators to the same chart, and looked for relevant differences.
The purpose of this section is not to try to say that this indicator is better than any other, but just that it is different. This difference is important for us and our students.
Indicator #1
As you can see, the indicator interpreted the first part of the chart as a downtrend, whereas ours interpreted it as an uptrend. The structure is completely different, because our Williams Fractal lookback is 2, and the minimum "Swing Points" value for Indicator #1 is 10. Although this indicator is deservedly popular, it isn't what we can use for the way we trade.
Indicator #2
Setting the "Zigzag Length" to 2 results in wildly different market structure, as shown below. For many fractals, this indicator does not place the zigzag at the highest high or lowest low, as ours does consistently. It does not highlight the trend in any way. It gives many Market Structure Breaks in a short period. Although it's again wildly popular, it doesn't match our way of encoding market structure.
Indicator #3
Again, setting the "Pivot lb" and "Pivot rb" inputs to 2 gives much too sensitive market structure. This is because this indicator does not require, as we do, a counter-fractal to form after a fractal in order to confirm a BOS. We believe that this rule gives less noisy structure while also being responsive. Most indicators attempt to compensate for this by having a much larger lookback period. While this does of course give fewer pivots and less noise, this is simply a different logic and gives different results. Note also that although this indicator correctly defines the first section of the chart as an uptrend, it does not draw a CHoCH line. As discussed above, our definition of market structure means that there should always be one and only one active CHoCH line, and we draw this at the earliest sensible opportunity.
Indicator #4
Again, the lack of any extra pivot confirmation logic means that this indicator creates different structure with the same lookback period. Also note the lack of initial CHoCH.
Indicator #5
The lowest lookback is 3, and so this indicator too gives very different structure.
Indicator #6
Of course, using a lookback of 2 gives different structure with this indicator too. For variety, here we show a lookback of 5, which is the lowest setting that returns significantly less noisy structure. You can see that the main CHoCH at the top of the chart is similar but not at the same place. Increasing the lookback does not ever result in a CHoCH at the same place, because the logic is simply different. When the lookback increases above 10, no CHoCH lines are drawn at the top at all.
Indicator #7
This indicator uses the highest/lowest price for the last 10 bars (fixed), along with some other bar conditions. You can see the resulting structure is quite different. Among other differences, it does not create a BOS at the top of the chart, even in an uptrend, and it does not create an opposing CHoCH when the existing CHoCH is broken.
Indicator #8
With "Custom" market structure and a length of 2, BOS and CHoCH lines are drawn by this indicator but in incongruous places.
Conclusion
Although we only illustrate the top few alternatives, we did check many, many others.
These market structure indicators may produce useful output, but their structure differs significantly from ours. We didn't even need to get into specific examples because the general approaches are so different. It is up to the user to decide which indicator, and which interpretation of market structure, best suits their needs.
ORDER BLOCKS
Continuing, we illustrate differences with the most popular order block indicators, trying to get them to match our order blocks. Note that some of these are also in the previous list as market structure indicators.
Order blocks are always formed at swings when price moves away with force, so they will be sort of the same across all the very many existing order block indicators. We are looking for precision and differentiation, as we did with market structure.
Indicator #1
This indicator does not have ability to display mitigated order blocks, only active ones. The order blocks do not match at all.
Indicator #2
With a period of 2, this indicator marks many of the same order blocks as ours. It doesn't extend the blocks, and doesn't mark them when mitigated. The logic for choosing the order block candle is also clearly different.
Indicator #3
Even with very sensitive settings, this indicator did not create as many order blocks as ours and they are quite different.
Indicator #4
Again you can see the logic for choosing candles and creating blocks is simply different. This indicator has inadequate protection against empty arrays, which causes runtime errors on charts with not much history (not a problem for Forex charts in general, but noticeable on the testing chart).
Indicator #5
We were unable to get the order blocks to extend with this indicator, although it should be possible. Anyway the blocks are wildly different.
Indicator #6
Even with the most sensitive settings, this indicator showed only one order block on our test chart.
Indicator #7
This indicator incorporates complex price action concepts. Nevertheless, the order blocks are very different indeed.
Indicator #8
This indicator forms quite different blocks to ours. It has several interesting settings including a choice of using the candle body or wick.
Indicator #9
We were not able to configure this indicator to produce the same order blocks as ours.
Indicator #10
On very sensitive settings, this indicator matches many of our order blocks, but at the same time many are different.
Conclusion
None of the indicators tested here (nor the many others we looked at previously) use the same logic as ours. The differences are so obvious that we don't have to call out individual blocks and analyse how they differ.
Fundamentally, other indicators seem to use variable precision for pivots in their order block detection calculations. Our order blocks are pure candle patterns with two different rulesets for Standard Order Blocks and Imbalance Order Blocks, and this logic does not change.
Note that our order blocks do not always automatically extend to the swing high or low, nor allow the user to choose the limit of the block, but use unique rules.
In summary, our indicator differs from other order block indicators in terms of fundamental detection logic, candle placement, boundary definition, mitigation levels, and logical states (see below).
UNIQUE COMBINATION OF FEATURES
In comparison to all other indicators we looked at, our indicator:
• Uses order blocks with three states: active, mitigated, and partially mitigated. Our mitigation lines for order blocks are rules-based. If price touches the mitigation line, the order block is considered fully mitigated. If price goes inside the order block but does not hit the mitigation line, it is only partially mitigated. These three states are visually distinguished.
• Has the most extensive visual customisation options of all those we looked at. We believe that being able to customise how you see indicator outputs is very important for reducing mental load while analysing and trading.
• Has a unique feature that combines market structure and order blocks, where the user can choose to show pro-trend order blocks (bullish blocks that are formed in bullish structure and vice-versa) or counter-trend blocks (bullish blocks that are formed in bearish structure and vice-versa).
• Approximates an initial trend bias very quickly, so we can start creatng BOS, CHoCH, etc.
• Requires a counter pivot to confirm a BOS line. This seemingly small logical step actually creates very different structure, as we saw in the comparison section.
• Uses a sophisticated array-based sorting mechanism to preserve the selected number of imbalances, use the rest of the TradingView box allowance for order blocks, and delete excess order block objects (not just drawings) in reverse historical order.
• Hides order block drawings if they are a configurable distance away from price. Magically redraws them if price moves closer.
• Includes an equivalent to the system "Calculated bars" setting for the high timeframe, to avoid unnecessary processing and improve performance.
🟩 CODING CONSIDERATIONS
This indicator consists of all original code written by @SimpleCryptoLife for Timeframe_Titans.
AI was used for the following purposes:
• Autocomplete
• Checking that bullish and bearish logic is parallel in a given function
• Querying the names and locations of variables hundreds of lines away when we forgot what they're called, like an expensive search-and-replace
• Help with debugging (it usually makes up elaborate and wrong ideas though)
It was not used to replace the coder's expertise and creativity, or to "vibe-code" some black-box functionality we didn't understand. We can recommend that you use AI the same way.
═════════════════════════════════════════════════════════════
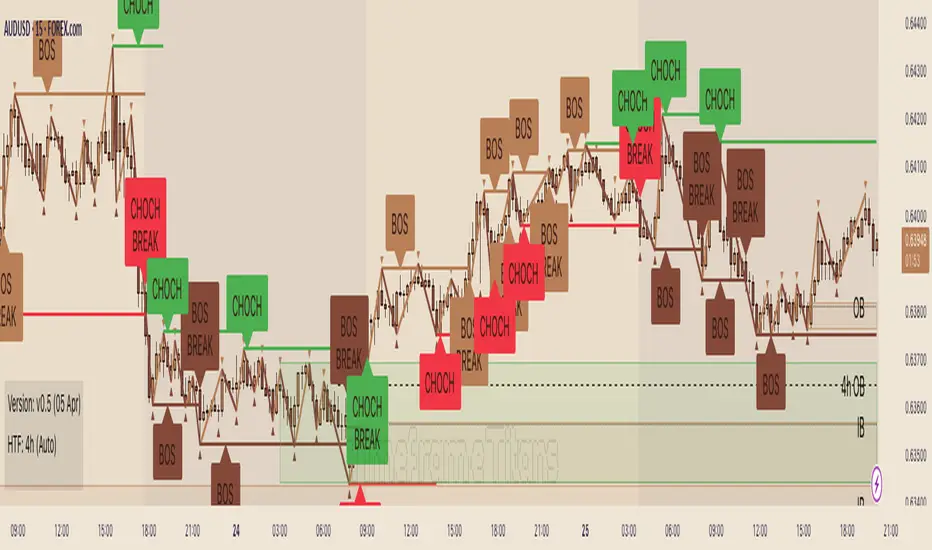
SwiftEdge NW EnvelopeSwiftEdge NW Envelope
Overview
The SwiftEdge NW Envelope is a visually striking technical indicator designed for traders seeking to identify high-probability buy and sell opportunities in volatile markets. By combining the Relative Strength Index (RSI), Average True Range (ATR), and Nadaraya-Watson Envelope, this indicator provides a unique blend of momentum, volatility, and non-linear trend analysis. Its futuristic, AI-inspired aesthetic—featuring neon gradients and dynamic colors—enhances chart readability while delivering actionable trading signals.
What It Does
The SwiftEdge NW Envelope generates buy and sell signals based on price interactions with dynamically calculated support and resistance bands, confirmed by RSI conditions. The indicator:
Plots a Nadaraya-Watson Envelope to identify smooth, non-linear price trends and dynamic support/resistance zones.
Uses ATR to scale the envelope’s bands, adapting to market volatility.
Employs RSI to confirm overbought/oversold conditions, ensuring signals align with momentum.
Visualizes signals with neon-colored markers, background zones, and labels for intuitive decision-making.
How It Works
The indicator integrates three key components:
Nadaraya-Watson Envelope:
A kernel-based regression technique that smooths price data to create a central trend line (mean) and dynamic upper/lower bands.
Unlike traditional moving averages, it provides a non-linear, adaptive view of price trends, making it ideal for capturing complex market movements.
The band width is determined by ATR, ensuring responsiveness to volatility.
Average True Range (ATR):
Measures market volatility to scale the envelope’s bands.
A multiplier (default: 0.5) adjusts the sensitivity of the bands, allowing traders to fine-tune the indicator for different assets or market conditions.
Relative Strength Index (RSI):
A momentum oscillator with a shortened period (default: 5) for increased sensitivity.
Confirms buy signals when RSI is oversold (default: <30) and sell signals when RSI is overbought (default: >70).
Signal Logic
Buy Signal: Triggered when the price crosses above the lower band of the Nadaraya-Watson Envelope and RSI is below the oversold threshold. Marked by a green circle and a "BUY" label below the candle.
Sell Signal: Triggered when the price crosses below the upper band and RSI is above the overbought threshold. Marked by a magenta circle and a "SELL" label above the candle.
Background Zones: Green (buy) or red (sell) translucent zones highlight signal areas for quick recognition.
Visual Features
Dynamic Colors: The central trend line shifts between cyan (uptrend), purple (downtrend), or gray (neutral) based on price position relative to the mean.
Neon Gradient Fill: A translucent blue fill between the upper (green) and lower (red) bands creates a glowing, futuristic effect.
Modern Signal Markers: Small, vibrant circles (green for buy, magenta for sell) and clear labels enhance visual clarity.
Why This Combination?
The SwiftEdge NW Envelope combines RSI, ATR, and Nadaraya-Watson Envelope to create a robust trading tool:
RSI provides momentum confirmation, filtering out false signals in choppy markets.
ATR ensures the envelope adapts to changing volatility, making it suitable for both trending and ranging markets.
Nadaraya-Watson Envelope offers a sophisticated, non-linear alternative to traditional bands (e.g., Bollinger Bands), capturing subtle price dynamics. Together, these components deliver a balanced approach to trend-following and mean-reversion strategies, with RSI acting as a gatekeeper to improve signal reliability.
Customize Settings:
RSI Period (5): Adjust for more/less sensitivity to momentum.
RSI Overbought/Oversold (70/30): Modify thresholds to tighten or loosen signal conditions.
ATR Period (14) and Multiplier (0.5): Tune volatility sensitivity.
NW Length (25), Bandwidth (8.0), Multiplier (3.0): Adjust the smoothness and width of the envelope.
Interpret Signals:
Buy: Look for green circles and "BUY" labels when price crosses above the lower band, confirmed by low RSI.
Sell: Look for magenta circles and "SELL" labels when price crosses below the upper band, confirmed by high RSI.
Use background zones to quickly spot active signal areas.
Combine with Other Tools:
Pair with support/resistance levels or volume analysis for additional confirmation.
Test signals on a demo account before live trading.
Originality
The SwiftEdge NW Envelope stands out due to:
Its innovative use of Nadaraya-Watson regression, a less common but powerful tool for non-linear trend analysis.
A unique visual design with neon gradients and dynamic colors, inspired by AI and futuristic interfaces, making it both functional and visually engaging.
A streamlined signal system that balances momentum (RSI), volatility (ATR), and trend (Nadaraya-Watson), reducing noise and enhancing trade precision.
Notes
Best suited for volatile markets (e.g., forex, crypto, stocks) where price swings create clear envelope breakouts.
Adjust input parameters to match your trading style (e.g., shorter RSI period for scalping, wider bands for swing trading).
Always backtest and validate signals in your specific market and timeframe before trading.

Altcoins Screener [SwissAlgo]Introduction: The Altcoins Screener at a Glance
The Altcoins Screener is a cryptocurrency analysis tool designed to provide an overview of potential trading opportunities across multiple crypto coins/tokens and categories. By combining technical analysis, price action assessment, and social metrics (via LunarCrush data), it presents market information and trading signals for a broad range of altcoins (approx. 300 USDT.P pairs of 9 crypto categories).
The screener is designed to consolidate market information onto a single chart , aiming to streamline the analysis of market conditions. It provides a consolidated market overview, which can simplify the assessment of market conditions, compared to monitoring individual charts with several layered indicators.
Key Features:
🔹 Multi-category analysis covering 300 crypto pairs of 9 categories on a single chart (Layer 1 & Top Coins, Layer2 & Scaling, Defi & Landing, Gaming & Metaverse, AI & Data, Exchanges & Trading, NFT & Social, Memes & Community, Other, User's Custom Portfolio).
🔹 Technical analysis with trade signals (Long/Short) based on an aggregated view of technical and social data points
🔹 Social sentiment integration through LunarCrush metrics (GalaxyScore, AltRank, Social Sentiment)
🔹 Real-time market scanning provides automated alerts when market conditions for specified coins/tokens potentially change.
🔹 Custom watchlist support for personalized monitoring (users can define a custom category containing a set of specific cryptocurrencies, i.e. own portfolio).
The screener presents data in a table format, using color-coded indicators to aid visual analysis. Detailed technical information is also provided. The assessments/trade signals provided by this indicator should be considered as one input among many when forming your trading strategy.
--------------------------------------
What It Does
The Altcoins Screener is a cryptocurrency analysis tool that offers:
Data Display and Analysis (Technical/Social):
🔹 Technical Metrics
* Technical Raw Data : Displays raw values for a range of technical indicators, including RSI, Stochastic RSI, DMI/ADX, RVI, ATR, OBV, and Hull Moving Averages (including their recent trends and potential significance).
Detailed view of key technical indicators, for further analysis and evaluation:
* Technical Analysis (Summary) : Provides a summarized interpretation of technical conditions based on aggregated parameters:
* Price Action
* Trend
* Momentum
* Volatility
* Volume
Summarized view of confluences for potential long/short bias:
🔹 Social Metrics (LunarCrush) : Presents data from LunarCrush®, including Galaxy Score®, AltRank®, and Social Sentiment® (including their recent trends and potential significance).
Lunarcrush data for the top 10 coins for each crypto category:
🔹 PVSRA (Price Volume & Market Makers Activity) Candles : Shows special candles highlighting potential market maker activity and volume anomalies, helping identify possible manipulation zones (including imbalance zones, i.e. price areas that market makers may revisit)
--------------------------------------
Key Features:
Automated trade signals (Long/Short) are generated based on algorithmic calculations and signal confidence levels across technical and social data points. These signals are intended to be used as one component of a broader trading strategy.
Custom sensitivity settings allow users to adjust the analysis timeframe (options: 1D, 2D, or 1W). Higher timeframes may provide a broader perspective, while the 2D setting is the default configuration.
Multi-category analysis covering a selection of approximately 300 crypto pairs across 9 predefined crypto categories.
Custom symbol selection: Users can define a custom list of up to 10 symbols for focused monitoring.
Automated Alerts to track potential trend changes across crypto categories (Long to Short to Neutral, or vice versa)
Visual Interface:
Organized table display with color-coded indicators to aid interpretation.
Clear and efficient format for scanning market information.
--------------------------------------
Target Audience
🔹 The screener is designed for cryptocurrency traders who:
Need to efficiently monitor multiple USDT perpetual futures markets
Use technical analysis in their trading decisions
Want to track sector-wide movements across crypto categories
🔹 Suitable for different trading styles:
Scalpers requiring quick market assessment
Swing traders analyzing multi-day trends
Position traders monitoring longer-term setups
The color-coded interface makes it accessible for intermediate traders while providing detailed metrics for advanced users. A basic understanding of technical analysis and crypto trading is recommended.
--------------------------------------
How It Works
The Altcoins Screener evaluates cryptocurrencies through a multi-layered analysis:
🔹 Core Analysis Components
Each parameter combines multiple indicators for comprehensive evaluation:
Price Action
EMA crossovers and momentum
Support/resistance zones
Candlestick patterns
Trend
Hull Moving Average system
DMI/ADX trend strength
Multi-timeframe confirmation
Momentum
RSI/Stochastic RSI readings
MACD convergence/divergence
Oscillator confirmations
Volatility
RVI/ATR measurements
Bollinger Bands behavior
Historical volatility trends
Volume
OBV trend analysis
Volume/price correlations
Volume profile assessment
🔹 Signal Generation Process
1. Real-time data collection across timeframes
2. Weighted indicator calculations
3. Parameter aggregation and analysis
4. Signal strength determination
5. Color-coding and alert generation
--------------------------------------
How to Use
🔹 Initial Setup:
Add the indicator to a chart (use the 1D timeframe)
Select your preferred crypto category or create a custom list
Choose between Technical Analysis or Technical Metrics view
Set data sensitivity based on your trading style
🔹 Using the Technical Analysis View:
Monitor color-coded dots for quick market assessment
Green: bullish conditions
Red: bearish conditions
Gray: neutral conditions
Check the "Trade Signal" column for potential Long/Short entries signaled by confluences among technical and/or social data points
🔹 Using the Technical Metrics View:
Review detailed numerical values
Monitor slopes (↑↓ arrows) for the most recent trend direction of each data point
Watch for pivotal points (highlighted cells): these are data points that suggest potential trend reversals
Focus on the confluence of multiple indicators
The technical metrics view corroborates the conclusions shown in the Technical Analysis View, providing more details about some critical data points.
🔹 Alert Configuration:
Enable Technical Alerts for signal notifications (which coin/token seems most suited for Long or Short trades, and which coin/token is in a neutral/uncertain state for trading = "No Trade")
Configure alert conditions based on trading style
Set timeframe-appropriate sensitivity
Monitor alert messages for trade signals
Instructions on how to set alerts are provided in the script (enable "Signals Setup Instructions" in User Interface to get a step-by-step guide about setting up alerts)
Best Practices:
Confirm signals across multiple timeframes
Use appropriate sensitivity for your trading style
Monitor multiple categories for sector rotation
Combine signals with your trading strategy
Verify signals with price action confirmation and deep dive into the charts of your potential targets
--------------------------------------
About the Settings
🔹 Crypto Category Selection
Layer 1 & Major: Top market cap coins (BTC, ETH, XRP,...), established protocols
Layer 2 & Scaling: ETH L2s, scaling solutions
DeFi & Lending: Decentralized finance protocols
Gaming & Metaverse: Gaming and virtual world tokens
AI & Data: Artificial intelligence and data projects
Exchange & Trading: Exchange tokens, trading protocols
NFT & Social: NFT platforms, social tokens
Memes & Community: Community-driven tokens
Others & Misc: Other categories
Custom Category: User-defined list (up to 10 symbols)
Data Type Options
Technical Analysis: Color-coded summary view
Technical Metrics: Detailed numerical values of some key technical data points
Sensitivity Settings
Higher: Shorter timeframe, more frequent signals
Default: Balanced timeframe, standard signals
Lower: Longer timeframe, stronger signals
Alert Settings
Technical Alerts: Trade signal notifications
Data Timeframe: Minimum 1D required
Theme: Dark/Light mode options
Note: All analysis is performed on USDT Perpetual Futures pairs from Binance
--------------------------------------
FAQ
Q: Does the screener work on other exchanges besides Binance?
A: No, it's designed specifically for Binance USDT Perpetual Futures pairs. Binance offers the highest liquidity and trading volume in the crypto derivatives market, making it ideal for technical analysis. The extensive range of trading pairs and reliable data streams help ensure more accurate signals and analysis. Using a single high-liquidity exchange also helps avoid inconsistencies that could arise from aggregating data across multiple platforms with varying liquidity levels.
Q: What's the minimum timeframe required?
A: The screener requires a minimum 1D (daily) timeframe. This requirement ensures that the technical analysis has sufficient data points for reliable signal generation. Lower timeframes can produce more noise and false signals, while daily timeframes help filter out market noise and identify stronger trends.
Q: Why are some social metrics showing "NaN"?
A: "NaN" (Not a Number) appears when cryptocurrencies don't have associated LunarCrush data. This typically occurs with newer tokens or those with lower market caps. The technical analysis remains fully functional regardless of social metric availability, as these are complementary data points.
Q: How often are signals updated?
A: Signals update with each new candle on the selected timeframe (1D, 2D, or 1W). For example, on the default 2D setting, signals are recalculated every two days as new candles form. This helps reduce noise while maintaining timely analysis of market conditions.
Q: Can I add spot trading pairs?
A: No, the screener is optimized for Binance USDT perpetual futures pairs for data consistency and analysis purposes. While spot and perpetual prices typically align closely due to arbitrage, using a single data source (Binance) and contract type (USDT perpetual) ensures uniform data quality and analysis across all pairs. This standardization helps maintain reliable technical analysis and signal generation.
Q: How many coins can I add to my custom list?
A: Users can add up to 10 custom symbols to their watchlist. This limit is designed to maintain optimal performance while allowing focused monitoring of specific assets. The custom list complements the predefined categories that cover over 300 pairs.
Q: What determines signal confidence levels?
A: Signal confidence is calculated through a weighted algorithm that considers multiple factors: trend strength (Hull MA, DMI/ADX), momentum indicators (RSI, SRSI), volatility measurements (RVI, ATR, BB), volume analysis (OBV, volume trends), and price action patterns. Higher confidence levels indicate stronger alignment across these factors.
Q: Are signals guaranteed to work?
A: No. Signals are analytical tools based on historical and current market data, not guaranteed predictions. They should be used as one component of a comprehensive trading strategy that includes proper risk management, position sizing, and additional confirmation factors. Past performance does not guarantee future results.
Q: Why does the screener need higher timeframes?
A: Higher timeframes (1D minimum) provide several benefits: reduced market noise, more reliable technical signals, better trend identification, and lower likelihood of false signals. They also align better with institutional trading patterns and allow for a more thorough analysis of market conditions across multiple indicators.
--------------------------------------
Conclusion
The Altcoins Screener is a comprehensive crypto market analysis tool that:
Scans 300+ cryptocurrencies across 9 sectors on a single chart
Combines technical indicators and social metrics for signal generation
Identifies potential trading opportunities through color-coded visuals
Saves time by eliminating the need to monitor multiple charts
The tool is suited for:
Market overview and sector rotation analysis
Quick assessment of market conditions
Technical and social sentiment tracking
Systematic trading approach with alerts
Use this screener with caution and as a complement to any other tool you use to define your trading strategy.
--------------------------------------
Disclaimer
This indicator is for informational and educational purposes only:
Not financial advice: This indicator should not be considered investment advice.
No guarantee of accuracy: The indicator's calculations and signals are based on specific algorithms and data sources, but accuracy cannot be guaranteed. Market conditions can change rapidly.
Past performance is not predictive: Past performance of the indicator's signals or any specific asset is not indicative of future results.
Substantial risk of loss: Trading cryptocurrencies involves a substantial risk of loss. You can lose money trading these assets.
User responsibility: Users are solely responsible for their own trading decisions and should exercise caution.
Independent research required: Always conduct thorough independent research (DYOR) before making any trading decisions.
Technical analysis is one of many tools: Technical analysis, including the output of this indicator, is just one tool among many and should not be relied upon exclusively.
Risk management is essential: Use proper risk management techniques, including position sizing and stop-loss orders.
Comprehensive strategy: Use this tool as part of a comprehensive trading strategy, not as a standalone solution.
No liability for trading results: The Author assumes no responsibility or liability for any trading results or losses incurred as a result of using this indicator.
No TradingView affiliation: SwissAlgo is an independent entity and is not affiliated with or endorsed by TradingView.
LunarCrush data: The indicator utilizes publicly available data from LunarCrush. LunarCrush data and trademarks are the property of LunarCrush.
Consult a financial advisor: Consult with a qualified financial advisor before making any investment decisions.
By using this indicator, you acknowledge and agree to these terms. If you do not agree with these terms, please refrain from using this indicator.

RSI MACD Combined Color StrategyOverview
This indicator combines RSI and MACD signals to create a powerful visual trading system, inspired by TrendSpider's AI Strategy Coder examples. It colors candles based on the alignment of three key technical conditions, providing clear visual signals for potential trend strength and direction.
Technical Components
Core Conditions
RSI (Relative Strength Index) > 50
Indicates bullish momentum when price is trading above the centerline
Traditional indicator of trend strength
MACD Line > Signal Line
Shows positive momentum
Classic signal for potential upward movement
MACD Line > 0
Confirms bullish territory
Indicates overall positive momentum
Color Coding System
🟢 Green Candles: All three conditions are met
Strongest bullish signal
Suggests high probability trading opportunities
⚪ Grey Candles: One or two conditions are met
Neutral or transitioning market
Suggests caution or waiting for stronger confirmation
🔴 Red Candles: No conditions are met
Bearish signal
Suggests potential downward pressure
How to Use This Indicator
For Entry Signals
Look for transitions from red or grey to green candles
Green candles suggest strong bullish alignment
Consider entering long positions when candles turn green
For Exit Signals
Watch for color transitions from green to grey or red
Consider taking profits when candles change from green to grey
Consider stop losses when candles turn red
Risk Management
Use color transitions as part of your broader strategy
Don't rely solely on color changes for trading decisions
Combine with other technical analysis tools and risk management practices
Customizable Parameters
RSI Length (default: 14)
MACD Fast Length (default: 12)
MACD Slow Length (default: 26)
MACD Signal Length (default: 9)
Best Practices
Use multiple timeframes for confirmation
Look for confluences with support/resistance levels
Consider volume and market context
Start with default settings and adjust based on your trading style
Backtest different parameter combinations
Notes
This indicator works best in trending markets
Grey candles can indicate transition periods
Consider market conditions and volatility when interpreting signals
Credits
Inspired by TrendSpider's AI Strategy Coder examples and adapted for TradingView using Pine Script v5.
Disclaimer
This technical indicator is for informational purposes only. Always conduct your own analysis and consider risk management principles before making trading decisions. Past performance does not guarantee future results.

RSI NarrativesDescription:
The RSI Narratives script aggregates Relative Strength Index (RSI) values across multiple cryptocurrency narratives or sectors, providing an easy-to-read visual and alert system for trend reversals and overbought/oversold conditions. This tool is designed for traders looking to track sector-specific trends and compare performance across AI, DeFi, Level 1 blockchains, and more.
Key Features:
RSI Aggregation by Sector: Calculates average RSI for key narratives, including AI, DeFi, Level 1 blockchains, new memes, and more.
Customizable RSI Settings: Adjust RSI period, line width, and label offsets for personalized analysis.
Dynamic Alerts: Receive alerts when a narrative enters overbought or oversold territory, helping you act quickly on market movements.
Clean Visualization: Overlay sector-specific SMA lines with distinct colors and optional labels for quick interpretation.
Multi-Narrative Comparison: Analyze trends across diverse narratives to identify emerging opportunities.
Parameters for Customization:
RSI Period: Set the lookback period for RSI calculations (default: 14).
Line Width: Adjust the thickness of plotted lines (default: 2).
Label Offset: Control label placement for better chart readability.
Overbought/Oversold Thresholds: Configure the RSI levels for alerts (default: 70/40).
How to Use:
Add the script to your TradingView chart.
Customize the RSI parameters to suit your trading strategy.
Monitor the plotted SMA lines to identify narrative-specific trends.
Set alerts for overbought and oversold conditions to stay informed in real time.
Alerts System:
Alerts trigger when a narrative crosses predefined overbought or oversold levels.
Text notifications suggest potential trading actions, such as selling on overbought or buying on oversold.
Intended Users:
This script is ideal for crypto traders, sector analysts, and market enthusiasts who want to track performance across narratives and gain actionable insights into sector rotations.
Disclaimer:
This script is for educational and informational purposes only. It does not constitute financial advice. Please test on historical data and practice caution when trading.
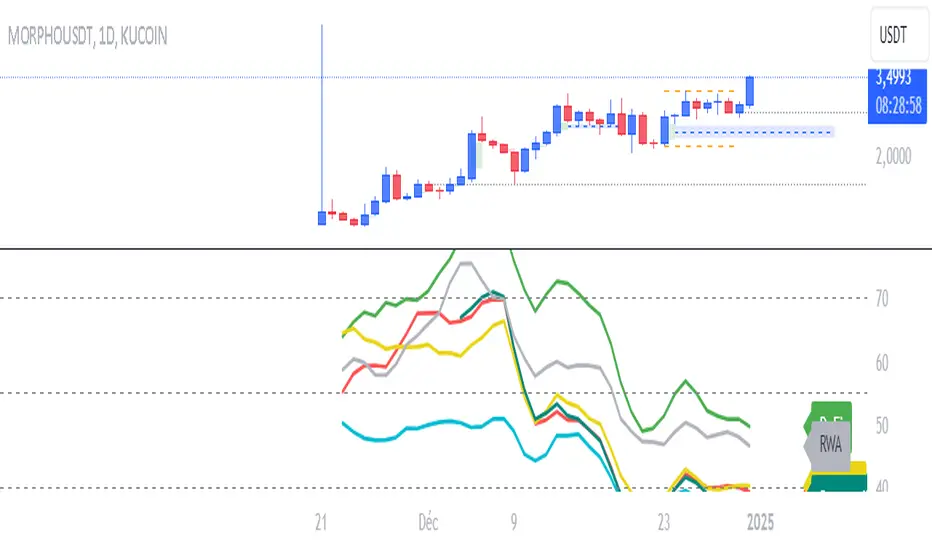
Crypto Sectors Performance [Daveatt]IMPORTANT
⚠️ This script must be used on the Daily timeframe only.
OVERVIEW
This indicator brings the powerful sector analysis capabilities from velo.xyz/market's
Sector Performance chart to TradingView.
It enables traders to track and compare performance across the crypto market's major sectors, providing essential insights for sector rotation strategies and market analysis.
CALCULATION METHOD
The indicator calculates performance across six key crypto sectors: DeFi, Gaming, Layer 1s, Layer 2s, AI, and Memecoins.
For each sector, it computes a rolling percentage performance by averaging the performance of multiple representative tokens.
All sector performances are rebased to 0% at the start of each period, making relative comparisons clear and intuitive.
VISUALIZATION MODES
The script features two distinct visualization methods:
Plots Mode:
Displays continuous performance lines for each sector over time, ideal for tracking relative strength trends and sector momentum. Each sector has its own color-coded line with performance values clearly marked.
Bars Mode:
Presents current sector performance as vertical bars, offering an immediate visual comparison of sector gains and losses.
The bars are color-coded and labeled with exact percentage values for precise analysis.
For the "Bars Mode", I used the box.new() function
SECTOR COMPOSITION
Each sector comprises carefully selected representative tokens:
- DeFi: AAVE, 1INCH, JUP, MKR, UNI
- Gaming: GALA, AXS, RONIN, SAND
- Layer 1: BTC, ETH, AVAX, APT, SOL, BNB, SUI
- Layer 2: ARB, OP, ZK, POL, STRK, MNT
- AI: FET, NEAR, RENDER, TAO
- Memecoins: PEPE, BONK, SHIB, DOGE, WIFU, POPCAT
PERFORMANCE TRACKING
The indicator implements a rolling window approach for performance calculations.
Starting from 0% at the beginning of each period, it tracks relative performance with positive values indicating outperformance and negative values showing underperformance.
Multiple timeframe options (1W, 1M, 3M, 6M, and 1Y) allow for both short-term and long-term analysis.
APPLICATIONS
This tool proves invaluable for:
- Sector rotation analysis
- Identifying trending sectors
- Comparing relative strength
- Gauging market sentiment
- Understanding market structure through sector performance
Thanks for reading and for the support
Daveatt

The Ultimate Indicator by ATK
The Ultimate Indicator By ATK
This all-in-one trading indicator integrates multiple advanced tools to provide ICT traders with deep insights into market structure, liquidity zones, Fair Value Gaps (FVG), and AI-powered signals. Whether you’re a scalper or a long-term trader, this indicator offers real-time analysis and helps identify potential trading opportunities in dynamic markets.
🔵 Key Features
🔹 2 options for checking SMT (Separation and Divergence) Detection:
First - Compares highs and lows of a primary symbol (e.g., NQ1!) with a user-defined comparison symbol (e.g., ES1!).
Automatically detects and visualizes discrepancies (red for highs, blue for lows) between the symbols.
Offers customizable comparison settings and alerts for divergence detection.
Second -
Real-time SMT comparison between two tickers - red/green lines.
🔹 Market Structure Change (MSS) & Break of Structure (BOS) Detection:
Identifies market structure shifts and breakouts, crucial for spotting potential reversals.
Customizable sensitivity and length settings to adapt to various market conditions and trading strategies. Use 3 different timeframes on the same chart.
🔹 Buy Side & Sell Side Liquidity Zones:
Highlights liquidity zones on both buy and sell sides, offering a clear view of market pressure points.
Configurable settings for detection length, margin, and alert conditions for liquidity sweeps like the 15-minute Buy Side Liquidity (BSL) and Sell Side Liquidity (SSL).
These lines from Swing Highs & Lows:
Automatically plots horizontal lines at the most recent swing highs and lows.
Lines are removed once the closing price breaches these levels, ensuring real-time updates and clean charting.
🔹 Fair Value Gap (FVG) Detection:
Detects FVG formations on 5-minute and 1-minute charts, making it ideal for scalpers capturing liquidity gaps.
Includes directional arrows and customizable alerts based on higher and lower timeframe FVG analysis, helping traders time their entry and exit points.
🔹IFVG (Inverse fair value gap) - yellow
🔹IFVG + SMT - Light blue
🔹IFVG + SMT + HTF FVG - green/red (1 min only)
🔹IFVG + SMT + BSL/SSL Swept - green/red (1 min only)
for example:
🔹 Capture and plot significant price levels at specific times throughout the trading day:
TDO (True Day Open): The price at which a market opens at 12:00 AM US.
TMSO (True Micro Session Open): The open price of the Q2 of the micro session.
RVT (Revolving True Open): The price recorded at 12:00 PM US.
AO (Asia True Open Price): The price captured at 7:30 PM US, specifically representing the opening price of the Asian session.
LO (London True Open Price): 1:30 AM US
AM (New York Session - Afternoon Market True Open Price): 7:30 AM US
PM (Post Market Open Price): 1:30 PM US.
For example TMSO:
🔹 AI-Powered Entry Detection:
The script helps identify entry points based on specific candle patterns, while also considering the exponential moving averages (EMAs) for trend confirmation.
🔶FFMS Strategy: (First Five Minute Strategy)
Check 5-min time frame if the price is between the high and low of the previous day. then, when NYO if there is retest on the High/Low on the 5-min chart after crossover or crossunder the 5 minute first candle high/low lines.
🔶PSP & PSP + FVG
🔹The Precision Swing Point (PSP). It helps you visually identify price decorrelation (type of SMT) among key futures contracts (NQ/ES or NQ/ES/YM/ZB) and set alerts for these significant market movements.
🔹The PSP HTF 15 Min + FVG LTF 1 Min
In this strategy the script is looking for PSP in HTF (15-Min) and capture the FVG in LTF (1-Min) only if its between High and Low of the PSP.
If there is a retracement in parallel micro session time, for example: Q1 with Q3 or Q2 with Q4, Q3 with Q1, etc…
if the retracement was happened and the price close above/below the high/low of the FVG from the LTF that captured according to the direction for long/short, it plots an arrow.
Update the script that checks the purple arrows and shows all of them each time there is a new PSP in a 15-minute timeframe and then FVG in 1 Min timeframe with the reference to the TDO/TMSO/Open session
for example:
Step 1: PSP 15Min LOW/HIGH Lines look for FVG by the conditions above - purple arrow
Step 2:FVG founded - purple arrow
SMT Fill on 15 min timeframe + IFVG 1 min - Detected option:
When Sym1 closed above/below FVG and Sym2 didn't it is SMT FILL (15 Min timeframe)
White arrows when captured SMT FIll + IFVG:
option to turn on alert on this strategy too.
🔹Detect liquidity swept on 15-min timeframe by $$ - green/red
🔹Detect liquidity to sweep zones on by diamonds - green/red
🔹Alerts for all Events and full scenarios.
Real-time notifications ensure traders can act quickly on potential trade setups.
🔵 Conclusion:
This Ultimate Indicator by ATK brings together critical elements of market analysis in one tool for ICT traders, offering real-time insights, alerts, and visual aids to enhance trading strategies. Whether you’re focused on short-term price action or long-term market trends, this indicator provides the tools necessary for informed decision-making and improved trading performance.
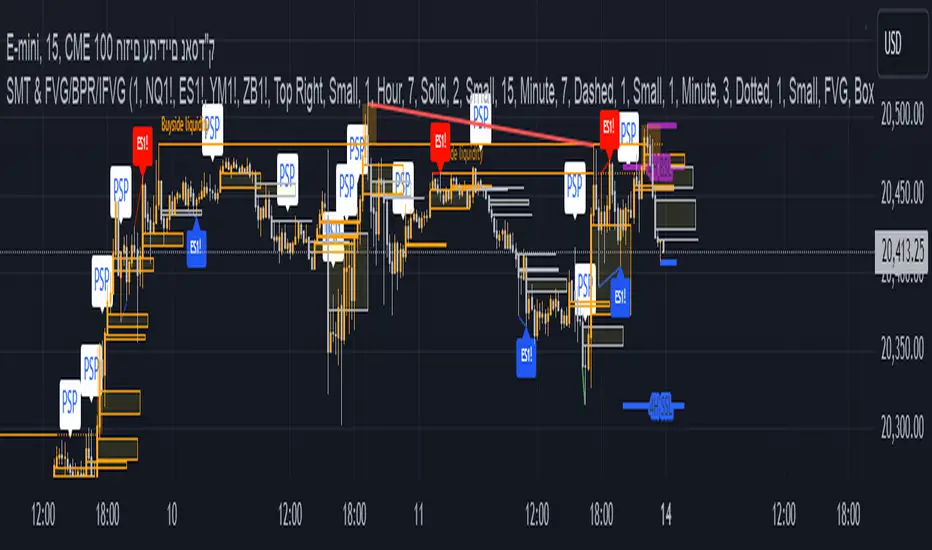
Sector Daily Gain/Loss TableOverview: The "Sector Daily Gain/Loss Table" is a custom TradingView indicator designed to display the daily percentage changes in selected cryptocurrency sectors. This indicator provides a comprehensive view of the performance of various cryptocurrencies organized into specific sectors, helping traders and analysts to make informed decisions based on sector performance.
Key Features:
Dynamic Data Retrieval: The indicator retrieves daily closing prices for multiple cryptocurrencies across different exchanges (Binance and Bybit) using the request.security function. This allows users to monitor real-time price movements.
Sectors Covered:
BTC Sector: Includes Bitcoin (BTC).
ETH Sector: Includes Ethereum (ETH).
RWA Sector: Comprises various assets such as OM, ONDO, POLYX, SNX, PENDLE, and HIFI.
L1/L2 Sector: Features major Layer 1 and Layer 2 solutions including ETH, BNB, SOL, XRP, TON, ADA, AVAX, DOT, SUI, APT, ICP, POL, and more.
MEME Sector: Showcases popular meme coins like DOGE, SHIB, PEPE, WIF, BONK, FLOKI, ORDI, BOME, and NEIRO, along with MEW and POPCAT from Bybit.
AI Sector: Highlights AI-related tokens such as TAO, FET, GRT, THETA, WLD, and TURBO.
DEFI Sector: Displays decentralized finance projects including UNI, AAVE, INJ, RUNE, MKR, JUP, LDO, PENDLE, CAKE, LUNA, RAY, OSMO, KAVA, and RSR.
Average Gain/Loss Calculations: For each sector, the indicator calculates the average percentage change in price based on the included cryptocurrencies, offering insights into sector-wide performance trends.
Table Display: The performance metrics are presented in a clean and organized table format on the TradingView chart, providing easy access to vital information for traders.
User-Friendly Design: The table is designed to be visually appealing and informative, with color coding and clear labeling for each sector and its corresponding percentage change.
Usage: Traders can utilize this indicator to quickly assess the performance of various cryptocurrency sectors and make informed trading decisions based on the daily changes in sector performance.
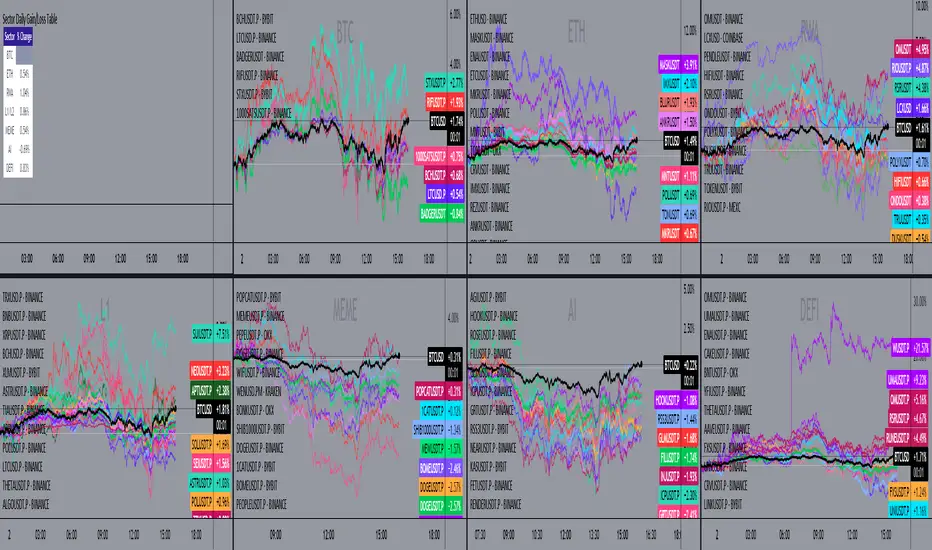
Altcoin ManagerThe Altcoin Manager is a comprehensive script for identifying the current altcoin narrative by tracking and analyzing of a wide array of altcoins across various blockchain layers and categories, such as DeFi, GameFi, AI, and Meme coins. Ideal for traders looking to get a broad yet detailed view of the altcoin market, covering various sectors and chains.
The Key Features:
Versatile Asset Tracking:
Tracks 40 different cryptocurrencies (as of publishing) across different categories, allowing for a diversified and detailed analysis of the altcoin market.
Customizable Assets and Category Analysis:
Select 20 of your own coins across 4 different categories such as DeFi, GameFi, AI, and Meme coins as well as specifying their individual chains.
Dynamic Layer and Chain Analysis:
Includes options to plot and analyze specific blockchain layers and chains such as Ethereum Chain, Solana Chain, BNB Smart Chain, Arbitrum Chain, and Polygon Chain. The script associates various assets with specific blockchains, providing a clearer picture of how different segments of the altcoin market are performing.
Cumulative and Per-Candle Change:
Switch between viewing the total cumulative change since a set start date or the per-candle change, offering flexibility in analyzing price movements over different timeframes.
Denomination Adjustment:
Includes a functionality to denominate asset prices in other currencies or crypto such as BTC, allowing for a more tailored financial analysis according to your preference.
Moving Averages for Categories and Chains:
Calculates and plots moving averages for each category and chain, aiding in the identification of trends over the selected moving average length.
How do I use it?
This script is not used with any particular chart. Instead, assign it it's own tab and layout.
For a clearer analysis, use multiple different panels to track Categories and Chains separately, both Cumulative for a longer term analysis and Per-Candle to find ongoing breakouts and changes in trend.
You can either use the pre-selected altcoins to represent the market, or you can select your own.
The Layer 1 and Layer 2 are not customizable but consists of 15 popular Layer 1 incl Bitcoin, Ethereum, Solana etc. Layer 2 consists of 5 popular Layer 2.
