ADX and DI LevelsADX:
ADX is used to quantify trend strength. ADX calculations are based on a moving average of price range expansion over a given period of time. The default setting is 14 bars, although other time periods can be used.1
ADX can be used on any trading vehicle such as stocks, mutual funds, exchange-traded funds and futures.
DI (+/-):
The directional movement index (DMI) is an indicator developed by J. Welles Wilder in 1978 that identifies in which direction the price of an asset is moving. The indicator does this by comparing prior highs and lows and drawing two lines: a positive directional movement line (+DI) and a negative directional movement line (-DI). An optional third line, called the average directional index (ADX), can also be used to gauge the strength of the uptrend or downtrend.
This indicator has the length changed from 14 to 9 so you can have more updated price calculation
I also add the 4 levels I use for day trading; the 10, 20, 30, 40-50 are the levels I like to see the Di to break over.
A lot of traders use different levels, but these I have and found most useful. You can set alerts when any Di crosses over the 40 for true trend breakout!
스크립트에서 "adx"에 대해 찾기

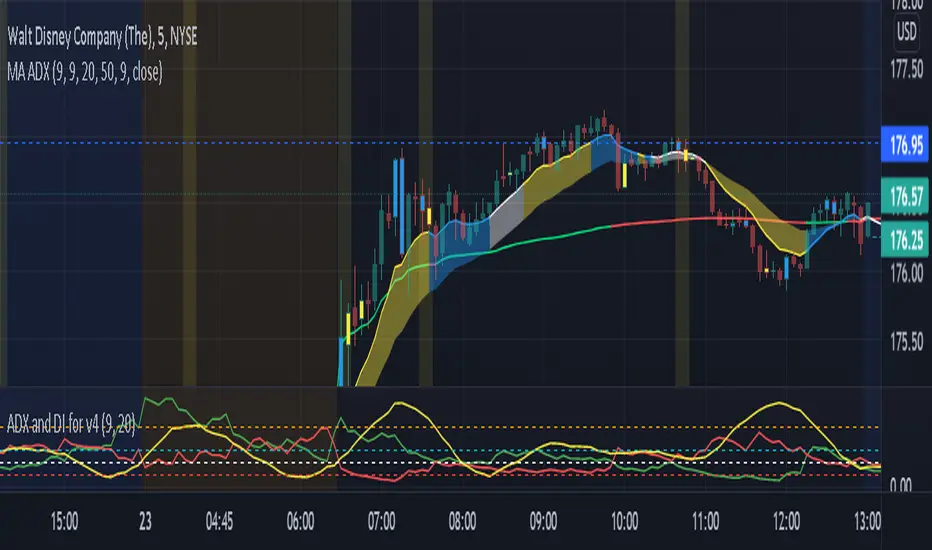
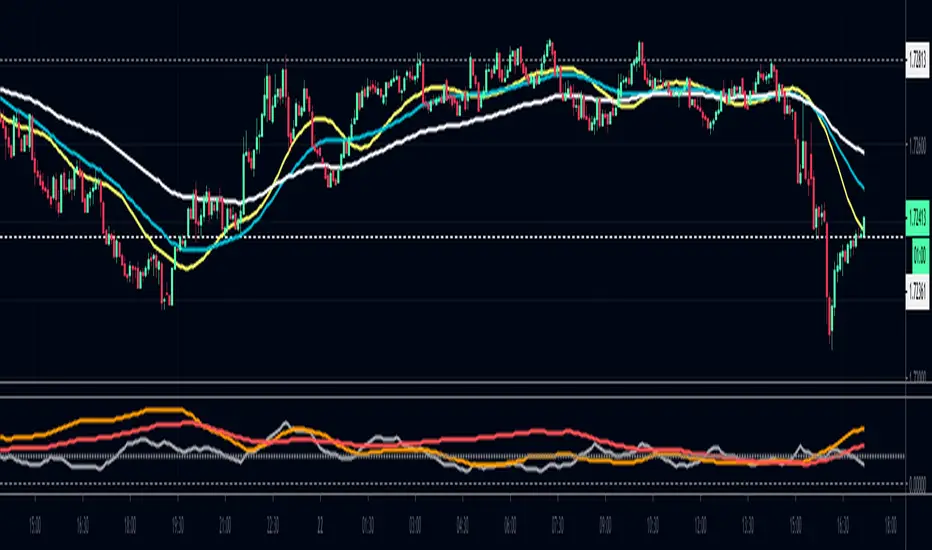
ADX and DI EMA Trend LineADX: The average directional index (ADX) is a technical analysis indicator used by some traders to determine the strength of a trend.
DI: The directional movement index (DMI) is an indicator developed by J. Welles Wilder in 1978 that identifies in which direction the price of an asset is moving. ... Conversely, if -DI is above +DI, then there is more downward pressure on the price. This indicator may help traders assess the trend direction.
EMA: The exponential moving average (EMA) is a technical chart indicator that tracks the price of an investment (like a stock or commodity) over time. The EMA is a type of weighted moving average (WMA) that gives more weighting or importance to recent price data.
UPDATE: This current indicator has been changed from MA and EMA trend lines the 9 and the 50, and also added Inside & Outside bars...You can toggle anything Off or On
The code in this indicator calculates the value of each ADX and DI (+/-) value to give a green color for DI + trend and a red color for DI - trend, and lastly white for no direction...The nice part of this code is the 50 EMA will be your bull or bear transition level. The colors heading to the ema will tell you if we are still bull or bear heading to the EMA.
I also changed the ADX to become the 9 EMA with Yellow showing a ADX positive rate of change, Blue showing a negative rate of change, and white to show that the trend has no direction.
Open settings to adjust how big or small you want the ema lines to be and adjust colors for what works for you. Hopefully you enjoy this update
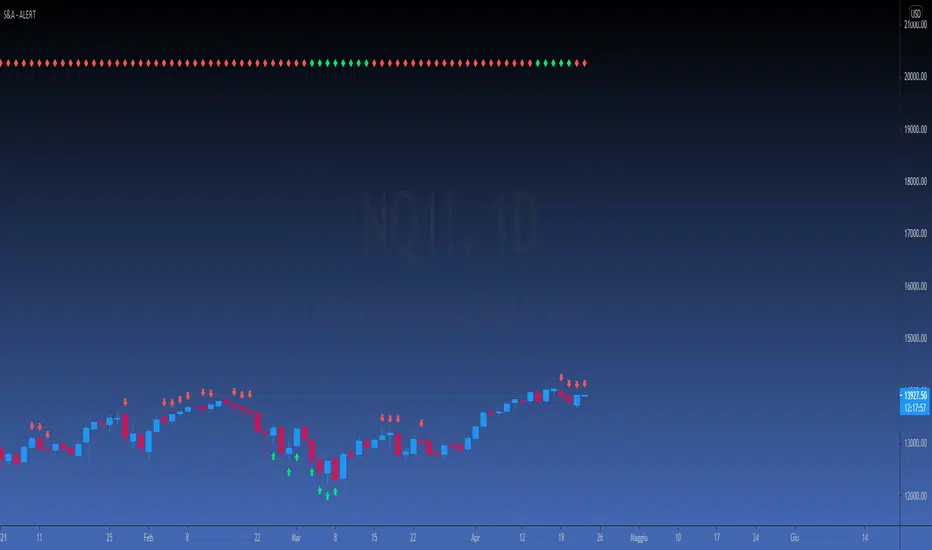
[FP] STOCH & ADX EASY ALERTENG DESCRIPTION
This script is a simple request from user, that want to have an allert when ADX and Stochastic has certain contidion.
Also this indicator show when ADX is > or < than 40 when with red and green diamonds on top.
It's used to validate a weakly setup to trade FUTURES.
DESCRIZIONE IN ITALIANO
Questo script è una semplice richiesta da parte di un utente, il quale richiedeva un alert quando lo Stocastico e l'ADX raggiungono determinate condizioni.
Inoltre l'indicatore mostra quando l'ADX è maggiore o minore di 40 plottando dei diamanti in alto sul grafico.
[WJ] - ADX v2 [DMI, Alerts, Histogram, Customizable]A handy all-in-one package for DMI and ADX
Color-coordinated line for DMI with an EMA and histogram to gauge momentum, mark potential reversals, and quickly gather all the information you need to make your decisions.
Quick take-aways:
- Color of the ADX line indicates the current trend
- An ADX below the EMA indicates a potentially falling/reversing trend
- Customizable line w/ alerts for ADX crossovers
- Histogram to help catch potential reversals faster, and to gauge the momentum
Please let me know what you think, and in any features you think would increase the effectiveness of this amazing tool.

THD ADX The TradersHelpDesk easily identifies whether the DMI+ or DMI- is dominant, plus identifies when the market is trending using the ADX line. Since the ADX is a non-directional indicator, strong trends should show an increasing ADX line. Additionally, whenever the magenta dot is plotted, traders can expect price to retrace. If the ADX is above 70, then a stronger retracement is likely. For more information, click here .

ZeroLag ema + adx = trueCombined LazyBears ZeroLag EMA and CapnOscars moving average ADX. Here's the result.
I figured it could be used as a trend trendtrading system,
ADX red + ema cross downards = short.
ADX green + ema cross up = long.
ADX black + ema cross = no trade
Or something along those line. A way filter out whipsaws.
This is just something I threw together in 5 min, so din't go all in tho. Haven't had time to test.
2 ADX
3 Z-EMAs
Colors/settings can be customized.

TTP SuperTrend ADXThis indicator uses the strength of the trend from ADX to decide how the SuperTrend (ST) should behave.
Motivation
ST is a great trend following indicator but it's not capable of adapting to the trend strength.
The ADX, Average Directional Index measures the strength of the trend and can be use to dynamically tweak the ST factor so that it's sensitivity can adapt to the trend strength.
Implementation
The indicator calculates a normalised value of the ADX based on the data available in the chart.
Based on these values ST will use different factors to increase or reduce the factor use by ST: expansion or compression.
ST expansion vs compression
Expanding the ST would mean that the stronger a trends get the ST factor will grow causing it to distance further from the price delaying the next ST trend flip.
Compressing the ST would mean that the stronger a trends get the ST factor will shrink causing it to get closer to the price speeding up the next ST trend flip.
Features
- Alerts for trend flip
- Alerts for trend status
- Backtestable stream
- SuperTrend color gets more intense with the strength of the trend

Squeeze M + ADX + TTM (Trading Latino & John Carter) by [Rolgui]About this indicator:
This indicator aims to combine two good performing strategies, which can be used separately or together, mainly for investment positions, although it can also be used for intraday trading.
Strategy 1) Squeeze Oscillator and Average Directional Index:
This strategy is taught by Jaime Aibsai, which determines market entries based on reading the direction of the price movement (Directionality of the Oscillator) along with the strength of the Oscillator (Slope of the ADX).
Both tools are configured according to Jaime Abisai's strategy, by default (note that point 23 of the ADX is represented by point 0 on the panel, to make reading easier, its interpretation is not affected). Anyway you can adjust the input data according to your interest.
*You can see this setting in the first panel.
Strategy 2) Squeeze Momentum and Trade The Market Waves:
This strategy can be consulted either in John F. Carter's books or on his website.
This market reading is based on Price Volatility (Bollinger Bands and Keltner Channels interaction) and its Trend (Exponential Moving Averages), showing entries at times when price volatility is low and taking filtering active trend using T.T.M. Waves.
To configure the indicator in the same way that Carter does, it would be enough to turn off the ADX, turn on the Squeeze Momentum signals along with the T.T.M. Waves, and importantly, change the Linear Momentum value to 12 (this configuration can be found in his book).
*You can see this setting in the second panel.
Why this indicator?
I've added and removed the above flags as I needed to query them (which became tedious for me). The main objective of having merged them into one is to make their reading more agile and comfortable and thus improve the decision-making capacity of the trader who wishes to use them.
Credits and Acknowledgments:
I would like to give credits to other authors, for the sections of code that I have used to make this technical indicator. Thanks to @LazyBear, @matetaronna, @jombie and @joren for contributing to the community and keeping their code open. It is priceless!
Feel free to combine and practice your trading with both strategies, personally, they improved my profitability and this is why I recommend researching more about them. I've been using it for crypto investing, let me know if it's worth for you on stock market!
If you have any questions or suggestions you can leave it in the comments!
Greetings!

Scalping EMA ADX RSI with Buy/Sell AlertsThis is a study indicator that shows the entries in the strategy seen in one of the youtube channel so it does not belong to me. I can't tell who it is because it's against the House Rules to advertise but you can find out if you look for it on youtube. Default values of oscilators and ema adjusted as suggested. He says he got the best results in 5 min timeframe but i tried to make things as modifiable as possible so you can mess around with the settings and create your own strategy for different timeframes if you'd like. Suggested to use with normal candlestick charts. The blue line below indicates the ADX is above the selected threshold set in the settings named "Trend Ready Limit". You can set alerts for Buy, Sell or Buy/Sell signal together.
The entry strategy itself is pretty straight forward.
The rules for entry are as follows, the script will check all of this on auto and will give you buy or sell signal :
Recommended time frame: 5 min
For Long Entry:
- Check if price above the set EMA (Can disable this rule if you'd like in the settings)
- RSI is in Oversold
- ADX is above set "Trend Ready" threshold (Meaning there is a trend going on)
- Price must approve the trend of previous candles. This is bullish for buy entries and bearish for sell entries.
- Enter with stop loss below last swing low with 1:1 or 1.5:1 take profit ratio.
For Short Entry:
- Check if price below the set EMA (Can disable this rule if you'd like in the settings)
- RSI is in Overbought
- ADX is above set "Trend Ready" threshold (Meaning there is a trend going on)
- Price must approve the trend of previous candles. This is bullish for buy entries and bearish for sell entries.
- Enter with stop loss above last swing high with 1:1 or 1.5:1 take profit ratio.
This is my first indicator. Let me know if you want any updates. I am not sure if i can add everything but i'll try nonetheless.
Changed: Signals will check up to 2 candles before if the RSI is below or above the set value to show signal. This is because sometimes the entry signal is right but the response might be a bit late.

KINSKI ADXThis ADX indicator (Average Directional Index) tries to estimate the strength of a trend. The Average Directional Index is derived from the positive (+DI) and the negative directional indicator (-DI). The direction of movement is determined by comparing the highs and lows of the current and past periods.
As soon as the indicator determines a trend strength for upward or downward trend, a label is displayed. An upward trend is labelled "Bullish Trend". The downward trend bears the label "Bearish Trend".
The clouds in the background represent the movements of the Average Directional Index High/Low:
Color orange: neutral, uncertain in which direction it is going.
Color green: upward trend
Color red: downward trend
The line represents the average value of the ADX signal:
Color orange: neutral: still uncertain in which direction it is going
Color green / outgoing line: upward trend
Color green / descending line: weakening upward trend
Color red / exiting line: downward trend
Color red / descending line: weakening downward trend
The following configurable options are possible:
"ADX Smoothing
Directional Index Length
Level Range
Level Trend

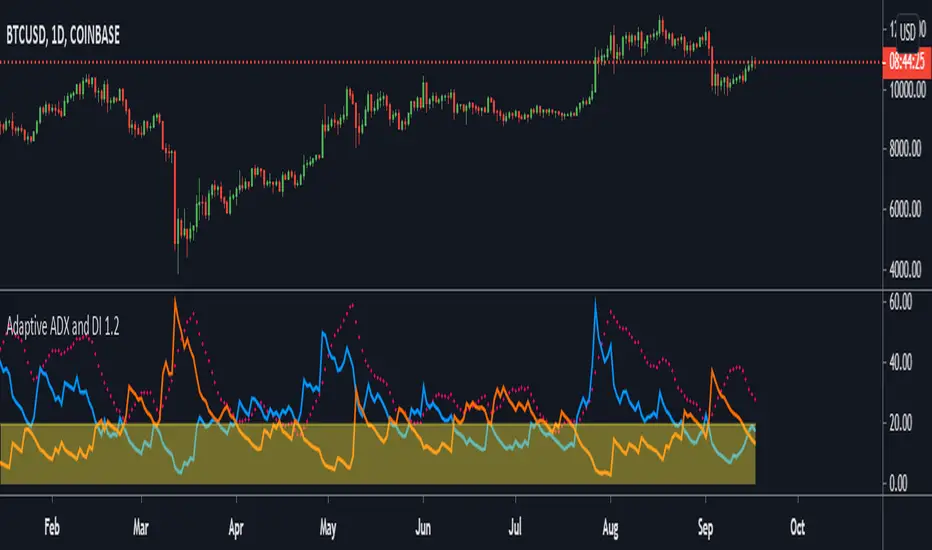
Adaptive ADX and DIThis is part 2 of 11 in the system named Ninetales/Volt V2 you can find on Tradingview.
It simply measures all of the combinations of the defined parameters of a typical ADX + DI , and returns the most logically accurate values.
Use it however you would use a standard ADX + DI, just add your preferred values to test against each other, and set the period you would like for it to backtest.
Standard use would be to wait for ADX(red line) to be above the threshold(yellow shaded area). The short when orange is above the blue line, and long when the blue line is above the orange line.
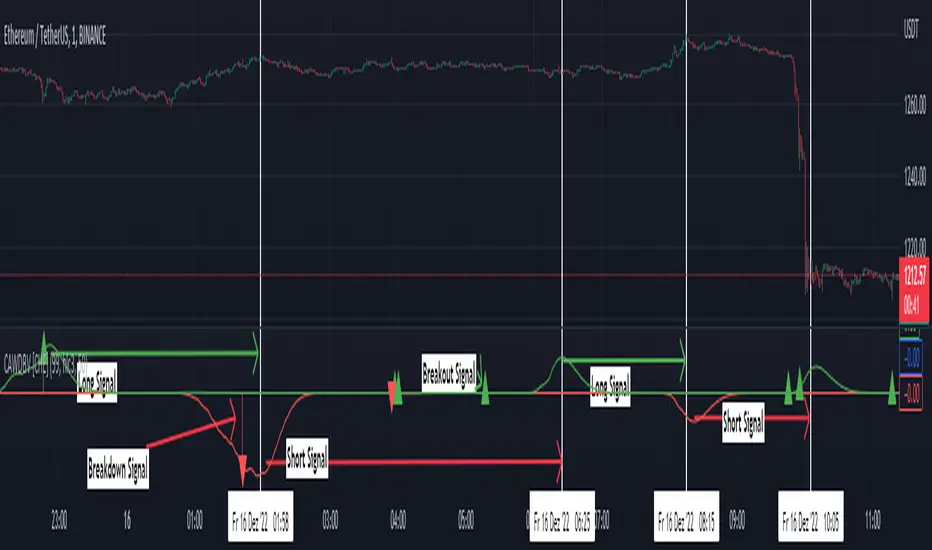
ADX signal Binary Options System by Hashtag_binary ADX signal Binary Options System is amanual trading system trend-momentum high/low. This system is still really interesting to use for binary options and trading without binary.
- Time Frame 15 min or higher.
- Expiry time 2-4 candles.
- Markets: Forex (Currency pairs: Majors; Index: S&P 500, Dow Jones, DAX, FTSE).
Trading rules ADX signal Binary Options System
Buy call:
1. The Moving Average line (14) is above others two Moving Averages (60 and 100 red and magenta line).
2. The TrendSignal Bar first subwindow indicator with bar green.
3. Stochastic is above 50 level.
4 If the previous conditions are agree when appear ADX green arrow you can enter buy call.
Buy Put:
1. The Moving Average line (14) is below others two Moving Averages (60 and 100 red and magenta line).
2. The TrendSignal Bar first subwindow indicator with bar red.
3. Stochastic is below 50 level.
4. If the previous conditions are agree when appear ADX red arrow you can enter buy put.
Exit position for trading without binary
Time Frame H1 and 30 min place trailing stop 15 or 20 pips, 4H time frame place trailing stop 30-40 pips depends by currency pairs.
Initial stop loss on the previous swing High/Low.

Wolfs ADX + DII have created an alternative visualisation of the ADX + DI indicator created by MasaNakamura, credits to them for providing the source code! :-)
The histogram represents the distance between the DI+ and the DI-. The crossing of the histogram is equal to the crossing of the DI lines.
The ADX line is coloured based on the threshold.
This creates a clean representation of the ADX + DI.

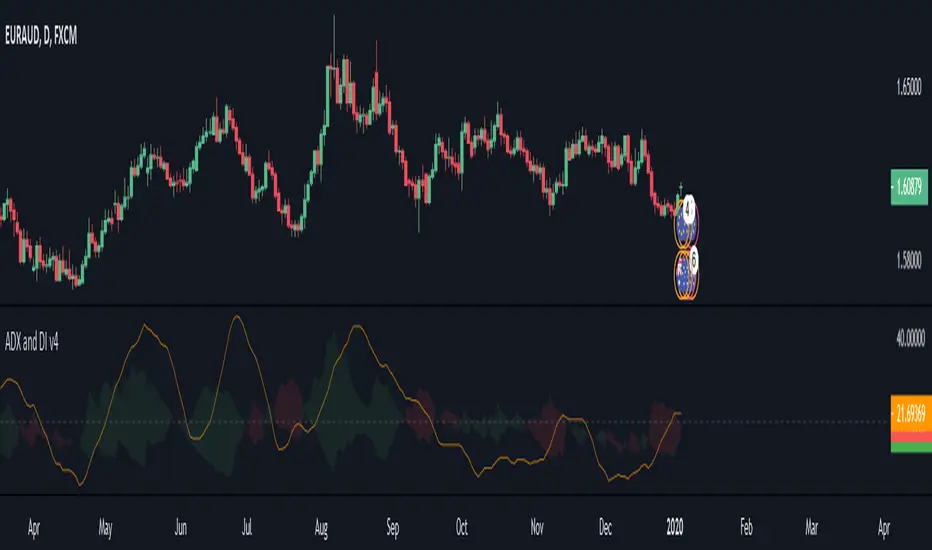
[PX] ADX and DI v4Hey guys,
I recently used the "ADX and DI" indicator in a variety of my own scripts. Because I keep on developing version 4 scripts and the "ADX and DI" indicator is developed in one of the previous PineScript versions, I had to update the old script every time I wanted to use it. I decided to publish the updated version and also changed a few things:
- ADX color is now orange
- Instead of plotting the DI+ and DI- lines, it's filling the space between the two (can be changed in the "style"-section)
Maybe some of you find it useful. If so, leave a like or follow :)
Happy trading,
paaax
P.S: The original indicator was developed by the user @MasaNakamura. Thanks for your great work!
Triple ADX by KviateqMy favorite indicator to date. It plots three timeframe ADX lines on one chart along with a Key Level.
Once all the lines are above the Key Level the market is trending heavily.
Warning! Just like the standard ADX, the script DOES NOT show the direction of the trend, only its STRENGHT!
I set the secondary ADX's lines to 11, but that can be changed based on your preferences.
Enjoy!
Vol-Pace Projected-ATR-ADX-Alert-MAThe VolSC indicator analyzes stock volume trends with a focus on the Pace metric, which projects today's volume as a percentage of the 30-day average, highlighting unusual activity (e.g., over 200% turns bright green with alerts). The phantom projection bar, a wide green histogram to the right of the last bar, visually represents this projected volume on daily charts only, aiding quick identification of potential volume surges without cluttering intraday or weekly views. Additional features include ADX strength, ATR averages, and customizable table display for comprehensive insights.
Key Features:
* Primary Indicator: Volume with ADX (Average Directional Index) text.
* Pacing and Alerts: Calculates the volume pace for the day. Features an unusual volume alert with an adjustable threshold (e.g., 200%).
* Volume Projection: Projects a visual "Phantom Volume" for the day, offset to the right of the actual volume bar.
* ATR Indicator: Displays the 2x ATR (Average True Range) value as text.
* Volume Average: Displays the ADV (Average Daily Volume) Moving Average as text.
* Customization: Most settings are adjustable.

Volume Based RSI with ADXThe RSI indicator is a powerful tool that utilizes both volume and time to determine market trends. When there is a low volume of trades in a short period of time, but the trading activity is high, it is considered bullish or bearish. In the case of a bullish trend, the RSI indicator will display a green color, while a bearish trend will be represented by a red color. If there is no trading activity, the indicator will display a gray color. Additionally, if the ADX level meets the threshold level, the indicator will display a blue color. However, if the ADX level does not meet the threshold level, the indicator will revert back to displaying a gray color.

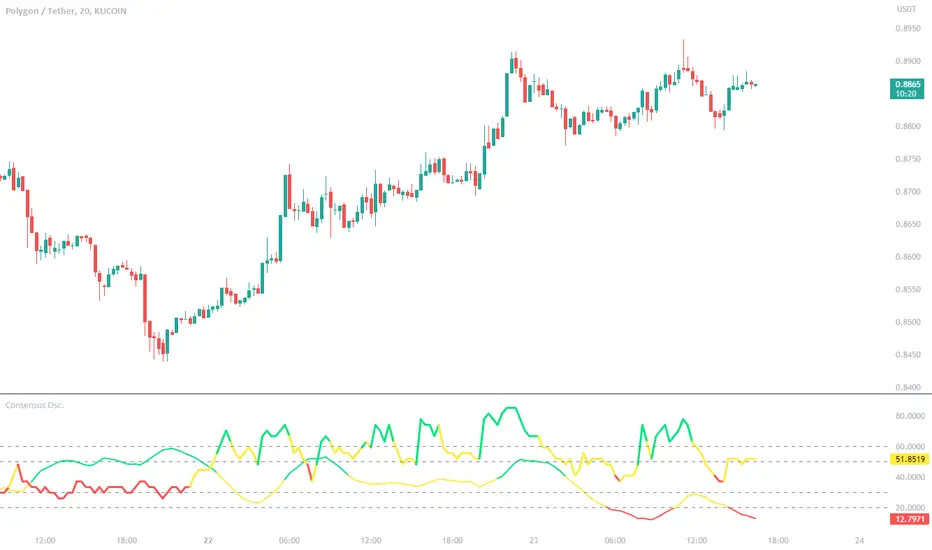
Consensus Oscillator with ADX (LeafAlgo)This indicator creates a normalized consensus from a set of other indicators -- Chande Momentum Oscillator (CMO), Detrended Price Oscillator (DPO), Momentum (MOM), Rate of Change (RoC), Relative Strength Index (RSI), the True Strength Index (TSI) Value line, Volume Oscillator, and a normalized Z-score.
The consensus is created by giving ranged values to each individual indicator. These individual values are added together, then put through a normalization function to create a 0-100 range. The scoring for each indicator is as follows:
CMO:
- If chandeMO <= -50, then the score is valued at -2
- If chandeMO > -50 and chandeMO <= -25, then the score is valued at -1
- If chandeMO > -25 and chandeMO < 25, then the score is valued at 0
- If chandeMO >= 25 and chandeMO < 50, then the score is valued at 1
- If chandeMO >= 50, then the score is valued at 2
DPO:
- If dpo <= -0.005, then the score is valued at -2
- If dpo > -0.005 and dpo <= -0.0025, then the score is valued at -1
- If dpo > -0.0025 and dpo < 0.0025, then the score is valued at 0
- If dpo >= 0.0025 and dpo < 0.005, then the score is valued at 1
- If dpo >= 0.005, then the score is valued at 2
MOM:
- If mom <= -0.05, then the score is valued at -2
- If mom > -0.05 and mom <= -0.025, then the score is valued at -1
- If mom > -0.025 and mom < 0.025, then the score is valued at 0
- If mom >= 0.025 and mom < 0.05, then the score is valued at 1
- If mom >= 0.05, then the score is valued at 2
ROC:
- If roc <= -20, then the score is valued at -2
- If roc > -20 and roc <= -10, then the score is valued at -1
- If roc > -10 and roc < 10, then the score is valued at 0
- If roc >= 10 and roc < 20, then the score is valued at 1
- If roc >= 20, then the score is valued at 2
RSI:
- If rsi <= 20, then the score is valued at -2
- If rsi > 20 and rsi <= 40, then the score is valued at -1
- If rsi > 40 and rsi < 60, then the score is valued at 0
- If rsi >= 60 and rsi < 80, then the score is valued at 1
- If rsi >= 80, then the score is valued at 2
TSI Value:
- If tsi <= -20, then the score is valued at -2
- If tsi > -20 and tsi <= -10, then the score is valued at -1
- If tsi > -10 and tsi < 10, then the score is valued at 0
- If tsi >= 10 and tsi < 20, then the score is valued at 1
- If tsi >= 20, then the score is valued at 2
Volume Oscillator:
- If vo <= -20, then the score is valued at -2
- If vo > -20 and vo <= -10, then the score is valued at -1
- If vo > -10 and vo < 10, then the score is valued at 0
- If vo >= 10 and vo < 20, then the score is valued at 1
- If vo >= 20, then the score is valued at 2
Normalized (-1 to +1) Z-Score:
- If z_n <= -0.5, then the score is valued at -2
- If z_n > -0.5 and z_n <= -0.25, then the score is valued at -1
- If z_n > -0.25 and z_n < 0.25, then the score is valued at 0
- If z_n >= 0.25 and z_n < 0.5, then the score is valued at 1
- If z_n >= 0.5, then the score is valued at 2
The consensus line is colored depending on the closing value of the line. The color is shown as lime if above 70, a darker green between 55 and 70, yellow between 45 and 55, orange between 30 and 45, and red below 30.
Additionally, there is a normalized ADX line added into the indicator to give further confirmation to trend strength. The normalized ADX line is shown as green if above 40, yellow between 40 and 20, and red below 20.
Horizontal lines have been added at 20/30 and 50/60 as semi-important levels to watch.
Clean ADX with bidirectional Breakout VolumeThe default Average Directional Index (ADX) helps traders determine the strength of a trend, not its actual direction. The Clean ADX helps traders determine the strength of a trend on a longer time, and the possible direction on different timeframes.
The bidirectional Breakout Volume determines both directions of breakout or breakdown volume. When volume is high by comparing the previous volume high over n periods to the current volume or when volume is lower by comparing the previous volume low over n periods to the current volume.
If the current volume exceeds the previous volume high or low, then the indicator columns will turn red or green.
This indicator should make trading easier and improve analysis. Nothing is worse than indicators that give confusingly different signals.
The combination of the first and second indicator therefore makes perfect sense to me and now you are able to find your long or short trends earlier.
I hope you enjoy my new ideas
best regards
Chervolino
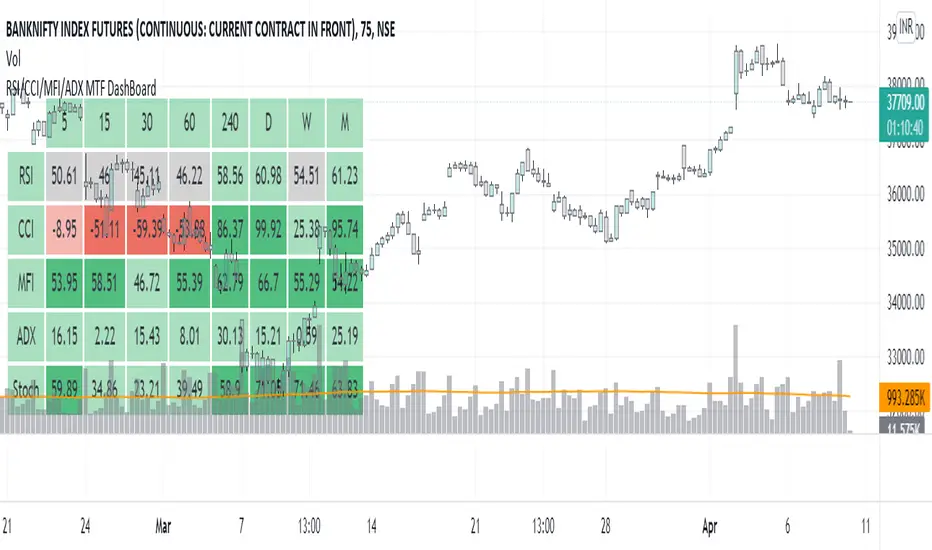
RSI/CCI/MFI/ADX/Stoch MTF DashBoardGauge Sentiment across timeframe for various indicators in single dashboard.
RSI - to get the idea about relative price strength across all TFs.
CCI /ADX- to get idea about power and strength in trend across all TFs.
MFI- gives idea whether trend is supported by volume or not across all TFs.
with this dashboard , you will get complete sentiment of market on your screen whether you use lower to upper TF or upper to lower TF approach. you can see market behavior and sentiment with these all in one dashboard across all TFs.
Better use this with MA or vwap to get trend direction.
Added feature to change location of dashboard on chart, now you can place it on top left, top right, bottom left, bottom right corner of chart as per your comfort.
2. Added ability to hide/show for all TFs.
Now you can on/off , 5min, 15 min, 30 min, 60 min, 4 hour, daily ,weekly and monthly TF column if you do not use it. you can keep and work with TFs as per your comfort and liking.
3. Added feature to hide/show indicators, MFI, CCI, ADX.
Now you can on/off indicator s MFI, CCI and ADX if you don't need them on dashboard as per your need.
Made dashboard cell width and height auto adjusted, so that it values can be visible fully on TV app on mobile too.
Hope it provides a better visual experience to read data on dashboard.
4. Added Stochastic as indicator to dashboard. STOCH is a range bound momentum oscillator. It is designed to display the location of the close compared to the high/low range over a user defined number of periods. You can use STOCH for Identifying overbought and oversold levels and also for identifying bull and bear set ups or signals across all TFs.
Hope IT helps to take better trading decisions.
StableF-AdxThe script is ADX-DMI modified verison
-Adx is labeled as Weak trend Below 25 and strong Trend above 25
-Hline is drawn at 25 for better clarification of crossover above 25
-Wait for crossover in +dmi and -dmi and to cross above 25 for any trend clarifcation
-crossover i.e upside cross of +dmi over -dmi is shown buy UP shape
-crossunder i.e downside cross of +dmi over -dmi is Shown buy DN shape
--disclaimer --This is just modified version of Bulit in ADX_DMI indicatior \ NOT advised for buy / Sell purpose

Tradelivio's Ranging vs Trending Indicator ADXThis indicator is based on ADX and helps identify if a market is ranging/consolidating or trending.
Default setting are as follows:
0-15 Absent Trend
15-25 Weak Trend
25+ Strong Trend
FYI:
50-75 Very Strong Trend
75-100 Extremely Strong Trend
You can configure 3 levels of strength (Absent, Weak & Strong)
Please keep in mind that a falling ADX line only means that the trend strength is weakening, and it usually does not mean the trend is reversing, unless there has been a price climax.

THD ADX 1.0The TradersHelpDesk ADX indicator combines the DMI+ and DMI- as a histogram with the ADX line (which is non-directional) shows trend strength and weakness.
