G.O.A.T. Scalper Diagnostics v1OVERVIEW:
The G.O.A.T. Scalper Diagnostics indicator system enables users to discover unorthodox indicator patterns, reading price charts in unusual ways, thus gaining an edge over the majority of market participants they trade against.
CONCEPTS:
Th G.O.A.T. Scalper Diagnostics is a system that aims to satisfy the fundamental condition for successful online trading - providing an edge.
It's a battle between advantages. To take other people's money, successful traders must have an advantage over everybody else. To hope for consistent success in trading, you need to do things differently and see what almost nobody else sees. Of course then you must act on it, and that's where the G.O.A.T. Scalper Diagnostic's mandate ends.
I believe the vast majority of indicators out there show you what everybody else sees. I've always been an indicator guy, I respect and cherish most indicators and I know a good indicator when I see it.
However, although most indicators are great works of art, their practicality is in most cases doubtful. Presenting great information is one thing, but providing an edge over the people you trade against is something different.
What Everybody Else Sees
The G.O.A.T. Scalper Diagnostics is based on indicators most of you have probably heard of and used:
Moving Averages (particularly the Kaufman Moving Average, among others)
ADX and DI
Bollinger Bands
Stochastic (particularly the Stochastic RSI)
Most traders should be well familiar with these classic indicators, they've provided the basis for online indicator trading for decades. But it's also true that due to how popular online trading has become all over the world, one is more and more unable to use these indicators successfully on lower timeframes.
Usually, more noteworthy success is achieved by going up in scale and discovering the timeframe where a particular indicator produces no false signals. Often times these timeframes range from bi-weekly to multi-month scale. In other words, consistently successful low timeframe trading and scalp trading in particular are now almost impossible using indicators.
Traders that dominate the scalping arena are big professional/institutional groups of traders, who have systematic access to the order books of most exchanges. This can be achieved one way or another, but not by individuals, small groups without significant capital or simply traders who lack political/social power and influence in the trading field.
In other words - giant order book traders have an edge over everybody else, who use indicators to trade on lower timeframes.
Through a series of interventions into these classical indicators, the G.O.A.T. System brings them back into the lower timeframe competitive game. Most original formulas are preserved, but these immortal classics are applied in ways popular TA would consider unorthodox.
Ingenious Indicators Built by Creators
The G.O.A.T. Scalper Diagnostics relies on the fundamental work of others. The System is developed on the basis of:
Quadratic Kernel Regression - it uses the publicly published library of Justin Dehorty: www.tradingview.com
PMARP - Price Moving Average Ratio & Percentile, publicly published by "The_Caretaker": www.tradingview.com
These Creators deserve full credit for their fundamental work and are endorsed by the G.O.A.T. Scalper Diagnostics project.
And yet... ingenious and inspired as these tools are, in my humble opinion the general public is presented with a rather unproductive way to apply them. In my own view, these wonderful tools built by JDehorty and The_Caretaker have a massive potential should they be applied and wielded in a different direction. So I tried to bring my vision about them into flesh with the G.O.A.T. Diagnostics.
What the G.O.A.T. Scalper Diagnostics Is and How to Use It
It's a System for new pattern discovery, bringing the disciplines of pattern and indicator trading together.
By using it as a stand-alone, or mixing it with other great indicators, one is able to discover new indicator patterns. Patterns can be compared, matched together and categorized. By applying statistics to differentiated historical pattern groups, we're able to derive their meaning.
Thus, the trader is able to research their own "alphabet" to read the price charts. After categorizing and differentiating pattern groups with statistically predominant meaning, the trader is then able to read into longer scenarios - price set-ups that are harder to detect due to them being stretched in time or misshapen according to the particular situation.
The G.O.A.T. Scalper leverages and encourages group trading, as different traders will probably discover different price "alphabets" for themselves, potentially giving rise to a social economy of sharing and combining "trading languages" based on indicator patterns people have discovered via the G.O.A.T. Diagnostics.
Support/Resistance Trading
The G.O.A.T. Scalper has its own way of deriving Support/Resistance.
Unlike most existing S/R indicators, The Scalper derives Support/Resistance not by measuring price highs, lows and closes, but solely by using momentum and trend strength.
This seems like a much more versatile way to plot S/R during scalping on low timeframes where time is of essence and the trader's view is too narrow to have macro S/R levels in constant consideration.
The Scalper's way to derive S/R in real time and on the go, while staying very relative to important higher timeframe S/R zones, makes it much more desirable than any other S/R indicator I've thus far encountered.
All S/R functionality is derived from the classical ADX and DI indicator. To do this, I use the ADX and DI in an unpopular way. To generate the actual plot of S/R levels I also modify the indicator's code, not by removing functional parts from it, but adding more to it in order to filter the signals it produces.
I can metaphorically describe its action in the following way:
Imagine you're Price action itself;
You're walking through a labyrinth or corridors. You're walking through one straight corridor, and it has a crossing with another corridor ahead;
Very strong wind is blowing along that other corridor. You can't see the wind, but when you reach it and try to move past it, the force of the wind resists your moving ahead and instead pushes you sideways.
At this point, the G.O.A.T. Diagnostics already knows this can only be one thing - resistance.
Orthodox TA and trading demand retests. In my opinion, this deeply rooted tradition wastes time proving the obvious, then wastes time again double-proving the validity of recent past, while scalping opportunities go to waste. Modern successful traders are way ahead of the popular strategy of testing and retesting S/R that almost every trader uses. So-called "Stops hunting" is just one expression of this situation, where wide adoption of the S/R retesting strategy actually lures unsuccessful traders into the schemes of the successful few.
In my own way of trading, I use the G.O.A.T. Diagnostics to take action on Support/Resistance as it's plotted in real time.
But probably my biggest heresy into the DI is my opinion, that the crossings of the +DI and -DI are useless and should actually be discarded.
My research shows that the DIs often show indications of being "oversold", but don't seem to exhibit an "overbought" state. Statistically, I've had much more success basing my TA on that, rather than cross-ups and cross-downs of the DI plot lines.
Therefore I discarded these crossings by presenting the DI part of the ADX and DI as a Heatmap channel rather than crossing lines.
To further enhance the ability of the System to provide S/R analysis, I plot this Heatmap onto an adjustable price offset plots (a percentage above and below current price).
In modern times, the vast majority of trading is done by automatic machines and algorithms. To give a specific example, one can easily notice, that a 5% offset of the BTC 1h price plot leads to remarkably accurate S/R charting. Following the rule to chart a S/R line connecting highs and lows on the 5% price offset often successfully "foresees" valid S/R zones before price ever visits them. Or, the levels were visited so far back in the timeframe's history that orthodox understanding considers them "invalidated" or washed away in the noise of the relevant volume profile.
My explanation for this is simple - I think Grid bots now dominate automatic trading across the majority of exchanges.
In my understanding, by adjusting the percentage offset of current price action I can often discover relevant conglomerations of dominating Grid bot cell parameters and anticipate price reaction. By plotting the DI heatmap on these price action offsets I can use the indicator for my trading decisions.
Heatmaps
Every heatmap produces different series of data. They're not the same.
Bollinger Band heatmap depicts the percentile distance between the Band's extremes.
The price candles heatmap, and the KAMA moving average heatmap, depict the percentile distance between price and the KAMA. So, it's the same thing. However, the percentile of that distance is calculated in two different ways, hence the difference in color in every particular moment. This color discrepancy aims to visualize the "strain" between price action and KAMA, like a soft and hard "springs" that go in unison with each other in sustainable moves, and in dissonance with each other during unsustainable moves.
Price offset heatmap depicts the percentile average of the +DI (above price) and the -DI (below price). A Hot temperature above price and a Cold temperature below price would mean a strong bullish sentiment, and vise versa, while Green would mean neutrality in sentiment.
There are important interplays between different heatmaps. For example, although representing totally different things, a Teal price bar would almost always (according to historical statistics) foreshadow a change in DI's heatmap sentiment. That's just one avenue of correlation between S/R analysis and sentiment analysis using the G.O.A.T. Diagnostics.
Oscillator Chart
In terms of applying Quadratic Kernel Regression, I endorse the natural principle that no center can exist without a periphery, and no periphery can exist without a center. Therefore I try to pay attention not only to the average of the regression's values, but also to the cloud of data points itself.
Following this understanding, I attempt to depict the natural cycles of price converging/diverging towards/from its regression average. To do this, I apply the classic Stochastic formula.
Thus, the Oscillator part of the System depicts the following:
Thin heatmap line displays the cycles of price converging with its quadratic kernel regression average (moving down), and diverging with its regression average (moving up). Its heatmap depicts the percentile of this oscillation.
The wider heatmap line displays the KAMA's cycles of convergence/divergence with its own quadratic kernel regression average. The reason for this is again creating discrepancy - while KAMA is based on price action, its regression data values differ from those of price action's regression. This discrepancy produces useful historic patterns that can be studied statistically.
The thin and wide purple oscillator lines depict the change of slope of price action regression average and KAMA regression average, respectively. Very often change of slope is not detectable with the naked eye, but clearly indicated by the oscillators.
By combining all these elements into a single analysis, a trader can detect hidden trends that are yet to become visible for the rest of market participants.
For example, convergence of price with its quadratic kernel regression average while the slope of the average deteriorates down in most cases (according to statistics) means a sideways consolidation in a downtrend before downtrend continuation. Conversely, deviation of price action from its regression average while the regression average slope deteriorates down usually marks the very beginning of a downtrend.
Bollinger Bands
Bollinger Bands are not modified, but are based on quadratic kernel regression values. Thus, if Bollinger Bands themselves are indicative of volatility, then based on kernel regression values, they should indicate the volatility of change of values in the regression's window.
Again, applying it to both the price and KAMA regression data series, a discrepancy is highlighted that leads to useful historical patterns subject to analysis and categorization.
SOME EXAMPLES
Support / Resistance
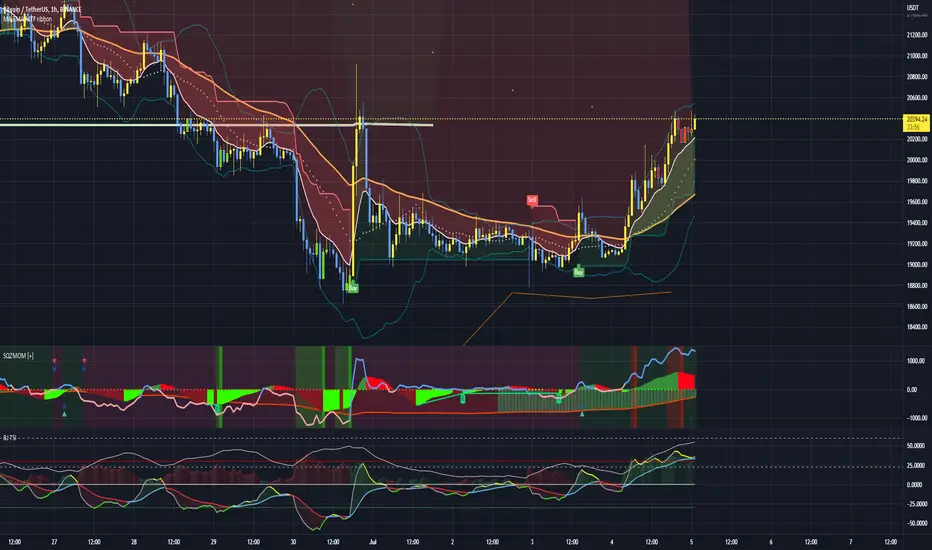
Support/Resistance levels are market by White Triangles with dotted lines plotted from them, in real time. The indicator plots Ghost Triangles in anticipation of Support/Resistance, preparing the trader for the eventual confirmation of a zone of interest and signaling price is feeling Support or Resistance pressure.
Dialing the length of the S/R lines to 25 makes the indicator more useful.
Dialing the setting to 500 clearly shows macro S/R zones by conglomerating and bundling individual lines. The thicker the bundling and the confluence of lines, the more significant the zone.
Thus lower timeframe scalping and trading is made more easy, without the need to do nearly as much manual S/R charting. Support/Resistance analysis and plotting is entirely based on a modified ADX.
Heatmap
Sustainable moves are generally marked by Green price color and calm KAMA colors.
Unsustainable moves are usually marked by more extreme colors of price bars and KAMA. Red usually means price is unsustainably distanced from the KAMA, while deep Blue usually means price is undesirably close to the KAMA, foreshadowing a directional distancing.
Usually Teal color of price bars and KAMA foreshadow a change of sentiment of the outside Heatmap sentiment channel.
Red color of the outside channel always signals the direction of the desired sentimental movement, while Blue signals the extent at which the counter-element suffers. Thus, one side being Green, while the other is Blue, often means the Blue will soon evolve into a warmer color, attracting price in that direction. Outside Heatmap channel is entirely based on a modified DI.
Oscillator Chart
An example of Chart Diagnosis using the Oscillator and other elements of the G.O.A.T. Scalper:
First (far left), a Resistance is plotted. This coincides with price bars being Red (distressed state). The thin colorful Oscillator line takes an Up-turn, signifying a period of price moving away from its Quadratic Kernel Regression (pink moving average).
After Price cools down to Green sustainable colors, a Support is plotted. During this time, the thin colorful line is falling down, signifying a period when the distance between price action and its quadratic kernel regression average is decreasing.
During this phase, the thin purple Oscillator line goes up. This signifies the slope of the price regression is restoring to the upside.
Next, the thin colorful line starts going up again, signifying another period of price getting further away from its regression average. This time to the upside.
Resistance is being broken and new support is established. At this point, the thin colorful line starts falling again, signifying distance between price and its regression MA is shortening. This is clearly visible as a sideways consolidation (with a slight tilt up of slope).
A moment comes when all lines - the price and KAMA lines, and price and KAMA regression slopes, all point down. A new down period is clearly starting. This is further indicated by Teal price bars and new Resistance forming. Notice how the external heatmap channel goes into more balanced Green colors with trend enthusiasm calming down.
This analysis may appear to be overwhelming and confusing at first, as these metrics are unorthodox and unpopular. But different aspects of the indicator can be toggled ON/OFF to single them out, which makes observations much simpler for new users. After some time spent discovering personal patterns, or reviewing other users' catalogues with already published pattern libraries, it soon becomes easy to read charts in this new way.
Bollinger Bands
Bollinger Bands provide another way to produce patterns that give users specific chart information.
One noteworthy indication is when the price and KAMA Bollinger Bands separate their value zones. Since the zones of these Bands are based on the kernel regression values of the respective sources, their separation is significant and too often means violent reversals or violent continuations (which usually can be judged using the other metrics the System provides, or additional indicators of choice).
Another noteworthy Bollinger Band pattern is when price action leaves a prolonged trending move.
First phase of the end of a prolonged trending move is the BB zones expanding and doing a significant overlap.
Second stage is price getting reaccepted in the Price BB. This however doesn't mean reacceptance in the KAMA BB and if the moment isn't right, usually leads to bounces and continuations.
The KAMA needs to "make space" for price to get reaccepted into the KAMA BB. While the KAMA is outside its BB or very near to its wall, price reacceptance into it is not very probable. When KAMA withdraws from its BB wall, opening an "entrance on its membrane", that's when price is eligible to get reaccepted into the KAMA BB. That's usually the moment the long awaited consolidation starts and a long trending move is over.
Users of the G.O.A.T. Scalper Diagnostics can discover many more patterns and correlations between patterns within the System. But the System itself can multiply all possible patterns when inspected in the context of additional indicators, leading to vast possibilities of signal and pattern discovery with huge potential.
A very good idea would probably be to use the G.O.A.T. Diagnostics together with the Ichimoku.
Ichimoku has always been famous for its genius simplicity and elegant profoundness, but notorious for its total lack of accuracy, as well as general uselessness on lower timeframes. The G.O.A.T. System has the potential to enhance all of Ichimoku's strengths and cure its weaknesses.
Yet another good idea may be to pair it with kindred indicators, like the Gaussian Channel, which has a stunning performance, but suffers from too high level of generalization. The Diagnostics can provide the intricate texture of price manoeuvres the Gaussian Channel fails to register, while the GC can give the Scalper even more solid context for its patterns.
The worthwhile possibilities seem endless...
Entry Table
I've added a little Entry Table at the bottom right corner. It's designed to potentially help scalpers trade faster, and to visualize a potential trade they're thinking about before they execute it. A Stop Loss is visually plotted in real time to better visualize it's placement in the chart context.
It encourages responsible risk management in its settings:
The user enters the amount of their trading portfolio;
Then specify the percentage of their portfolio they're willing to risk at every trade;
After that the user can chose to specify a flat percentage Stop Loss.
The table will calculate the size of the entry of a market order, so the user only risks the specified percentage of their portfolio should the specified Stop Loss level is hit.
There's also the option to use automatically suggested Stop Loss, based on recent volatility. The actual Stop Loss is calculated 20% away from the actual volatility level, to better protect from unforeseen wicks.
In the current example, the user with a $1000 trading portfolio has to do a $1000 entry to lose 1% of their portfolio ($10) at a 1% Stop Loss.
But the user has to do a $2,525 entry in order to lose 1% of their portfolio (%10) at a much closer Stop Loss which is less than 1%, based on recent volatility.
The Entry Table should be considered as a cosmetic convenience and not a dedicated risk management tool.
CONCLUSION:
The G.O.A.T. Scalper Diagnostics is an indicator System, based on popular, but modified and tweaked versions of indicators like the ADX and DI, Stochastic, Bollinger Bands and MAs. It also leverages the remarkable work of inspired creators: JDehorty's Quadratic Kernel Regression library, and The_Caretaker's PMARP .
The G.O.A.T. Scalper Diagnostics indicator system enables users to discover so-called new "indicator-pattern alphabets", reading price charts in new and unorthodox ways, thus gaining an edge over the majority of market participants they trade against.
The high degree of freedom when discovering new patterns, either within the System itself or correlating its output to external auxiliary indicators, highlights the System's potential for original discoveries leading to highly personalized trading strategies. Exchanging information about personal pattern libraries can potentially also give birth to new private trading communities.
스크립트에서 "adx"에 대해 찾기

Session MasterSession Master Indicator
Overview
The "Session Master" indicator is a unique tool designed to enhance trading decisions by providing visual cues and relevant information during the critical last 15 minutes of a trading session. It also integrates advanced trend analysis using the Average Directional Index (ADX) and Directional Movement Index (DI) to offer insights into market trends and potential entry/exit points.
Originality and Functionality
This script combines session timing, visual alerts, and trend analysis in a cohesive manner to give traders a comprehensive view of market behavior as the trading day concludes. Here’s a breakdown of its key features:
Last 15 Minutes Highlight : The script identifies the last 15 minutes of the trading session and highlights this period with a semi-transparent blue background, helping traders focus on end-of-day price movements.
Previous Session High and Low : The script dynamically plots the high and low of the previous trading session. These levels are crucial for identifying support and resistance and are highlighted with dashed lines and labeled for easy identification during the last 15 minutes of the current session.
Directional Movement and Trend Analysis : Using a combination of ADX and DI, the script calculates and plots trend strength and direction. A 21-period Exponential Moving Average (EMA) is plotted with color coding (green for bullish and red for bearish) based on the DI difference, offering clear visual cues about the market trend.
Technical Explanation
Last 15 Minutes Highlight:
The script checks the current time and compares it to the session’s last 15 minutes.
If within this period, the background color is changed to a semi-transparent blue to alert the trader.
Previous Session High and Low:
The script retrieves the high and low of the previous daily session.
During the last 15 minutes of the session, these levels are plotted as dashed lines and labeled appropriately.
ADX and DI Calculation:
The script calculates the True Range, Directional Movement (both positive and negative), and smoothes these values over a specified length (28 periods by default).
It then computes the Directional Indicators (DI+ and DI-) and the ADX to gauge trend strength.
The 21-period EMA is plotted with dynamic color changes based on the DI difference to indicate trend direction.
How to Use
Highlight Key Moments: Use the blue background highlight to concentrate on market movements in the critical last 15 minutes of the trading session.
Identify Key Levels: Pay attention to the plotted high and low of the previous session as they often act as significant support and resistance levels.
Assess Trend Strength: Use the ADX and DI values to understand the strength and direction of the market trend, aiding in making informed trading decisions.
EMA for Entry/Exit: Use the color-coded 21-period EMA for potential entry and exit signals based on the trend direction indicated by the DI.
Conclusion
The "Session Master" indicator is a powerful tool designed to help traders make informed decisions during the crucial end-of-session period. By combining session timing, previous session levels, and advanced trend analysis, it provides a comprehensive overview that is both informative and actionable. This script is particularly useful for intraday traders looking to optimize their strategies around session close times.

CryptoGraph Entry BuilderA complete system to generate buy & sell signals, based on multiple indicators, timeframes and assets
═════════════════════════════════════════════════════════════════════════
🟣 How it works
This indicator allows you to create buy & sell signals, based on multiple trigger conditions, placed in one easy to use TradingView indicator to produce alerts, backtest, reduce risk and increase profitability. This script is especially designed to be used with the CryptoGraph Strategizer indicator. Signals produced by this indicator, can be used as external input with the CryptoGraph Strategizer, by adding both indicators to your chart and selecting "External Input" as entry source in the inputs of the Strategizer indicator. From that point on, buy & sell signals generated by the Entry Builder, will be used for backtesting.
Each trigger or filtering condition is selectable and able to be combined using the selection boxes.
Trigger or filter conditions can be used on a different timeframes, and with different assets or coin pairs. Make sure to set higher timeframe filters, to a higher timeframe than your chart timeframe.
🟣 How to use
• Add the indicator to your chart
• Select an indicator you woud like to use for entry analysis. Combine more indicators for more entry filtering
• Configure entry conditions per indicator. It is recommended to add and configure one indicator at a time
• Analyse your buy/sell entries
• Connect to CryptoGraph Strategizer as external input source for backtesting purposes
🟣 Indicator Filters
• ATR :
Average True Range (ATR) is a tool used in technical analysis to measure volatility .
Possible options for ATR entry filtering are an ATR value greater/smaller than your input variable for trade entries, or the ATR crossing your input variable for trade entries.
This enables the possibility to only enter positions when the market has a certain degree of volatility .
• ADX :
The Average Directional Index ( ADX ) helps traders determine the strength of a trend, not its actual direction. It can be used to find out whether the
market is ranging or starting a new trend.
Possible options for ADX entry filtering are an ADX value greater/smaller than your input variable for trade entries, or the ADX crossing your input variable for trade entries.
• OBV :
The On Balance Volume indicator (OBV) is used in technical analysis to measure buying and selling pressure. It is a cumulative indicator meaning that on days where price went up, that day's volume is added to the cumulative OBV total.
Possible options for OBV entry filtering are Regular, Hidden or Regular&Hidden divergences. Divergence is when the price of an asset is moving in the opposite direction of a technical indicator, such as an oscillator, or is moving contrary to other data. Divergence warns that the current price trend may be weakening, and in some cases may lead to the price changing direction.
• Moving Average :
Moving Average (MA) is a price based, lagging (or reactive) indicator that displays the average price of a security over a set period of time. A Moving Average is a good way to gauge momentum as well as to confirm trends, and define areas of support and resistance .
Possible options for MA entry filtering are price being above/below Moving Average 1, price crossing up/down Moving Average 1, Moving Average 1 being above/below Moving Average 2 and Moving Average 1 crossing up/down Moving Average 2.
• Supertrend :
Supertrend (ST) is a trend-following indicator based on Average True Range (ATR). The calculation of its single line combines trend detection and volatility . It can be used to detect changes in trend direction and to position stops.
Possible options for ST entry filtering are Supertrend being in upward/downward direction, or Supertrend changing direction.
• RSI :
The Relative Strength Index ( RSI ) is a well versed momentum based oscillator which is used to measure the speed (velocity) as well as the change (magnitude) of directional price movements.
Possible options for RSI entry filtering are RSI being smaller/greater than your input value, or RSI crossing up/down your input value.
• Stochastic RSI :
The Stochastic RSI indicator ( Stoch RSI ) is essentially an indicator of an indicator. It is used in technical analysis to provide a stochastic calculation to the RSI indicator. This means that it is a measure of RSI relative to its own high/low range over a user defined period of time.
Possible options for Stoch RSI entry filtering are Stoch RSI crossing below or above your input value.
• VWAP Bands :
Volume Weighted Average Price ( VWAP ) is a technical analysis tool used to measure the average price weighted by volume . VWAP is typically used with intraday charts as a way to determine the general direction of intraday prices.
We use standard deviations, determined by user input, to create VWAP bands.
Possible options for VWAP long entry filtering are: price being below the lower VWAP band, price crossing back up the lower VWAP band or price crossing down the lower VWAP band.
Possible options for VWAP short entry filtering are: price being above the upper VWAP band, price crossing back down the upper VWAP band, or price crossing up the upper VWAP band.
• Bollinger Bands :
Bollinger Bands (BB) are a widely popular technical analysis instrument created by John Bollinger in the early 1980’s. Bollinger Bands consist of a band of three lines which are plotted in relation to security prices. The line in the middle is usually a Simple Moving Average ( SMA ) set to a period of 20 days (the type of trend line and period can be changed by the trader; however a 20 day moving average is by far the most popular).
Possible options for BB long entry filtering are: price being below the lower Bollinger band , price crossing back up the lower Bollinger band or price crossing down the lower Bollinger band .
Possible options for BB short entry filtering are: price being above the upper Bollinger band , price crossing back down the upper Bollinger band , or price crossing up the upper Bollinger band .
• WaveTrend :
WaveTrend (WT) is a smoothed momentum oscillator which enables it to detect true reversals in an accurate manner.
Possible options for WT entry filtering are: Green/red dots below or above a certain WaveTrend value, Regular Divergence, Hidden Divergence and Regular&Hidden Divergence.

Squeeze Momentum Indicator + 2.0This is a squeeze momentum oscillator with ADX-RSI, Elliot waves oscillator, HMA background and more.
I recommend configure ADX-RSI with the following settings:
-ADX Length = 14
-ADX smooth = 14
-RSI Length = 14
-Threshold = 15
-Upline = 70
-Downline = 30
Thanks to OskarGallard for develop this indicator.
I am Sc4lp1ng, the developer of EMA MTF cloud and TSI-ADX Histogram.
Adaptive Average Vortex Index [lastguru]As a longtime fan of ADX, looking at Vortex Indicator I often wondered, where is the third line. I have rarely seen that anybody is calculating it. So, here it is: Average Vortex Index - an ADX calculated from Vortex Indicator. I interpret it similarly to the ADX indicator: higher values show stronger trend. If you discover other interpretation or have suggestions, comments are welcome.
Both VI+ and VI- lines are also drawn. As I use adaptive length calculation in my other scripts (based on the libraries I've developed and published), I have also included the possibility to have an adaptive length here, so if you hate the idea of calculating ADX from VI, you can disable that line and just look at the adaptive Vortex Indicator.
Note that as with all my oscillators, all the lines here are renormalized to -1..1 range unlike the original Vortex Indicator computation. To do that for VI+ and VI- lines, I subtract 1 from their values. It does not change the shape or the amplitude of the lines.
Adaptation algorithms are roughly subdivided in two categories: classic Length Adaptations and Cycle Estimators (they are also implemented in separate libraries), all are selected in Adaptation dropdown. Length Adaptation used in the Adaptive Moving Averages and the Adaptive Oscillators try to follow price movements and accelerate/decelerate accordingly (usually quite rapidly with a huge range). Cycle Estimators, on the other hand, try to measure the cycle period of the current market, which does not reflect price movement or the rate of change (the rate of change may also differ depending on the cycle phase, but the cycle period itself usually changes slowly).
VIDYA - based on VIDYA algorithm. The period oscillates from the Lower Bound up (slow)
VIDYA-RS - based on Vitali Apirine's modification of VIDYA algorithm (he calls it Relative Strength Moving Average). The period oscillates from the Upper Bound down (fast)
Kaufman Efficiency Scaling - based on Efficiency Ratio calculation originally used in KAMA
Fractal Adaptation - based on FRAMA by John F. Ehlers
MESA MAMA Cycle - based on MESA Adaptive Moving Average by John F. Ehlers
Pearson Autocorrelation* - based on Pearson Autocorrelation Periodogram by John F. Ehlers
DFT Cycle* - based on Discrete Fourier Transform Spectrum estimator by John F. Ehlers
Phase Accumulation* - based on Dominant Cycle from Phase Accumulation by John F. Ehlers
Length Adaptation usually take two parameters: Bound From (lower bound) and To (upper bound). These are the limits for Adaptation values. Note that the Cycle Estimators marked with asterisks(*) are very computationally intensive, so the bounds should not be set much higher than 50, otherwise you may receive a timeout error (also, it does not seem to be a useful thing to do, but you may correct me if I'm wrong).
The Cycle Estimators marked with asterisks(*) also have 3 checkboxes: HP (Highpass Filter), SS (Super Smoother) and HW (Hann Window). These enable or disable their internal prefilters, which are recommended by their author - John F. Ehlers . I do not know, which combination works best, so you can experiment.
If no Adaptation is selected ( None option), you can set Length directly. If an Adaptation is selected, then Cycle multiplier can be set.
The oscillator also has the option to configure the internal smoothing function with Window setting. By default, RMA is used (like in ADX calculation). Fast Default option is using half the length for smoothing. Triangle , Hamming and Hann Window algorithms are some better smoothers suggested by John F. Ehlers.
After the oscillator a Moving Average can be applied. The following Moving Averages are included: SMA , RMA, EMA , HMA , VWMA , 2-pole Super Smoother, 3-pole Super Smoother, Filt11, Triangle Window, Hamming Window, Hann Window, Lowpass, DSSS.
Postfilter options are applied last:
Stochastic - Stochastic
Super Smooth Stochastic - Super Smooth Stochastic (part of MESA Stochastic ) by John F. Ehlers
Inverse Fisher Transform - Inverse Fisher Transform
Noise Elimination Technology - a simplified Kendall correlation algorithm "Noise Elimination Technology" by John F. Ehlers
Momentum - momentum (derivative)
Except for Inverse Fisher Transform , all Postfilter algorithms can have Length parameter. If it is not specified (set to 0), then the calculated Slow MA Length is used. If Filter/MA Length is less than 2 or Postfilter Length is less than 1, they are calculated as a multiplier of the calculated oscillator length.
More information on the algorithms is given in the code for the libraries used. I am also very grateful to other TradingView community members (they are also mentioned in the library code) without whom this script would not have been possible.

Mawreez' Trend OscillatorA positive reading indicates an uptrend, a negative reading indicates a downtrend. For an uptrend, increasing values indicate that the trend is sustaining or strengthening while decreasing values indicate that the trend is stagnating or weakening. Vice versa for a downtrend. When the indicator reads 0, the price is not trending.
This indicator is based on the existing DMI indicator, but familiarity with the DMI is not required. The author's goal was to make a less laggy, more intuitively interpretable indicator compared to the DMI.
A comparison to the DMI is given above. The reader may see for themselves that trends are recognized quicker. A technical rundown of adjustments made to the DMI is given below.
Instead of interpreting the ADX, a sensitivity setting is added and its default value is 25. The value of this sensitivity setting is subtracted from the ADX. Then, any ADX values which fell below 0 are set to 0. Now, just flip the value of the ADX when the -DI is greater than the +DI. The result is then plotted as a histogram.
In addition, this indicator has less lag between price action and trend recognition. This is achieved by removing the EMA applied to the ADX, and instead applying lag-free smoothing to +DI and -DI before computing the ADX and then once more applying lag-free smoothing to the result of the computation.

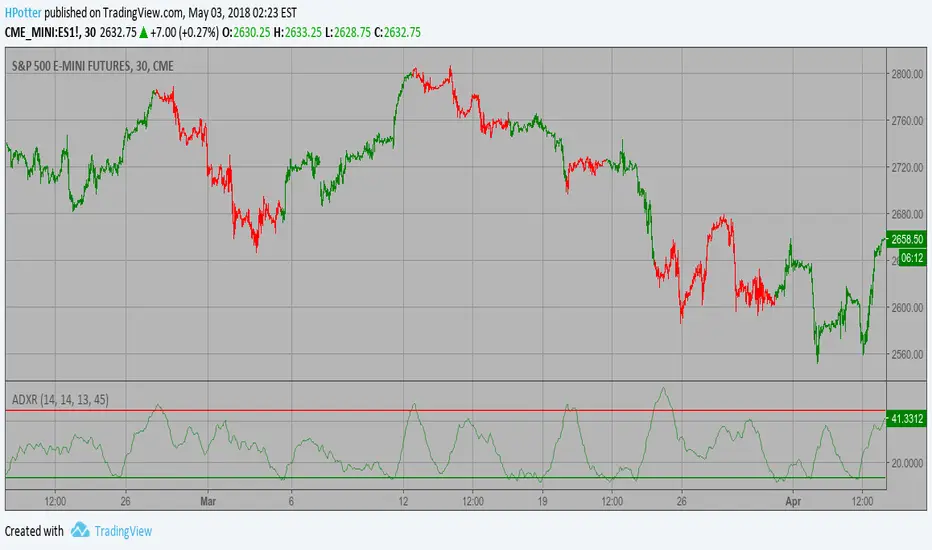
Average Directional Movement Index Rating Strategy The Average Directional Movement Index Rating (ADXR) measures the strength
of the Average Directional Movement Index (ADX). It's calculated by taking
the average of the current ADX and the ADX from one time period before
(time periods can vary, but the most typical period used is 14 days).
Like the ADX, the ADXR ranges from values of 0 to 100 and reflects strengthening
and weakening trends. However, because it represents an average of ADX, values
don't fluctuate as dramatically and some analysts believe the indicator helps
better display trends in volatile markets.
WARNING:
- This script to change bars colors.
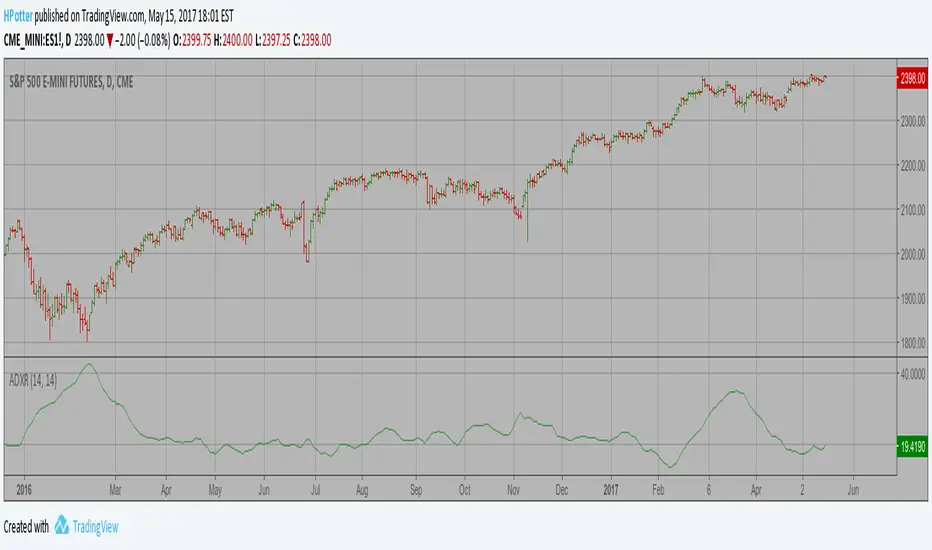
Average Directional Movement Index Rating The Average Directional Movement Index Rating (ADXR) measures the strength
of the Average Directional Movement Index (ADX). It's calculated by taking
the average of the current ADX and the ADX from one time period before
(time periods can vary, but the most typical period used is 14 days).
Like the ADX, the ADXR ranges from values of 0 to 100 and reflects strengthening
and weakening trends. However, because it represents an average of ADX, values
don't fluctuate as dramatically and some analysts believe the indicator helps
better display trends in volatile markets.
Wisenode QuantThis indicator uses a combination of DMI, ADX and ATR% to give quick easy visual representation of trend strength, trend direction and price action volatility.
This helps to quickly visually identify market environment for trade execution using quantifiable data.
Direction
Red LED = Bearish Market conditions
Green LED = Bullish Market conditions
Trend (Strength)
Red = 0-20 on the ADX (Ranging)
Green = 20-30 on the ADX (Emerging)
Green = 30-50 on the ADX (Momentum)
Volatility
Uses ATR% on a dynamic scale from top to bottom is low to high intensity. Colour will transition from green to red as the bar moves higher.
Trade Execution
Integration of a custom Murray math values to build entry, stop loss protection and take profit zones.
This is still a working progress to fine tune default settings but can be used for market environment identification for any sort of discretionary trading

Malama's Quantum FusionOverview
Malama's Quantum Fusion is an advanced, unified trading indicator that builds upon and significantly extends the core concepts from "Malama's Quantum Swing Modulator" (MQSM). It intelligently fuses swing-based probability zones with a full reversal signal engine, multi-layered trend confirmation, regime detection, and optional multi-timeframe (MTF) alignment. Signals are generated only when multiple independent systems converge, resulting in higher-conviction setups with reduced false signals in ranging or choppy conditions.
The system combines:
Probability Zones — Swing pivots, ATR uncertainty bands, and weighted scoring from oscillators (RSI, MFI), volume, price deviation, and regime-adjusted momentum.
Reversal Signal Engine — Precise candle pattern detection requiring alignment with EMA structure and a dual Supertrend cloud, plus customizable filters.
Final qualified signals demand strict confluence: reversal pattern + high-probability zone proximity (optional) + trend cloud + filters + optional MTF trend confirmation.
Key Features
Uncertainty Zones: ATR-shaded bands around a central EMA wave for market context.
Trend Cloud: Dual Supertrend (fast/slow) fill visualizing bullish/bearish/mixed states.
Dynamic S/R Lines: Auto-drawn from EMA crosses, extending forward until price invalidation (close beyond level).
Comprehensive Dashboard: On-chart table displaying regime (Trending/Ranging/Choppy via ADX/DMI), cloud status, detailed support/resistance analysis (price, probability %, confidence %, action), MTF status, RSI/MFI, volume spike, ATR, and current signal.
Visual Signals: Diamond labels (◆ BUY / ◆ SELL), bar coloring, dynamic stop-loss lines (candle extremes), and 2:1 risk-reward target lines.
Multiple Alerts: For qualified/raw signals, high-probability zones, regime shifts, and cloud flips.
Differences from Malama's Quantum Swing Modulator (MQSM)
MQF incorporates the foundational probability zone and superposition scoring logic from MQSM but evolves it into a complete trading system:
Signal Generation: MQSM focuses solely on zone analysis and probability scoring (no actual BUY/SELL signals). MQF adds a dedicated reversal engine with candle patterns, strict filters (volume spike, ADX chop avoidance, max candle range), and requires zone alignment for signals.
Trend & Structure Enhancements: Adds fast/slow EMA structure, dual Supertrend cloud for visual trend bias, dynamic extending S/R lines from EMA crosses, and optional MTF Supertrend/ADX confirmation.
Expanded Dashboard: MQSM's table is simpler (support/resistance levels with prob/confidence/action). MQF's unified dashboard includes regime, cloud, MTF, oscillators, volume, ATR, and live signal status.
Additional Filters & Regime Handling: More granular ADX thresholds (trend/chop), volume spike integration into confidence scoring, and cloud alignment bonuses.
Visual & Risk Aids: MQF provides signal labels, bar colors, SL/target lines, and pivot plotting options not present in MQSM.
In essence, MQSM provides contextual zone analysis for manual decision-making, while MQF delivers automated, confluence-based entry signals with richer visuals and risk guides.
How to Use
Context First: Monitor regime, cloud, and zone probabilities to avoid low-quality environments.
Zone Setup: Look for price nearing high-probability support/resistance (ideally >60–75%).
Signal Execution: Wait for qualified ◆ BUY/SELL diamonds—only fired on full alignment. Use plotted SL and 2:1 targets as starting points.
Customization: Tune filters (e.g., enable MTF for higher timeframes, adjust zone probability threshold) to suit scalping, intraday, or swing trading.
Best on 15m–4H timeframes across stocks, forex, crypto, or futures.
Disclaimer
This indicator is for educational and informational purposes only. It is not financial advice. Past performance does not guarantee future results. Always use proper risk management and combine with your own analysis. Trading involves substantial risk of loss.

mama special indcator Below is a faithful English translation, preserving the structure and intent of the original text.
---
# Mom’s Dedicated Indicator – User Manual 📈
## What Does This Indicator Do?
This indicator helps you see **whether the current direction is up or down**, and reminds you when it may be appropriate to buy or sell.
In simple terms:
* When you see a **green “Long”** label → you may consider buying (going long)
* When you see a **red “Short”** label → you may consider selling (going short)
* The top-right corner shows whether the market is currently **Bullish**, **Bearish**, or **Ranging**
---
## What Do the Things on the Screen Mean?
### The Colored Lines (Moving Averages)
| Line Color | Name | Meaning |
| ----------------- | -------------------- | ---------------------------------------------- |
| Lightest blue | Ultra-fast line (13) | Reacts the fastest, but also whipsaws the most |
| Light blue | Fast line (21) | Short-term direction |
| Medium blue | Mid line (55) | Medium-term direction |
| Dark blue (thick) | Slow line (89) | More stable direction |
| Gold (thickest) | Baseline (200) | Major trend, the most important one |
**Simple way to judge:**
* Price **above** the gold line → overall trend is bullish
* Price **below** the gold line → overall trend is bearish
### The Small Box in the Top-Right Corner
* **Current Direction**: Tells you whether the market is bullish, bearish, or ranging
* **Strength**:
* ✓ means the trend is strong enough
* ✗ means the momentum is insufficient
---
## How Should I Adjust the Settings?
In the indicator settings (click the gear ⚙️ next to the indicator name), you will see the following options:
### 1. Crossover Combinations (Sensitivity Selection)
| Option | Number of Signals | Suitable For |
| ------------------------ | ----------------- | --------------------------------------------- |
| Ultra Aggressive (13/21) | Most | Want many alerts, not afraid of false signals |
| Very Aggressive (13/55) | Very many | More active traders |
| Aggressive (13/89) | Many | Want more opportunities |
| Standard Fast (21/55) | Medium-high | Balanced but slightly aggressive |
| **Standard (21/89)** | **Medium** | **Recommended – best balance** |
| Conservative (55/89) | Few | Only want the most reliable signals |
**Mom’s recommendation:** Start with **Standard (21/89)**. Try other options after you are familiar with it.
### 2. Only Signal in the Direction of the Trend
* **On (recommended):** Signals appear only when aligned with the major trend
* **Off:** Signals appear regardless of trend (higher risk)
### 3. Use ADX to Filter Ranging Markets
* **On (recommended):** Shows “Ranging” when the market lacks momentum, avoiding random trades
* **Off:** Signals appear regardless of market strength
### 4. ADX Threshold
* Higher number = stricter requirements
* **Recommended: 20** (default)
* If you feel there are too few signals, lower it to 15
* If you feel there are too many false signals, raise it to 25
### 5. Show Auxiliary Lines
* On: Displays the colored moving average lines
* Off: Cleaner chart, signals only
### 6. Show Direction Indicator
* On: Displays the direction box in the top-right corner
* Off: Does not display it
---
## How Do I Use This Indicator?
### Step 1: Check the Major Trend
Look at the top-right box:
* **Bullish** + strength ✓ → look for buying opportunities
* **Bearish** + strength ✓ → look for selling opportunities
* **Ranging** → **do nothing and wait**
### Step 2: Wait for a Signal
* Green “Long” → you may consider buying
* Red “Short” → you may consider selling
### Step 3: Confirm the Timeframe
* If you see a yellow warning: **“⚠️ Please use 1-hour chart or above”**
* It means your current timeframe is too short (e.g., 5-minute or 15-minute)
* **Switch to 1-hour, 4-hour, or daily charts**
---
## Important Reminders ⚠️
### What This Indicator Does *Not* Tell You:
1. **When to exit** — It only helps with entries; exits are your own decision
2. **How much to buy** — Decide based on your own risk tolerance
3. **Guaranteed profits** — No indicator can guarantee profitability
### Safe Trading Guidelines:
1. **Do not all-in** — Use only a small portion of your capital each time
2. **Set a stop loss** — Decide in advance how much loss you can accept
3. **Do not force trades in ranging markets** — If it says “Ranging,” rest
4. **Do not chase highs or sell lows** — If price has already moved too far, skip it
5. **Use higher timeframes** — 1-hour, 4-hour, or daily charts are more stable
### The Most Important Sentence:
> **“Better to miss a trade than to make a wrong one.”**
>
> When you are not confident, doing nothing is the best choice.
---
## Quick Reference Card
| What I See | What I Should Do |
| -------------------------- | ------------------------------ |
| “Bullish” + ✓ in top-right | Look for buying opportunities |
| “Bearish” + ✓ in top-right | Look for selling opportunities |
| “Ranging” in top-right | Do nothing, wait |
| Green “Long” label | Consider buying |
| Red “Short” label | Consider selling |
| Yellow warning label | Switch to a higher timeframe |
| Strength shows ✗ | Trend is weak, be cautious |
---
## Have Questions?
This indicator was designed specifically for you. If anything is unclear, or if you want to adjust any features, just let me know anytime.
❤️ Wishing Mom smooth investing and steady profits!
媽媽專用指標 使用說明書 📈
這個指標是做什麼的?
這個指標會幫妳看「現在的方向是往上還是往下」,然後在適合的時候提醒妳可以買或賣。
簡單來說:
看到 綠色「多」 的標籤 → 可以考慮買進(做多)
看到 紅色「空」 的標籤 → 可以考慮賣出(做空)
右上角會顯示目前是「看漲」、「看跌」還是「震盪」
畫面上的東西是什麼意思?
那些彩色的線(均線)
線的顏色
名稱
意思
最淺的藍色
超快線 (13)
反應最快,但也最容易亂跳
淺藍色
快線 (21)
短期方向
中藍色
中線 (55)
中期方向
深藍色(粗)
慢線 (89)
比較穩定的方向
金色(最粗)
基準線 (200)
大方向,最重要!
簡單判斷法:
價格在金色線「上面」→ 大方向是漲的
價格在金色線「下面」→ 大方向是跌的
右上角的小框框
目前方向:告訴妳現在是看漲、看跌、還是震盪
強度:後面有 ✓ 表示趨勢夠強,有 ✗ 表示力道不夠
設定選項怎麼調?
在指標設定裡面(點指標名稱旁邊的齒輪 ⚙️),有這些選項:
1. 交叉組合(選擇敏感度)
選項
信號多寡
適合誰
超激進 (13/21)
最多
想要很多提示,不怕假信號
很激進 (13/55)
很多
比較積極的操作
激進 (13/89)
多
想多一點機會
標準偏快 (21/55)
中等偏多
想要平衡但稍微積極
標準 (21/89)
中等
建議用這個,最平衡
保守 (55/89)
少
只想要最可靠的信號
媽媽建議: 先用「標準 (21/89)」就好,等熟悉了再試其他的。
2. 順著方向才給信號
打開(建議):只有大方向對的時候才會提示
關掉:不管方向都會提示(比較危險)
3. 用ADX過濾震盪
打開(建議):市場沒力氣的時候會顯示「震盪」,避免亂買賣
關掉:不管市場有沒有力氣都會給信號
4. ADX門檻
數字越大,要求越嚴格
建議用 20(預設值)
如果覺得信號太少,可以降到 15
如果覺得假信號太多,可以升到 25
5. 顯示輔助線
打開:會看到那些彩色的線
關掉:畫面比較乾淨,只看信號
6. 顯示方向提示
打開:右上角會有小框框顯示方向
關掉:不顯示
怎麼用這個指標?
步驟一:先看大方向
看右上角的框框:
顯示「看漲」+ 強度有 ✓ → 適合找機會買
顯示「看跌」+ 強度有 ✓ → 適合找機會賣
顯示「震盪」→ 先不要動,等待就好
步驟二:等信號出現
看到綠色「多」→ 可以考慮買進
看到紅色「空」→ 可以考慮賣出
步驟三:確認時間週期
畫面上如果出現黃色警告「⚠️ 請用1小時圖或以上」
表示妳現在看的時間太短了(例如5分鐘、15分鐘)
請切換到1小時或4小時或日線圖
重要提醒 ⚠️
這個指標「不會」告訴妳的事情:
什麼時候該出場 — 指標只告訴妳進場時機,出場要自己決定
該買多少 — 請根據自己能承受的風險決定
一定會賺錢 — 沒有任何指標能保證獲利
安全操作建議:
不要all-in — 每次只用一小部分資金
設停損 — 買進之後,決定好「跌到多少就認賠」
震盪時不要硬做 — 右上角顯示震盪就休息
不要追高殺低 — 信號出現後如果價格已經跑很遠,就算了
用大一點的時間週期 — 1小時、4小時、日線比較穩
最重要的一句話:
「寧可錯過,不要做錯」
沒把握的時候,不做就是最好的選擇。
快速參考卡
我看到...
我應該...
右上角「看漲」+ ✓
可以找機會買
右上角「看跌」+ ✓
可以找機會賣
右上角「震盪」
不要動,等待
綠色「多」標籤
可以買進
紅色「空」標籤
可以賣出
黃色警告標籤
換到更大的時間週期
強度後面是 ✗
趨勢不夠強,要小心
如果有問題?
這個指標是專門為妳設計的,如果有看不懂的地方,或是想要調整什麼功能,隨時跟我說!
❤️ 祝媽媽投資順利,穩穩賺錢!

BALANCED Strategy: Intraday Pro + Smart DashboardWelcome to the BALANCED Strategy: Intraday Pro.
This all-in-one indicator is designed for Intraday traders looking to capture trend movements while effectively filtering out sideways market noise. It combines the power of Supertrend for direction, EMA 100 for the baseline trend, and rigorous validation via RSI and ADX.
The script also integrates a complete Risk Management system with targets based on the Golden Ratio (Fibonacci) and a real-time Dashboard.
⏳ Recommended Timeframes
This algorithm is optimized for Intraday volatility:
M5 (5 Minutes) ⭐️: Ideal for quick Scalping. The ADX filter is crucial here to avoid false signals.
M15 (15 Minutes) 🏆: The "Sweet Spot." It offers the best balance between signal frequency and trend reliability.
M30 / H1: For a "Swing Intraday" approach—calmer, fewer signals, but higher precision.
Not recommended for M1 (1 Minute) with default settings (too much noise).
🚀 How It Works
The algorithm follows a strict 3-step logic to generate high-quality signals:
1. Trend Identification (The Engine)
Supertrend: Determines the immediate direction.
EMA 100: Acts as a background trend filter. We only buy above and sell below the EMA.
2. Noise Filtering (Safety)
ADX (Average Directional Index): The signal is only validated if there is sufficient volatility (Configurable threshold, default 12) to avoid "chop markets" (flat markets).
RSI (Relative Strength Index): Strict momentum filter. Buy only if RSI > 50, Sell if RSI < 50.
3. Entry Confirmation (The Trigger)
The script doesn't just rely on a crossover. It waits for "Price Action" confirmation: the candle must close higher than the previous one (for Long) or lower (for Short) to validate the entry.
🛡️ Risk Management (Money Management)
This is the core strength of this tool. Upon signal validation, the script automatically calculates and plots:
Stop Loss (SL): Based on volatility (ATR). It places the stop at the recent Low/High with a safety padding.
Take Profit (TP): Two modes available:
Fibonacci Mode (Default): Targets the 1.618 extension (Golden Ratio) of the risk taken.
Fixed Ratio Mode: Targets a manual Risk/Reward ratio (e.g., 2.0).
📊 The Dashboard
Located at the bottom right, the smart dashboard provides vital info at a glance:
Signal Time: To check if the alert is fresh.
Type (LONG/SHORT): Color-coded (Green/Pink).
Tech Data: RSI and ADX values at the moment of the signal.
Exact Prices: Entry Level, Target (TP), and Stop Loss (SL).
⚙️ Configurable Settings
Sensitivity: Adjust the Supertrend factor (Default 2.0).
Filters: Toggle the RSI filter ON/OFF or adjust the ADX threshold.
Execution: Choose between Fibonacci Target (1.618) or a Manual Ratio.
⚠️ Disclaimer: This tool is a technical decision aid and does not constitute financial investment advice. Always use prudent risk management and backtest the indicator on your preferred assets before live use.

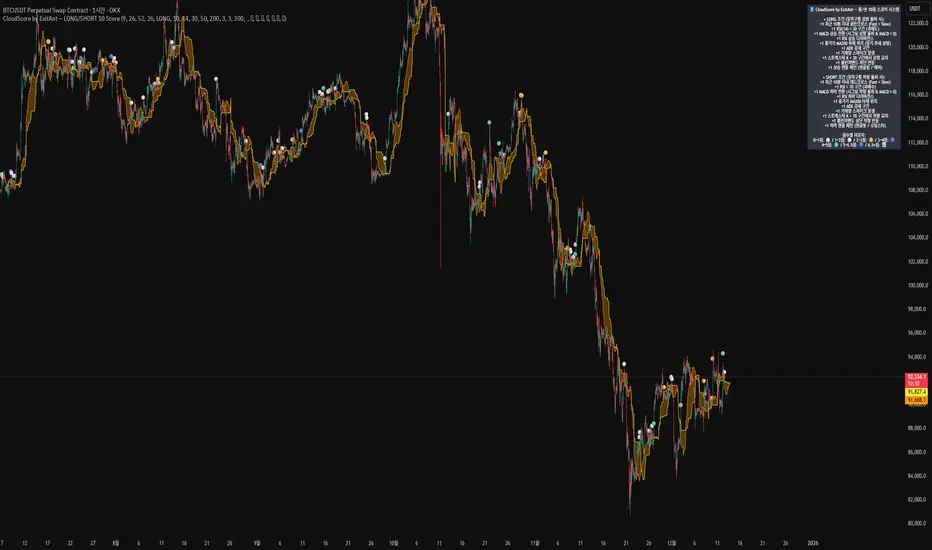
CloudScore by ExitAnt [Upgrade]📘 CloudScore PRO by ExitAnt (v13)
CloudScore PRO는 일목균형표(REAL Ichimoku Cloud)의 ‘진짜 상방 돌파’만을 감지하고,
여기에 총 10가지 추세·모멘텀·패턴·거래량 요소를 점수화하여 (0~9점)
현재 추세 전환의 강도를 직관적으로 알려주는 고급 추세 분석 지표입니다.
일목 구름은 본래 강력한 추세 전환 신호를 제공하지만
“위→안→위” 또는 “부분 돌파” 같은 왜곡 신호가 매우 많습니다.
v13은 이를 완전히 제거하고,
오직 아래→안→위 또는 아래→위(직통) 형태의 ‘진짜 돌파’에서만 점수를 계산합니다.
🎯 지표 목적
* 진짜 일목구름 돌파만 필터링하여 신뢰도 상승
* 10개 기술 요소의 점수화(0~9점)로 한눈에 추세 강도 판단
* 거짓 진입 신호(위→안→위) 완전 제거
* 점수 0일 때도 ‘🔴’로 명확하게 무효 신호 표시
* 초보자부터 숙련자까지 모두 활용 가능한 추세 진입 필터링 지표
🧠 점수 계산 방식 (가중치 기반)
구름 돌파가 유효하게 발생하면,
아래 10가지 조건을 체크하여 각 항목별 가중치 점수가 합산됩니다.
▶ 기존 +1 점 항목 (5개)
1. 골든 크로스 발생
Fast MA가 Slow MA를 최근 N봉 내 상향 돌파
2. RSI 과매도 구간
RSI < 설정값 → 반등 가능성 증가
3. MACD 강세 전환
MACD < 0 & 시그널 상향 돌파
4. RSI 상승 다이버전스
가격 하락, RSI 상승 → 바닥 가능성
5. 종가 > MA200
장기 추세와 일치하는 경우만 점수 강화
▶ 신규 +1 점 항목 (추가 5개)
6. ADX > 20 (추세 강도)
추세가 실제로 형성되고 있을 때
7. 거래량 스파이크 발생
거래량이 평균 대비 일정 배수 이상 증가 → 큰 매수 유입
8. Stochastic Oversold Cross
%K < 30에서 골든크로스 → 저점 반등 신호
9. Bollinger Band Rebound
이전 봉이 하단 밴드를 이탈하고, 현재 봉이 중심선을 회복한 경우
10. 강세 캔들 패턴 (Bullish Engulfing / Hammer 등)
강한 반전 패턴 발생 시
> 점수는 단순 +1 합산이 아니라
> 각 요소의 중요도에 따른 가중치 합산 방식으로 계산됩니다.
📊 점수별 이모지 (8단계)
| 점수 구간 | 이모지 | 의미 |
| -------- | ------ | -------------- |
| ≤ 0 | 🔴 | 무효 신호 |
| 0 ~ 1 | ⚪ | 매우 약함 |
| 1 ~ 2 | 🟡 | 약함 |
| 2 ~ 3 | 🟢 | 관찰 필요 |
| 3 ~ 4 | 🔵 | 양호 |
| 4 ~ 5 | 📈 | 추세 형성 |
| 5 ~ 6.5 | 🚀 | 매우 강함 |
| **6.5+** | **👑** | **최상급 고신뢰 구간** |
> 👑 이모지는 6.5점 초과에서만 표시되며,
> 여러 핵심 조건이 동시에 충족된 극소수 구간에서만 나타납니다.
🖥 차트 표시 요소
* REAL Ichimoku Cloud(미래 이동 없는 실제 구름)을 기반으로 계산
* TRUE breakout(아래 → 위 돌파) 시 캔들 위에 점수 이모지 표시
* 최근 N개의 캔들만 표시 가능
* 우측 상단에 현재 점수 요소 설명 패널 표시
* 점수 0점일 때도 🔴 표시하여 신호의 부재를 명확히 표현
* 위→안→위처럼 잘못된 돌파는 완전히 제외됨
🔧 사용자 설정
* Tenkan / Kijun / SenkouB 기간 설정
* 점수 요소 개별 활성화/비활성화
* 이모지 커스터마이즈
* 최근 몇 개의 캔들까지 표시할지 설정
* MA, RSI, MACD, ADX, Bollinger 등 점수 요소 사용자 정의 가능
⚠️ 유의사항
이 지표는 일목구름 돌파 기반의 확률적 보조 도구이며,
단독으로 매수·매도 결정을 내리는 용도로 사용해서는 안 됩니다.
* 시장 변동성
* 시간 프레임
* 거래량 환경
에 따라 신호 강도는 달라질 수 있습니다.
실제 매매 적용 전 반드시 백테스트 및 시뮬레이션을 권장합니다.
오케이. 그럼 **지금 네 코드(v13, 가중치 + 8단계 이모지 기준)** 와
**완전히 1:1로 맞는 영어 설명 최종본**을 줄게.
(퍼블릭 배포용으로 그대로 써도 되는 수준)
# 📘 **CloudScore PRO by ExitAnt (v13)**
CloudScore PRO is an advanced **Ichimoku-based trend scoring indicator**
that detects only **true, valid Ichimoku Cloud breakouts** and evaluates the
strength of the trend using a **weighted score system built from 10 technical components**.
Unlike standard Ichimoku signals — which often generate distorted breakouts such as
**“above → inside → above”** —
CloudScore PRO v13 **filters these out completely** and only accepts the following structures as valid breakouts:
* **below → inside → above**
* **below → above (direct breakout)**
This ensures that scoring is applied **only when a genuine trend transition occurs**.
## 🎯 Purpose of the Indicator
* Filter out false Ichimoku Cloud breakouts
* Evaluate trend strength using **10 weighted confirmation signals**
* Visualize trend quality instantly using **8-stage emoji scoring**
* Clearly mark invalid signals (score ≤ 0)
* Serve as a robust **entry filter** for both beginners and advanced traders
## 🧠 Scoring Logic (Weighted System)
When a valid cloud breakout occurs, CloudScore PRO evaluates the following
10 components and **adds weighted scores based on their importance**.
### ▶ Core Trend & Momentum Components (5)
1. **Golden Cross**
* Fast MA crosses above Slow MA within the defined lookback period
2. **RSI Oversold Condition**
* RSI below threshold, indicating potential reversal
3. **MACD Bullish Shift**
* MACD below zero with bullish signal-line crossover
4. **RSI Bullish Divergence**
* Price makes a lower low while RSI makes a higher low
5. **Close Above MA200**
* Price aligned with the long-term trend direction
### ▶ Additional Confirmation Components (5)
6. **ADX Trend Strength**
* Confirms that a real trend is forming
7. **Volume Spike**
* Significant increase in trading volume vs average
8. **Stochastic Oversold Cross**
* %K crosses upward below the 30 level
9. **Bollinger Band Rebound**
* Price recovers after breaking below the lower band
10. **Bullish Candlestick Pattern**
* Engulfing, Hammer, or similar reversal patterns
> Scores are **not simple +1 increments**.
> Each component contributes a **weighted value**, reflecting its real-world importance.
## 📊 Emoji Score System (8 Levels)
| Score Range | Emoji | Meaning |
| ----------- | ------ | ---------------------------------- |
| ≤ 0 | 🔴 | Invalid / no signal |
| 0 ~ 1 | ⚪ | Very weak |
| 1 ~ 2 | 🟡 | Weak |
| 2 ~ 3 | 🟢 | Moderate |
| 3 ~ 4 | 🔵 | Decent |
| 4 ~ 5 | 📈 | Trend forming |
| 5 ~ 6.5 | 🚀 | Very strong |
| **6.5+** | **👑** | **Premium, high-confidence setup** |
👑 **The crown emoji appears only when the total weighted score exceeds 6.5**,
meaning multiple high-importance conditions are aligned simultaneously.
This prevents “emoji inflation” and ensures that premium signals remain rare and meaningful.
## 🖥 Chart Features
* Uses **REAL Ichimoku Cloud** (no future displacement)
* Displays score emojis directly on breakout candles
* Supports LONG / SHORT / BOTH modes
* Optional display limited to the most recent N bars
* Top-right panel explains scoring structure and logic
* Completely ignores false breakouts (above → inside → above)
## 🔧 User Options
* Adjust Ichimoku, MA, RSI, MACD, ADX parameters
* Enable or disable individual scoring components
* Fully customize emoji symbols
* **Display only signals above a chosen minimum score**
* e.g. show only 👑 setups by setting minimum score to 6.5
## ⚠️ Disclaimer
CloudScore PRO is a **probability-based trend evaluation tool**,
not a standalone buy or sell signal.
Signal strength may vary depending on:
* Market volatility
* Timeframe
* Volume environment
Always perform proper backtesting and apply sound risk management
before using this indicator in live trading.
MoneyLine CipherMoneyLine Cipher
Overview
MoneyLine Cipher is a trend-following indicator designed to identify high-probability entry and exit points by combining multiple technical analysis methods into a unified signal system. The indicator adapts its behavior based on current market conditions, becoming more aggressive in strong trends and more conservative in choppy or uncertain markets.
Core Concept: The Money Line
At the heart of this indicator is the Money Line, a linear regression line that acts as a dynamic center of price action. Unlike a simple moving average, linear regression fits a straight line through recent prices using least-squares methodology, providing a smoother representation of the underlying trend direction. The slope of this line determines whether the market is in a bullish, bearish, or neutral state.
Dynamic Envelope Bands
The indicator plots upper and lower bands around the Money Line using Average True Range (ATR) as the volatility measure. What makes these bands unique is their adaptive multiplier system. When the ADX (Average Directional Index) indicates a strong trend, the bands automatically widen to accommodate larger price swings and avoid premature exits. In ranging or weak trend conditions, the bands contract to provide tighter entry and exit zones. This dynamic adjustment helps the indicator perform consistently across different market environments.
Trend State Detection
The indicator classifies market conditions into five distinct states: Strong Uptrend, Uptrend, Neutral, Downtrend, and Strong Downtrend. This classification uses three complementary methods working together.
First, the Directional Movement Index (DMI) measures the spread between positive and negative directional indicators. A large positive spread suggests bullish momentum, while a large negative spread indicates bearish pressure.
Second, On-Balance Volume (OBV) confirms whether volume supports the indicated trend direction. For a Strong Uptrend classification, OBV must be rising above its moving average, confirming that buying pressure backs the price movement.
Third, ADX must exceed a minimum threshold for Strong trend classifications, ensuring that only genuinely trending markets receive the Strong designation.
Signal Generation
Buy and sell signals are generated using Fisher Transform and Aroon indicators, but with a crucial enhancement: the trigger thresholds adjust dynamically based on the current trend state.
The Fisher Transform converts price data into a Gaussian normal distribution, making turning points easier to identify. In a Strong Uptrend, the buy threshold relaxes (making buys easier to trigger) while the sell threshold tightens (making sells harder to trigger). This allows traders to stay in winning positions longer during favorable conditions. The opposite applies in downtrends, where the system becomes quick to exit and reluctant to enter long positions.
The Aroon indicator measures how recently price made a new high or low within the lookback period. Combined with Fisher Transform, this dual-confirmation approach reduces false signals that might occur when using either indicator alone.
Band touches also generate signals. When price reaches the lower band, a potential buy zone is identified. When price reaches the upper band, a potential sell zone is flagged.
Cascade Protection System
A key feature is the built-in protection against averaging down into a losing position. The system tracks consecutive buy signals and limits them to a configurable maximum (default: 3). After reaching this limit, no additional buy signals are generated until a sell signal resets the counter. This prevents the common mistake of repeatedly buying during a sustained decline.
Additionally, the indicator monitors Bollinger Band Width Percentile (BBWP), which measures current volatility relative to historical volatility. When BBWP exceeds a threshold (indicating a volatility spike often associated with sharp moves), buy signals are temporarily frozen. This protects against entering during panic selloffs or blow-off tops.
Extreme Move Detection
Sometimes price moves so aggressively that it penetrates the bands by an unusual amount. The indicator detects these extreme moves and can generate signals even during normal cooldown periods. The logic is that an extreme band penetration represents a significant overextension that warrants attention regardless of recent signal history. These extreme signals are visually distinguished from regular signals.
RSI Divergence
The indicator includes RSI divergence detection as an additional confirmation tool. When price makes a lower low but RSI makes a higher low (bullish divergence), it suggests weakening downside momentum and a potential reversal. Bearish divergence (price higher high, RSI lower high) warns of potential tops. Both regular and hidden divergences are detected and marked on the chart.
Signal Cooldown
To prevent overtrading and signal clustering, a configurable cooldown period prevents new signals for a set number of bars after each signal. This spacing ensures that each signal represents a distinct trading opportunity rather than repeated triggers on the same price movement.
Visual Display
The indicator provides a comprehensive information panel showing current trend state, BBWP status, consecutive buy count, ADX reading, Fisher and Aroon values, cooldown status, and current dynamic thresholds. An ADX bar at the bottom of the chart provides quick visual reference for trend strength and direction using color coding.
Signal labels display the entry or exit price along with the current buy count (for buy signals), helping traders track their position sizing.
How to Use
In uptrending markets, look for buy signals near the lower band, particularly when the trend state shows Uptrend or Strong Uptrend. These represent pullback opportunities within an established trend.
In downtrending markets, the indicator naturally reduces buy signals and increases sell sensitivity, helping traders avoid catching falling knives.
In neutral or ranging conditions, signals from both directions are generated with moderate thresholds, suitable for mean-reversion trading within the bands.
Monitor the BBWP and consecutive buy counter in the info panel. If BBWP shows "FROZEN" or the buy counter approaches the maximum, exercise additional caution with new long entries.
Settings Guidance
The default settings are optimized for 5-minute cryptocurrency charts but can be adjusted for other timeframes and assets. Key parameters to consider adjusting include the Money Line length (shorter for more responsive, longer for smoother), ATR multiplier range (wider bands reduce signals but improve accuracy), and the various threshold values for trend classification.

Multi-Layer Reversal Pro [The_lurker]🔮 MULTI-LAYER REVERSAL PRO
💡 CONCEPT
─────────────────────────────────────────────────────────────
An intelligent indicator that detects potential market reversal
points through multi-layer analysis combining momentum indicators,
Smart Money Concepts, and an advanced confirmation system.
HOW IT WORKS:
1. When prices reach exhaustion levels, market behavior is
analyzed through key Smart Money Concepts
2. When SMC concepts align with exhaustion, additional
advanced confirmations are activated
3. When all conditions are met, the appropriate signal appears
🥇 Gold 5M Tips
═════════════════════════════════════════════════════════════
📊 SIGNAL TYPES
═════════════════════════════════════════════════════════════
🟢 BUY SIGNALS
─────────────────────────────────────────────────────────────
BUY
Confirmed buy signal - all conditions met
Confidence: HIGH ●●●
E.BUY (Early Buy)
Early buy opportunity - strong exhaustion + high ADX
Confidence: MEDIUM ●●○
🔴 SELL SIGNALS
─────────────────────────────────────────────────────────────
SELL
Confirmed sell signal - all conditions met
Confidence: HIGH ●●●
E.SELL (Early Sell)
Early sell opportunity - strong exhaustion + high ADX
Confidence: MEDIUM ●●○
🟡 YELLOW WARNING
─────────────────────────────────────────────────────────────
Yellow candle = Warning of potential nearby reversal
→ Action: Monitor only, do not rush
⚠️ CLOSE TRADE
─────────────────────────────────────────────────────────────
"Close Trade ⚠️" appears when:
- A yellow warning candle appeared
- The next candle closed below the TP level
→ Meaning: Exit long position + automatic short entry
═════════════════════════════════════════════════════════════
🎯 QUICK ACTION GUIDE
═════════════════════════════════════════════════════════════
BUY / SELL
Confidence: HIGH
✅ Direct entry
E.BUY / E.SELL
Confidence: MEDIUM
⚡ Cautious entry / smaller size
Yellow Candle
Confidence: ALERT
👁️ Monitor only
Close Trade
Confidence: URGENT
🚪 Immediate exit
⚠️ DISCLAIMER
━━━━━━━━━━━━━━━━━━━━━━━━━━━━━━━━━━━━━━━━━━━
This indicator is for educational purposes only. Past performance does not
guarantee future results. Always use proper risk management and conduct your
own analysis before making trading decisions.
═════════════════════════════════════════════════════════════
مؤشر الانعكاس الذكي متعدد الطبقات
═════════════════════════════════════════════════════════════
💡 الفكرة
─────────────────────────────────────────────────────────────
مؤشر ذكي يكتشف نقاط الانعكاس المحتملة في السوق عبر تحليل
متعدد الطبقات يجمع بين مؤشرات الزخم ومفاهيم Smart Money
مع نظام تأكيدات متقدم.
آلية العمل:
1. عند وصول الأسعار إلى مراحل التشبع ، يتم تحليل سلوك السوق من عدة نقاط جوهرية تعتمد على مفاهيم Smart Money
2. عند تطابق مفاهيم SMC مع التشبع ، تُفعَّل تأكيدات متقدمة
3. عند تحقق جميع الشروط، تظهر الإشارة المناسبة
🥇 نصيحة للذهب 5 دقائق
═════════════════════════════════════════════════════════════
📊 أنواع الإشارات
═════════════════════════════════════════════════════════════
🟢 إشارات الشراء
─────────────────────────────────────────────────────────────
1- شراء BUY
إشارة شراء مؤكدة - استوفت جميع الشروط
الثقة: عالية ●●●
2- شراء مبكر E.BUY
فرصة شراء مبكرة - تشبع قوي + ADX عالي
الثقة: متوسطة ●●○
🔴 إشارات البيع
─────────────────────────────────────────────────────────────
1- بيع SELL
إشارة بيع مؤكدة - استوفت جميع الشروط
الثقة: عالية ●●●
2- بيع مبكر E.SELL
فرصة بيع مبكرة - تشبع قوي + ADX عالي
الثقة: متوسطة ●●○
🟡 التحذير الأصفر
─────────────────────────────────────────────────────────────
الشمعة الصفراء = تحذير من احتمال انعكاس قريب
← التصرف: راقب فقط ولا تتسرع
⚠️ إغلاق الصفقة
─────────────────────────────────────────────────────────────
تظهر علامة "إغلاق الصفقة ⚠️" عندما:
- ظهرت شمعة تحذير صفراء
- الشمعة التالية أغلقت تحت مستوى TP
← المعنى: إشارة خروج من الشراء + فتح صفقة بيع تلقائياً
═════════════════════════════════════════════════════════════
🎯 دليل التصرف السريع
═════════════════════════════════════════════════════════════
شراء/بيع BUY / SELL
الثقة: عالية
✅ دخول مباشر
شراء مبكر/ بيع مبكر E.BUY / E.SELL
الثقة: متوسطة
⚡ دخول بحذر أو حجم أقل
شمعة صفراء
الثقة: تنبيه
👁️ مراقبة فقط
إغلاق صفقة
الثقة: عاجل
🚪 خروج فوري
═════════════════════════════════════════════════════════════
⚠️ إخلاء المسؤولية
━━━━━━━━━━━━━━━━━━━━━━━━━━━━━━━━━━━━━━━━━━━
هذا المؤشر للأغراض التعليمية فقط. الأداء السابق لا يضمن النتائج المستقبلية.
استخدم دائماً إدارة مخاطر مناسبة وقم بتحليلك الخاص قبل اتخاذ قرارات التداول.

3 Lines RCI + Psy Signal + RSI Background📌 3 Lines RCI + Psy Signal + RSI Background
This indicator combines three RCI lines, Psychological Line signals, RSI-based background highlights, and ADX strength detection to visualize market momentum, trend strength, and potential reversal zones.
🔍 Main Features
📌 1. Triple RCI (Rank Correlation Index)
Displays Short / Mid / Long RCI
Detects momentum shifts and trend reversals
Highlight zones:
Overbought: +80 ~ +100 (Red Zone)
Oversold: -80 ~ -100 (Green Zone)
📌 2. Psychological Line Signal
Column bars appear only in extreme conditions:
Overbought → Red Bars
Oversold → Green Bars
Helps detect short-term sentiment extremes
📌 3. RSI Background Highlight
Red Background: RSI > Overbought threshold
Green Background: RSI < Oversold threshold
Provides a visual cue of underlying market pressure.
📌 4. ADX Trend Strength
ADX line color shows strength level:
Blue: Weak trend
Yellow: Moderate trend
Red: Strong trend
Useful to identify whether signals occur in a trend or range state.
🎯 Trading Usage Tips
RCI + RSI + Psy confluence can identify strong reversal timing.
Use signals only when ADX is weak or moderate to avoid counter-trading a strong trend.
Combine short/mid RCI crossovers with extreme zones for potential entry timing.
⚙️ Suitable For
Scalping, day trading, swing trading
Stocks, Forex, Crypto, Indices, Commodities

Breakout PRO (B:Pro) v3.0Breakout PRO (B:Pro) v3.0 is a multi-filter breakout and trend suite designed for discretionary trading on any symbol and timeframe. It combines a custom EMA cloud, volatility and momentum filters, higher-timeframe trend, and quality scoring into one tool, instead of using multiple separate indicators.
Core concept
The script builds a three-layer EMA cloud around price. The relative position of fast, mid, and slow EMAs plus an ATR padding defines:
Bull regime: stacked EMAs with cloud acting as dynamic support
Bear regime: stacked EMAs with cloud acting as dynamic resistance
Neutral regime: mixed EMAs, cloud fades to neutral color
This cloud defines the main trend and the breakout levels (cloud upper / cloud lower).
A higher-timeframe 200 EMA (configurable timeframe) adds a long-term bias filter.
Support, resistance and structure
Last confirmed swing high and swing low are detected with pivot logic and plotted as dotted support / resistance lines.
These levels are invalidated with a small ATR buffer when price clearly breaks them.
Optional long-term EMA targets (T1 and T2, default 233 and 377) are plotted on the price scale as potential mean-reversion or trend-continuation targets.
Filters used in entries
Long and short breakout signals are only shown when multiple conditions agree. You can enable or disable each filter:
Volume: current volume vs volume SMA
MACD: direction and histogram momentum
RSI: classic OB/OS, with sentiment-adjusted levels
Stoch RSI: direction of K vs D in valid zones
Bollinger Bands + Keltner Channel: squeeze and BB breakouts
VWAP: price relative to VWAP
ADX: trend strength threshold
OBV and Ichimoku: optional extra trend confirmation
A separate Market Sentiment input (Standard, Bullish, Bearish, Consolidation) shifts RSI zones, ADX threshold, and volume requirements so the same logic adapts to different environments.
Signals and exits
The main entry logic:
Long signal: bull EMA stack, breakout above the last pivot resistance and above the upper cloud, plus all enabled long filters are satisfied.
Short signal: mirror conditions below support and below the lower cloud.
Trade state is tracked inside the script:
ATR-based stop level is set on entry using mode-dependent ATR multipliers.
Optional maximum trade duration (different for Short, Mid and Long modes).
Exit markers are plotted when stops are hit, the cloud / EMA stack flips against the trade, MACD or RSI contradict the position, or the time limit is exceeded.
Additional icons mark:
Strong breakouts / breakdowns with large ATR and volume
Squeeze releases after a volatility contraction
EMA cross signals
Continuation and potential reversal zones inside the cloud
Optional RSI divergence arrows based on a separate RSI tuned per trade mode.
Quality and safety scoring
For every entry the script computes:
Safety score (1–3): based mainly on volume, ADX trend strength, and alignment with the cloud regime.
Quality score (1–3): based on BB breakout, MACD and RSI agreement, and whether the signal matches the selected market sentiment.
You can:
Show small S/Q labels next to the entry signal
Use the fixed panel in the bottom-left corner to view the last 5 trade events (opens, closes, crosses) with their S and Q values.
Inputs and layout options
Key inputs:
Trade Mode: Short (e.g. 30 min), Mid (e.g. 4h), Long (e.g. 1D+). Adjusts EMA lengths, ATR settings and the RSI length used for divergences.
Market Sentiment: adjusts filters as described above.
Per-filter toggles for volume, MACD, RSI, Stoch RSI, BB, Ichimoku, ADX, OBV, VWAP, HTF levels.
Panel size: Desktop, Phone, or None for the signal history table.
Side labels: Desktop (full text labels on the price scale) or Phone (compact labels without text) for better compatibility on small screens.
Usage notes
This is a technical analysis tool, not a trading system or financial advice. Signals are calculated on closed data without intentional look-ahead, but values on the current forming bar can still change until the bar closes. Use the script as a structured framework for trend, breakout and confluence analysis, and always confirm signals with your own risk management and testing.

Swing Aurora v7.0 — The ExecutionerSwing Aurora v7.0 — The Executioner
Swing Aurora v7.0 is a multi-engine swing trading framework that combines trend-following, momentum, HTF confluence and SMC/Fibonacci structure in one script.
This version moves from a rigid gate logic to a scoring + state machine engine, so you can see not only if there is a signal, but how strong that signal really is.
🧠 1. Scoring Engine – A-Grade & B-Grade Signals
Instead of a single if (all conditions == true) check, v7.0 builds a score on every bar:
Trend score – position vs Baseline, slope, Supertrend direction.
Momentum score – MACD, RSI-Stoch triggers, ADX, local HH/LL.
HTF score – alignment with higher timeframe Baseline, Bias EMA, EMAs and RSI.
Confluence flags – divergences, ST flip/retest, SMC zones, VDub context.
Results:
A-Grade (Strong) signals → high score, strong trend + momentum + HTF alignment.
B-Grade (Speculative) signals → early/partial setups, clearly marked as higher risk.
You no longer lose good entries just because one minor filter disagrees, but you can clearly distinguish high-quality setups from speculative ones.
🔁 2. Strict Trade Cycle – State Machine
v7.0 uses a simple state machine:
0 = Flat, 1 = Long, -1 = Short.
When you are Long, the script only looks for exits or reversals, not new BUY entries.
Same for Short.
This enforces a clean, disciplined flow:
BUY → Hold → EXIT → wait for next setup, without label spam or conflicting signals while already in a position.
🛡️ 3. Quality Gates & Anti-FOMO Filters
To avoid buying local tops or chopping yourself to death:
RSI Gate – blocks BUY when RSI is already overbought (and vice-versa for SELL).
ATR Over-Extension filter – no entries when price is too far from the Baseline (parabolic moves).
No-Trade / Chop zone – combines ADX, ATR vs ATR-slow, distance to Baseline, Bollinger/Keltner squeeze and volume behavior.
Volume Gate – requires a real volume spike, not just random price wiggle.
Supertrend Gate – entries are synchronized with ST (flip / early / retest — configurable).
HTF Guardrails – optional: blocks entries against the dominant HTF regime.
📈 4. Visual Layer: Trend Map, Labels & Gradient
BUY/SELL labels with confidence percentage.
Background gradient based on trend direction and strength (ADX).
EMA 13/21 + Baseline with dynamic bull/bear colors.
Optional mini-legend showing: TS / RSI / ADX / HTF status at a glance.
🧩 5. Divergences, VDub & Macro Map
Full divergence engine (classic + hidden) on a basket of indicators (RSI, MACD, CCI, OBV, etc.), with optional lines and count labels.
VDub levels & signals – “smart levels” (solid/dotted) and add-on BUY/SELL signals filtered by market regime.
HTF Macro Map – higher timeframe Baseline, Bias EMA, fast EMAs, RSI and slope, using an auto or user-selected higher TF.
🧱 6. SMC Zones & Fibonacci (v7.0 Logic)
The SMC / Fibo component was refined so it is not hard-wired to the current bar’s entry signal:
Automatic HH / HL / LH / LL market structure labelling.
Demand / Supply zones:
derived from BOS with ATR buffer,
auto-update bar-by-bar,
auto-delete when broken or after a user-defined lifetime.
Fibonacci range:
built from the latest valid swing-high / swing-low,
shows 0 / 0.382 / 0.5 / 0.618 / 1 / 1.618 levels plus equilibrium line,
persists while the range is valid (independent of being in a trade).
AI zone boost (v7.0) – optional: zone opacity adapts dynamically to the underlying confidence score, highlighting higher-quality areas.
⚙️ 7. Modes & Configuration
Modes: Aggressive / Balanced / Conservative – adjust score thresholds and confidence requirements.
Risk & Quality: slope filter, min ATR distance, strict anti-chop, volume gate, HTF guardrails.
Visual toggles: labels on/off, baseline & EMAs, gradient, mini-legend, SMC boxes, Fibonacci.
This script does not trade for you – it provides a structured, consistent framework for reading trend, momentum and structure, plus graded signals so you can execute your own risk management and strategy.
Disclaimer
This script is provided strictly for educational and research purposes. It does not constitute financial advice, investment recommendation or any guarantee of profit. Historical performance, backtests and chart examples do not ensure future results.
Always use your own risk management rules, test the script on multiple instruments and timeframes, and never trade with money you cannot afford to lose. The author and contributors accept no responsibility for any trading decisions made based on this indicator.

VPT Osc - Call/Put Mirror# 📊 VPT Oscillator with Call/Put Mirror & Trading Signals Dashboard
## Overview
Advanced **Volume Price Trend (VPT) Oscillator** specifically designed for **options traders** who want to analyze both CALL and PUT options simultaneously. This indicator provides real-time divergence detection, signal strength scoring, and mirror analysis to identify high-probability reversal and continuation setups.
## 🎯 What Makes This Unique?
### **Call/Put Mirror Technology**
- Automatically detects if you're viewing a CALL or PUT option
- Simultaneously plots the VPT of the opposite option (mirror)
- Identifies contrarian opportunities when current and mirror options show conflicting signals
- Perfect for options spreads and hedging strategies
### **Comprehensive Trading Signals Dashboard**
A real-time dashboard displays:
- **Active Signal** - Current divergence type (Regular/Hidden Bullish/Bearish)
- **Signal Score** - 0-100 probability rating based on multiple confirmation filters
- **Trade Action** - Clear BUY CALLS/PUTS recommendations
- **Position Size** - Risk-adjusted sizing based on signal strength
- **Mirror Analysis** - Opposite option's signal for contrarian plays
- **Volume & Change%** - Live price action data for both options
- **Risk Management** - Automatic stop-loss and target calculations
## 🔍 Key Features
### 1. **Four Divergence Types**
**Primary Entry Signals:**
- ✅ **Regular Bullish Divergence** - Price makes lower low, VPT makes higher low → BUY CALLS
- ✅ **Regular Bearish Divergence** - Price makes higher high, VPT makes lower high → BUY PUTS
**Advanced Continuation Signals:**
- 🔄 **Hidden Bullish Divergence** - Price makes higher low, VPT makes lower low → ADD TO CALLS
- 🔄 **Hidden Bearish Divergence** - Price makes lower high, VPT makes higher high → ADD TO PUTS
### 2. **Multi-Factor Signal Scoring System**
Each signal receives a score (0-100) based on:
- **Divergence Strength** (30 points) - Magnitude of price/volume divergence
- **Volume Confirmation** (20 points) - Above-average volume present
- **ADX Trend Filter** (20 points) - Strong trend confirmation
- **Multi-Timeframe Alignment** (20 points) - Higher timeframe agreement
- **RSI Extremes** (10 points) - Oversold/overbought confirmation
**Score Interpretation:**
- 90-100: Extremely Strong → Full position size (3-5% capital)
- 70-89: Strong → Standard position (2-3% capital)
- 50-69: Moderate → Half position (1% capital)
- <50: Weak → AVOID or paper trade only
### 3. **Zero Line Cross Strategy**
- 🚀 **Bullish Cross** - VPT crosses above zero → Mass buying pressure entering
- ⚠️ **Bearish Cross** - VPT crosses below zero → Distribution phase starting
- Best when combined with divergence signals (Score 70+)
### 4. **ATR Dynamic Bands**
Identifies extreme overbought/oversold conditions:
- **Upper Band Touch + Bearish Divergence (75+)** = 🔴 AGGRESSIVE PUT buying
- **Lower Band Touch + Bullish Divergence (75+)** = 🟢 AGGRESSIVE CALL buying
- Auto-adjusts to market volatility
### 5. **Contrarian Mirror Analysis**
🔥 **High Probability Reversals** detected when:
- Current option shows bearish divergence (Score 70+)
- Mirror option shows bullish divergence (Score 70+)
- Suggests sharp market reversal imminent
## 📈 Trading Strategies
### Strategy 1: Primary Divergence Entry
1. Wait for Regular Bullish/Bearish divergence
2. Confirm Score ≥ 70
3. Check volume confirmation (✓ Confirmed)
4. Enter with standard position size
5. Stop loss: Below recent swing low (for calls) / Above swing high (for puts)
6. Target: 2:1 to 3:1 risk-reward ratio
### Strategy 2: Hidden Divergence - Add to Winners
1. Already holding CALL/PUT position
2. Hidden divergence appears in same direction
3. Add to position during pullback/bounce
4. Lower risk (trend already established)
### Strategy 3: Mirror Contrarian Play
1. Current option shows bearish divergence
2. Mirror option shows strong bullish signal
3. Both scores ≥ 70
4. **EXIT current position → SWITCH to mirror option**
5. Captures sharp reversals
### Strategy 4: Zero Line Momentum
1. VPT crosses above/below zero line
2. Combine with Score 65+ divergence
3. Use ATM or slightly OTM options
4. Best for 1-3 day expiries (quick moves)
### Strategy 5: ATR Band Extremes
1. Wait for VPT to touch upper/lower band
2. Confirm with opposing divergence (Score 75+)
3. Enter aggressive position
4. Target: Return to zero line
## ⚙️ Customizable Settings
### Signal Filters
- **ADX Trend Filter** - Minimum ADX threshold for trend strength
- **Volume Confirmation** - Volume multiplier (1.2x default)
- **MTF Confirmation** - Higher timeframe alignment
- **Signal Cooldown** - Minimum bars between signals (prevents spam)
- **Minimum Score** - Filter signals below threshold
### Visual Options
- **ATR Dynamic Bands** - Show/hide volatility bands
- **Mirror Display** - Toggle mirror option VPT
- **Table Position** - 9 positions (top/middle/bottom × left/center/right)
- **Table Size** - Auto, Tiny, Small, Normal, Large, Huge
- **Risk Management Display** - Show/hide stop-loss and targets
### Divergence Detection
- **Pivot Lookback** - Sensitivity for divergence detection
- **Lookback Range** - Min/max bars for divergence confirmation
- **Individual Toggle** - Enable/disable each divergence type
## 📱 Dashboard Layout
**Top Rows (Critical Info):**
1. Mirror Signal & Score
2. Active Signal
3. Signal Score (0-100)
4. Zero Line Status
5. Volume Confirmation
6. Trade Action
**Middle Rows (Confirmations):**
7. Position Sizing
8. ADX Trend Strength
9. Higher Timeframe Alignment
10. ATR Band Status
**Bottom Rows (Risk Management):**
11. Contrarian Alert (if applicable)
12. Stop Loss Level
13. Target (R:R Ratio)
14. Expected Win Rate
## 🎨 Visual Elements
- **Color-coded VPT areas** - Aqua (bullish) / Orange (bearish)
- **Mirror VPT overlay** - Fuchsia (bull) / Yellow (bear) with transparency
- **Divergence lines** - Connect pivot points automatically
- **Score labels** - Show signal strength directly on chart
- **ATR bands** - Dynamic support/resistance zones
- **Background colors** - MTF trend confirmation (subtle)
## 💡 Best Practices
1. **Wait for Score ≥ 70** on primary signals for best win rate
2. **Always check volume confirmation** before entering
3. **Use mirror analysis** for additional edge
4. **Respect stop losses** - Options decay fast
5. **Consider expiry dates** - Minimum 5-7 days recommended
6. **Scale positions** based on score (90+ = full size)
7. **Watch zero line** for momentum shifts
## ⚠️ Risk Disclaimer
- This indicator is designed for **educational purposes** and analysis
- Options trading carries substantial risk of loss
- Past divergences do not guarantee future performance
- Always use proper position sizing (1-5% per trade recommended)
- Expected win rate ranges from 55-80% depending on score threshold
- Combine with fundamental analysis and broader market context
## 📊 Recommended Timeframes
- **Intraday Scalping:** 5min, 15min charts
- **Swing Trading:** 1H, 4H charts
- **Position Trading:** Daily charts
Works best on **liquid option contracts** with tight bid-ask spreads.
## 🔧 Technical Details
- Built on **Volume Price Trend (PVT)** oscillator
- Dual EMA crossover (Short: 3, Long: 20 default)
- Multi-factor scoring algorithm with weighted components
- Real-time mirror symbol parsing for NSE/exchange formats
- Dynamic ATR-based volatility bands
- Automatic pivot detection for divergences
## 📚 What You Get
✅ Professional-grade divergence detection
✅ Real-time signal scoring (0-100)
✅ Automatic mirror option analysis
✅ Trading signals dashboard
✅ Risk management calculator
✅ Volume and price change tracking
✅ Multiple confirmation filters
✅ Fully customizable settings
✅ Works on all option exchanges
***
**Perfect for:** Options traders, day traders, swing traders, divergence traders, volume analysis enthusiasts
**Works with:** CALL options, PUT options, Index options, Stock options, Futures options
**Supports:** NSE, NYSE, NASDAQ, and other major exchanges (auto-detects option format)
***
*If you find this indicator useful, please leave a comment or boost! Your feedback helps improve future versions.*
*For questions or feature requests, feel free to comment below.*
***
## 📝 Version History
**v1.0** - Initial Release
- Call/Put mirror functionality
- Four divergence types with scoring
- Trading signals dashboard
- ATR dynamic bands
- Zero line cross detection
- Volume and change% tracking
- Risk management module
***
**Tags:** #options #VPT #divergence #volumeanalysis #callput #tradingsignals #optionstrading #technicalanalysis #volumepricetrend

Beast Mode Adaptive Oscillator V6⭐ Beast Mode Adaptive Oscillator V6
Description (Copy/Paste for Publishing)
Beast Mode Adaptive Oscillator V6 is a high-precision, regime-aware momentum engine that adapts dynamically to market conditions.
It blends ADX-based market regime filtering, StochRSI adaptive oscillation, and ATR-driven signal validation to deliver a powerful, low-noise, context-smart oscillator.
Instead of giving the same overbought/oversold signals in every environment, this oscillator changes its behavior depending on market regime:
Market Regime Filter (MRF)
Automatically detects:
✔ Strong Bull Trend
✔ Strong Bear Trend
✔ Ranging Bull
✔ Ranging Bear
✔ Noise / Low-Volatility Environment
ADX + DI structure determines how aggressive or conservative the oscillator becomes.
Adaptive Regime Oscillator (ARO)
A smart StochRSI core whose OB/OS levels shift depending on trend regime:
• In strong trends → wider OB/OS bands (10–90)
• In ranges → tighter, mean-reverting bands (20–80)
• Higher accuracy and fewer false reversals
Price/Volatility Control (PVC)
Built-in ATR risk modules:
• ATR-based stop zones
• ATR-based target zones
• Internal validation to confirm signal strength
Optional Visual Aids
• Entry signal markers
• Regime bar at the bottom of the chart
• ADX line display
• Custom colors for trend strength
What This Indicator Is Best At
• Avoiding bad signals during chop
• Catching trend continuation entries
• Identifying exhaustion points in strong moves
• Adapting OB/OS logic to match volatility
• Confirming strength with ADX + DI structure
Perfect For
• Intraday traders
• Swing traders
• Trend traders
• Mean-reversion setups
• Volatility-based strategies
This is a complete adaptive oscillator system designed to stay accurate across every market condition.

Universal Scalper Indicator [Crypto/Forex/Gold]Universal Scalper Pro is an all-in-one scalping system designed for the 15-Minute Timeframe. It automates the analysis of trend, volatility, and risk management into a single, high-contrast dashboard.
Unlike standard crossover indicators, this system filters out low-volatility "noise" using a built-in ADX engine and automatically calculates dynamic Stop Loss and Take Profit levels based on market volatility (ATR).
It is engineered to work universally on:
Crypto (BTC, ETH, SOL, Altcoins)
Commodities (Gold, Silver, Oil)
Forex (Major & Minor Pairs)
Stocks (High volume tech stocks like NVDA, TSLA)
📈 How It Works (The Strategy)
1. The Trend Engine (9/21 EMA) The core logic utilizes a Fast (9) and Slow (21) Exponential Moving Average crossover.
Bullish Signal: The 9 EMA crosses above the 21 EMA.
Bearish Signal: The 9 EMA crosses below the 21 EMA. This specific combination is chosen for its responsiveness to 15-minute intraday trends.
2. The Noise Filter (ADX > 15) To prevent "whipsaws" (fake signals during sideways markets), the script includes a Volatility Filter based on the Average Directional Index (ADX).
Signals are rejected if the ADX is below 15.
This ensures you only receive alerts when there is sufficient momentum to sustain a move.
3. Dynamic Risk Management (ATR) The script uses the Average True Range (ATR) to calculate Stop Loss and Take Profit levels that adapt to the specific asset's volatility.
Stop Loss: Placed at 1.5x ATR from the entry. (Tight enough to preserve capital, wide enough to survive standard market noise).
Take Profit: Placed at 2.0x ATR from the entry. (Provides a healthy 1:1.3 Risk/Reward ratio).
🚀 Key Features
Universal Dashboard: A bottom-right panel displays the live Trend Status, Entry Price, Stop Loss, and Take Profit. It automatically formats decimals for any asset (e.g., 2 decimals for Gold, 5 for Forex, 8 for Crypto).
"Sticky" Memory: The dashboard retains the prices of the last valid signal, allowing you to manage your trade even after the signal candle closes.
Trend Cloud: A visual Green/Red zone between the EMAs helps you instantly identify the market bias.
Unified Alerts: A single alert setup ("Any alert() function call") sends the Asset Name, Entry, SL, and TP directly to your phone.
🛠️ How to Use
Timeframe: Set your chart to 15 Minutes (15m).
Wait for the Signal: Look for the "BUY" (Green) or "SELL" (Red) label on the chart.
Check the Dashboard: Ensure the "STATUS" is BULLISH (for buys) or BEARISH (for sells). If the status says "WAIT", do not trade.
Execute: Enter the trade using the exact Stop Loss and Take Profit levels shown on the dashboard.
⚠️ Risk Disclaimer
Trading financial markets involves high risk and may not be suitable for all investors. This indicator is a technical analysis tool and does not constitute financial advice. Past performance is not indicative of future results. Always practice with a demo account before trading real capital.

smartAitrade Complete FocusTrendPajinko-SmartAiTrade Complete is an all-in-one price-action technical system designed for high-precision entries, intelligent trade management, and fully automated exit logic.
The system combines RSI swings, advanced divergence detection, ATR-based PJK Bands, smart retest logic, swing-break POI zones, trend filters (ADX), and automated breakeven/TP management into a single integrated indicator.
It is built to support traders who want structured, rule-based entries with minimal discretion, while still maintaining the flexibility of price-action behavior.
🔍 Core Components
1. RSI System
Standard RSI for overbought/oversold levels.
RSI Swing High/Low detection (using pivots).
Used for:
momentum confirmation
swing structure alignment
divergence detection filters
2. Advanced Divergence Engine
The indicator features a high-accuracy divergence module that detects:
• Bullish Divergence
Price makes a lower low
RSI makes a higher low
Pivot distances must fall within a valid bar-range
Optional filter: RSI must be in oversold zone
• Bearish Divergence
Price makes a higher high
RSI makes a lower high
Optional filter: RSI must be in overbought zone
You can choose to draw divergence lines on either:
RSI only
Price chart
Both
This system is optimized for low repaint and filters weak divergence signals.
3. ATR-Based PJK Bands System
A volatility-adaptive band system similar to Keltner/Bollinger hybrids:
Middle line uses SMA/EMA/VWMA
Upper/lower bands = middle ± ATR × multiplier
Bands detect:
momentum breakouts
band touch signals
high-probability reversal zones
Buy signal:
Price touches lower band and shifts upward
Sell signal:
Price touches upper band and shifts downward
4. Smart Retest System
After a momentum breakout or band touch signal:
A “smart retest zone” is created
The system waits for price to come back to the zone
If retest occurs within a user-defined timeout window, the signal is validated
Used to avoid chasing entries and reduce false breakouts
5. Swing Break & POI Zones
The indicator automatically detects price-swing structure:
Swing High Break → Sell POI box created
Swing Low Break → Buy POI box created
POI zones:
Represent potential liquidity pockets
Drawn with customizable height and width
Work as target areas or confirmation zones
6. ADX Trend Filter
ADX trend strength filter ensures signals are valid only when:
Trend strength > threshold (default 20)
Avoids signals in flat, low-volatility markets
7. Auto Trade Management (Breakeven System)
Fully automated exit logic:
TP1 distance set in pips
Once TP1 is reached → move Stop Loss to breakeven + offset
Additional option:
Close all open positions automatically when trend bias changes
Everything works even with multiple open trades.
8. Dashboard & Visual Interface
The indicator includes a clean dashboard showing:
Trend condition
RSI status
Advanced divergence status
Band and swing conditions
Active signals
Breakeven status
Total signals statistics
All visual components can be enabled/disabled individually.
🎯 Trading Philosophy
The system is built on three core principles:
1. Confirm Trend
ADX + ATR Bands define direction and strength.
2. Identify High-Probability Reversal or Continuation Zones
Smart Retest + Swing Structure + POI + Divergence.
3. Automate the Exit
Breakeven, TP1, and automatic closing keep emotions out of the decision.

IDX - 7UP v6 ENHANCED alertsIDX-7UP v6 ENHANCED — Short Public Description
IDX-7UP v6 ENHANCED is a multi-confirmation trend system built for FX, indices, commodities, and metals.
It combines Supertrend, multi-asset strike levels, volume momentum, standard-deviation zones, support/resistance, RSI, ADX, and session behavior to generate high-probability BUY/SELL signals.
The indicator includes four signal types:
REV (reversal), CONT (trend continuation), STRK (strike-momentum break), and SESS (session re-entry).
Each signal is scored using an 8-point confirmation model to ensure quality.
Features include:
• Auto-strike detection for 10 symbols
• Optional simple or detailed chart labels
• Daily SD levels, S/R, ADX-colored trend MA
• Volume spike detection
• Full dashboard with trend, RSI, ADX, volume, and last signal info
• Buy/Sell alerts included
Designed for traders who want structured, strike-based trend detection with strong filtering and clean visual signals.
Alerts
The script includes three alert types:
Buy Signal, Sell Signal, Any Signal Detected
Alerts fire immediately when confirmation thresholds are met.
Confirmation Scoring (0-8 Points)
Every signal passes through an 8-point confirmation system including:
Strike proximity or strike alignment
Daily Standard-Deviation levels (+1, +0.3, -0.3, -1)
Support/Resistance breaks or bounces
Volume filter or high-volume continuation
RSI momentum (OB/OS or rising/falling sequences)
ADX trend-strength filter
SMA-based trend alignment (SMA8 & SMA21)
Signals must meet your minimum confirmation threshold before triggering.
