simple trend Scanner Dashboard Script Does
- Calculates key metrics:
- Percent Change from previous day
- Relative Volume (% vs 10-bar average)
- RSI and ADX for strength/trend
- 20 EMA for dynamic support/resistance
- Classifies market condition:
- 🟢 Strong if RSI > 60 and ADX > 25
- 🔴 Weak if RSI < 40 and ADX < 20
- ⚪ Neutral otherwise
- Displays a table dashboard:
- Compact, color-coded summary of all metrics
- Easy to scan visually
- Plots visual signals:
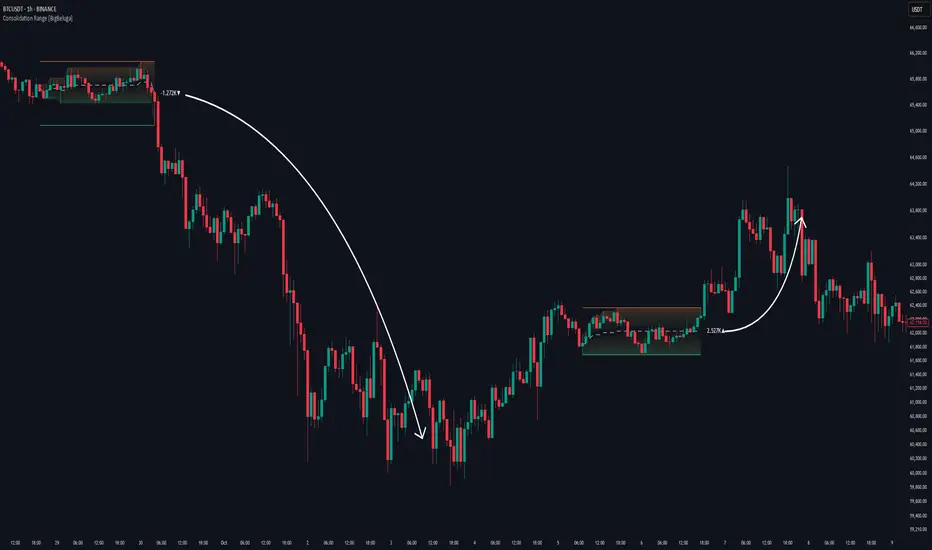
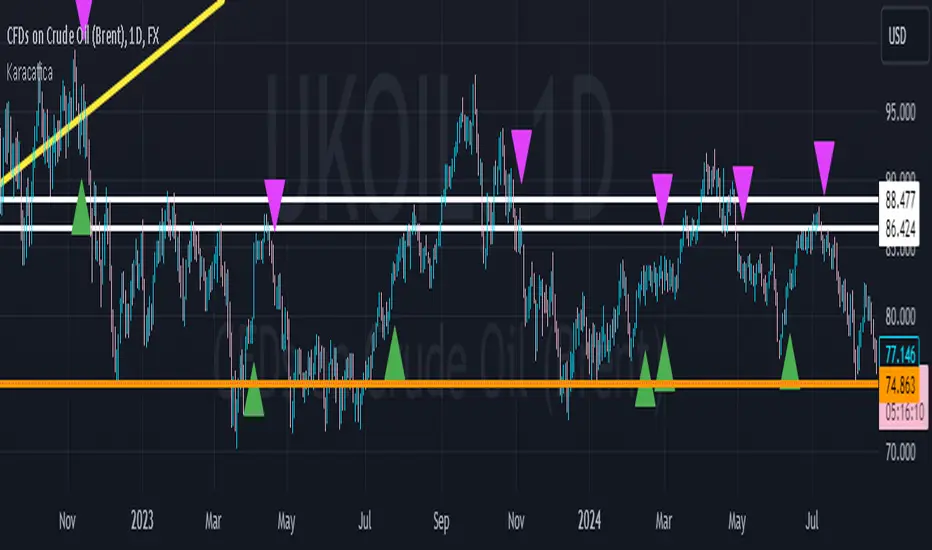
- Arrows and triangles for percent change and volume spikes
- Data window plots for deeper inspection
Pine Script® 인디케이터