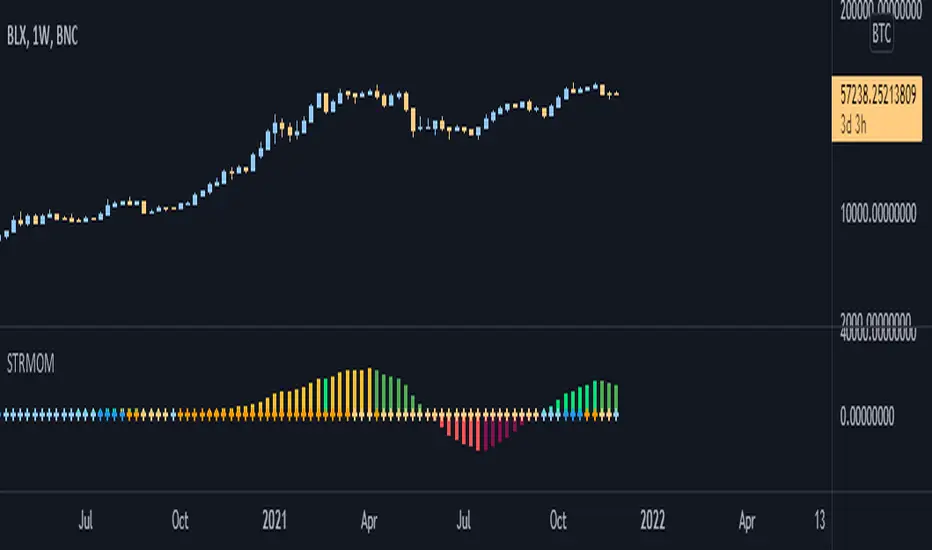
Strength Momentum IndicatorThis indicator is a fork of . It takes it a step further by including RSI and ADX information, which are represented in this indicator as follows:
MOM: The histogram itself is a linear regression curve, by default for the study period the Fibonacci series and exponential moving average were used. You can adjust the settings to your liking.
RSI: Whenever the RSI is outside the normal ranges (which you can adjust in the settings), the bar in the histogram will turn amber to warn you.
ADX: Crosses are drawn along the 0 line to indicate the ADX . Blue means that the ADX is below the trend level (adjustable in the settings), and orange means that it is above that level. Darker colors indicate that the ADX has risen from the previous bar, while lighter colors indicate that it has fallen.
Almost all of the normally adjustable values can be adjusted in the settings for each of the base indicators. Also adjustable:
The RSI alert levels (30 and 70 by default).
The ADX crossover, i.e. the point at which the ADX value is considered to indicate a strong trend (25 by default).
All colors, naturally.
스크립트에서 "adx"에 대해 찾기
LB Squeeze Momentum DivergencesThis study tries to highlight LazyBear Squeeze Momentum divergences
as they are defined by
TradingLatino TradingView user
Squeeze momentum green peaks are connected by a line
Associated prices to these green peaks are also connected
If both lines have a different slope orientation
then there is a divergence.
It only shows two last divergence lines and angles.
The original chart screenshot shows some divergence lines
on the top or main chart
these were drawn manually
because you cannot write to two different charts
from the same pine script study (Well, not in August 2020 anyways)
It's aimed at BTCUSDT pair and 4h timeframe.
HOW IT WORKS
Simple geometric mathematics are used
to calculate the two lines degrees
Then both degrees are compared
to show if both lines agree ( // or \\ )
or if they disagree ( /\ or \/ )
SETTINGS
(SQZDiver) Show degrees : Show degrees of each Squeeze Momentum Divergence
lines to the x-axis.
(SQZDiver) Show desviation labels : Whether to show
or not desviation labels for the Squeeze Momentum Divergences.
(SQZDiver) Show desviation lines : Whether to show
or not desviation lines for the Squeeze Momentum Divergences.
(ADX) Smoothing
(ADX) DI Length
(ADX) key level
(ADX) Print : Whether to show
or not scaled ADX line
(SQZMOM) BB Length
(SQZMOM) BB MultFactor
(SQZMOM) KC Length
(SQZMOM) KC MultFactor
(SQZMOM) Use TrueRange (KC)
(SQZMOM) Print : Whether to show
or not Squeeze Momentum indicator.
WARNING
Some securities and timeframes might output degrees
too next to zero.
The code might need to be tweaked to meet your needs.
USAGE
One strategy is to sell when you are in a long entry
when you find out that the price slope is upwards ( / )
while the lb smilb slope is downwards: ( \ )
E.g. You will see:
/
\
on the indicator.
Why?
Because it might signal you that the price is
going to correct downwards soon.
FEEDBACK 1
Please let me know if there is any
other strategy based on the red side of
LB Squeeze Momentum
so that I might add support for it in the future.
FEEDBACK 2
Calculating degrees in a chart
with a different x-axis scale
is a nightmare
that's why I did not a range settings
so that values next to zero are
converted into zero
and thus showing an horizontal line.
Feedback is welcome on this matter.
EXTRA 1
If you turn off showing the divergence lines
and if you turn off showing the divergence labels
you almost get what TradingLatino user uses
as its default momentum indicator.
EXTRA 2
Optionally this indicator can show you
a rescaled ADX (it only works properly on 2020 Bitcoin charts)
ABOUT COLOURS
TradingLatino user has both dark green and light green
inverted compared to this LB SQZMOM chart.
CREDITS
I have reused and adapted some code from
'Squeeze Momentum Indicator' study
which it's from TradingView LazyBear user.
I have reused and adapted some code from
'Directional Movement Index + ADX & Keylevel Support' study
which it's from TradingView console user.

Price Action Trading System v0.3 by JustUncleL with modifcationsThe base of this script is the Price Action Trading System from JustUncle .
I have first combined it with script ADX and DI by BeikabuOyaji to indicate when the +DI is above the -DI and the ADX is above 20. This is represented by crosses at the top of the page: green indicating that the +DI is above the -DI and ADX above 20, and red if -DI is above the +DI and ADX above 20. If the ADX is increasing in slope while the +DI is above the -DI, an up green arrow is shown at the bottom of the page, indicating an increase in this trend, and the slope of the ADX is increasing and the -DI is above the +DI, a down arrow is shown at the bottom. One could think to a green cross with a green up arrow as a potential buy opportunity, and a red cross with a red down arrow as a potential sell opportunity.
Next, I have combined this script with the Indicator: WaveTrend Oscillator from Lazybear . If the oscillator has readings below -45 and the slope of the line is increasing, a green diamond appears above the chart. This indicates a potential buy opportunity. If the oscillator has readings above 50 and the slope of the line is decreasing, a red diamond appears above the chart. This indicates a potential sell opportunity. Now if the slope of the oscillator is rising significantly but does not hit the -45 threshold to start its increase, but is negative in value, a green flag appears at the top of the page. This represents a potential buy opportunity. If the slope of the oscillator is significantly decreasing and is positive in value, a red flag appears at the bottom of the page. This represents a potential sell opportunity.
The base of this script, the Price Action Trading System v0.3 by JustUncle , has many of its own features that I have kept. If the MACD is positive, the background colour is green. If it is negative, the colour is red. If the CCI and RSI indicate an oversold opportunity and the MACD is positive, you get an up olive arrow below the chart. If they indicate an overbought opportunity and the MACD is negative, you get a red down arrow above the chart. If the CCI value stays oversold after a green arrow, the candle chart turns turquoise, and if overbought, turns black after a red arrow.
You can use these indicators in combination to help you with your trading strategy.

Abyss Protocol OneAbyss Protocol One — Momentum Exhaustion Trading System
Overview
Abyss Protocol One is a momentum exhaustion indicator designed to identify high-probability reversal points by detecting when price momentum has reached extreme levels. It combines Chande Momentum Oscillator (CMO) threshold signals with dynamic volatility-adjusted bands and multiple protective filters to generate buy and sell signals.
Core Concept
The indicator operates on the principle that extreme momentum readings (CMO reaching ±80) often precede mean reversion. Rather than chasing trends, Abyss Protocol waits for momentum exhaustion before signaling entries and exits.
Key Components
1. Dynamic Bands (Money Line ± ATR)
Center line uses linear regression (Money Line) for smooth trend representation
Bands expand and contract based on Bollinger Band Width Percentile (BBWP)
Low volatility (BBWP < 30): Tighter bands using lower multiplier
High volatility (BBWP > 70): Wider bands using higher multiplier
Bands visually adapt to current market conditions
2. CMO Exhaustion Signals
BUY Signal: CMO drops below -80 (oversold/momentum exhaustion to downside)
SELL Signal: CMO rises above +80 (overbought/momentum exhaustion to upside)
Thresholds are configurable for different assets and timeframes
3. ADX Filter
Signals only fire when ADX exceeds minimum threshold (default: 22)
Ensures there's enough directional movement to trade
Prevents signals during choppy, directionless markets
4. Band Contraction Filter
Calculates band width percentile rank over configurable lookback
When bands are contracted (below 18th percentile), ALL signals are blocked
Prevents trading during low-volatility squeeze periods where breakout direction is uncertain
5. Consecutive Buy Limit
Maximum of 3 consecutive buys allowed before a sell is required
Prevents overexposure during extended downtrends
Counter resets when a sell signal fires
6. Underwater Protection
Tracks rolling average of recent entry prices (last 10 entries within 7 days)
Blocks sell signals if current price is below average entry price
Prevents locking in losses during drawdowns
7. Signal Cooldown
Minimum 5-bar cooldown between signals
Prevents rapid-fire signals during volatile swings
8. Extreme Move Detection
Detects when price penetrates beyond bands by more than 0.6 × ATR
Extreme signals can bypass normal cooldown period
Fire intra-bar for faster response to capitulation/blow-off moves
Still respects max consecutive buys and underwater protection
Visual Features
Trend State Detection
The indicator classifies market conditions into six states based on EMA stack, price position, and directional indicators:
STRONG UP: Full bullish alignment (EMA stack + price above trend + bullish DI + ADX > threshold)
UP: Moderate bullish conditions
NEUTRAL: No clear directional bias
DOWN: Moderate bearish conditions
STRONG DOWN: Full bearish alignment
CONTRACTED: Bands squeezed, volatility low
ADX Trend Bar
Colored dots at chart bottom provide instant trend state visibility:
Lime = Strong Uptrend
Blue = Uptrend
Orange = Neutral
Red = Downtrend
Maroon = Strong Downtrend
White = Contracted
Volume Spike Highlighting
Purple background highlights candles where volume exceeds 2x the 20-bar average, helping identify institutional activity or significant market events.
Signal Labels
Buy labels show consecutive buy count (e.g., "BUY 2/3"), price, and CMO value
Sell labels show consecutive sell count, price, and CMO value
Extreme signals display in distinct colors (cyan for buys, fuchsia for sells)
Signal candles turn bright blue for easy identification
Info Panel
Real-time dashboard displaying:
Current trend state
CMO value with threshold status
CMO thresholds (buy/sell levels)
ADX with directional indicator (▲/▼) and signal eligibility
BBWP percentage
Buy/Sell counters
Average entry price (with underwater shield indicator 🛡 when protected)
Price position relative to Money Line
Band width percentile rank
Extreme move status
Signals status (OPEN/BLOCKED)
Recommended Use
Timeframe: 5-15 minute charts (parameters tuned for this range)
Best suited for: Assets with regular oscillations between overbought/oversold extremes
Trading style: Mean reversion, momentum exhaustion, scaled entries
Parameters Summary
Money Line Length: 12 — Smoothing for center line
ATR Length: 10 — Volatility measurement
Band Multiplier (Low/High Vol): 1.5 / 2.5 — Dynamic band width
CMO Length: 9 — Momentum calculation period
CMO Buy/Sell Threshold: -80 / +80 — Signal trigger levels
ADX Min for Signals: 22 — Minimum trend strength
Signal Cooldown: 5 bars — Minimum bars between signals
Max Consecutive Buys: 3 — Position scaling limit
Band Contraction Threshold: 18th %ile — Low volatility filter
Band Contraction Lookback: 188 bars — Percentile calculation period
Extreme Penetration: 0.6 × ATR — Threshold for extreme signals

Tamil | Trend Signal Dashboard for trading“Tamil | Trend Signal in Dashboard” is a multi-confirmation trend and signal tool that combines Supertrend, RSI/ADX trend strength, and dual QQE into one clean dashboard on the chart. It only prints STRONG BUY / STRONG SELL when all components align, and it also gives clear, rule-based exit signals.
⸻
What it uses
• RSI + ADX + ATR trend block
• ADX (with custom length & threshold) to measure trend strength
• +DI / –DI to define bullish or bearish direction
• Optional session filter so signals only appear in your trading window
• Custom Supertrend
• ATR-based bands with adjustable period & multiplier
• Plots trend line on chart and shows Buy/Sell flip labels when Supertrend reverses
• Dual QQE MOD engine
• Two QQE/RSI streams (primary & secondary)
• Bollinger bands around QQE line to confirm true momentum breakouts
• Defines QQE Bullish / Bearish states
• Secondary RSI Histogram logic
• Tracks RSI distance from the 50 line
• Detects “peak & decline” on the histogram for momentum-based exits
⸻
Signals & Exits
• Entry
• Strong Buy: Supertrend bullish + strong ADX + DI bullish + QQE bullish
• Strong Sell: Supertrend bearish + strong ADX + DI bearish + QQE bearish
• Background is softly colored green/red while alignment is active
• Exit (configurable)
• Alignment lost (trend components no longer agree), and/or
• First peak-and-decline in the secondary RSI histogram
• Shows Exit Buy / Exit Sell markers and fires dedicated alerts
⸻
Dashboard & Alerts
A compact table in the top-right shows live status of:
• Supertrend
• ADX value & strength check
• Direction from DI
• QQE state
• Secondary RSI histogram slope
• Overall Alignment and current Signal (Hold / Strong Buy / Strong Sell / Exit)

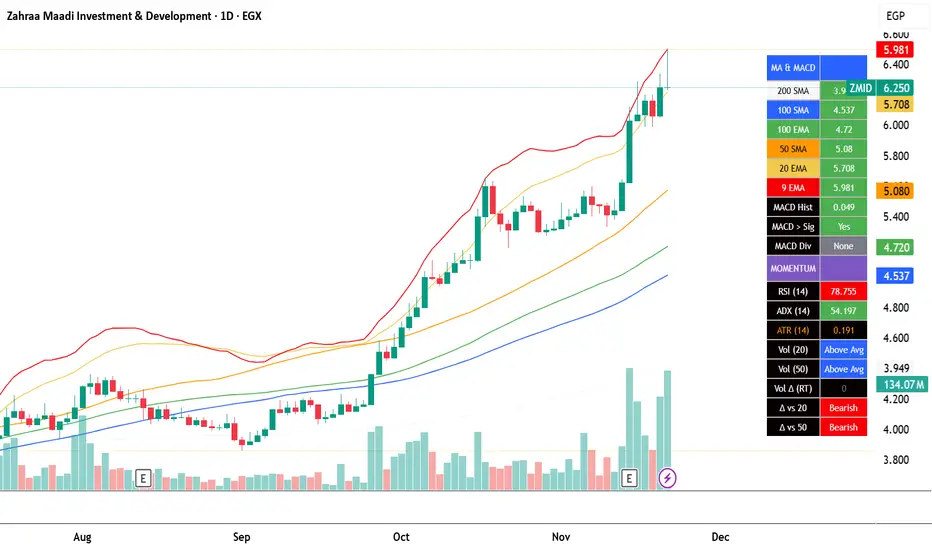
EGX Monitor Dashboard By Biscuits_Trading_Solutionsلوحة مراقبة البورصة المصرية من Biscuits_Trading_Solutions
نظرة عامة:
لوحة مراقبة البورصة المصرية هي أداة تحليل فني شاملة مصممة لتوفير نظرة فورية وواضحة على صحة السوق. تجمع الأداة مؤشرات رئيسية مختارة بعناية لتناسب السوق المصري لتوفر عليك عبء إضافة عدد كبير من المؤشرات في وقت واحد على الشاشة - بما في ذلك متوسطات متحركة، MACD، RSI، ADX، ATR، وتحليل متقدم لحجم التداول (دلتا) - في جدول واحد وسهل القراءة على الرسم البياني. مثالية للمتداولين الذين يحتاجون لتقييم الاتجاه، الزخم، وديناميكيات الحجم في لمحة دون تشويش الشاشة.
English Version is below ⬇️⬇️
المميزات الرئيسية:
* لوحة متابعة للمتوسطات المتحركة: تتابع وتلون وضع السعر بالنسبة لـ 6 متوسطات متحركة رئيسية (200 بسيط، 100 بسيط/آسي، 50 بسيط، 20 آسي، 9 آسي).
* تحليل متقدم لـ MACD: تعرض قيمة هِستوجرام MACD، حالة التقاطع بين MACD وخط الإشارة، وتكشف عن انحرافات صعودية محتملة (Bullish Divergence).
* مقاييس الزخم: تتضمن قراءات RSI و ADX، مع تلوينها للإشارة إلى مناطق الشراء المفرط والبيع المفرط وقوة الاتجاه.
تحليل متطور للحجم:
*دلتا الحجم/السيولة (الفارق بين حجم الشراء وحجم البيع).
* الحجم مقارنة بمتوسطه المتحرك لـ 20 و 50 فترة (لمقارنته بفترة متوسطة 20 شمعة وطويلة 50 شمعة)
* دلتا الحجم مقارنة بمتوسطها المتحرك لـ 20 و 50 فترة لقياس ضغط البيع والشراء.
عرض مرئي نظيف : جميع البيانات معروضة في جدول شبه شفاف يمكن وضعه في أي مكان على الرسم البياني. يتم أيضًا رسم المتوسطات المتحركة بخفة للاستدلال البصري.
مدخلات قابلة للتخصيص : جميع أطوال المؤشرات، المضاعفات، وموضع الجدول قابلة للتعديل كليًا من الإعدادات.
إزاحة الشمعة : تسمح لك بمشاهدة قراءات المؤشر من عدد محدد من الشمعات السابقة، مما يفيد في تحليل الظروف السابقة.
طريقة الاستخدام:
* تقييم الاتجاه: انظر إلى جدول المتوسطات المتحركة. وجود عدة خلايا خضراء (السعر فوق المتوسط) يشير إلى اتجاه صاعد قوي، بينما يشير اللون الأحمر إلى اتجاه هابط.
* تأكيد الزخم: تحقق من مؤشر RSI (شراء مفرط >70، بيع مفرط <30) و ADX (اتجاه قوي >25) لفهم سياق الزخم.
*تأكيد الحجم: استخدم أعمدة الحجم لتأكيد الحركات. حركة السعر المصحوبة بحجم "أعلى من المتوسط" ودلتا "صعودي" تكون أكثر أهمية.
إشارات الدخول/الخروج:
* انحراف MACD الصعودي يمكن أن يشير إلى انعكاس محتمل.
* وجود "نعم" لـ "MACD > Sig" يؤكد الزخم الصعودي.
* قيم ATR المرتفعة تشير إلى زيادة التقلب، وغالبًا ما ترافق الاتجاهات القوية أو اختراقات المستويات.
الإعدادات:
ما عليك سوى إضافة المؤشر إلى الرسم البياني الخاص بك. ستظهر اللوحة تلقائيًا. يمكنك ضبط جميع المعاملات (أطوال المتوسطات المتحركة، إعدادات الحجم، مكان الجدول) في تبويب "الإدخالات" في نافذة المؤشر لتناسب أسلوب تداولك.
إخلاء مسؤولية: جميع الإشارات التي تظهر ليست دعوة للبيع والشراء، هذا المحتوى تعليمي يساعدك على قراءة الشاشة بشكل أفضل، وقرارك الاستثماري يعود لك وحدك.
---
EGX Monitor Dashboard By Biscuits_Trading_Solutions
Overview :
The EGX Monitor Dashboard is a comprehensive technical analysis tool designed to provide a clear and immediate overview of the market's health. It consolidates key indicators, carefully selected for the Egyptian market, saving you the burden of adding a large number of indicators to your screen at once —including moving averages, MACD, RSI, ADX, ATR, and advanced volume delta analysis—into a single, easy-to-read table on your chart. Perfect for traders who need to assess trend, momentum, and volume dynamics at a glance without cluttering their screen.
Key Features :
* Moving Average Dashboard: Tracks and color-codes the price position relative to 6 key moving averages (200 SMA, 100 SMA/EMA, 50 SMA, 20 EMA, 9 EMA).
* Advanced MACD Analysis: Displays the MACD histogram value, the MACD vs. Signal line crossover state, and detects potential bullish divergences.
* Momentum Gauges: Includes RSI and ADX readings, color-coded for overbought/oversold and trend strength conditions.
Advanced Volume/Liquidity Analysis:
* Volume Delta (the difference between buying and selling volume).
* Volume compared to its 20 and 50-period moving averages (for medium-term 20-bar and long-term 50-bar comparisons).
* Volume Delta compared to its 20 and 50-period moving averages to measure buying/selling pressure.
Clean Visualization: All data is presented in a semi-transparent table that can be positioned anywhere on the chart. The moving averages are also plotted lightly for visual reference.
Customizable Inputs: All indicator lengths, multipliers, and the table position are fully adjustable in the settings.
Bar Offset: Allows you to view the indicator readings from a specific number of bars back, useful for analyzing past conditions.
How to Use:
* Trend Assessment: Look at the MA table. A cluster of green "Bullish" cells (price above MA) indicates a strong uptrend, while red indicates a downtrend.
* Momentum Confirmation: Check the RSI (overbought >70, oversold <30) and ADX (strong trend >25) for momentum context.
* Volume Confirmation: Use the volume columns to confirm moves. A price move with "Above Avg" volume and "Bullish" Delta is more significant.
Entry/Exit Clues:
* A "Bullish" MACD divergence can signal a potential reversal.
* A "Yes" for "MACD > Sig" confirms bullish momentum.
* High ATR values indicate increased volatility, often accompanying strong trends or breakouts.
Configuration:
Simply add the indicator to your chart. The dashboard will appear automatically. You can adjust all parameters (MA lengths, volume settings, table position) in the indicator's "Inputs" tab to suit your trading style.
Disclaimer: All signals that appear are not an invitation to buy or sell. This content is educational and is intended to help you read the screen better. Your investment decision is yours alone.
Reddington Trading Bot Adaptive Signals# Reddington Trading Bot Adaptive Signals — mashup disclosure & user guide
## What it is
**Reddington Trading Bot Adaptive Signals** is a **manual trading** overlay that aggregates multiple entry logics (Supertrend, Bollinger, MACD, Counter-Trend, Scalp) behind a single, adaptive filter stack (EMA trend, ADX strength, ATR regime, volume, RSI band, sessions, candle confirmation).
When a setup passes all gates, the script **marks the bar** with a label (e.g., `ST Long ####`) and plots **Entry / SL / TP / Half-TP** reference lines for discretionary execution.
> This is an **indicator**, not an autostrategy. It does not place orders or manage positions.
---
## Mashup disclosure — what’s combined and why
This script is a **mashup** designed to reduce false positives by requiring **confluence** across trend, momentum, volatility, and liquidity:
* **Trend filter (EMAs)** — `ema_short > ema_long` for longs and vice versa for shorts.
*Why:* prevents fighting the dominant direction.
* **Supertrend direction** — uses `ta.supertrend()` to pick continuation states.
*Why:* captures impulse while controlling whipsaw.
* **Bollinger context** — upper/lower band interaction for breakout/overshoot logic.
*Why:* detects expansion and extreme deviations.
* **MACD cross (12/26/9)** — confirms momentum turns with `ta.macd`.
*Why:* times transitions into continuation.
* **RSI band** — between configurable overbought/oversold levels.
*Why:* avoids chasing exhaustion.
* **ADX strength (manual DI+/DI− → DX → RMA)** — trend quality gate.
*Why:* filters out chop when trend quality is weak.
* **ATR regime window** — ATR between low/high multiples of its baseline.
*Why:* trades when volatility is “tradable”, not too thin or too wild.
* **Volume filter** — volume ≥ SMA(volume, N).
*Why:* favors liquid conditions and cleaner ticks.
* **Session gate (Asia/EU/US)** — run only in chosen UTC windows.
*Why:* aligns with hours of depth, fewer fake breaks.
* **Candle confirmation** — simple **bar-over-bar**/**bar-under-bar** check.
*Why:* a last safety check to avoid immediate reversals.
The **strength** of the mashup is that each module covers a blind spot of the others, so a signal only prints when *trend + momentum + volatility + liquidity* line up.
---
## Non-repaint & timing notes
* The script **does not** use `request.security()`; all logic is computed on the active chart TF with standard Pine series semantics.
* Conditions can evolve **intra-bar**. For conservative usage, **confirm on bar close** before executing.
* Plotted levels (Entry/SL/TP/Half-TP) are reference guides; fills depend on your execution and venue slippage.
---
## Inputs (concise)
* **Supertrend multiplier**; **ADX threshold**; ATR low/high multiples; **RSI overbought/oversold**.
* **Sessions**: enable/disable Asia, Europe, America (UTC).
* Internal periods are **auto-scaled** from a 300-sec base via `timeframe.in_seconds()`, adapting the signal windows to your chart TF.
---
## Entry families (built-in)
* **ST (Supertrend continuation)**
Long: ST up + EMA short>long + below BB upper + ADX>th + volume/ATR/RSI ok + candle confirm + session.
Short: symmetric.
* **BB (Bollinger context)**
Long: close > BB upper + quality gates; Short: close < BB lower + quality gates.
* **MACD (momentum cross)**
Cross up/down with quality gates and candle confirm.
* **CT (Counter-trend poke)**
Long: close < BB lower with distance to middle > 1% and RSI<50; Short: mirror.
*Use sparingly; relies on strong quality gates to avoid catching knives.*
* **SC (Scalp EMA5/EMA10 cross)**
With mid-RSI, ADX>20, and all quality gates.
**Position state** is tracked internally (series vars) so that once in a trade, the script monitors **SL**, **Half-TP**, and **TP** hits and prints corresponding labels.
---
## On-chart visuals
* **Entry/SL/TP/Half-TP** lines (cross style), visible **only while a position is tracked**.
* **Bar labels** on entry (` Long/Short ####`), on SL/TP/Half events.
* A small **session/ticker/TF tag** on the last bar.
---
## How to trade it (suggested checklist)
1. **Wait for the label** (e.g., `ST Long …`) and check that all quality filters are green (they are enforced inside the code).
2. Execute **at your discretion** (market/limit); the script’s **Entry** level is the reference (close or your own limit).
3. Place **SL/TP** according to the printed levels; optionally scale at **Half-TP**.
4. Prefer **bar-close confirmation** on faster TFs to reduce intra-bar noise.
5. Respect your own risk rules (position sizing, max daily loss, news filter).
---
## Recommended timeframes & markets
* Designed for **intraday** use (e.g., **5m–15m**) where volume and sessions matter.
* Works on crypto perpetuals/spot and liquid FX/CFD symbols; threshold tuning may be required per venue.
---
## Limitations & tips
* It’s **one** layer of confirmation; don’t force trades in flat liquidity or into major news.
* CT/Scalp entries are more sensitive to noise; if you prefer higher selectivity, raise **ADX threshold** and narrow **ATR window**.
* Because conditions can change **within a bar**, **alerts** are best set to trigger **on bar close** if you add `alertcondition()` hooks (not included in this base).
---
## Disclaimer
This script is for **educational purposes only** and does **not** constitute financial advice, investment recommendation, solicitation, or an offer to buy/sell any instrument. Trading involves risk; past results do not guarantee future performance. You are solely responsible for your trading decisions and outcomes.

Flow Control Oscillator (FCO)Flow Control Oscillator (FCO)
The Flow Control Oscillator (FCO) is a momentum-based indicator that combines volume analysis and money flow to determine who is in control of the market—buyers or sellers—and how strong that control is. Unlike pure price-based oscillators, FCO integrates both price action and volume distribution to provide a more complete picture of market dynamics.
How It Works
Core Components:
Money Flow Index (MFI) -
Scaled to -1 to +1 range
Measures the flow of money into and out of an asset
Identifies buying and selling pressure based on price and volume
Chaikin Money Flow (CMF) -
Already in -1 to +1 range
Measures the accumulation/distribution of volume
Shows whether volume is accumulating (buying) or distributing (selling)
Combined Flow Control Line (FCO Line) -
Equal-weighted composite of MFI and CMF
Smoothed with SMA (default: 3 periods)
Values above 0 = Buyers in control
Values below 0 = Sellers in control
Signal Line -
WMA of the FCO line (default: 6 periods)
Used for timing entries and confirming momentum shifts
Momentum Histogram-
Shows the rate of change in buyer/seller control
Weighted by ADX (Average Directional Index) when enabled
Larger bars = stronger momentum
ADX weighting filters out choppy, unreliable signals
Key Zones
Neutral Zone (-0.3 to +0.3): Balanced market, low conviction
Healthy Trend Zone (±0.3 to ±0.7): Clear control without exhaustion
Warning Zone (±0.7 to ±1.0): Extended, approaching exhaustion
Extreme Zone (beyond ±1.0): Overbought/oversold, reversal likely
What To Look For
Reversal Setups:
FCO in extreme zone (beyond ±1.0)
FCO crosses Signal line in opposite direction
Momentum histogram shrinking (weakening pressure)
Interpretation: Buyers or sellers are exhausted and losing control
Trend Strength Setups:
FCO crosses zero line (control shift)
Momentum histogram growing in the same direction
ADX confirms strong trend (no orange background)
Signal line moving in same direction as FCO
Interpretation: New control being established with building momentum
Divergences:
Price makes new high/low but FCO doesn't confirm
Indicates weakening momentum despite price movement
Early warning of potential reversal
Choppy Market Warning:
Orange background (ADX < 20)
Small momentum bars regardless of FCO position
Interpretation: Weak trend, avoid trading or use tight stops
Best Practices:
Use with context: Combine with support/resistance levels (like VWAP) for confluence
Multi-timeframe confirmation: Check higher timeframe FCO for overall bias
Wait for confirmation: Let signals develop rather than predicting turns
Respect extreme zones: Best reversal opportunities occur when FCO is beyond ±1.0
Filter with ADX: Pay attention to background coloring—avoid choppy conditions
The indicator includes comprehensive alert conditions for:
Reversal setups (extreme + cross + weakening momentum)
Trend strength signals (zero cross + growing momentum + strong ADX)
FCO/Signal crossovers
Extreme overbought/oversold conditions
Control shifts (buyers/sellers taking control)

OBTrendDelta Volume Delta & Order Block SuiteOB Trend Delta V1 - Order Block & Volume Delta Indicator
━━━━━━━━━━━━━━━━━━━━━━━━━━━━━━━━━━━━━━━━━━━━━━━━━━━━━━━━━━━━━━━━━━━━━━
📊 OVERVIEW
OB Trend Delta V1 is a technical indicator that combines Order Blocks analysis (institutional support/resistance zones) with Volume Delta (buying vs selling pressure) to provide insights on setup quality and market dynamics.
The indicator visually displays zones of interest, volume pressure, and a quality scoring system to assist in technical analysis of any market.
━━━━━━━━━━━━━━━━━━━━━━━━━━━━━━━━━━━━━━━━━━━━━━━━━━━━━━━━━━━━━━━━━━━━━━━
🎯 CORE CONCEPT
▸ ORDER BLOCKS
Order Blocks are price zones where large institutions executed significant operations. These areas tend to act as support (Bull OB) or resistance (Bear OB) when price returns to them.
How to interpret:
🟢 Bull Order Block: Green zone where institutional buyers entered strongly → Potential support
🔴 Bear Order Block: Red zone where institutional sellers entered strongly → Potential resistance
▸ VOLUME DELTA
Volume Delta measures the difference between buying and selling volume in each candle, revealing which side of the market is dominating.
How to interpret:
✅ Positive Delta (green histogram): Buyers dominating → Bullish pressure
❌ Negative Delta (red histogram): Sellers dominating → Bearish pressure
━━━━━━━━━━━━━━━━━━━━━━━━━━━━━━━━━━━━━━━━━━━━━━━━━━━━━━━━━━━━━━━━━━━━━━
📈 WHAT THE INDICATOR SHOWS
1️⃣ TREND DETECTION
The indicator identifies the main market direction using moving averages and trend strength analysis (ADX), visually highlighting when the market is in:
Uptrend (Bullish Trend)
Downtrend (Bearish Trend)
Ranging (Sideways market/no clear trend)
2️⃣ SETUP QUALITY SYSTEM
Each trading opportunity is evaluated on 6 independent criteria:
✅ Price inside a valid Order Block
✅ Volume Delta confirming the direction
✅ Order Block is recent and "fresh"
✅ Few previous retests (OB still strong)
✅ Volume confirmation above average
✅ Favorable market regime
Setup Quality Score: 0 to 6 points
Score 6: Perfect setup (all criteria met)
Score 5: Excellent setup (5 of 6 criteria)
Score 4: Good setup (4 of 6 criteria)
Score 0-3: Weak setup or forming
━━━━━━━━━━━━━━━━━━━━━━━━━━━━━━━━━━━━━━━━━━━━━━━━━━━━━━━━━━━━━━━━━━━━━━━
🔧 VISUAL COMPONENTS IN THE INDICATOR
▸ VOLUME DELTA HISTOGRAM
🟢 Green Bars: Buying volume > selling volume (bullish pressure)
🔴 Red Bars: Selling volume > buying volume (bearish pressure)
📊 Intensity: The larger the bar, the greater the pressure
▸ ORDER BLOCK ZONES
🟢 Green Boxes (Bull OB): Institutional support zones
🔴 Red Boxes (Bear OB): Institutional resistance zones
🔄 Projection: OBs are extended to the right until invalidated
▸ SETUP QUALITY SIGNALS
📊 Score Labels: Show setup quality (Q4, Q5, Q6)
• Q6: Perfect setup (all 6 criteria met)
• Q5: Excellent setup (5 of 6 criteria)
• Q4: Good setup (4 of 6 criteria)
━━━━━━━━━━━━━━━━━━━━━━━━━━━━━━━━━━━━━━━━━━━━━━━━━━━━━━━━━━━━━━━━━━━━━━
💡 HOW TO INTERPRET THE INFORMATION
Observe trend direction (EMAs and ADX)
Identify active Order Blocks:
• Bull OBs (green): Potential support zones
• Bear OBs (red): Potential resistance zones
Analyze Volume Delta:
• Green bars: Dominant buying pressure
• Red bars: Dominant selling pressure
Check Setup Quality Score:
• Q5-Q6: Setups with multiple confirmations
• Q4: Setup with moderate confirmations
• Q0-Q3: Few criteria met
⚠️ NOTE: The indicator provides technical information. Trading decisions are exclusively yours.
━━━━━━━━━━━━━━━━━━━━━━━━━━━━━━━━━━━━━━━━━━━━━━━━━━━━━━━━━━━━━━━━━━━━━━━
📊 TECHNICAL CHARACTERISTICS
▸ RECOMMENDED TIMEFRAMES
5 minutes: Scalping / Fast day trading
15 minutes: Day trading
1 hour: Swing trading
4 hours: Medium-term positions
Daily: Long-term analysis
▸ COMPATIBLE MARKETS
✅ Forex (all pairs)
✅ Cryptocurrencies (BTC, ETH, altcoins)
✅ Indices (S&P500, Nasdaq, etc)
✅ Commodities (Gold, Oil, etc)
✅ Stocks and CFDs
⚠️ Requirement: Volume data is necessary for Volume Delta calculation
━━━━━━━━━━━━━━━━━━━━━━━━━━━━━━━━━━━━━━━━━━━━━━━━━━━━━━━━━━━━━━━━━━━━━━━
⚠️ IMPORTANT WARNINGS
▸ EDUCATIONAL USE
📊 This indicator is an educational technical analysis tool
⚠️ The indicator does NOT provide buy or sell signals
⚠️ The indicator does NOT guarantee results
⚠️ All trading decisions are your responsibility
▸ RISK MANAGEMENT
⚠️ Always use proper risk management
⚠️ Never trade with money you cannot afford to lose
⚠️ Test the indicator on a demo account before using real money
⚠️ Combine with your own analysis and strategy
▸ LIMITATIONS
❌ No indicator is 100% accurate
❌ Markets can behave unpredictably
❌ Requires confirmation with other analyses
❌ Volume Delta requires reliable volume data
▸ DISCLAIMER
📢 This indicator is educational and does not constitute investment advice.
The indicator shows technical information, not trading signals
Past results do not guarantee future results
Trading involves risk of total capital loss
You are 100% responsible for your trading decisions
Consult a financial professional before investing
━━━━━━━━━━━━━━━━━━━━━━━━━━━━━━━━━━━━━━━━━━━━━━━━━━━━━━━━━━━━━━━━━━━━━━━
📚 ADVANCED CONCEPTS
▸ WHAT ARE ORDER BLOCKS?
Order Blocks represent zones where "smart money" (institutions, whales) accumulated or distributed positions. When price returns to these zones, there is high probability of reaction due to:
Pending limit orders
Psychological levels
Institutional value zones
▸ VOLUME DELTA VS NORMAL VOLUME
Normal volume shows only QUANTITY of trades.
Volume Delta shows DIRECTION (who is winning the battle):
High volume + Positive delta = Strong accumulation 🚀
High volume + Negative delta = Strong distribution 📉
▸ MARKET REGIME (ADX)
ADX measures TREND STRENGTH:
ADX > 25: Strong trend (best time to trade)
ADX < 20: Sideways/ranging market (avoid trades)
━━━━━━━━━━━━━━━━━━━━━━━━━━━━━━━━━━━━━━━━━━━━━━━━━━━━━━━━━━━━━━━━━━━━━━━
✅ BEFORE USING THIS INDICATOR
Make sure you:
☑ Understand the Order Blocks concept
☑ Know how to interpret Volume Delta
☑ Understand trend analysis
☑ Have your own trading strategy
☑ Know risk management
☑ Understand the indicator does NOT provide buy/sell signals
☑ Are aware of trading risks
☑ Test on demo account before using real money
━━━━━━━━━━━━━━━━━━━━━━━━━━━━━━━━━━━━━━━━━━━━━━━━━━━━━━━━━━━━━━━━━━━━━━━
📊 USE AS AN ANALYSIS TOOL, NOT AS AN AUTOMATIC DECISION SYSTEM!
The indicator provides information. You make the decisions.
―――――――――――――――――――――――――――――――――――――――――
Version: 1.0 | Type: Order Block + Volume Delta + Trend Analysis | Update: October 2024

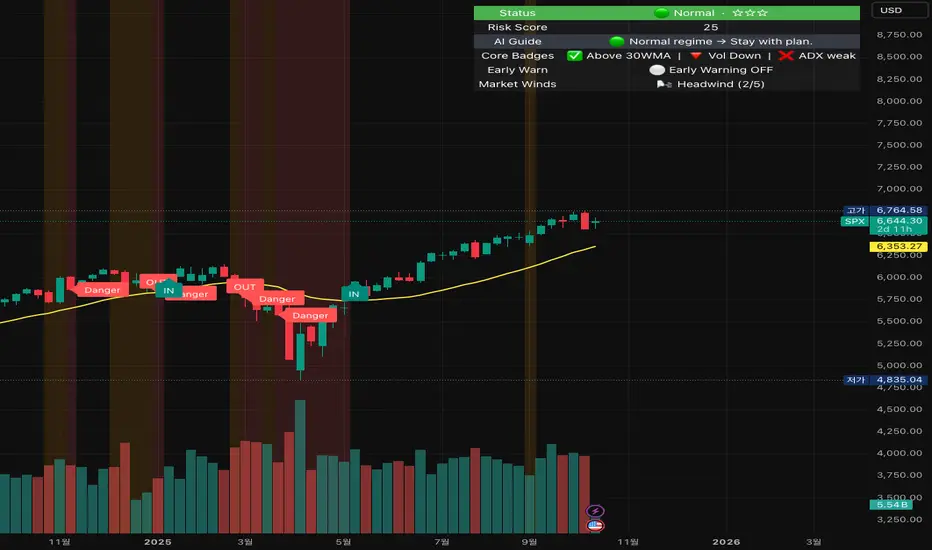
Crash Survival Indicator (SPX, Weekly/Daily)Short description
SPX-focused risk context tool using 30WMA/ATR/ADX and distance to 30WMA, with optional Hindenburg-Omen breadth and macro add-ons. Weekly is primary; Daily provides early-warning. Educational only.
Full description (English first)
What it is
Crash Survival Indicator (CSI) is a rules-based risk context indicator for the S&P 500 index (SPX). It helps keep decisions data-driven during stress by combining four weekly conditions into a weighted risk score and presenting them in a readable dashboard. Optional breadth (Hindenburg Omen cluster proxy) and macro add-ons give additional context. This is not a buy/sell system.
Why it’s original and useful
Weekly core with confirmation: Four classic conditions (30WMA regime, ATR(14) trend, ADX(14) > 20 & rising, and % distance from 30WMA) feed a 0–100 score. A 2-of-3 gate (WMA down / ATR up / ADX>20↑) must confirm before “Danger,” reducing false spikes.
Daily Early-Warning: A separate daily preview flags conditions approaching the Danger threshold (with a streak filter). It’s a heads-up only, not a timeframe switch.
Scope control to avoid confusion: Signals (labels/alerts) are restricted to SPX on Weekly/Daily by design. The dashboard can be shown SPX-only or on all symbols (configurable).
Clarity for all users: Beginner card view (plain badges) and Pro table view (detailed chips) improve readability without hiding logic.
How it works (mechanics)
Weekly core (primary frame)
30WMA regime: price vs 30-week WMA; IN/OUT labels on crosses.
ATR(14): rising ATR counts as volatility stress.
ADX(14): risk weight when ADX > 20 and rising.
Distance to 30WMA: % deviation flags potential overheat.
Scoring & thresholds: Weighted sum → Caution ≥ 40, Danger ≥ 60 (defaults). Danger also requires the 2-of-3 gate above.
Daily Early-Warning: Uses daily versions of the same ideas to detect near-Danger conditions with a streak requirement (heads-up only).
Optional breadth (Hindenburg Omen proxy): Elevated new highs and new lows while the NYSE Composite is above its 50DMA, with deteriorating breadth momentum; requires cluster confirmation to reduce noise.
Optional macro add-ons: VIX regime, DXY strength, credit stress (HYG/LQD vs MA), and TNX trend each add adjustable weights.
Inputs (overview)
Scope & Mode: SPX primary/alt tickers; signal restriction to SPX + Weekly/Daily; dashboard visibility (SPX-only vs all symbols); Beginner or Pro display.
Label Policy: Weekly-only / Weekly-core + Daily-early (default) / All (W/D); lookback windows and minimum bar gaps to prevent clutter.
Scoring: Weights for 30WMA down, ATR up, ADX>20↑, Overheat; Caution/Danger thresholds; Overheat % (distance).
Hindenburg Omen (optional): NYSE Composite and High/Low/AD series; cluster requirement.
Macro add-ons (optional): Symbols + weights for VIX, DXY, HYG, LQD, TNX.
Early Warning (Daily): Near-Danger buffer and streak length.
Visuals & Alerts: Background shading, labels on/off, font size, dashboard position, runtime
alerts.
Alerts (contextual; not trade signals)
OUT — 30WMA Down Break (Weekly)
IN — 30WMA Reclaim (Weekly)
Risk ≥ Danger + 2-of-3 Gate
Hindenburg Omen Cluster detected
Early Warning (Daily near Danger, streak)
Alerts provide context only. They are not buy/sell instructions.
Intended use and limitations
Use the Weekly panel for decisions; treat Daily Early-Warning as a heads-up.
Best used as risk framing alongside your own process (position sizing, liquidity, event risk).
Breadth/macro inputs depend on your data source; if unavailable, keep add-ons off.
No forward-looking data or lookahead; designed to avoid repainting.
Disclaimer
For educational purposes only. Not financial advice, not an investment recommendation, and not a solicitation to buy or sell any security. Past performance does not guarantee future results. Users are solely responsible for their decisions and regulatory compliance.
Optional Korean addendum (append after English)
한국어 안내 요약: 본 지표는 위기 상황에서 감정보다 데이터를 우선할 수 있도록 리스크 맥락을 제공합니다. 주봉이 핵심, 일봉은 조기경보(Heads-up)이며, 매수/매도 신호가 아닙니다. 심프님의 프로토타입 철학을 살리되 SPX 한정 신호, 라벨/알림 정책, 선택형 오멘/매크로 기능, 초보/프로 대시보드 등 가독성을 개선했습니다. 투자 판단과 책임은 전적으로 사용자에게 있습니다.
Privacy & format
Visibility: Public
Source: Protected (no source disclosure), compliant with Publishing Rules
Language: English title & description first; Korean addendum optional
Screenshot guidance (for your gallery)
Weekly SPX showing dashboard at “Danger” with an OUT label.
Weekly SPX with Hindenburg Omen Cluster label and shaded background.
Daily SPX with Early-Warning label as weekly approaches Danger.
Beginner vs Pro dashboard comparison on SPX.
Author certification (paste if needed)
I certify this publication contains no promotions, links, or solicitations, complies with TradingView House Rules and Script Publishing Rules, uses Pine v5, and is intended solely for educational purposes with no performance claims.
TwinPulse Q Lead SPY x QQQ Intermarket Pulse 1HTwinPulse Q Lead is a concise one hour indicator for SPY and QQQ that converts three sources of market information into a single pulse line, a mode readout with BUY SELL WAIT, and compact alerts. It blends intermarket leadership between QQQ and SPY, intraday flow from the slope of session VWAP, and where the current price sits inside the regular trading hours range. The three components are normalized, fused, compressed to a stable range, and smoothed for clear thresholds. The aim is a readable intraday regime signal that helps you decide when to participate and when to stand aside.
The script is built with Pine v6, uses request security with lookahead off, and does not repaint. It is an indicator, not a strategy. It does not contain any solicitation, links, or outside references. The description is self contained and explains both logic and use so that any trader can understand the design without reading code.
What makes this original and useful
Intermarket leadership is measured directly from QQQ and SPY on your working timeframe using a Z score of the return spread. When growth is leading value heavy large caps, leadership turns positive. When it lags, leadership turns negative. This gives a real time read of the Nasdaq versus S and P tug of war that most day traders watch informally.
Intraday flow is taken from the slope of the session VWAP. A linear regression of VWAP over a short window captures whether value is rising or falling inside the day. Dividing by ATR normalizes slope by typical movement so that the signal is comparable across weeks.
Session position places price inside the current regular hours high to low. It answers whether the day is trading in the top half, the bottom half, or the middle. This is a simple but powerful context filter for breakouts and fades.
The three components are fused into one pulse, compressed with either hyperbolic tangent or softsign to keep values bounded, and then smoothed by a short EMA. This yields a stable range with a zero line so the eye can read shifts quickly.
The panel shows a human readable mode with reasons and a strength score. Traders who do not want to read lines can rely on a simple state and a compact justification that explains why the state is set.
This is not a mashup that simply overlays unrelated indicators. Each component was chosen to answer a distinct question that is common to SPY and QQQ intraday decision making. Leadership answers who is in charge, flow answers whether value inside the session is building or leaking, and position answers if price is pressing the extremes or circling the middle. The pulse ties the three together and prevents any single component from dominating.
How the calculations work
Leadership. Compute a short rate of change for SPY and QQQ. Subtract SPY from QQQ to get spread returns, then compute a rolling Z score over a longer window. Positive values mean QQQ is leading. Negative values mean SPY is leading.
Flow. Compute session VWAP on the active symbol. Regress VWAP over a short window to obtain a slope estimate. Divide by ATR to scale slope by current volatility so that a small rise on a quiet day is not treated the same as a small rise on a wild day.
Position. Track the highest high and lowest low since the start of regular hours. Place the current close inside that range on a zero to one scale, then recenter to a minus one to plus one scale. Positive means the top half of the day, negative means the bottom half.
Fusion. Multiply each component by a weight so users can emphasize or de emphasize leadership, flow, or position. Sum to a raw pulse.
Compression. Pass the raw pulse through a bounded function. Hyperbolic tangent is smooth and has natural saturation near the extremes. Softsign is faster and behaves like a smoother version of sign near zero. Compression avoids unbounded excursions and makes thresholds meaningful across days.
Smoothing. Apply a short EMA to the compressed pulse to reduce noise. This creates the main line called TwinPulse in the plot.
Thresholds. You can use static symmetric levels or adaptive levels. The adaptive option computes a mean and a standard deviation of the smoothed pulse over a user window, then sets upper and lower thresholds as mean plus or minus sigma times standard deviation. This allows thresholds to adjust across regimes. Static levels are still available for traders who want repeatable levels.
Events and mode. A long event fires when the smoothed pulse crosses the upper threshold with positive flow and any optional filters agree. A short event fires on the symmetric condition. The mode reads the current state rather than fire and forget. It returns BUY when the smoothed pulse is above the upper threshold with positive flow, SELL when the smoothed pulse is below the lower threshold with negative flow, otherwise WAIT. A cooldown controls how often events can fire so alerts do not spam during choppy periods.
Inputs and default values
The script ships with defaults chosen for SPY and QQQ on one hour charts.
Symbols. SPY and QQQ by default. You can switch to any pair. Many users may test IWM versus SPY for small cap reads.
Regular hours selector. On by default. This restricts the position factor to New York regular hours. Turn it off if you prefer full session behavior.
ROC length is three bars. Z score length is fifty bars. VWAP slope window is ten bars. ATR length is fourteen bars. Pulse smoothing length is three bars.
Compression mode. Choose hyperbolic tangent or softsign. Hyperbolic tangent is default.
Weights. Leadership and flow are one by default. Position is set to zero point seven to give a modest influence to where price sits inside the day.
Thresholds. Adaptive thresholds are on by default with a lookback of one hundred bars and a sigma width of zero point eight. Static levels at plus or minus zero point six are ready if you disable adaptive mode.
Filters. ADX filter is off by default. If you enable it, the script requires ADX above a user minimum before it will signal. Higher time frame confirmation is off by default. When enabled it compares the smoothed pulse on the confirm timeframe to zero and requires alignment for longs or shorts.
Cooldown. Three bars by default so that alerts do not trigger too frequently.
UI. Bar coloring is on by default. The panel is on by default and sits at the top right.
All request security calls use lookahead off and will not request future data. All persistent state variables are assigned in a way that prevents repainting. The indicator does not use non standard chart types in its logic.
How to use the indicator
Load a one hour chart of SPY or QQQ. Keep a clean chart so that the script output is easy to read.
Turn on regular hours if you want the session position to reflect the cash session. This is recommended for SPY and QQQ.
Watch the panel. Mode reads BUY or SELL or WAIT. The strength value is a simple vote based score that ranges from zero to one hundred. It counts leadership, flow, ADX if enabled, and higher time frame confirmation if enabled. You can use strength to filter weak states.
Consider action only when mode is BUY or SELL and the signal has not just fired on the last bar. The triangles mark where an event fired. Alerts use the same logic as the events. WAIT means stand aside.
To slow the system, enable ADX and set a higher minimum or enable higher time frame confirmation. To speed it up, disable the filters, disable adaptive thresholds, or tighten the sigma width.
When publishing, use a clean chart with only this indicator. Show the symbol and timeframe clearly and make sure the plot legend is visible. If you add drawings on the chart, only include ones that help readers understand the output.
Publication notes and compliance
This description is written in English. The title uses ASCII and only uses capital letters for common abbreviations. The script is original and explains how and why the components work together. There are no links or promotional material. The script does not claim performance. It does not use lookahead. The panel and alerts exist to help a human read and act with discipline. The indicator can be published as open source or as protected. If you choose protected, the description still allows readers to understand how the logic works without access to the code.
If you later convert the logic into a strategy for publication, use realistic commission and slippage, risk no more than a small share of equity per trade, and choose a dataset that yields a large enough sample. Explain any deviations from these default recommendations in your strategy description. Do not publish results from non standard chart types since they can mislead readers on signal timing.
Limitations and risks
Intermarket leadership is a relative measure. There are hours when both SPY and QQQ fall while leadership remains positive. Treat leadership as a context, not a stand alone trigger.
VWAP slope is a path measure inside the session. It can flip several times on a choppy day. That is why the script uses a short smoothing and an optional cooldown. Use ADX or higher time frame confirmation to avoid the worst chop.
Session position assumes a meaningful regular hours range. On half days or around openings with gaps the position factor can be less informative. If this bothers you, reduce the weight of position or turn it off.
Compression and smoothing introduce lag by design. The goal is stability and clarity. If you want earlier but noisier signals, reduce smoothing and weights, and use static thresholds.
No indicator guarantees future results. TwinPulse Q Lead is a decision aid. It should be combined with your risk rules, position size policy, and a clear exit plan. Past behavior is not a promise for the future.
Frequently asked questions
What symbols are supported. Any symbol can be used as the chart symbol. Leadership uses the two user symbols which default to SPY and QQQ. Many traders may try IWM versus SPY or DIA versus SPY.
Can I change the timeframe. Yes, but the design target is one hour. On very short timeframes the VWAP slope becomes very sensitive and you should consider stronger filters.
Does the script repaint. No. It uses request security with lookahead off and the panel updates on the last bar only. Events are based on bar close conditions unless you attach alerts on any alert function call which will still respect the logic without looking into the future.
How are the strength numbers built. The strength score is the share of aligned votes across leadership, flow, ADX if enabled, and higher time frame confirmation if enabled. A value near one hundred means many filters agree. A value near fifty means partial alignment. It is not a probability or an accuracy number.
Can I use non standard chart types. You can view the indicator on them but do not publish signals from non standard chart types because that can mislead readers about timing. Use classic candles or bars when you publish and when you test.
Why do I sometimes see BUY but the price is not moving. A BUY mode requires pulse above the upper threshold and positive flow. It does not require higher highs immediately. Treat BUY as a permission to look for entries using your own execution rules.

Mystic Pulse V2.0 [CHE] Mystic Pulse V2.0 — Adaptive DI streaks with gradient intensity for clearer trend persistence
Summary
Mystic Pulse V2.0 measures directional persistence by counting how often the positive or negative directional index strengthens and dominates. These counts drive gradient colors for bars, wicks, and helper plots, so intensity reflects local momentum rather than absolute values. A windowed normalization and gamma control adapt the visuals to recent conditions, preventing one regime from overpowering the next. The result is an immediate, at-a-glance read of trend direction and stamina without relying on crossovers alone.
Motivation: Why this design?
Classical DI and ADX signals can flip during choppy phases or feel sluggish in calm regimes. This script focuses on persistence: it increments a positive or negative streak only when the corresponding directional pressure both strengthens compared with the prior bar and dominates the other side. Simple OHLC pre-smoothing reduces micro-noise, and local normalization keeps the scale relevant to the last segment of data, not a distant past.
What’s different vs. standard approaches?
Reference baseline: Traditional DI and ADX lines with crossovers and fixed-scale thresholds.
Architecture differences:
Wilder-style recursive smoothing on true range and directional movement.
Streak counters for positive and negative pressure that advance only on strengthening and dominance.
Windowed normalization and gamma shaping for visual intensity.
Wick coloring via `plotcandle` with forced overlay from a pane indicator.
Practical effect: Bars and wicks grow more vivid during sustained pressure and fade during indecision. The column plots show streak depth directly, which helps filter one-bar flips.
How it works (technical)
1. Pre-smoothing: Open, high, low, and close are averaged over a short simple moving window to dampen micro-ticks.
2. Directional inputs: True range and directional movement are formed from the smoothed prices, then recursively smoothed using a Wilder-style update that carries prior state forward.
3. DI comparison: The script derives positive and negative directional ratios relative to smoothed range. A side advances its streak when it increases compared with the previous bar and exceeds the opposite side. The other streak resets.
4. Trend score and color base: The difference between positive and negative streaks defines the active side.
5. Normalization and gamma: The absolute streak magnitude and each side’s streak are normalized within a rolling window. Gamma parameters reshape intensity so mid-range values are either compressed or emphasized.
6. Rendering:
Two column plots show positive and negative streak counts in the pane with gradient colors.
A square marker at the bottom uses the global gradient as a compact heat cue.
Bar colors on the main chart use either the gradient, neutral trend colors, or no paint depending on toggles.
Wick, border, and candle overlays are colored via `plotcandle` with forced overlay.
7. State handling: Smoothed values and counters persist across bars; initialization uses first available values without lookahead. No higher-timeframe requests are used, so repaint risk is limited to normal live-bar evolution.
Parameter Guide
Show neutral candles (fallback) — Paints main-chart bars in plain up or down colors when gradients are disabled — Default false — Use when you prefer simple up/down coloring.
Show last N shapes — Limits bottom square markers — Default 333 — Reduce if your chart gets cluttered.
ADX smoothing length — Controls the Wilder smoothing window for range and directional movement — Default 9 — Larger values increase stability but respond later.
OHLC SMA length — Pre-smoothing for inputs — Default 1 — Increase slightly on noisy assets to reduce flip risk.
Gradient barcolor — Enables gradient bar paint on the main chart — Default true — Turn off to use wicks only or neutral bars.
Wick coloring — Colors wicks, borders, and bodies via overlay — Default true — Disable if it conflicts with other overlays.
Gradient window — Lookback for local normalization — Default 100 — Shorter windows adapt faster; longer windows provide steadier intensity.
Gradient transparency — Overall transparency for gradient paints — Default 0 — Increase to make gradients subtler.
Gamma bars/shapes — Contrast for bar and shape intensity — Default 0.70 — Lower values brighten mid-tones; higher values compress them.
Gamma plots — Contrast for the column plots — Default 0.80 — Tune separately from bar intensity.
Wick transparency — Transparency for wick coloring — Default 0 — Raise to let price action show through.
Up/Down colors (dark and neon) — Base and accent colors for both directions — Defaults as provided — Adjust to match your chart theme.
Reading & Interpretation
Pane columns: The green column represents the positive streak count; the red column represents the negative streak count. Taller columns signal stronger persistence.
Gradient marker: The bottom square indicates the active side and persistence strength at a glance.
Main-chart bars and wicks: Color direction shows the dominant side; intensity reflects the normalized and gamma-shaped streak magnitude. Faded tones suggest weak or fading pressure.
Practical Workflows & Combinations
Trend following: Enter in the direction of the active side when the corresponding column expands over several bars. Confirm with structure such as higher highs and higher lows or lower highs and lower lows.
Exits and stops: Consider scaling out when intensity fades toward mid-range while structure stalls. Tighten stops after extended streaks or when wicks lose intensity.
Multi-asset/Multi-TF: Use defaults for liquid assets on intraday to swing timeframes. For highly volatile instruments, raise smoothing and the normalization window. For calm markets, lower them to regain sensitivity.
Behavior, Constraints & Performance
Repaint/confirmation: Values update during the live bar and stabilize after bar close. No historical repaint beyond normal live-bar updates.
security()/HTF: Not used; cross-timeframe repaint paths do not apply.
Resources: Declared `max_bars_back` two thousand; no explicit loops or arrays; plot and label limits are generous.
Known limits: Streak counters can remain elevated during slow reversals. Very short normalization windows can cause rapid intensity swings. Gaps or extreme spikes may temporarily distort intensity until the window adapts.
Sensible Defaults & Quick Tuning
Start with: ADX smoothing nine, OHLC SMA one, normalization window one hundred, gradient and wick coloring enabled, gamma around zero point seven to zero point eight.
Too many flips: Increase ADX smoothing and the normalization window; consider a small bump in OHLC SMA.
Too sluggish: Decrease ADX smoothing and the normalization window.
Colors overpower chart: Increase gradient and wick transparency or raise gamma to compress mid-tones.
What this indicator is—and isn’t
This is a visualization and signal layer that represents directional persistence and intensity. It does not issue trade entries or exits on its own and is not predictive. Use it alongside market structure, volume, and risk controls.
Disclaimer
The content, including any code, is for educational and informational purposes only and does not constitute financial advice or a recommendation to buy or sell any instrument. Trading involves substantial risk, including the possible loss of principal. Past performance is not indicative of future results. Always do your own research and consider consulting a qualified professional.

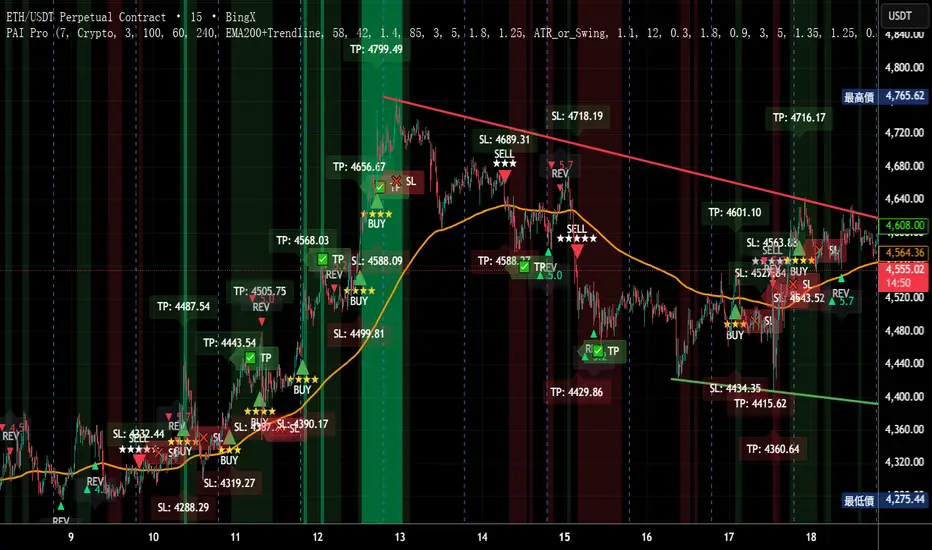
Precision AI Trading ProPrecision AI Trading Pro — TradingView Indicator
EN / 中文雙語說明(No promo, high-level logic, originality stated)
What it does |用途
EN
Trend-aligned entries on 5m/15m (and higher) using multi-layer confirmations. It emphasizes confirmation over prediction, then derives adaptive TP/SL from volatility and recent structure.
中文
在 5/15 分鐘(與更高時框)進行趨勢對齊進場,重確認、不猜轉折;並依波動與近期結構自適應計算 TP/SL。
Why it’s original & useful |原創性與價值
EN
This script implements a custom 11-filter confluence engine and a volatility-aware exit model. Filters are designed to complement each other: HTF context narrows bias, LTF structure checks timing, momentum/volume validate strength, and regime gates avoid chop. Exits use ATR- and swing-based distances with caps to keep results realistic.
中文
本腳本自研 11 重共振濾網 與 隨波動調整的出場模型:HTF 提供方向偏好,LTF 結構掌握時點;動能/量能驗證有效性;型態/趨勢強度門檻過濾震盪;出場以 ATR 與擺動區間計算距離並設上限,使績效更貼近實際。
How it works (high-level) |高層級運作
EN
HTF alignment: EMA(3/8/21) + RSI/MACD on a higher timeframe (confirmed bars only) sets directional bias.
LTF structure: Requires local EMA(3/8/21) alignment, Structure Breakout (recent swing ± ATR buffer), and optional Pullback to EMA8/21.
Regime checks: ADX gate and EMA band width filter out low-trend conditions; Volume confirms pressure.
Risk layer: Peak Guard (overheat/new-high/surge) blocks extended entries.
Trendline/EMA200: Optionally require EMA200 or TL breakout with ATR tolerance.
Exits: SL = max(ATR×k, swing buffer, % floor); TP = min(R×SL, ATR/% caps).
No look-ahead: HTF uses confirmed bars; pivots only annotate context, not used as entry triggers.
中文
HTF 共振:高階時框 EMA(3/8/21)+RSI/MACD(僅採用確認棒)決定方向偏好。
LTF 結構:要求本階 EMA(3/8/21) 一致、結構突破(近期高低點 ± ATR 緩衝),並可選 回踩 EMA8/21。
市況門檻:ADX 閘 與 EMA 帶寬 排除低趨勢環境;量能 驗證推進力。
風險層:Peak Guard(過熱/創高/急漲)避免追價。
趨勢線/EMA200:可選擇要求 EMA200 或趨勢線突破(含 ATR 容忍帶)。
出場:SL = max(ATR×k, 擺動緩衝, % 下限);TP = min(R×SL, ATR/% 上限)。
避免前視:HTF 僅用確認棒;樞紐點僅作標註,不作入場條件。
Filters (11) |濾網(11 項)
HTF Trend / Bright Zone (RSI) / LTF EMA(3/8/21) / MACD / Volume / ADX Gate / Structure Breakout / Pullback to EMA / EMA Band Width / Peak Guard / Trendline or EMA200 Confirmation
(高階趨勢/RSI 亮區/本階 EMA 結構/MACD/量能/ADX 閘/結構突破/回踩 EMA/EMA 窄帶/高位防護/趨勢線或 EMA200 確認)
User can define required passes (default 7).|可自訂需通過的濾網數(預設 7)。
Features |功能
Multi-market presets (Crypto / Gold / US Futures / Forex)|多市場預設
Adaptive TP/SL with labels (dynamic R:R)|自適應 TP/SL(含標註)
Risk-based star rating (0★–5★)|風險星級評分
Signal modes: Conservative / Balanced / Aggressive|訊號模式:保守/平衡/積極
Peak Guard toggle|高位防護可切換
How to use |使用方式
Pick market preset; start with 5m/15m.
Set required filters (default 7) and enable HTF confirmed bars.
Tune TP/SL and risk per symbol/timeframe; use star rating as visual guidance.
In choppy markets, raise ADX min and EMA-band threshold; in trend, relax them slightly.
選擇市場預設(建議 5/15 分鐘起)。
設定需通過的濾網數(預設 7),並啟用 HTF 確認棒。
依商品/時框微調 TP/SL 與風險;以星級作視覺參考。
震盪市提高 ADX 與帶寬門檻;趨勢市可適度放寬。
Notes |注意
Backtest behavior depends on bar resolution and fill rules; intrabar path may differ from live fills.
Educational use only; not financial advice.
No ads/links/contacts.
Changelog |版本紀錄(示例,請用「Update」維護)
2025-09-05: Reversal v2.1 scoring & 2-step confirmation; TL rejection/OB-touch trigger (optional); EMA8 recapture via close; Peak Guard integrated; BTC/ETH/SOL presets refined; alerts expanded; label params cleaned.
2025-08-28: Fixed decimal bug; tuned presets for four markets; kept auto RR/SL logic.
XAUUSD 1H – FVG Buy/Sell Signals XAUUSD 1H – Fair Value Gap (FVG) Buy/Sell Signals (No Boxes)
What it is:
A clean, signal-only indicator for Gold on the 1-hour chart. It detects 3-bar Fair Value Gaps, waits for a deep retest, then confirms with strong candle structure + trend + ADX before printing a BUY/SELL arrow. No rectangles or clutter—just selective, high-quality signals.
Why it works:
Instead of chasing breakouts, the script hunts for imbalances (FVGs) where price often returns to “fair value.” It only fires when:
price revisits the gap by a configurable depth,
the candle closes beyond the far edge with a small buffer,
the candle body is ≥ ATR × K (confirms intent),
the broader trend (EMA-50/EMA-200) agrees, and
ADX (Wilder, manual) shows sufficient strength.
Key features
✅ Signal-only: arrows/labels—no boxes on chart.
✅ Deep retest logic (percentage of zone), not just a touch.
✅ Strong close filter (edge + buffer) + ATR body filter.
✅ Trend filter (EMA-50 vs EMA-200) to keep trades with the regime.
✅ ADX strength to avoid chop.
✅ One signal per zone (optional “delete on use”).
✅ Alerts for both BUY and SELL.
✅ Built for Pine v6, non-repainting logic on bar close.
Inputs you can tune
Min FVG size (pts) – ignore tiny gaps.
Retest depth (%) – how deep price must come back into the gap.
Close buffer (pts) – extra confirmation beyond zone edge.
Min body ≥ ATR× – candle strength requirement.
Min ADX – trend strength threshold.
Expire after X bars – keep zones fresh.
Delete zone after signal – true = one-shot signals.
How I use it
Apply to XAUUSD 1H.
Keep default filters for selective signals.
For more setups, lower Min FVG size or ADX and reduce retest depth; for stricter signals, do the opposite.
Combine with S/R or session timing (London/NY) for added confluence.
Notes
Signals are generated on bar close.
Designed for clarity and discipline—fewer, cleaner arrows over constant noise.
Works on other symbols/timeframes, but tuned for Gold 1H.
Tags: #XAUUSD #Gold #FVG #SmartMoney #1H #TrendFollowing #ADX #ATR #PineV6 #TradingView

Signalgo MASignalgo MA is a TradingView indicator based on moving average (MA) trading by combining multi-timeframe logic, trend strength filtering, and adaptive trade management. Here’s a deep dive into how it works, its features, and why it stands apart from traditional MA indicators.
How Signalgo MA Works
1. Multi-Timeframe Moving Average Analysis
Simultaneous EMA & SMA Tracking: Signalgo MA calculates exponential (EMA) and simple (SMA) moving averages across a wide range of timeframes—from 1 minute to 3 months.
Layered Cross Detection: It detects crossovers and crossunders on each timeframe, allowing for both micro and macro trend detection.
Synchronized Signal Mapping: Instead of acting on a single crossover, the indicator requires agreement across multiple timeframes to trigger signals, filtering out noise and false positives.
2. Trend Strength & Quality Filtering
ADX Trend Filter: Trades are only considered when the Average Directional Index (ADX) confirms a strong trend, ensuring signals are not triggered during choppy or directionless markets.
Volume & Momentum Confirmation: For the strongest signals, the system requires:
A significant volume spike
Price above/below a longer-term EMA (for buys/sells)
RSI momentum confirmation
One-Time Event Detection: Each crossover event is flagged only once per occurrence, preventing repeated signals from the same move.
Inputs
Preset Parameters:
EMA & SMA Lengths: Optimized for both short-term and long-term analysis.
ADX Length & Minimum: Sets the threshold for what is considered a “strong” trend.
Show Labels/Table: Visual toggles for displaying signal and trade management information.
Trade Management:
Show TP/SL Logic: Toggle to display or hide take-profit (TP) and stop-loss (SL) levels.
ATR Length & Multipliers: Fine-tune how SL and TP levels adapt to market volatility.
Enable Trailing Stop: Option to activate dynamic stop movement after TP1.
Entry & Exit Strategy
Entry Logic
Long (Buy) Entry: Triggered when multiple timeframes confirm bullish EMA/SMA crossovers, ADX confirms trend strength, and all volume/momentum filters align.
Short (Sell) Entry: Triggered when multiple timeframes confirm bearish crossunders, with the same strict filtering.
Exit & Trade Management
Stop Loss (SL): Automatically set based on recent volatility (ATR), adapting to current market conditions.
Take Profits (TP1, TP2, TP3): Three profit targets at increasing reward multiples, allowing for flexible trade management.
Trailing Stop: After TP1 is hit, the stop loss moves to breakeven and a trailing stop is activated to lock in further gains.
Event Markers: Each time a TP or SL is hit, a visual label is placed on the chart for full transparency.
Strict Signal Quality Filters: Signals are only generated when volume spikes, momentum, and trend strength all align, dramatically reducing false positives.
Adaptive, Automated Trade Management: Built-in TP/SL and trailing logic mean you get not just signals, but a full trade management suite, rarely found in standard MA indicators.
Event-Driven, Not Static: Each signal is triggered only once per event, eliminating repetitive or redundant entries.
Visual & Alert Integration: Every signal and trade event is visually marked and can trigger TradingView alerts, keeping you informed in real time.
Trading Strategy Application
Versatility: Suitable for scalping, day trading, swing trading, and longer-term positions thanks to its multi-timeframe logic.
Noise Reduction: The layered filtering logic means you only see the highest-probability setups, helping you avoid common MA “fakeouts” and overtrading.
So basically what separates Signalgo MA from traditional MA indicators?
1. Multi-Timeframe Analysis
Traditional MA indicators: Usually measure crossovers or signals within a single timeframe.
Signalgo MA: simultaneously calculates fast/slow EMAs & SMAs for multiple periods. This enables it to create signals based on synchronized or stacked momentum across multiple periods, offering broader trend confirmation and reducing noise from single-timeframe signals.
2. Combinatorial Signal Logic
Traditional: A basic crossover is typically “if fast MA crosses above/below slow MA, signal buy/sell.”
Signalgo MA: Generates signals only when MA crossovers align across several timeframes, plus takes into consideration the presence or absence of conflicting signals in shorter or longer frames. This reduces false positives and increases selectivity.
3. Trend Strength Filtering (ADX Integration)
Traditional: Many MA indicators are “blind” to trend intensity, potentially triggering signals in low volatility or ranging conditions.
Signalgo MA: Employs ADX as a minimum trend filter. Signals will only fire if the trend is sufficiently strong, reducing whipsaws in choppy or sideways markets.
4. Volume & Strict Confirmation Layer
Traditional: Few MA indicators directly consider volume or require confluence with other major indicators.
Signalgo MA: Introduces a “strict signal” filter that requires not only MA crossovers and trend strength, but also (on designated frames):
Significant volume spike,
Price positioned above/below a higher timeframe EMA (trend anchor),
RSI momentum confirmation.
5. Persistent, Multi-Level TP/SL Automated Trade Management
Traditional: Separate scripts or manual management for stop-loss, take-profit, and trailing-stops, rarely fully integrated visually.
Signalgo MA: Auto-plots up to three take-profit levels, initial stop, and a trailing stop (all ATR-based) on the chart. It also re-labels these as they are hit and resets for each new entry, supporting full trade lifecycle visualization directly on the chart.
6. Higher Timeframe SMA Crosses for Long-Term Context
Traditional: Focuses only on the current chart’s timeframe.
Signalgo MA: Incorporates SMA cross logic for weekly, monthly, and quarterly periods, which can contextualize lower timeframe trades within broader cycles, helping filter against counter-trend signals.
7. “Signal Once” Logic to Prevent Over-Trading
Traditional: Will often re-fire the same signal repeatedly as long as the condition is true, possibly resulting in signal clusters and over-trading.
Signalgo MA: Fires each signal only once per condition—prevents duplicate alerts for the same trade context.

Consolidation Range with Signals (Zeiierman)█ Overview
Consolidation Range with Signals (Zeiierman) is a precision tool for identifying and trading market consolidation zones, where price contracts into tight ranges before significant movement. It provides dynamic range detection using either ADX-based trend strength or volatility compression metrics, and offers built-in take profit and stop loss signals based on breakout dynamics.
Whether you trade breakouts, range reversals, or trend continuation setups, this indicator visualizes the balance between supply and demand with clearly defined mid-bands, breakout zones, and momentum-sensitive TP/SL placements.
█ How It Works
⚪ Multi-Method Range Detection
ADX Mode
Uses the Average Directional Index (ADX) to detect low-trend-strength environments. When ADX is below your selected threshold, price is considered to be in consolidation.
Volatility Mode
This mode detects consolidation by identifying periods of volatility compression. It evaluates whether the following metrics are simultaneously below their respective historical rolling averages:
Standard Deviation
Variance
Average True Range (ATR)
⚪ Dynamic Range Band System
Once a range is confirmed, the system builds a dynamic band structure using a volatility-based filter and price-jump logic:
Middle Line (Trend Filter): Reacts to price imbalance using adaptive jump logic.
Upper & Lower Bands: Calculated by expanding from the middle line using a configurable multiplier.
This creates a clean, visual box that reflects current consolidation conditions and adapts as price fluctuates within or escapes the zone.
⚪ SL/TP Signal Engine
On detection of a breakout from the range, the indicator generates up to 3 Take Profit levels and one Stop Loss, based on the breakout direction:
All TP/SL levels are calculated using the filtered base range and multipliers.
Cooldown logic ensures signals are not spammed bar-to-bar.
Entries are visualized with colored lines and labeled levels.
This feature is ideal for traders who want automated risk and reward reference points for range breakout plays.
█ How to Use
⚪ Breakout Traders
Use the SL/TP signals when the price breaks above or below the range bands, especially after extended sideways movement. You can customize how far TP1, TP2, and TP3 sit from the entry using your own risk/reward profile.
⚪ Mean Reversion Traders
Use the bands to locate high-probability reversion zones. These serve as reference zones for scalping or fade entries within stable consolidation phases.
█ Settings
Range Detection Method – Choose between ADX or Volatility compression to define range criteria.
Range Period – Determines how many bars are used to compute trend/volatility.
Range Multiplier – Scales the width of the consolidation zone.
SL/TP System – Optional levels that project TP1/TP2/TP3 and SL from the base price using multipliers.
Cooldown – Prevents repeated SL/TP signals from triggering too frequently.
ADX Threshold & Smoothing – Adjusts sensitivity of trend strength detection.
StdDev / Variance / ATR Multipliers – Fine-tune compression detection logic.
-----------------
Disclaimer
The content provided in my scripts, indicators, ideas, algorithms, and systems is for educational and informational purposes only. It does not constitute financial advice, investment recommendations, or a solicitation to buy or sell any financial instruments. I will not accept liability for any loss or damage, including without limitation any loss of profit, which may arise directly or indirectly from the use of or reliance on such information.
All investments involve risk, and the past performance of a security, industry, sector, market, financial product, trading strategy, backtest, or individual's trading does not guarantee future results or returns. Investors are fully responsible for any investment decisions they make. Such decisions should be based solely on an evaluation of their financial circumstances, investment objectives, risk tolerance, and liquidity needs.

Visually Layered OscillatorVisually Layered Oscillator User's Manual
Visually Layered Oscillator is a multi-oscillator designed to provide an intuitive visualization of RSI, MACD, ADX + DMI, allowing traders to interpret multiple signals at a glance.
It is designed to allow comparison within the same panel while maintaining the inherent meaning of each oscillator and compensating for visual distortion issues caused by size differences.
Component Overview
Item Description
RSI (x10) Displays relative buy/sell strength. Values above 70 are overbought; values below 30 are oversold.
MACD (3,16,10) Momentum indicator showing the difference between moving averages. Consists of lines and histograms
ADX ×50 + DMI Indicates the strength of the trend; ADX determines the strength of the trend and DMI determines whether it is buy/sell dominant.
White background color treatment Removes difficult-to-see grid lines to improve visibility.
🖥️ Screen Example
The panel is divided into the following three layers
mathematica
Copy
Edit
Top: ⬆️ RSI (purple)
Middle: 📈 MACD, Signal, Histogram + Color Fill
Bottom: 📉 ADX × 50, DMI+ / DMI- (Red, Blue, Orange)
TIP: If you zoom in on the indicators at a larger scale, you can see that each indicator is drawn at a different height level and placed in such a way that they do not overlap.
⚙️ Settings
Fast Length: MACD Quick Line Duration (Basic 3)
Slow Length: MACD slow line period (basic 16)
Smoothing: Signal line smoothing value (basic 10)
Notes and Tips
RSI × 10 and ADX × 50 are for visualization purposes only multiplied by multiples of the actual values. It does not affect the calculation and maintains the original RSI/ADX characteristics.
The MACD fill color visually highlights crossing conditions.
The background is treated in full white, making the indicator look clean without grid lines.

Rube Goldberg Top/Bottom Finder [theUltimator5]This is what I call the Rube Goldberg Top and Bottom Finder. It is an overly complex method of plotting a simple buy or sell label on a chart.
I utilize several standard TA techniques along with several of my own to try and locate ideal Buy/Sell conditions. I came up with the name because there are way too many conditional variables to come up with a single buy or sell condition, when most standard indicators use simple crossovers or levels.
There are two unique triggers that are calculated using completely independent techniques. If both triggers turn true within a small timeframe between each other, the buy/sell trigger turns true and plots a "buy" or "sell" label on the chart.
This indicator was designed to be fully functioning out of the box and can be customized only if the user wishes to. It is effective on all timeframes, but longer timeframes (daily +) may require signal length adjustment for best results.
imgur.com
The signals used in the leading trigger are as follows:
(1)RSI
The user can select among any of the following moving averages (base is EMA) (#3) , and have an RSI generated at a user defined length (base is 14). (#4)
SMA, EMA, DEMA, TEMA, WMA, VWMA, SMMA, HMA, LSMA, ALMA
The user can select whether or not the RSI is filtered with the following options:
None, Kalman, Double EMA, ALMA
The filter conditions are hard coded to minimize the amount of selections that the user is required to make to reduce the user interface complexity.
The user can define overbought (base 70) and oversold (base 30) conditions. (#2)
When the RSI crosses above or below the threshold values, the plot will turn red. This creates condition 1 of the leading trigger.
(2) ADX and DI
This portion of the indicator is a derivative of my ADX Divergence and Gap Monitor indicator.
This technique looks at the ADX value as well as for spikes in either +DI or -DI for large divergences. When the ADX reaches a certain threshold and also outpaces a preset ADX moving average, this creates condition 2 of the leading trigger.
There is an additional built-in functionality in this portion of the indicator that looks for gaps. It triggers when the ADX is below a certain threshold value and either the +DI or -DI spike above a certain threshold value, indicating a sudden gap in price after a period of low volatility.
The user can set whether or nor to show when a gap appears on the chart or as a label on the plot below the chart (disabled by default) . If the user chooses to overlay gaps on the chart, it creates a horizontal fill showing the starting point of the gap. The theory here is that the price will return at some point in the near future to the starting point of the gap.
imgur.com
(3) DI based Multi-Symbol reference and divergence
Part of the script computes both the +DI (positive directional index) and -DI (negative directional index) for the currently selected chart symbol and three reference symbols.
The averaged directional move of the reference symbols are compared to the current ticker on your chart and if the divergence exceeds a certain threshold, then the third condition of the trigger is met.
The components that are referenced are based on what stock/chart you are looking at. The script automatically detects if you are looking at a crypto, and uses a user selectable toggle between Large Cap or Small Cap. (#1) The threshold levels are determined by the asset type and market cap.
The leading trigger highlights under several conditions:
1) All (3) portions of the trigger result in true simultaneously
OR
2) Any of triggers 2 or 3 reach a certain threshold that indicates extreme market/price divergence as well as trigger 1 being overbought or oversold.
AND
3) If the trigger didn't highlight
For the lagging part of the trigger:
The lagging trigger is used as a confirmation after the leading trigger to indicate a possible optimized entry/exit point. It can also be used by itself, as well as the leading indicator.
The lagging indicator utilizes the parabolic Stop And Reverse (SAR). It utilizes the RSI length that is defined in portion 1 of the leading trigger as well as the overbought and oversold thresholds. I have found excellent results in catching reversals because it catches rate-of-change events rather than price reversals alone.
imgur.com
When both the leading triggers FOLLOWED BY the lagging trigger result in true within a user defined timeframe, then the buy or sell trigger results in true, plotting a label on the chart.
All portions of the leading and lagging indicators can be toggled on or off, but most of them are toggled off by default in order to reduce noise on the plot.
imgur.com
The leading, lagging, and buy/sell triggers each have built-in alerts that can be toggled on or off in the alert menu.
I have an optional built-in toggle to show green or red dots on the RSI line using two separate RSI lengths that are amplified and plot based on RSI divergence and strength. This can be used as a visual confirmation (or rejection) against the chart overlay plots.
imgur.com
This indicator is not a strategy, so there are no built-in exits or stop losses.

Machine Learning | Adaptive Trend Signals [Bitwardex]⚙️🧠Machine Learning | Adaptive Trend Signals
🔷Overview
Machine Learning | Adaptive Trend Signals is a Pine Script™ v6 indicator designed to visualize market trends and generate signals through a combination of volatility clustering, Gaussian smoothing, and adaptive trend calculations. Built as an overlay indicator, it integrates advanced techniques inspired by machine learning concepts, such as K-Means clustering, to adapt to changing market conditions. The script is highly customizable, includes a backtesting module, and supports alert conditions, making it suitable for traders exploring trend-based strategies and developers studying volatility-driven indicator design.
🔷Functionality
The indicator performs the following core functions:
• Volatility Clustering: Uses K-Means clustering to categorize market volatility into high, medium, and low states, adjusting trend sensitivity accordingly.
• Trend Calculation: Computes adaptive trend lines (SmartTrend) based on volatility-adjusted standard deviation, smoothed RSI, and ADX filters.
• Signal Generation: Identifies potential buy and sell points through trend line crossovers and directional confirmation.
• Backtesting Module: Tracks trade outcomes based on the SmartTrend3 value, displaying win rate and total trades.
• Visualization: Plots trend lines with gradient colors and optional signal markers (bullish 🐮 and bearish 🐻).
• Alerts: Provides configurable alerts for trend shifts and volatility state changes.
🔷Technical Methodology
Volatility Clustering with K-Means
The indicator employs a K-Means clustering algorithm to classify market volatility, measured via the Average True Range (ATR), into three distinct clusters:
• Data Collection: Gathers ATR values over a user-defined training period (default: 100 bars).
• Centroid Initialization: Sets initial centroids at the highest, lowest, and midpoint ATR values within the training period.
• Iterative Clustering: Assigns ATR data points to the nearest centroid, recalculates centroid means, and repeats until convergence.
• Dynamic Adjustment: Assigns a volatility state (high, medium, or low) based on the closest centroid, adjusting the trend factor (e.g., tighter for high volatility, wider for low volatility).
This approach allows the indicator to adapt its sensitivity to varying market conditions, providing a data-driven foundation for trend calculations.
🔷Gaussian Smoothing
To enhance signal clarity and reduce noise, the indicator applies Gaussian kernel smoothing to:
• RSI: Smooths the Relative Strength Index (calculated from OHLC4) to filter short-term fluctuations.
• SmartTrend: Smooths the primary trend line for a more stable output.
The Gaussian kernel uses a sigma value derived from the user-defined smoothing length, ensuring mathematically consistent noise reduction.
🔷SmartTrend Calculation
The pineSmartTrend function is the core of the indicator, producing three trend lines:
• SmartTrend: The primary trend line, calculated using a volatility-adjusted standard deviation, smoothed RSI, and ADX conditions.
• SmartTrend2: A secondary trend line with a wider factor (base factor * 1.382) for signal confirmation.
SmartTrend3: The average of SmartTrend and SmartTrend2, used for plotting and backtesting.
Key components of the calculation include:
• Dynamic Standard Deviation: Scales based on ATR relative to its 50-period smoothed average, with multipliers (1.0 to 1.4) applied according to volatility thresholds.
• RSI and ADX Filters: Requires RSI > 50 for bullish trends or < 50 for bearish trends, alongside ADX > 15 and rising to confirm trend strength.
Volatility-Adjusted Bands: Constructs upper and lower bands around price action, adjusted by the volatility cluster’s dynamic factor.
🔷Signal Generation
The generate_signals function generates signals as follows:
• Buy Signal: Triggered when SmartTrend crosses above SmartTrend2 and the price is above SmartTrend, with directional confirmation.
• Sell Signal: Triggered when SmartTrend crosses below SmartTrend2 and the price is below SmartTrend, with directional confirmation.
Directional Logic: Tracks trend direction to filter out conflicting signals, ensuring alignment with the broader market context.
Signals are visualized as small circles with bullish (🐮) or bearish (🐻) emojis, with an option to toggle visibility.
🔷Backtesting
The get_backtest function evaluates signal outcomes using the SmartTrend3 value (rather than closing prices) to align with the trend-based methodology.
It tracks:
• Total Trades: Counts completed long and short trades.
• Win Rate: Calculates the percentage of trades where SmartTrend3 moves favorably (higher for longs, lower for shorts).
Position Management: Closes opposite positions before opening new ones, simulating a single-position trading system.
Results are displayed in a table at the top-right of the chart, showing win rate and total trades. Note that backtest results reflect the indicator’s internal logic and should not be interpreted as predictive of real-world performance.
🔷Visualization and Alerts
• Trend Lines: SmartTrend3 is plotted with gradient colors reflecting trend direction and volatility cluster, accompanied by a secondary line for visual clarity.
• Signal Markers: Optional buy/sell signals are plotted as small circles with customizable colors.
• Alerts: Supports alerts for:
• Bullish and bearish trend shifts (confirmed on bar close).
Transitions to high, medium, or low volatility states.
🔷Input Parameters
• ATR Length (default: 14): Period for ATR calculation, used in volatility clustering.
• Period (default: 21): Common period for RSI, ADX, and standard deviation calculations.
• Base SmartTrend Factor (default: 2.0): Base multiplier for volatility-adjusted bands.
• SmartTrend Smoothing Length (default: 10): Length for Gaussian smoothing of the trend line.
• Show Buy/Sell Signals? (default: true): Enables/disables signal markers.
• Bullish/Bearish Color: Customizable colors for trend lines and signals.
🔷Usage Instructions
• Apply to Chart: Add the indicator to any TradingView chart.
• Configure Inputs: Adjust parameters to align with your trading style or market conditions (e.g., shorter ATR length for faster markets).
• Interpret Output:
• Trend Lines: Use SmartTrend3’s direction and color to gauge market bias.
• Signals: Monitor bullish (🐮) and bearish (🐻) markers for potential entry/exit points.
• Backtest Table: Review win rate and total trades to understand the indicator’s behavior in historical data.
• Set Alerts: Configure alerts for trend shifts or volatility changes to support manual or automated trading workflows.
• Combine with Analysis: Use the indicator alongside other tools or market context, as it is designed to complement, not replace, comprehensive analysis.
🔷Technical Notes
• Data Requirements: Requires at least 100 bars for accurate volatility clustering. Ensure sufficient historical data is loaded.
• Market Suitability: The indicator is designed for trend detection and may perform differently in ranging or volatile markets due to its reliance on RSI and ADX filters.
• Backtesting Scope: The backtest module uses SmartTrend3 values, which may differ from price-based outcomes. Results are for informational purposes only.
• Computational Intensity: The K-Means clustering and Gaussian smoothing may increase processing time on lower timeframes or with large datasets.
🔷For Developers
The script is modular, well-commented, encouraging reuse and modification with proper attribution.
Key functions include:
• gaussianSmooth: Applies Gaussian kernel smoothing to any data series.
• pineSmartTrend: Computes adaptive trend lines with volatility and momentum filters.
• getDynamicFactor: Adjusts trend sensitivity based on volatility clusters.
• get_backtest: Evaluates signal performance using SmartTrend3.
Developers can extend these functions for custom indicators or strategies, leveraging the volatility clustering and smoothing methodologies. The K-Means implementation is particularly useful for adaptive volatility analysis.
🔷Limitations
• The indicator is not predictive and should be used as part of a broader trading strategy.
• Performance varies by market, timeframe, and parameter settings, requiring user experimentation.
• Backtest results are based on historical data and internal logic, not real-world trading conditions.
• Volatility clustering assumes sufficient historical data; incomplete data may affect accuracy.
🔷Acknowledgments
Developed by Bitwardex, inspired by machine learning concepts and adaptive trading methodologies. Community feedback is welcome via TradingView’s platform.
🔷 Risk Disclaimer
Trading involves significant risks, and most traders may incur losses. Bitwardex AI Algo is provided for informational and educational purposes only and does not constitute financial advice or a recommendation to buy or sell any financial instrument . The signals, metrics, and features are tools for analysis and do not guarantee profits or specific outcomes. Past performance is not indicative of future results. Always conduct your own due diligence and consult a financial advisor before making trading decisions.

Smart Volume S/R Pro [The_lurker]مؤشر "Smart Volume S/R Pro " هو أداة تحليل فني متقدمة مصممة لمساعدة المتداولين في تحديد مستويات الدعم والمقاومة القوية بناءً على حجم التداول، مع إضافة ميزات تحليلية متطورة مثل تصفية الاتجاه ، مناطق الثقة ، تقييم القوة ، حساب احتمالية الاختراق ، قياس السيولة ، تحديد الأهداف السعرية ، ومستويات فيبوناتشي . وايضا تقديم تسميات (Labels) بجانب كل مستوى دعم ومقاومة، تحتوي على أرقام ومعلومات دقيقة تعكس حالة السوق. هذه التسميات ليست مجرد زينة، بل أدوات تحليلية تساعد المتداولين على اتخاذ قرارات مستنيرة بناءً على بيانات السوقيهدف هذا المؤشر إلى توفير رؤية شاملة للسوق .
الوظائف الرئيسية للمؤشر
1- تحديد مستويات الدعم والمقاومة بناءً على حجم التداول العالي
يقوم المؤشر بتحليل الأشرطة (Bars) السابقة (حتى 300 شريط افتراضيًا) لتحديد النقاط التي شهدت أعلى مستويات حجم التداول.
يرسم خطوط أفقية تمثل مستويات المقاومة (عند أعلى سعر في تلك الأشرطة) والدعم (عند أدنى سعر)، ويمكن للمستخدم اختيار عدد الخطوط المعروضة (من 1 إلى 6).
2- تصفية الاتجاه باستخدام مؤشر ADX
يستخدم المؤشر مؤشر الاتجاه المتوسط (ADX) لتقييم قوة الاتجاه في السوق.
عندما تكون قوة الاتجاه عالية (تتجاوز عتبة محددة، 25 افتراضيًا)، يقلل المؤشر عدد مستويات الدعم والمقاومة المعروضة للتركيز فقط على المستويات الأكثر أهمية.
3- مناطق الثقة الديناميكية
يضيف المؤشر مناطق حول مستويات الدعم والمقاومة بناءً على متوسط المدى الحقيقي (ATR)، مما يساعد المتداولين على تصور النطاقات التي قد يتفاعل فيها السعر مع هذه المستويات.
يمكن تعديل عرض هذه المناطق باستخدام مضاعف ATR.
4- تقييم قوة المستويات
يحسب المؤشر قوة كل مستوى بناءً على حجم التداول، عدد المرات التي تم اختبار المستوى فيها (Touch Count)، وقرب السعر الحالي من المستوى.
يتم عرض درجة القوة (من 0 إلى 100) بجانب كل مستوى إذا تم تفعيل هذه الخاصية.
5- احتمالية الاختراق
يقدّر المؤشر احتمالية اختراق كل مستوى بناءً على الزخم (ROC)، قوة المستوى، والمسافة بين السعر الحالي والمستوى.
يظهر الاحتمال كنسبة مئوية إذا تم تفعيل الخيار، مما يساعد المتداولين على توقع الحركات المحتملة.
6- تحليل السيولة التاريخية
يقيس المؤشر السيولة حول كل مستوى بناءً على حجم التداول في النطاقات القريبة منه.
يمكن عرض قيم السيولة في التسميات أو استخدامها لتعديل عرض الخطوط (الخطوط الأكثر سيولة تظهر أعرض).
7- الأهداف السعرية
عند تفعيل هذه الخاصية، يحسب المؤشر أهداف سعرية للاختراق (Breakout) والارتداد (Reversal) بناءً على الزخم وقوة المستوى وATR.
يمكن عرض هذه الأهداف كنصوص في التسميات أو كخطوط أفقية على الرسم البياني.
8- مستويات فيبوناتشي
يرسم المؤشر مستويات فيبوناتشي (0.0، 0.236، 0.382، 0.5، 0.618، 0.786، 1.0) بناءً على أعلى وأدنى سعر في فترة النظرة الخلفية.
يمكن للمستخدم اختيار أي من هذه المستويات لعرضها أو إخفائها.
9- تنبيه شامل للاختراق
يوفر المؤشر تنبيهًا واحدًا يشمل جميع المستويات، حيث يُطلق التنبيه عندما يخترق السعر أي مستوى دعم أو مقاومة مع رسالة توضح نوع الاختراق والمستوى المخترق.
كيفية عمل المؤشر
الخطوة الأولى: يحدد المؤشر الأشرطة ذات الحجم العالي خلال فترة النظرة الخلفية المحددة (Lookback Period).
الخطوة الثانية: يرسم مستويات الدعم والمقاومة بناءً على أعلى وأدنى الأسعار في تلك الأشرطة، مع مراعاة عدد الخطوط المختارة من المستخدم.
الخطوة الثالثة: يطبق مرشح الاتجاه (إذا كان مفعلاً) لتقليل عدد المستويات في حالة الاتجاه القوي.
الخطوة الرابعة: يضيف التحليلات الإضافية مثل القوة، السيولة، احتمالية الاختراق، والأهداف السعرية، ويرسم مناطق الثقة ومستويات فيبوناتشي حسب الإعدادات.
الخطوة الخامسة: يراقب السعر ويطلق تنبيهًا عند الاختراق.
الإعدادات القابلة للتخصيص
1- فترة النظرة الخلفية (Lookback Period): عدد الأشرطة التي يتم تحليلها (افتراضيًا 300).
2- عدد الخطوط (Number of Lines): من 1 إلى 6 مستويات دعم ومقاومة.
3- الألوان والأنماط: يمكن تغيير ألوان الخطوط وأنماطها (ممتلئة، متقطعة، منقطة).
4- التسميات: تفعيل/تعطيل التسميات، وحجمها، وموقعها، ولون النص.
5- مرشح الاتجاه: تفعيل/تعطيل ADX، وتعديل طوله وعتبته.
6- مناطق الثقة: تفعيل/تعطيل، وتعديل طول ATR ومضاعفه.
7- القوة واحتمالية الاختراق: تفعيل/تعطيل العرض، وتعديل طول ROC.
8- السيولة: تفعيل/تعطيل تأثير السيولة على عرض الخطوط وقيمها في التسميات.
9- الأهداف السعرية: تفعيل/تعطيل الأهداف وعرضها كخطوط.
10- فيبوناتشي: اختيار المستويات المعروضة ولون الخطوط.
فوائد المؤشر
دقة عالية: يعتمد على حجم التداول لتحديد المستويات، مما يجعله أكثر موثوقية من المستويات العشوائية.
مرونة: يوفر خيارات تخصيص واسعة تتيح للمتداولين تكييفه حسب استراتيجياتهم.
تحليل شامل: يجمع بين الدعم والمقاومة، الاتجاه، السيولة، والأهداف في أداة واحدة.
سهولة الاستخدام: التسميات والتنبيهات تجعل من السهل متابعة السوق دون تعقيد.
==================================================================================تسميات (Labels) بجانب كل مستوى دعم ومقاومة، تحتوي على أرقام ومعلومات دقيقة تعكس حالة السوق. هذه التسميات ليست مجرد زينة، بل أدوات تحليلية تساعد المتداولين على اتخاذ قرارات مستنيرة بناءً على بيانات السوق. في هذا الشرح، سنستعرض كل رقم أو قيمة تظهر في التسميات ومعناها العملي.
مكونات التسميات
التسميات تظهر بجانب كل مستوى دعم (Support) ومقاومة (Resistance) وتبدأ بحرف "S" للدعم أو "R" للمقاومة، تليها مجموعة من الأرقام والقيم التي يمكن تفعيلها أو تعطيلها حسب إعدادات المستخدم. إليك تفصيل كل عنصر:
1- عدد اللمسات (Touch Count)
الرمز: يظهر مباشرة بعد "S" أو "R" (مثال: "R: 5" أو "S: 3").
المعنى: يشير إلى عدد المرات التي اختبر فيها السعر هذا المستوى دون اختراقه.
الفائدة: كلما زاد عدد اللمسات، كلما كان المستوى أقوى وأكثر أهمية. على سبيل المثال، إذا كان "R: 5"، فهذا يعني أن السعر ارتد من هذا المستوى 5 مرات، مما يجعله مقاومة قوية محتملة.
2- قوة المستوى (Strength Rating)
الرمز: يظهر بين قوسين مربعين (مثال: " ").
المعنى: قيمة من 0 إلى 100 تعكس قوة المستوى بناءً على عوامل مثل حجم التداول، عدد اللمسات، وقرب السعر الحالي من المستوى.
الفائدة: القيم العالية (مثل 75 أو أكثر) تشير إلى مستوى قوي يصعب اختراقه، بينما القيم المنخفضة (مثل 30 أو أقل) تدل على ضعف المستوى وسهولة اختراقه. يمكن للمتداول استخدام هذا لتحديد المستويات الأكثر موثوقية.
3- احتمالية الاختراق (Breakout Probability)
الرمز: يبدأ بحرف "B" متبوعًا بنسبة مئوية (مثال: "B: 60%").
المعنى: نسبة من 0% إلى 100% تُظهر احتمالية اختراق السعر للمستوى بناءً على الزخم الحالي، قوة المستوى، والمسافة بين السعر والمستوى.
الفائدة: نسبة مرتفعة (مثل 60% أو أكثر) تعني أن السعر قد يخترق المستوى قريبًا، بينما النسب المنخفضة (مثل 20%) تشير إلى احتمال ارتداد السعر. هذا مفيد لتوقع الحركة التالية.
4- قيمة السيولة (Liquidity Value)
الرمز: يبدأ بحرف "L" متبوعًا برقم (مثال: "L: 1200").
المعنى: يمثل متوسط حجم التداول في النطاق القريب من المستوى، مما يعكس السيولة التاريخية حوله.
الفائدة: القيم العالية تدل على وجود سيولة كبيرة، مما يعني أن السعر قد يتفاعل بقوة مع هذا المستوى (إما بالارتداد أو الاختراق). القيم المنخفضة تشير إلى سيولة ضعيفة، مما قد يجعل المستوى أقل تأثيرًا.
5- الأهداف السعرية (Price Targets)
الرمز: يبدأ بـ "BT" (هدف الاختراق) و"RT" (هدف الارتداد) متبوعين بأرقام (مثال: "BT: 150.50 RT: 148.20").
المعنى:
BT (Breakout Target): السعر المحتمل الذي قد يصل إليه السعر بعد اختراق المستوى.
RT (Reversal Target): السعر المحتمل الذي قد يصل إليه السعر إذا ارتد من المستوى.
الفائدة: تساعد المتداولين في تحديد نقاط الخروج المحتملة بعد الاختراق أو الارتداد، مما يسهل وضع خطة تداول دقيقة.
أمثلة عملية
تسمية مقاومة: "R: 4 B: 25% L: 1500 BT: 155.00 RT: 152.00"
المستوى اختُبر 4 مرات، قوته 80 (قوي جدًا)، احتمالية الاختراق 25% (منخفضة، أي احتمال ارتداد أعلى)، السيولة 1500 (مرتفعة)، هدف الاختراق 155.00، هدف الارتداد 152.00.
الاستنتاج: المستوى قوي ومن المرجح أن يرتد السعر منه، لكن إذا اخترق، فقد يصل إلى 155.00.
تسمية دعم: "S: 2 B: 70% L: 800 BT: 145.00 RT: 147.50"
المستوى اختُبر مرتين، قوته 40 (متوسطة إلى ضعيفة)، احتمالية الاختراق 70% (مرتفعة)، السيولة 800 (متوسطة)، هدف الاختراق 145.00، هدف الارتداد 147.50.
الاستنتاج: المستوى ضعيف ومن المحتمل أن يخترقه السعر ليهبط إلى 145.00.
كيفية الاستفادة من التسميات
تحديد القوة والضعف: استخدم قوة المستوى (Strength) لمعرفة ما إذا كان المستوى موثوقًا للارتداد أو عرضة للاختراق.
توقع الحركة: انظر إلى احتمالية الاختراق (Breakout Probability) لتحديد ما إذا كنت ستنتظر اختراقًا أو ترتدًا.
إدارة المخاطر: استخدم الأهداف السعرية (BT وRT) لتحديد نقاط جني الأرباح أو وقف الخسارة.
تقييم السيولة: ركز على المستويات ذات السيولة العالية لأنها غالبًا تكون نقاط تحول رئيسية في السوق.
تأكيد التحليل: ادمج عدد اللمسات مع القوة والسيولة للحصول على صورة كاملة عن أهمية المستوى.
تخصيص التسميات
يمكن للمستخدم تفعيل أو تعطيل أي من هذه القيم (القوة، الاحتمالية، السيولة، الأهداف) من إعدادات المؤشر.
يمكن أيضًا تغيير حجم التسميات (صغير، عادي، كبير)، موقعها (يمين، يسار، أعلى، أسفل)، ولون النص لتناسب احتياجاتك.
التسميات في هذا المؤشر هي بمثابة لوحة تحكم صغيرة بجانب كل مستوى دعم ومقاومة، تقدم لك معلومات فورية عن قوته، احتمالية اختراقه، سيولته، وأهدافه السعرية. بفهم هذه الأرقام، يمكنك تحسين قراراتك في التداول، سواء كنت تبحث عن نقاط دخول، خروج، أو إدارة مخاطر. إذا كنت تريد أداة تجمع بين البساطة والعمق التحليلي .
تنويه:
المؤشر هو أداة مساعدة فقط ويجب استخدامه مع التحليل الفني والأساسي لتحقيق أفضل النتائج.
إخلاء المسؤولية
لا يُقصد بالمعلومات والمنشورات أن تكون، أو تشكل، أي نصيحة مالية أو استثمارية أو تجارية أو أنواع أخرى من النصائح أو التوصيات المقدمة أو المعتمدة من TradingView.
The Smart Volume S/R Pro indicator is an advanced technical analysis tool designed to help traders identify strong support and resistance levels based on trading volume, with the addition of advanced analytical features such as trend filtering, confidence zones, strength assessment, breakout probability calculation, liquidity measurement, price target identification, and Fibonacci levels. It also provides labels next to each support and resistance level, containing accurate numbers and information that reflect the market condition. These labels are not just decorations, but analytical tools that help traders make informed decisions based on market data. This indicator aims to provide a comprehensive view of the market.
Main functions of the indicator
1- Identifying support and resistance levels based on high trading volume
The indicator analyzes previous bars (up to 300 bars by default) to identify the points that witnessed the highest levels of trading volume.
It draws horizontal lines representing resistance levels (at the highest price in those bars) and support (at the lowest price), and the user can choose the number of lines displayed (from 1 to 6).
2- Filtering the trend using the ADX indicator
The indicator uses the Average Directional Index (ADX) to assess the strength of a trend in the market.
When the strength of the trend is high (exceeding a specified threshold, 25 by default), the indicator reduces the number of support and resistance levels displayed to focus only on the most important levels.
3- Dynamic Confidence Zones
The indicator adds zones around support and resistance levels based on the Average True Range (ATR), helping traders visualize the ranges in which the price may interact with these levels.
The width of these zones can be adjusted using the ATR multiplier.
4- Assessing the Strength of Levels
The indicator calculates the strength of each level based on trading volume, the number of times the level has been tested (Touch Count), and the proximity of the current price to the level.
A strength score (from 0 to 100) is displayed next to each level if this feature is enabled.
5- Breakout Probability
The indicator estimates the probability of breaking each level based on momentum (ROC), the strength of the level, and the distance between the current price and the level.
The probability is displayed as a percentage if the option is enabled, helping traders anticipate potential moves.
6- Historical Liquidity Analysis
The indicator measures liquidity around each level based on the trading volume in the ranges near it.
The liquidity values can be displayed in the labels or used to adjust the width of the lines (the most liquid lines appear wider).
7- Price Targets
When this feature is enabled, the indicator calculates price targets for breakout and reversal based on momentum, level strength and ATR.
These targets can be displayed as text in the labels or as horizontal lines on the chart.
8- Fibonacci Levels
The indicator plots Fibonacci levels (0.0, 0.236, 0.382, 0.5, 0.618, 0.786, 1.0) based on the highest and lowest price in the lookback period.
The user can choose which of these levels to display or hide.
9- Comprehensive Breakout Alert
The indicator provides a single alert that includes all levels, where the alert is triggered when the price breaks any support or resistance level with a message explaining the type of breakout and the level broken.
How the indicator works
Step 1: The indicator identifies the bars with high volume during the specified Lookback Period.
Step 2: Draws support and resistance levels based on the highest and lowest prices in those bars, taking into account the number of lines selected by the user.
Step 3: Apply the trend filter (if enabled) to reduce the number of levels in case of a strong trend.
Step 4: Adds additional analyses such as strength, liquidity, breakout probability, and price targets, and draws confidence zones and Fibonacci levels according to the settings.
Step 5: Monitors the price and triggers an alert when the breakout occurs.
Customizable Settings
1- Lookback Period: Number of bars to analyze (default 300).
2- Number of Lines: From 1 to 6 support and resistance levels.
3- Colors and Styles: Line colors and styles can be changed (filled, dashed, dotted).
4- Labels: Enable/disable labels, their size, location, and text color.
5- Trend Filter: Enable/disable ADX, and modify its length and threshold.
6- Confidence Zones: Enable/disable, and modify the ATR length and multiplier.
7- Strength and Breakout Probability: Enable/disable the display, and modify the ROC length.
8- Liquidity: Enable/disable the effect of liquidity on the display of the lines and their values in the labels.
9- Price Targets: Enable/disable the targets and display them as lines.
10- Fibonacci: Choose the displayed levels and the color of the lines.
Indicator Benefits
High Accuracy: It relies on trading volume to determine the levels, which makes it more reliable than random levels.
Flexibility: It provides extensive customization options that allow traders to adapt it to their strategies.
Comprehensive Analysis: Combines support and resistance, trend, liquidity, and targets in one tool. Ease of Use: Labels and alerts make it easy to follow the market without complexity.
Labels next to each support and resistance level contain accurate numbers and information that reflect the market situation. These labels are not just decorations, but analytical tools that help traders make informed decisions based on market data. In this explanation, we will review each number or value that appears in the labels and their practical meaning.
Label Components
Labels appear next to each support and resistance level and begin with the letter "S" for support or "R" for resistance, followed by a set of numbers and values that can be enabled or disabled according to the user's settings. Here is a breakdown of each element:
1- Touch Count
Symbol: Appears immediately after "S" or "R" (example: "R: 5" or "S: 3").
Meaning: Indicates the number of times the price has tested this level without breaking it.
Benefit: The more touches, the stronger and more important the level. For example, if it is "R: 5", it means that the price has bounced off this level 5 times, making it a potentially strong resistance.
2- Strength Rating
Symbol: Appears between square brackets (example: " ").
Meaning: A value from 0 to 100 that reflects the strength of the level based on factors such as trading volume, number of touches, and proximity of the current price to the level.
Benefit: High values (such as 75 or more) indicate a strong level that is difficult to break, while low values (such as 30 or less) indicate a weak level that is easy to break. A trader can use this to determine the most reliable levels.
3- Breakout Probability
Symbol: Starts with the letter "B" followed by a percentage (example: "B: 60%").
Meaning: A percentage from 0% to 100% that shows the probability of the price breaking the level based on the current momentum, the strength of the level, and the distance between the price and the level.
Interest: A high percentage (such as 60% or more) means that the price may soon break through the level, while low percentages (such as 20%) indicate that the price may bounce. This is useful for anticipating the next move.
4- Liquidity Value
Symbol: Starts with the letter "L" followed by a number (example: "L: 1200").
Meaning: Represents the average trading volume in the range near the level, reflecting historical liquidity around it.
Interest: High values indicate high liquidity, meaning that the price may react strongly to this level (either by bouncing or breaking through). Low values indicate low liquidity, which may make the level less influential.
5- Price Targets
Symbol: Starts with "BT" (breakout target) and "RT" (rebound target) followed by numbers (example: "BT: 150.50 RT: 148.20").
Meaning:
BT (Breakout Target): The potential price that the price may reach after breaking the level.
RT (Reversal Target): The potential price that the price may reach if it rebounds from the level.
Utility: Helps traders identify potential exit points after a breakout or rebound, making it easier to develop an accurate trading plan.
Working examples
Resistance label: "R: 4 B: 25% L: 1500 BT: 155.00 RT: 152.00"
Level tested 4 times, strength 80 (very strong), probability of breakout 25% (low, i.e. higher probability of rebound), liquidity 1500 (high), breakout target 155.00, rebound target 152.00.
Conclusion: The level is strong and the price is likely to rebound from it, but if it breaks, it may reach 155.00.
Support Label: "S: 2 B: 70% L: 800 BT: 145.00 RT: 147.50"
Level tested twice, Strength 40 (medium to weak), Breakout Probability 70% (high), Liquidity 800 (medium), Breakout Target 145.00, Rebound Target 147.50.
Conclusion: The level is weak and the price is likely to break it to drop to 145.00.
How to use labels
Determine strength and weakness: Use the level's strength to see if the level is reliable for a bounce or vulnerable to a breakout.
Predict the move: Look at the Breakout Probability to determine whether to wait for a breakout or a bounce.
Risk Management: Use price targets (BT and RT) to set take profit or stop loss points.
Liquidity Evaluation: Focus on levels with high liquidity as they are often key turning points in the market.
Analysis Confirmation: Combine the number of touches with strength and liquidity to get a complete picture of the level’s importance.
Customize Labels
The user can enable or disable any of these values (strength, probability, liquidity, targets) from the indicator settings.
The size of the labels (small, normal, large), their position (right, left, top, bottom), and the color of the text can also be changed to suit your needs.
The labels in this indicator act as a small dashboard next to each support and resistance level, providing you with instant information about its strength, probability of breakout, liquidity, and price targets. By understanding these numbers, you can improve your trading decisions, whether you are looking for entry points, exit points, or risk management. If you want a tool that combines simplicity with analytical depth.
Disclaimer:
The indicator is an auxiliary tool only and should be used in conjunction with technical and fundamental analysis for best results.
Disclaimer
The information and posts are not intended to be, or constitute, any financial, investment, trading or other types of advice or recommendations provided or endorsed by TradingView.

Trade Quality Rating: signal rating from 1 to 5 starsOverview
The indicator is built to generate trading signals based on a combination of technical indicators and then assign each signal a quality rating from 1 to 5 stars. The idea is that the more filters that are met, the stronger (or higher quality) the signal is assumed to be. You can then use these quality ratings to decide which signals to act upon, keeping in mind that a higher-rated signal has more confirming factors.
Components of the Indicator
Simple Moving Averages (SMAs):
SMA9 and SMA20:
These two moving averages are used to detect short-term trend changes via crossovers. A bullish signal is generated when the SMA9 crosses above the SMA20, and a bearish signal when it crosses below.
SMA200 (on the current timeframe) & Daily SMA200:
The SMA200 on your current chart helps smooth out the price action.
The Daily SMA200 serves as a long-term trend filter. For a valid long signal, the price must be above the Daily SMA200, and vice versa for a short signal.
MACD (Moving Average Convergence Divergence):
The MACD is calculated using standard parameters (12, 26, 9).
It adds momentum confirmation to the signal. For a long trade, the MACD line should be above its signal line, and for a short trade, below.
RSI (Relative Strength Index):
Calculated with a 14-period setting.
For long signals, the RSI must be above 50 (indicating upward momentum), while for short signals, it should be below 50.
This filter is one of the additional conditions that add to the quality rating.
Volume Filter:
A 20-period moving average of volume is computed.
The current volume must exceed this average, suggesting that there is enough market participation backing the move.
This is another extra filter that adds to the overall quality score.
ADX (Average Directional Index):
The ADX is manually calculated in the script (using a 14-period setting) to gauge the strength of the trend.
A value above 25 is considered to confirm that a strong trend is in place, making the signal more reliable.
VWAP (Volume Weighted Average Price):
The session VWAP is computed on a daily basis.
For long trades, the price should be above the VWAP, and for short trades, below.
This serves as a confirmation that the current price is moving in the right direction relative to the volume-weighted average.
Signal Generation and Quality Rating
Base Signal (1 Star):
The fundamental trade signal is generated when the SMA9/SMA20 crossover occurs, in combination with the MACD confirmation and the condition that the price is on the correct side of the Daily SMA200. This base signal provides a 1-star quality rating.
Additional Filters (Adding Extra Stars):
RSI Filter: Adds 1 extra star if the RSI condition is met (RSI > 50 for long or RSI < 50 for short).
Volume Filter: Adds 1 extra star if the current volume exceeds its 20-period moving average.
ADX Filter: Adds 1 extra star if the ADX value is above 25, confirming a strong trend.
VWAP Filter: Adds 1 extra star if the price is above the VWAP for long trades (or below for short trades).
When all filters are met, you get a 5-star rating (1 star base + 4 extra stars).
Display and Alerts:
The indicator plots your SMAs on the chart.
When a signal occurs, it places a label on the chart showing the trade direction ("BUY" or "SELL") along with the quality rating in stars.
Additionally, alert conditions are set up so that you can receive notifications when a valid signal (based on the base criteria) is generated.
How to Use This Indicator
Filtering Trades:
Use the quality rating as a visual guide. For instance, if you want to only act on the most reliable setups, you might decide to trade only signals that are rated 4 or 5 stars.
Manual Confirmation:
Even with a high star rating, you can perform your own final checks (e.g., checking price action or additional chart patterns) before entering a trade.
Backtesting and Adjustment:
Because market conditions differ, it’s advisable to backtest the indicator on your instrument of choice and adjust the parameters (such as the ADX threshold or the period for volume averaging) to better suit your trading style.
Conclusion
This 5-star system indicator is designed to provide a comprehensive overview of trade quality by integrating multiple technical filters into one visual signal. It helps filter out noise by ensuring that a trade signal not only meets a basic SMA and MACD condition but also aligns with volume, trend strength (ADX), and VWAP criteria. This multi-layered approach can lead to fewer but higher quality trades, allowing you to focus on setups that have more confluence.
Happy trading!
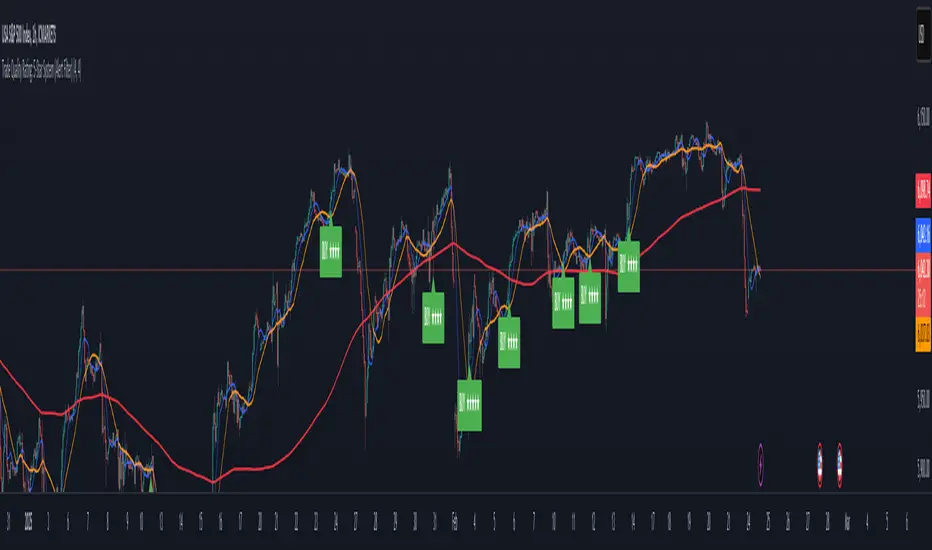
HMM Regime IndicatorHMM Regime Indicator
Overview:
The HMM Regime Indicator is designed to help traders identify market regimes by analyzing trend strength, momentum, and price deviation. It uses a combination of the Average Directional Index (ADX), Relative Strength Index (RSI), and Commodity Channel Index (CCI) to classify market conditions into three distinct regimes: Bullish, Bearish, and Sideways.
Key Features:
ADX (Average Directional Index): Measures the strength of a trend. A high ADX value indicates a strong trend, while a low value suggests a weak or non-existent trend.
RSI (Relative Strength Index): Identifies overbought or oversold conditions. An RSI above 70 typically indicates overbought conditions, while an RSI below 30 suggests oversold conditions.
CCI (Commodity Channel Index): Evaluates the price deviation from its average. High CCI values indicate that prices are well above their average, while low values suggest prices are below their average.
Regime Detection:
Bullish Regime: Identified when the ADX indicates a strong trend, and both RSI and CCI suggest overbought conditions. This regime is marked with a green background on the chart.
Bearish Regime: Detected when the ADX shows a strong trend, and both RSI and CCI indicate oversold conditions. This regime is highlighted with a red background.
Sideways Regime: Occurs when neither bullish nor bearish conditions are met, suggesting a lack of strong directional movement. This regime is shown with a blue background.
Usage:
This indicator is useful for traders looking to understand the current market environment and adjust their strategies accordingly. By identifying the prevailing market regime, traders can make more informed decisions about entering or exiting trades.
Customization:
Users can adjust the input parameters for ADX, RSI, and CCI to better fit their trading style and the specific asset being analyzed. The default settings are optimized for general use but can be tailored to suit individual preferences.

Premium Signals [BRTLab]Overview
BRTLab Premium Signals is a versatile and comprehensive tool designed for trading across various assets and timeframes, including cryptocurrencies, stocks, and forex. One of its standout features is a dynamic dashboard that provides real-time signal updates from the selected timeframes in the settings. The dashboard displays only relevant signals from the chosen timeframes, ensuring that traders have the most accurate and timely information without clutter. If a lower timeframe is selected in the settings but is smaller than the current chart timeframe, signals from those lower timeframes will be ignored, maintaining focus on higher-priority data.
The indicator is especially useful for traders who work with moving averages (MA), pivot points (PP), and other strategies, offering high-precision signals that simplify decision-making. Based on practical experience, stop-losses are often placed near structural highs/lows, while take-profits can be set for short-term gains (1-1.3%). However, additional tools within the indicator allow traders to capture larger moves when possible. MA signals help traders ride long-term trends, while ADX and candlestick signals are ideal for shorter, faster trades. Notably, ADX signals from the daily timeframe often point to significant market moves.
💡Features
Comprehensive Dashboard with Signal Integration:
The dashboard is the central feature of this indicator, displaying key signals from various timeframes that the user selects. All signals are integrated into the dashboard, enabling traders to perform a comprehensive analysis based on multiple technical analysis aspects. This consolidated view of market conditions helps traders quickly assess trading opportunities across various indicators. By filtering and displaying only the most relevant signals based on timeframe settings, the dashboard acts as a strategic decision-making tool that simplifies trade monitoring and execution.
Customizable Signal Selection:
Traders can select specific signals to display on the dashboard, allowing for complete customization based on individual trading strategies. This flexibility helps filter out unnecessary market noise, keeping the focus on the signals most aligned with the trader's goals and market conditions.
Signal Logic Overview:
ADX
The ADX-based signals reflect the strength of market trends. Bullish or bearish signals are generated when directional indicators (+DI or -DI) show increasing strength relative to one another, indicating the start or continuation of a strong trend.
RSX
These signals focus on divergences within RSI, identifying potential reversals by detecting either classic or hidden divergences when the market is overbought or oversold.
V9
Signals are generated when the price interacts with a dynamic threshold, indicating trend continuation or reversal. Additional filters can be applied to refine these signals further, enhancing the dashboard's overall effectiveness.
CAND
Candlestick-based signals are triggered by key patterns such as bullish or bearish engulfing formations. These signals are cross-checked with other conditions, such as RSI levels and candle stability, making them especially useful for short-term trading.
PP (Pivot Points)
Pivot Point signals reinforce candlestick patterns by aligning with key support or resistance levels, suggesting potential reversals or continuation opportunities at significant price points.
MA (Moving Average)
MA signals help identify trends by analyzing price action relative to a moving average. Optional filters like ADX add an additional layer of validation, ensuring only high-confidence signals are displayed on the dashboard.
LVL (Levels)
These signals are based on shifts in RSI and help traders spot potential breakouts or reversals. The dashboard integrates these signals alongside MA and ADX filters to enhance their accuracy.
⚠️ RISK DISCLAIMER
Trading involves significant risk, and most day traders experience losses. All content, tools, scripts, articles, and educational materials provided by BRTLab are solely for informational and educational purposes. Past performance does not guarantee future results.
⚡Conclusion
This indicator, with its highly customizable dashboard and advanced signal logic, offers a powerful all-in-one solution for traders across different markets and timeframes. The integration of multiple signal types into the dashboard allows traders to make well-informed decisions with minimal effort, enhancing both precision and confidence in trade execution. Its flexibility and ease of use make it an essential tool for traders looking to streamline their analysis and improve their trading outcomes.
