Fabonacci Trailer - [Alerts]This script comes with the following indicators and features:
ADX indicator
Chop indicator
Super Trend indicator
Trailing Take Profit and Stop Loss
Entry, Take Profit, and Stop Loss Alerts
Renko chart support
And a few more indicators in the back-end to increase accuracy and optimize entries
This script works really well as a scalper on lower Time Frames as well as on higher Time Frames. Besides that you can also use it on pretty much any coin or asset.
This script is not repainting. We advise to use alerts on “Once Per Bar Close”.
If you’d like to automate this script you can do that by using AutoView, ProfitView, ProfitTrailer, CryptoHopper etc.
Please note that this script is based on invite only.
스크립트에서 "adx"에 대해 찾기


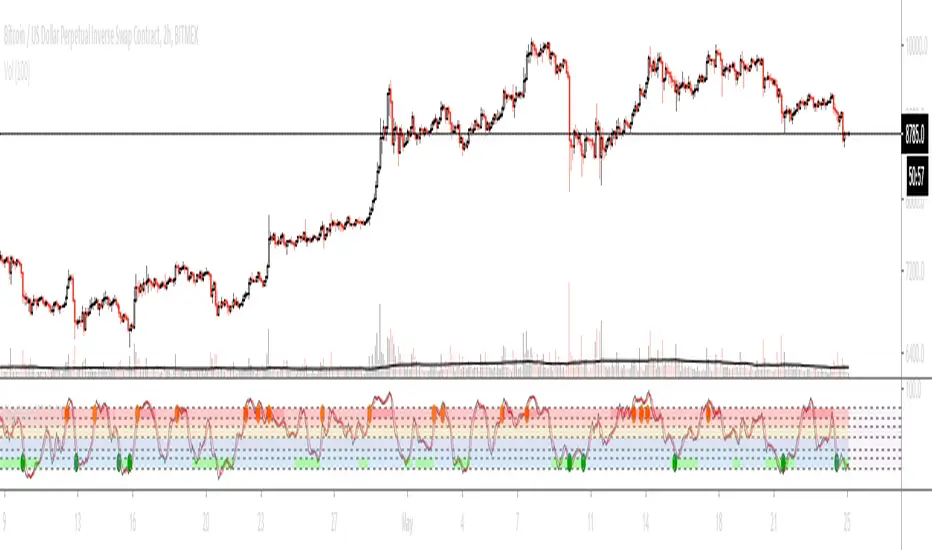
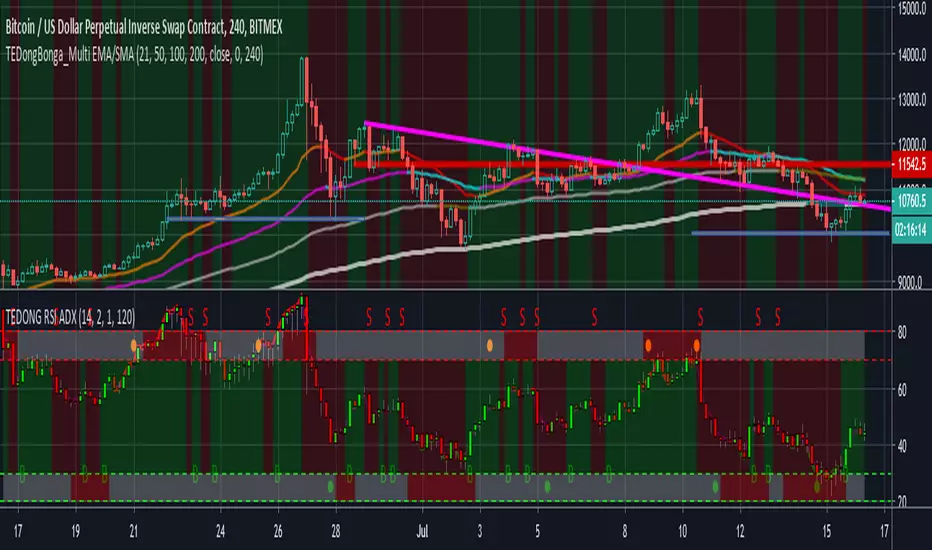
TEDong Bonga RSI ADXHey!
RSI ADX best indikator!
The logic is pretty simple:
value > 20: Oversold, next price action will follow that bullish trend, BUY signal is generated
value > 70: Overbought, next price action will follow that bearish trend, SELL signal is generated
If you have sny doubt just comment!
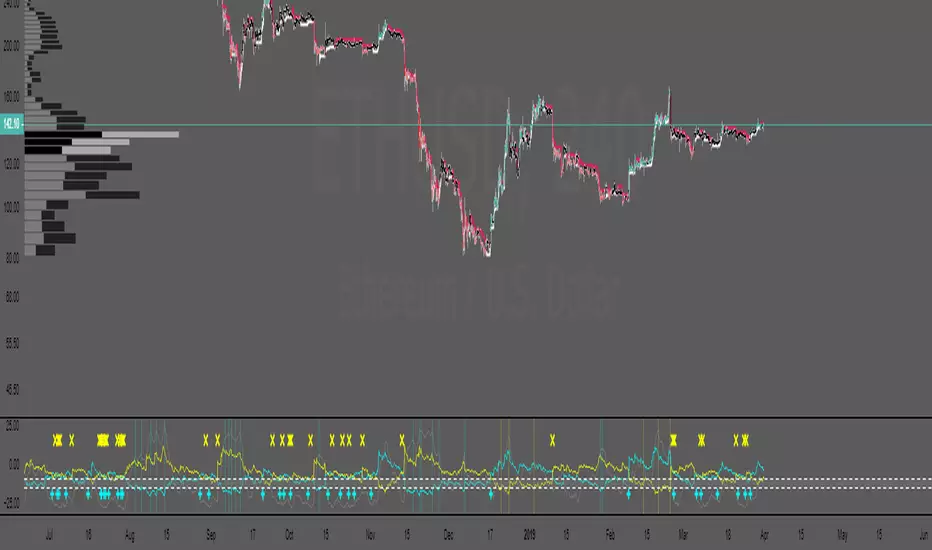
NOT-ONLY LONG V4 [Alerts]This Script is the second part of the previous one. In this second part it includes Longs and also Shorts. It is a little conservative, and is mainly used for swing trading. It can be used for everyday trading or if you’re using it for automated trading, you don’t necessarily need to run it as a bot. But you can do so if you want. To set it up without running it as a bot. Create the alerts that will send notifications to your mobile, and then when you receive an alert, you can place the order manually yourself. Maybe it could be a bit boring. But as someone said: "The Exchange is designed to transfer the money of the impatient to the patients." -Warren Buffett.
This script uses RMI + ADX + RSI, and for the main trend the famous Ichimoku, here I thought wasn’t good for anything, but look at how well it works with ETH.
I had to put the security () function only for Ichimoku. It can be used in this way without causing problems with repainting, but you have to know what measures to take to ensure it does not overlap, or so that the backtest is accurate.
indexHighTF = barstate.isrealtime ? 1 : 0
indexCurrTF = barstate.isrealtime ? 0 : 1
a0 = security(syminfo.tickerid, 'D', close , lookahead=barmerge.lookahead_off)
a = a0
The preventive measures can be found in the link below:
www.tradingview.com
This script is like the world upside down. When the price goes up and you see an opportunity, you start creating shorts and the same thing can be done by creating longs when the price goes down. It can be very effective because remember what Warren Buffett said again: "The dumbest reason in the world to buy an action is that it is going up."
It leave the position only when Taking Profits.
It does not have Stop Loss, instead, when it reaches a set % loss, it makes a re-entry by laddering the trades.
I think that the Stops Loss only serves to get you liquidate. With the erratic price movements on the Exchanges, their movements can be between 5-20%, fucking you if you have a SL !! (conspiracy theories) ;-)
This world is invented for you to lose money, it is not easy to get rich and less likely with a script, but neither is it impossible, who knows, maybe this will help or at least give extra tool in your trading.
It's more or less adjusted for my favorite crypto currency: ETH on BITMEX and I'm sure there's a much better setting.
The best Timeframe that seems to be working well: ETH: 1 H
Greetings from Barcelona…
Thanks...
BTC: 3LEUP3WjQctdbFjBavcmRGUVRBje8bptCd
BCH: qrv6j7mpxjzzs9dudfag3glu278suchdhg7c44pa37
ETH: 0x518AAD4746912ae506c82B747488306186c4d546
ETC: 0xa2498D7AcB9303aa10F14ff27C54AAc4cE5d5705
ZRX: 0x29aC9BaC10818C30055b25A8E90dd11488Ae6df8
BAT: 0x115f3F9D1c3fC248e73644a72d77A062D3CB28Ba

ONLY LONG V4 [Alerts]Let's try the Version 4 ...
This script is only for long positions.
It's based on the conjunction of RMI + ADX + RSI for entries and only with Take Profit to close the position.
It doesn't have security (), nor Heikin Ashi, so the Backtest is Real.
Use always 'Once per bar'.
It doesn't repaint absolutely nothing at all.
Timeframe: 15 minutes
Have fun improving it ...
Enjoy!
Tips ...
BTC: 3LEUP3WjQctdbFjBavcmRGUVRBje8bptCd
ETH: 0x518AAD4746912ae506c82B747488306186c4d546


Stoch & RSI & ADXStochastic & RSI & ADX
trendbgcolor : judge by MA & MACD
long entry sign : lime cross
long close sign : aqua circles
short entry sign : red cross
short close sign : yellow circles

Zero Lag ADX [jwammo12]This uses Zero lag principles to ADX. The cyan line is the zero lag line and the grey line is the traditional ADX


SMI ADX TSI SIGNAL 30M// Signals or Alerts based on SMI, ADX, TSI Strategy
// Greatest index profit on 30M+ time frame
// Created and based on Binance chart
// Working with comission
// No repaint


ZR1DMI/ADX
blue is Bull momentum
yellow is Bear momentum
gray line is trending line
dotted is TREND LINE
idea:
look for two lines to be above the dotted TREND LINE
bullish = Bull momentum + Trending Line
bearish = Bear Momentum + Trending Line
when all three are converged or when Tending Line is below dotted its CHOP
Blue flashes when BULL momentum is growing
Yellow flashes when BEAR momentum is growing
NOTE: FOR PA TO MOVE WE DONT ALWAYS NEED 2 LINES ABOVE 1 BELOW
a secondary trade idea is simply on cross over .
when Trending line + one of the momentum lines crosses over the 3rd line (secondary momentum) this can also be seem as trend confirmation.
with that said the strongest and safest set ups are still when 2 is above the TRENDING LINE and 1 below
Color CandlesUses 6 most common indicators to color candles when they give buy/sell signals.
Use line view to see candle colors.
Purple = 6 buy signals
Teal = 5 buy signals
Navy = 4 buy signals
Lime = 3 buy signals
Green = 2 buy signals
Pale Green = 1 Buy signal
White = neutral
Gray = 1 sell signal
Yellow = 2 sell signals
Orange = 3 sell signals
Red = 4 sell signals
Firebrick = 5 sell signals
Black = 6 sell signals
Parabolic SAR calculated as .02, .02, .2. Traditional Buy/Sell. Green/Red Dots.
Bollinger Band calculated as 20, 1. Buy/Sell when above or below band. Aqua filled band.
MACD calculated with emas 12, 26, 9. Traditional MACD/Signal cross Buy/Sell. Filled Blue/Orange band.
RSI length 14. Traditional Buy/Sell below 30 and above 70. Green/Yellow/Red line below price.
ADX/DI len 14. Traditional crossover Buy/Sell. Filled Lime/Green above price.
Stochastic 14/3/3. Traditional 20/80 Buy/Sell. Filled teal/orange above price.

Criptoimpulso - ADX strategyThis scripts uses adx and simple media to search for inputs and outputs.
The script is simple, when the green arrow appears, it suggets to open a position, and when is red, close position.
The script is recommended with low timeframes 1,3,5 minutes.


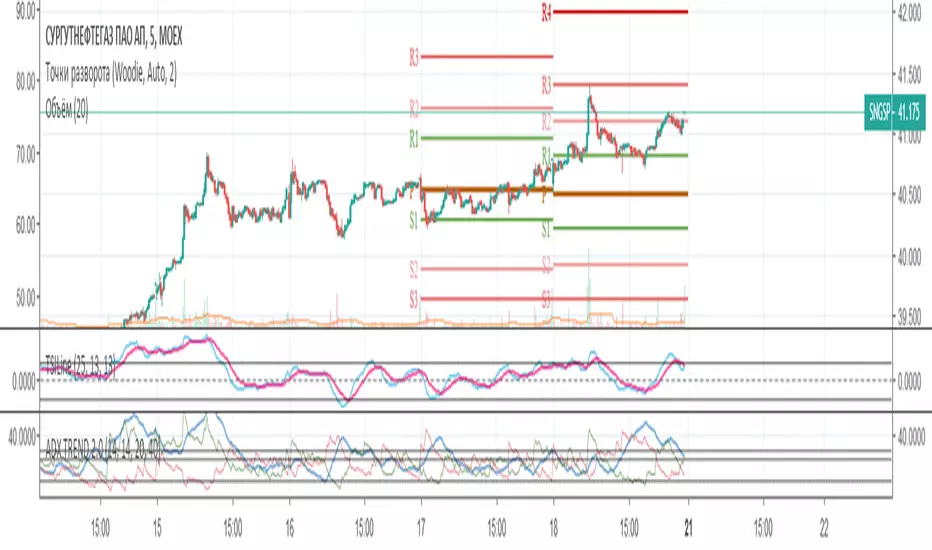
DMI ADX TREND 2.0 (edit by GeertVD)Edit of the popular script by @TraderR0BERT
New features:
- horizontal colored areas, indication weak/medium/strong trend
- vertical bars, signaling trend/momentum changes
- DI+ vs DI- contraction/expansion histogram (to measure the DI volatility)

Slow Stochastic + ADX exhaustationSlow stochastic with ADX exhaustation and sell/entry points as orange/green circles.
This is a script I remade from Marco Valente's "RSI Combo" and Oshri17 "Slow stochastic".
Credits and thanks to them for sharing, I just expanded the diversity ^^
Hope you enjoy phit! ;D