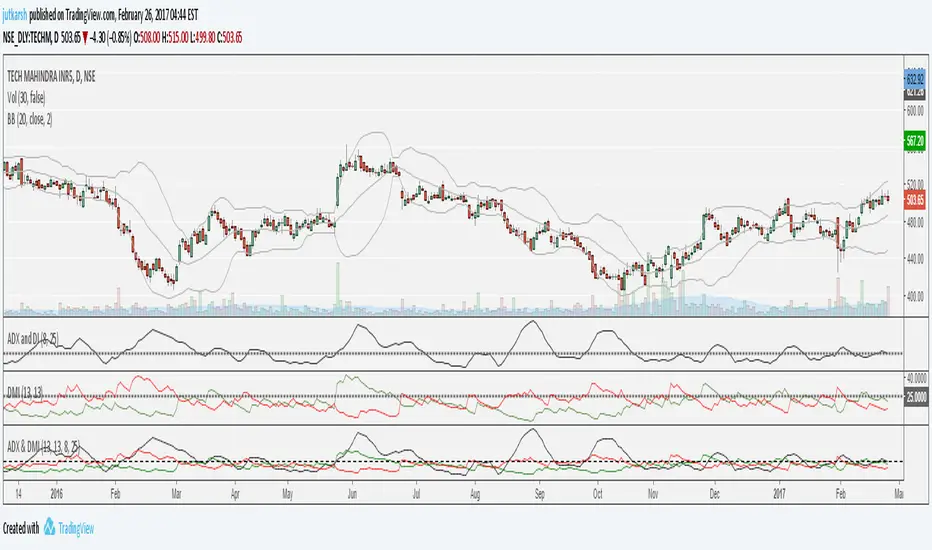
ADX-DI MTF trend indication - JD version 2Version 2 added support for MTF, to see the trend direction on the lower or higher timeframe.
As an example to see the difference, the indicator is added three times, one time for the current TF, one set at the higher and one at the lower TF.
Cudo's to Chris Moody for the MTF-switching-code!!
JD.
스크립트에서 "adx"에 대해 찾기


HYPER ADX V5Fixed rendering problen at progressing bars for ultra low time frames. Added alert options for cross types.
HYPER ADX V4In this version, the base line also react to price change for more accurate crossovers. New bars render problem at some time frames fixed.


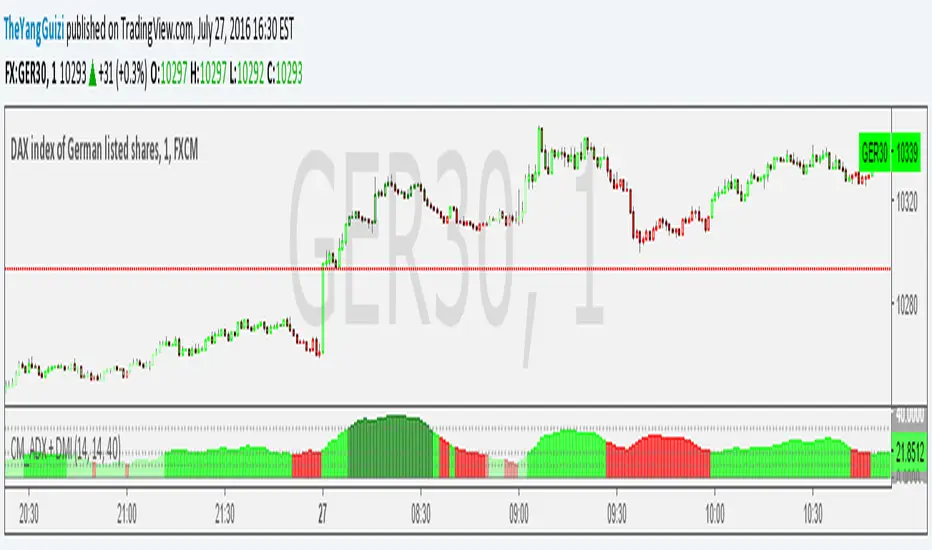
CM_ADX+DMI ModMashed together Chris Moody's ADX thing with his DMI thing.
So you can see trend strength + direction
green-ish = uptrend-ish//red-ish = downtrend-ish
Colors can be adjusted though.
below 10 = gray, not much going on
10 - 20 = light green/light red, could be the beginning o something
20 - 40 = bright green / bright red, something is going on
above 40 = dark green, dark red, exhaustion (default is 40, can be adjusted to whatever)

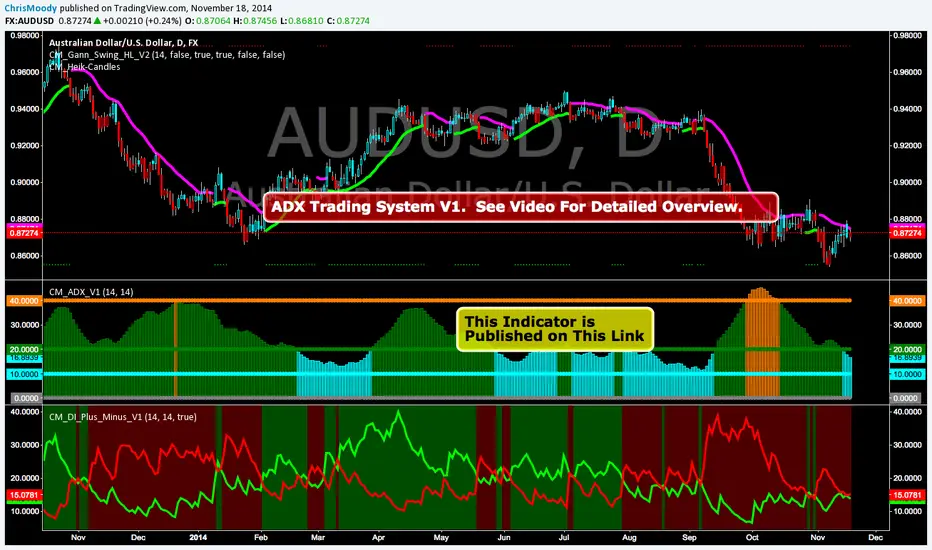
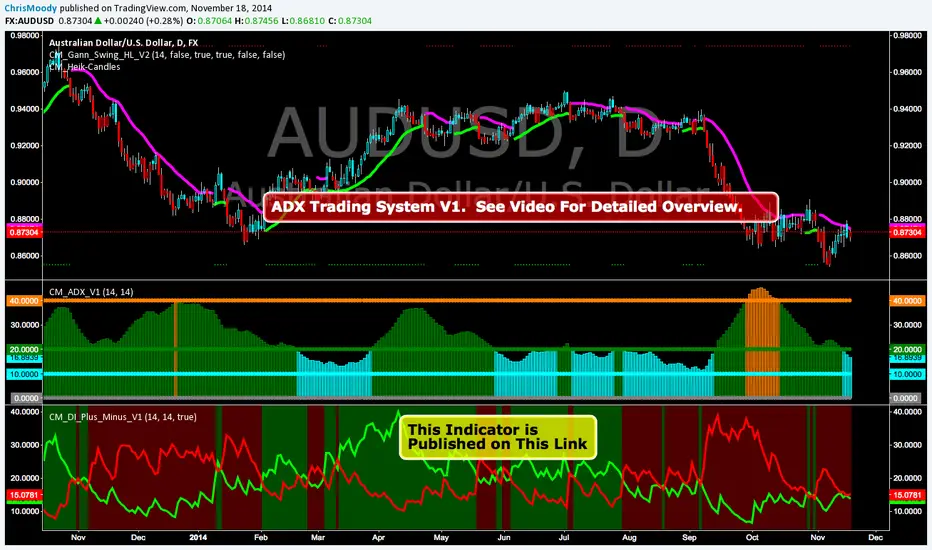
CM_ADX_V1ADX System Overview
So I Came Across Another Trading System for Only $997. However, if you purchased in the next 24hours the whole system could be Yours For Only $497.
So I decided to Code it. This is only Version 1, and I discuss in the Video What I’ve found so for, some plans for Version 2 of the indicator, and I ask for your feedback on anything you find.
Indicators used in System:
CM_DI_Plus_Minus_V1 (Indicator On Bottom).
CM_ADX_V1 (Indicator On 2nd Pane).
CM_Gann_Swing_Hi_Lo (Indicator on Price Pane). This Indicator was published before…Link Below.
CM_DI_Plus_Minus_V1
In Video I go over settings and how to customize charts.
Link To Video:
vimeopro.com
Link To Downloadable PDF Shown in Video:
d.pr
CM_DI_Plus_MinusADX System Overview
So I Came Across Another Trading System for Only $997. However, if you purchased in the next 24hours the whole system could be Yours For Only $497.
So I decided to Code it. This is only Version 1, and I discuss in the Video What I’ve found so for, some plans for Version 2 of the indicator, and I ask for your feedback on anything you find.
Indicators used in System:
CM_DI_Plus_Minus_V1 (Indicator On Bottom).
CM_ADX_V1 (Indicator On 2nd Pane).
CM_Gann_Swing_Hi_Lo (Indicator on Price Pane). This Indicator was published before…Link Below.
In Video I go over settings and how to customize charts.
Link To Video:
vimeopro.com
Link To Downloadable PDF Shown in Video:
d.pr
Directional Movement (DMI)Directional Movement indicator implemented in Pine script. Use it to customize ADX behavior.

Heeger Alert | Didi's Needles setup [HeegerBot]Indicator based on Color Candles - Didi's Needles setup , but now exclusively focused on generating alerts.
With this indicator, you can set up alerts and notifications on TradingView for up to 15 assets based on Didi Aguiar's setup. Additionally, you can specify whether the alert should trigger at the candle close or X minutes before the close.
A session filter has also been added, allowing you to configure alerts to trigger only during a specific session.
Description of monitored signals:
The setup involves the crossing of three moving averages, along with the trend analysis in the ADX and the open Bollinger Bands.
The moving averages will be named "Didi Index". We will have the 3-period average as "Fast Average", the 8-period average as "Median Average", and the 20-period average as "Slow Average". When the Fast Average crosses the Median Average, we will have an alert, and when the Slow Average crosses the Median Average, we will have a confirmation. To adjust the Didi Index in the signals, the Median Average was normalized, that is, it will always be equal to 0. For the Slow and Fast Average, we will only consider the percentage difference in relation to the Median Average.
In addition to the moving averages, we analyze whether the ADX is rising, with DI+ above DI- to indicate an uptrend, or if the ADX is rising, with DI- above DI+ to indicate a downtrend. We also check if the Bollinger Bands are open. With these conditions, we will have a Needle.
Now I'm going to detail how I set this up on the indicator and some filters that I inserted for my personal use, along with some additional signals from the setup.
# Needle Alert
Firstly, we have the "Needle Alert" signal. This signal occurs when the Fast Average crosses the Median Average, along with the trend confirmation in the ADX and the opening of the Bollinger Bands. The filter is set at "1", which means we will only consider the needle alert when the percentage difference between the Slow Average and the Median Average is below 1%. This signal can be used as an entry point or to monitor the asset. Let's go through the examples:
• For a "Buy Alert", the Fast Average must cross the Median Average from bottom to top, and the percentage difference between the Slow Average and the Median Average should be less than +1% and greater than 0, as indicated by the Didi Index.
• For a "Sell Alert", the Fast Average must cross the Median Average from top to bottom, and the percentage difference between the Slow Average and the Median Average should be greater than -1% and less than 0, as indicated by the Didi Index.
We also have the alert projection, which serves as a signal to attract attention and monitor the asset. I use a "0.1" filter, which means that the percentage difference between the Fast Average and the Median Average must be equal to or less than 0.1%. Let's look at the example:
• For a "Buy Alert Projection", the Fast Average should be below the Median Average, and the percentage difference between the Fast Average and the Median Average should be greater than -0.1% and less than 0. In addition, the Slow Average should be above the Median Average in the Didi Index.
• For a "Buy Alert Projection", the Fast Average should be below the Median Average, and the percentage difference between the Fast Average and the Median Average should be greater than -0.1% and less than 0. In addition, the Slow Average should be above the Median Average in the Didi Index.
# Needle
After the Needle Alert, we have the Needle Confirmation, which occurs when the Slow Average crosses the Median Average after the alert. This signal is used to enter the operation. Let's divide this signal into two parts:
1. Needle: We use a filter of "3" (adjustable). This means that, to be considered a "Needle", the candle distance between the Alert (crossing of the Fast Average with the Median Average) and the Confirmation (crossing of the Slow Average with the Median Average) must be equal to or less than 3 candles. Also, there needs to be a trend on the ADX and the Bollinger Bands should be open.
2. Queijo Minas Needle (QM): Essentially, it's a Needle that occurs outside of the filter, with a candle distance between the Alert and the Confirmation above "3" candles. A trend on the ADX and open Bollinger Bands are also necessary.
To anticipate the Needle Confirmation, we use the "Needle Projection" signal. This signal has two filters: the "Needle Projection with Alert", set as "0.1%", and the "Needle Projection after the Alert", set as "0.3%".
1. The "Needle Projection with Alert" generates the signal when the "Needle Alert" occurs (crossing of the Fast Average with the Median Average), as long as the difference between the Slow Average and the Median Average is less than 0.1%.
2. The "Needle Projection after the Alert" generates the signal when the Fast Average has already crossed the Median Average, and the difference between the Slow Average and the Median Average should be less than 0.3%.
# BJMA (Spider Woman's Kiss)
There is another variation of the needle called BJMA. Essentially, it occurs when the Fast Average and the Slow Average approach the Median Average (each on one pole), but do not cross the Median and return to where they came from. In this signal, we have two filters: "Delta BJMA previous candle" and "Delta BJMA current candle". Let's see an example:
• Buy BJMA: First, we observe the previous candle, where the Fast Average must be above 0 (above the Median Average) and the percentage difference should be less than 0.02. In relation to the Slow Average, the configuration is the same, but in the negative sense, that is, it should be below 0 and above -0.02. Now, in the current candle, the Fast Average should be above 0 and below 0.05, while the Slow Average should be below 0 and above -0.05.
• Sell BJMA: First, we observe the previous candle, where the Fast Average must be below 0 (below the Median Average) and the percentage difference should be greater than -0.02. In relation to the Slow Average, the configuration is the same, but in the positive sense, that is, it should be above 0 and below 0.02. Now, in the current candle, the Fast Average should be below 0 and above -0.05, while the Slow Average should be above 0 and below 0.05.
Now, let's look at two signals that are commonly used to stay in a position.
# Fake Point
The Fake Point is primarily used to identify retracements before a continuation of the prevailing trend. Typically, it is preceded by a Needle Confirmation or BJMA signal. Here are some examples:
• Fake Sell (Signal to Maintain a Buy Position): The Fast Average crosses the Median from top to bottom (entering the negative pole of the Didi Index), while the Slow Average, which is already below the Median (below 0), continues to decline further, increasing the percentage difference between the Fast and Slow Averages in the negative pole.
• Fake Buy (Signal to Maintain a Sell Position): It is the same as the fake sell scenario but in the positive pole. The Fast Average crosses the Median, entering the positive pole of the Didi Index, while the Slow Average, which was already above the Median, continues to increase the percentage difference with the Median. For example, if the Slow Average was at +1 on the Didi Index, it would now be at +1.3.
There is also another variation of the Fake Breakout that takes into consideration the ADX (Average Directional Index) to confirm the trend direction. In other words, if we have a fake sell signal that suggests a buy position, we want the ADX to indicate a buying trend, and vice versa.
# Bought and Sold
This signal basically checks whether the indicators continue to confirm the previous signals. There are two variations: "Bought/Sold" and "Bought/Sold without Bollinger Bands". Let's see an example:
• Bought: The Didi Index is in the buying position, which means the Fast Average is above the Median Average (above 0), and the Slow Average is below the Median Average. Additionally, the ADX is indicating a buying trend and the Bollinger Bands are open.
• Sold: The Didi Index is in the selling position, which means the Fast Average is below 0 and the Slow Average is above 0. Moreover, the ADX is indicating a selling trend and the Bollinger Bands are open.
• Bought/Sold without Bollinger Bands: It's the same signal, but without considering whether the Bollinger Bands are open or not.
We can also consider the "Bought/Sold" signal based on the Trix and Stochastic, which would be additional confirmations of the movement.
Personally, I do not activate the Bought/Sold signal.
Now we come to signals to exit the position or take partial profits.
# Close
This exit signal is based on the following indicators: ADX, Bollinger Bands, Trix, and Stochastic. We wait for the ADX Kick or the falling ADX, along with the Bollinger Bands closing, and the Trix and Stochastic changing to the opposite side. Let's see some examples:
• Close a Buy: The ADX was in a buying trend (ADX rising and DI+ above DI-), but then the ADX Kick occurs or the ADX starts to fall. In addition, the Bollinger Bands close, and the Trix and Stochastic should switch to the sell signal.
• Close a Sell: The ADX was in a selling trend (ADX rising and DI- above DI+), but then the ADX Kick occurs or the ADX starts to fall. Also, the Bollinger Bands close, and the Trix and Stochastic should switch to the buy signal.
All indicators must provide signals together, but it is not necessary for all to occur in the exact same candle. For example:
1. The ADX Kick may occur, and the Trix and Stochastic switch to the buy signal, but the Bollinger Bands still remain open. In this case, we still do not have the exit signal.
2. In the next candle, the ADX continues to fall (after the Kick), the Trix and Stochastic continue to indicate buying, but this time the Bollinger Bands close. In this case, we have the "Close a Sell" signal.
It is important that all indicators are in accordance with the necessary signals, even if they occur in different candles, in order for the exit signal to be triggered.
# Close with Alert
This signal occurs when the Didi Index switches to the opposite side from where it was, along with a trend on the ADX, provided it's not a fake point. Let's see some examples:
• Close Buy - Sell Alert: Suppose we were in a buy position on the previous candle. In the current candle, the Fast Average crosses the Median Average from top to bottom, and the ADX indicates a sell trend. In this case, we completely close our buy position or make a partial realization.
• Close Sell - Buy Alert: Suppose we were in a sell position on the previous candle. In the current candle, the Fast Average crosses the Median Average from bottom to top, and the ADX indicates a buy trend. In this case, we completely close our sell position or make a partial realization.
------------------------------------------------------------------------------------------------------------------------------------------------------------------------------------------------------------------
Indicador baseado no Color Candles - Didi's Needles setup , mas agora focado exclusivamente na geração de alertas.
Com esse indicador, você pode configurar alertas e notificações no TradingView para até 15 ativos com base no setup de Didi Aguiar. Além disso, é possível definir se o alerta deve ser acionado no fechamento do candle ou X minutos antes do fechamento.
Também foi adicionado um filtro de sessão que permite configurar os alertas para serem acionados apenas durante uma sessão específica.
Descrição dos sinais monitorados:
O setup consiste no cruzamento de 3 médias móveis, juntamente com a análise da tendência no ADX e das bandas de Bollinger abertas.
As médias móveis serão nomeadas "Didi Index". Teremos a média de 3 períodos como "Média Rápida", a média de 8 períodos como "Média Mediana" e a média de 20 períodos como "Média Lenta". Quando a Média Rápida cruzar a Média Mediana, teremos um alerta e, quando a Média Lenta cruzar a Média Mediana, teremos uma confirmação. Para ajustar o Didi Index nos sinais, a Média Mediana foi normalizada, isto é, ela sempre será igual a 0. Para a Média Lenta e a Média Rápida, levaremos em consideração apenas a diferença percentual em relação à Média Mediana.
Além das médias móveis, analisamos se o ADX está em ascensão, com o DI+ acima do DI- para indicar uma tendência de alta, ou se o ADX está subindo, com o DI- acima do DI+ para indicar uma tendência de baixa. Também verificamos se as bandas de Bollinger estão abertas. Com essas condições, teremos uma Agulhada.
Agora vou detalhar como estabeleci isso no indicador e alguns filtros que inseri para o meu uso pessoal, além de alguns sinais adicionais do setup.
# Alerta de Agulhada
Primeiramente, temos o sinal de "Alerta de Agulhada". Este sinal acontece quando a Média Rápida cruza a Média Mediana, junto com a confirmação da tendência no ADX e a abertura das Bandas de Bollinger. O filtro está ajustado em "1", o que significa que só levaremos em consideração o alerta de agulhada quando a diferença percentual entre a Média Lenta e a Média Mediana estiver abaixo de 1%. Esse sinal pode ser utilizado como um ponto de entrada ou para monitorar o ativo. Vamos aos exemplos:
• Para um "Alerta de Compra", a Média Rápida deve cruzar a Média Mediana de baixo para cima, e a diferença percentual entre a Média Lenta e a Média Mediana deve ser menor que +1% e maior que 0, conforme indicado pelo Didi Index.
• Para um "Alerta de Venda", a Média Rápida deve cruzar a Média Mediana de cima para baixo, e a diferença percentual entre a Média Lenta e a Média Mediana deve ser maior que -1% e menor que 0, conforme indicado pelo Didi Index.
Também temos a projeção do alerta, que serve como um sinal para chamar atenção e monitorar o ativo. Eu uso um filtro de "0.1", o que significa que a diferença percentual entre a Média Rápida e a Média Mediana deve ser igual ou menor que 0.1%. Vamos ver o exemplo:
• Para uma "Projeção de Alerta de Compra", a Média Rápida deve estar abaixo da Média Mediana, e a diferença percentual entre a Média Rápida e a Média Mediana deve ser maior que -0.1% e menor que 0. Além disso, a Média Lenta deve estar acima da Média Mediana no Didi Index.
• Para uma "Projeção de Alerta de Compra", a Média Rápida deve estar abaixo da Média Mediana, e a diferença percentual entre a Média Rápida e a Média Mediana deve ser maior que -0.1% e menor que 0. Além disso, a Média Lenta deve estar acima da Média Mediana no Didi Index.
# Agulhada
Após o Alerta de Agulhada, temos a confirmação da Agulhada, que ocorre quando a Média Lenta cruza a Média Mediana após o alerta. Esse sinal é utilizado para entrar na operação. Vamos dividir esse sinal em duas partes:
1. Agulhada: Utilizamos um filtro de "3" (ajustável). Isso significa que, para ser considerada uma "Agulhada", a distância em velas entre o Alerta (cruzamento da Média Rápida com a Média Mediana) e a Confirmação (cruzamento da Média Lenta com a Média Mediana) deve ser igual ou menor que 3 velas. Além disso, é necessário ter uma tendência no ADX e as Bandas de Bollinger devem estar abertas.
2. Agulhada Queijo Minas (QM): Basicamente, é uma agulhada que ocorre fora do filtro, com uma distância em velas entre o Alerta e a Confirmação acima de "3" velas. Também é necessário ter uma tendência no ADX e as Bandas de Bollinger devem estar abertas.
Para antecipar a confirmação da Agulhada, utilizamos o sinal de "Projeção de Agulhada". Esse sinal possui dois filtros: o "Projeção de Agulhada com Alerta", configurado como "0.1%", e o "Projeção de Agulhada após o Alerta", configurado como "0.3%".
1. "Projeção de Agulhada com Alerta" gera o sinal quando ocorre o "Alerta de Agulhada" (cruzamento da Média Rápida com a Média Mediana), desde que a diferença entre a Média Lenta e a Média Mediana seja menor que 0.1%.
2. "Projeção de Agulhada após o Alerta" gera o sinal quando a Média Rápida já cruzou a Média Mediana, e a diferença entre a Média Lenta e a Média Mediana deve ser menor que 0.3%.
# BJMA (Beijo da Mulher Aranha)
Existe uma outra variação da agulhada chamada BJMA. Essencialmente, ocorre quando a Média Rápida e a Média Lenta se aproximam da Média Mediana (cada uma em um polo), mas não cruzam a Mediana e voltam para o lado de onde vieram. Nesse sinal, temos dois filtros: "Delta BJMA vela anterior" e "Delta BJMA vela atual". Vejamos um exemplo:
• BJMA de Compra: Primeiramente, observamos a vela anterior, onde a Média Rápida deve estar acima de 0 (acima da Média Mediana) e a diferença percentual deve ser menor que 0.02. Em relação à Média Lenta, a configuração é a mesma, porém no sentido negativo, ou seja, ela deve estar abaixo de 0 e acima de -0.02. Agora, na vela atual, a Média Rápida deve estar acima de 0 e abaixo de 0.05, enquanto a Média Lenta deve estar abaixo de 0 e acima de -0.05.
• BJMA de Venda: Primeiramente, observamos a vela anterior, onde a Média Rápida deve estar abaixo de 0 (abaixo da Média Mediana) e a diferença percentual deve ser maior que -0.02. Em relação à Média Lenta, a configuração é a mesma, porém no sentido positivo, ou seja, ela deve estar acima de 0 e abaixo de 0.02. Agora, na vela atual, a Média Rápida deve estar abaixo de 0 e acima de -0.05, enquanto a Média Lenta deve estar acima de 0 e abaixo de 0.05.
Agora vamos abordar dois sinais que são normalmente utilizados para manter uma posição.
# Ponto Falso (Fake Point)
O Ponto Falso é usado para identificar uma retração antes de retomar o movimento. Geralmente, ele ocorre após um sinal de Agulhada ou BJMA. Vejamos exemplos:
• Venda Falsa (sinal para manter uma posição de compra): A Média Rápida cruza a Média Mediana de cima para baixo (entrando no polo negativo do Didi Index), enquanto a Média Lenta, que já está abaixo da Média Mediana (abaixo de 0), continua caindo, aumentando assim a diferença percentual entre a Média Lenta e a Média Mediana no polo negativo.
• Compra Falsa (sinal para manter uma posição de venda): O cenário é semelhante, mas no polo positivo. A Média Rápida cruza a Média Mediana, passando para o lado positivo do Didi Index, enquanto a Média Lenta, que já estava acima da Média Mediana, continua aumentando a diferença percentual em relação à Média Mediana. Por exemplo, se a Média Lenta estava em +1 no Didi Index, agora ela está em +1.3.
Também existe uma variação do Ponto Falso em que verificamos se a tendência no ADX está se mantendo na mesma direção. Ou seja, se tivermos uma Venda Falsa (que seria um sinal para permanecermos em uma posição de compra), é importante que o ADX esteja indicando uma tendência de compra, e vice-versa. Dessa forma, consideramos não apenas o cruzamento das médias, mas também a confirmação da tendência no ADX. Essa variação é chamada de Ponto Falso com Tendência (Fake Point with Trend).
# Comprado e Vendido
Esse sinal, essencialmente, verifica se os indicadores estão mantendo a confirmação dos sinais anteriores. Existem duas variações: "Comprado/Vendido" e "Comprado/Vendido sem Bandas de Bollinger". Vejamos um exemplo:
• Comprado: O Didi Index está em compra, o que significa que a Média Rápida está acima da Média Mediana (acima de 0) e a Média Lenta está abaixo da Média Mediana. Além disso, o ADX está indicando uma tendência de compra e as Bandas de Bollinger estão abertas.
• Vendido: O Didi Index está em venda, o que significa que a Média Rápida está abaixo de 0 e a Média Lenta está acima de 0. Além disso, o ADX está indicando uma tendência de venda e as Bandas de Bollinger estão abertas.
• Comprado/Vendido sem Bollinger: É o mesmo sinal, porém sem considerar se as Bandas de Bollinger estão abertas ou não.
Podemos também considerar o "Comprado/Vendido" com base no Trix e no Estocástico, que seriam confirmações adicionais do movimento.
Eu, pessoalmente, não deixo ativado o sinal de Comprado/Vendido.
Agora chegamos aos sinais de saída da posição ou de realização parcial.
# Fechar (Close)
Este sinal de saída baseia-se nos seguintes indicadores: ADX, Bandas de Bollinger, Trix e Estocástico. Aguardamos o Kick do ADX ou o ADX em queda, juntamente com as Bandas de Bollinger se fechando, e o Trix e o Estocástico mudando para o lado oposto. Vamos ver alguns exemplos:
• Fechar uma Compra (Close Buy): O ADX estava em uma tendência de compra (ADX subindo e DI+ acima do DI-), mas em seguida ocorre o Kick do ADX ou o ADX começa a cair. Além disso, as Bandas de Bollinger se fecham e o Trix e o Estocástico devem mudar para o sinal de venda.
• Fechar uma Venda (Close Sell): O ADX estava em uma tendência de venda (ADX subindo e DI- acima do DI+), mas em seguida ocorre o Kick do ADX ou o ADX começa a cair. Além disso, as Bandas de Bollinger se fecham e o Trix e o Estocástico devem mudar para o sinal de compra.
Todos os indicadores devem fornecer os sinais em conjunto, mas não é necessário que todos ocorram exatamente na mesma vela. Por exemplo:
1. Pode ocorrer o Kick do ADX e o Trix e o Estocástico mudarem para o sinal de compra, mas as Bandas de Bollinger ainda permanecerem abertas. Nesse caso, ainda não teremos o sinal de saída.
2. No candle seguinte, o ADX continua caindo (após o Kick), o Trix e o Estocástico continuam indicando compra, mas desta vez as Bandas de Bollinger se fecham. Nesse caso, teremos o sinal de "Fechamento de uma Venda".
É importante que todos os indicadores estejam em conformidade com os sinais necessários, mesmo que ocorram em velas diferentes, para que seja acionado o sinal de saída.
# Fechar com Alerta (Close with Alert)
Esse sinal ocorre quando o Didi Index muda para o lado oposto do que estava, juntamente com uma tendência no ADX, desde que não seja um ponto falso. Vejamos exemplos:
• Fechar Compra - Alerta de Venda: Suponha que estávamos em uma posição de compra no candle anterior. No candle atual, a Média Rápida cruza a Média Mediana de cima para baixo, e o ADX indica uma tendência de venda. Nesse caso, encerramos completamente nossa posição de compra ou realizamos uma realização parcial.
• Fechar Venda – Alerta de Compra: Suponha que estávamos em uma posição de venda no candle anterior. No candle atual, a Média Rápida cruza a Média Mediana de baixo para cima, e o ADX indica uma tendência de compra. Nesse caso, encerramos completamente nossa posição de venda ou realizamos uma realização parcial.

RSI ADX Bollinger Analysis High-level purpose and design philosophy
This indicator — RSI-ADX-Bollinger Analysis — is a compact, educational market-analysis toolkit that blends momentum (RSI), trend strength (ADX), volatility structure (Bollinger Bands) and simple volumetrics to provide traders a snapshot of market condition and trade idea quality. The design philosophy is explicit and layered: use each component to answer a different question about price action (momentum, conviction, volatility, participation), then combine answers to form a more robust, explainable signal. The mashup is intended for analysis and learning, not automatic execution: it surfaces the why behind signals so traders can test, learn and apply rules with risk management.
________________________________________
What each indicator contributes (component-by-component)
RSI (Relative Strength Index) — role and behavior: RSI measures short-term momentum by comparing recent gains to recent losses. A high RSI (near or above the overbought threshold) indicates strong recent buying pressure and potential exhaustion if price is extended. A low RSI (near or below the oversold threshold) indicates strong recent selling pressure and potential exhaustion or a value area for mean-reversion. In this dashboard RSI is used as the primary momentum trigger: it helps identify whether price is locally over-extended on the buy or sell side.
ADX (Average Directional Index) — role and behavior: ADX measures trend strength independently of direction. When ADX rises above a chosen threshold (e.g., 25), it signals that the market is trending with conviction; ADX below the threshold suggests range or weak trend. Because patterns and momentum signals perform differently in trending vs. ranging markets, ADX is used here as a filter: only when ADX indicates sufficient directional strength does the system treat RSI+BB breakouts as meaningful trade candidates.
Bollinger Bands — role and behavior: Bollinger Bands (20-period basis ± N standard deviations) show volatility envelope and relative price position vs. a volatility-adjusted mean. Price outside the upper band suggests pronounced extension relative to recent volatility; price outside the lower band suggests extended weakness. A band expansion (increasing width) signals volatility breakout potential; contraction signals range-bound conditions and potential squeeze. In this dashboard, Bollinger Bands provide the volatility/structural context: RSI extremes plus price beyond the band imply a stronger, volatility-backed move.
Volume split & basic MA trend — role and behavior: Buy-like and sell-like volume (simple heuristic using close>open or closeopen) or sell-like (close1.2 for validation and compare win rate and expectancy.
4. TF alignment: Accept signals only when higher timeframe (e.g., 4h) trend agrees — compare results.
5. Parameter sensitivity: Vary RSI threshold (70/30 vs 80/20), Bollinger stddev (2 vs 2.5), and ADX threshold (25 vs 30) and measure stability of results.
These exercises teach both statistical thinking and the specific failure modes of the mashup.
________________________________________
Limitations, failure modes and caveats (explicit & teachable)
• ADX and Bollinger measures lag during fast-moving news events — signals can be late or wrong during earnings, macro shocks, or illiquid sessions.
• Volume classification by open/close is a heuristic; it does not equal TAPEDATA, footprint or signed volume. Use it as supportive evidence, not definitive proof.
• RSI can remain overbought or oversold for extended stretches in persistent trends — relying solely on RSI extremes without ADX or BB context invites large drawdowns.
• Small-cap or low-liquidity instruments yield noisy band behavior and unreliable volume ratios.
Being explicit about these limitations is a strong point in a TradingView description — it demonstrates transparency and educational intent.
________________________________________
Originality & mashup justification (text you can paste)
This script intentionally combines classical momentum (RSI), volatility envelope (Bollinger Bands) and trend-strength (ADX) because each indicator answers a different and complementary question: RSI answers is price locally extreme?, Bollinger answers is price outside normal volatility?, and ADX answers is the market moving with conviction?. Volume participation then acts as a practical check for real market involvement. This combination is not a simple “indicator mashup”; it is a designed ensemble where each element reduces the others’ failure modes and together produce a teachable, testable signal framework. The script’s purpose is educational and analytical — to show traders how to interpret the interplay of momentum, volatility, and trend strength.
________________________________________
TradingView publication guidance & compliance checklist
To satisfy TradingView rules about mashups and descriptions, include the following items in your script description (without exposing source code):
1. Purpose statement: One or two lines describing the script’s objective (educational multi-indicator market overview and idea filter).
2. Component list: Name the major modules (RSI, Bollinger Bands, ADX, volume heuristic, SMA trend checks, signal tracking) and one-sentence reason for each.
3. How they interact: A succinct non-code explanation: “RSI finds momentum extremes; Bollinger confirms volatility expansion; ADX confirms trend strength; all three must align for a BUY/SELL.”
4. Inputs: List adjustable inputs (RSI length and thresholds, BB length & stddev, ADX threshold & smoothing, volume MA, table position/size).
5. Usage instructions: Short workflow (check TF alignment → confirm participation → define stop & R:R → backtest).
6. Limitations & assumptions: Explicitly state volume is approximated, ADX has lag, and avoid promising guaranteed profits.
7. Non-promotional language: No external contact info, ads, claims of exclusivity or guaranteed outcomes.
8. Trademark clause: If you used trademark symbols, remove or provide registration proof.
9. Risk disclaimer: Add the copy-ready disclaimer below.
This matches TradingView’s request for meaningful descriptions that explain originality and inter-component reasoning.
________________________________________
Copy-ready short publication description (paste into TradingView)
Advanced RSI-ADX-Bollinger Market Overview — educational multi-indicator dashboard. This script combines RSI (momentum extremes), Bollinger Bands (volatility envelope and band expansion), ADX (trend strength), simple SMA trend bias and a basic buy/sell volume heuristic to surface high-quality idea candidates. Signals require alignment of momentum, volatility expansion and rising ADX; volume participation is displayed to support signal confidence. Inputs are configurable (RSI length/levels, BB length/stddev, ADX length/threshold, volume MA, display options). This tool is intended for analysis and learning — not for automated execution. Users should back test and apply robust risk management. Limitations: volume classification here is a heuristic (close>open), ADX and BB measures lag in fast news events, and results vary by instrument liquidity.
________________________________________
Copy-ready risk & misuse disclaimer (paste into description or help file)
This script is provided for educational and analytical purposes only and does not constitute financial or investment advice. It does not guarantee profits. Indicators are heuristics and may give false or late signals; always back test and paper-trade before using real capital. The author is not responsible for trading losses resulting from the use or misuse of this indicator. Use proper position sizing and risk controls.
________________________________________
Risk Disclaimer: This tool is provided for education and analysis only. It is not financial advice and does not guarantee returns. Users assume all risk for trades made based on this script. Back test thoroughly and use proper risk management.

AI Strat ATR Dinamico + ADX + Trend Adaptivo (No Repaint)Below is a fully self-contained, English-language description of every input, function, and logical block inside the “AI Strat ATR Dinamico + ADX + Trend Adaptivo (No Repaint)” indicator. You can copy and paste this into TradingView’s “Description” field when you publish, without exposing any Pine code.
---
## Indicator Name and Purpose
**Name (Short Title):**
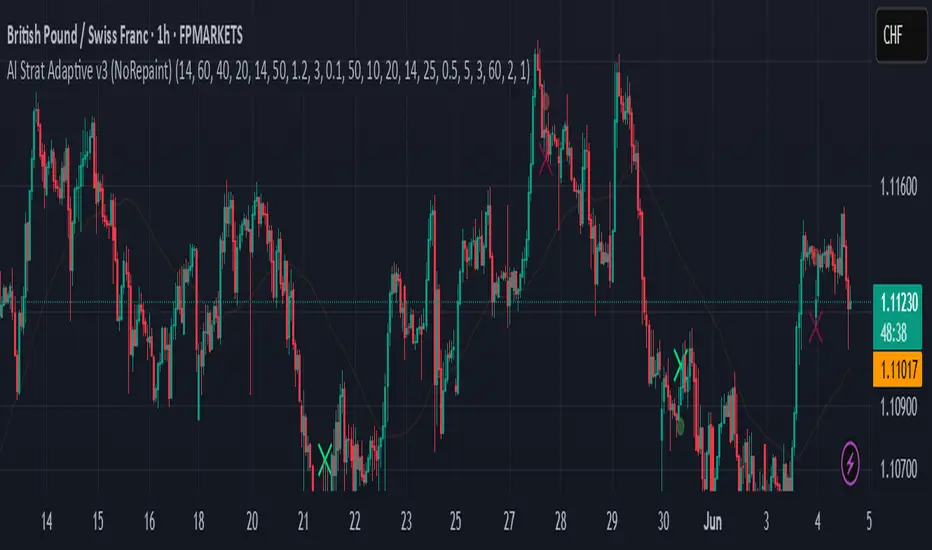
AI Strat Adaptive v3 (NoRepaint)
**Overview:**
This indicator combines multiple technical tools—RSI, EMA, ATR (with a dynamic multiplier), ADX/DI, and an “AI‐style” scoring mechanism—to generate trend-filtered and reversal signals. It also optionally confirms signals on a higher timeframe, dynamically adjusts its sensitivity based on volatility, and plots intrabar stop‐loss (SL) and take‐profit (TP) levels derived from ATR. Special care has been taken to ensure that no signals “repaint” (i.e., once drawn on a closed bar, they never disappear or shift).
---
## 1. Main Inputs
All of the inputs appear in the Settings dialog for the published indicator. Below is a detailed explanation of each input, grouped by logical category.
### A. RSI & EMA Base Parameters
1. **RSI Length (Base)**
* **Input type:** Integer (default 14)
* **Description:** Number of bars used to calculate the Relative Strength Index (RSI). A shorter RSI reacts more quickly to price changes; a longer RSI is smoother.
2. **RSI Overbought Threshold**
* **Input type:** Integer (default 60)
* **Description:** If the RSI value rises above this level, it contributes a “sell” signal component. You can adjust this (e.g., 70) to make your system more conservative.
3. **RSI Oversold Threshold**
* **Input type:** Integer (default 40)
* **Description:** If the RSI falls below this level, it contributes a “buy” signal component. Raising this threshold (e.g., 50) makes the strategy more aggressive in seeking reversals.
4. **EMA Length (Base)**
* **Input type:** Integer (default 20)
* **Description:** Number of bars for the Exponential Moving Average (EMA). A shorter EMA will produce more frequent crossovers, a longer EMA is smoother.
### B. ATR & Volatility Filter Parameters
5. **ATR Length (Base)**
* **Input type:** Integer (default 14)
* **Description:** Number of bars to calculate Average True Range (ATR). The ATR is used both for measuring volatility and for dynamic SL/TP levels.
6. **ATR SMA Length**
* **Input type:** Integer (default 50)
* **Description:** Number of bars to compute a Simple Moving Average of the ATR itself. This gives a baseline of “normal” volatility. If ATR rises significantly above this SMA, the indicator treats the market as “high volatility.”
7. **ATR Multiplier Base**
* **Input type:** Float (default 1.2, step 0.1)
* **Description:** Base multiplier for ATR when filtering for volatility. The actual threshold is computed as `ATR_SMA × (ATR_Multiplier Base) × sqrt(current_ATR / ATR_SMA)`. In other words, the multiplier becomes larger if volatility is rising, and smaller if volatility is falling.
8. **Disable Volatility Filter**
* **Input type:** Boolean (default false)
* **Description:** If enabled (true), the indicator will ignore any volatility‐based filtering, using signals regardless of ATR behavior. If disabled (false), signals only fire when ATR > (ATR\_SMA × dynamic multiplier).
### C. Price-Change & “AI Score” Parameters
9. **Price Change Period (bars)**
* **Input type:** Integer (default 3)
* **Description:** The number of bars back to measure percentage price change. Used to ensure that a “trend” signal is accompanied by a sufficiently positive (for longs) or negative (for shorts) price movement over this many bars.
10. **Base AI Score Threshold**
* **Input type:** Float (default 0.1)
* **Description:** The indicator computes a composite “AI-style” score by combining the RSI signal (overbought/oversold) and an EMA crossover signal. Only if the absolute value of that composite score exceeds this threshold will a trend signal be eligible. Raising it makes signals rarer but (potentially) higher-conviction.
### D. SMA “ICT” Trend Filter Parameters
11. **ICT SMA Long Length (Base)**
* **Input type:** Integer (default 50)
* **Description:** Number of bars for the “long” Simple Moving Average (SMA) used in the internal trend filter. Typically, price must be above this SMA (and ADX must be strong) to confirm an uptrend, or below it (and ADX strong) to confirm a downtrend.
12. **ICT SMA Short1 Length (Base)**
* **Input type:** Integer (default 10)
* **Description:** Secondary “fast” SMA used both for reversal logic (e.g., price crossing above it can count as a bullish reversal) and part of the internal trend confirmation.
13. **ICT SMA Short2 Length (Base)**
* **Input type:** Integer (default 20)
* **Description:** A second “medium” SMA used for reversal triggers (e.g., crossovers or crossunders alongside RSI conditions).
### E. ADX & DI Parameters
14. **Base ADX Length**
* **Input type:** Integer (default 14)
* **Description:** Number of bars for the ADX (Average Directional Index) moving averages, which measure trend strength. The same length is used for +DI and –DI smoothing.
15. **Base ADX Threshold**
* **Input type:** Float (default 25.0, step 0.5)
* **Description:** If ADX > this threshold and +DI > –DI, we consider an uptrend; if ADX > this threshold and –DI > +DI, we consider a downtrend. Raising this value demands stronger trends to qualify.
### F. Sensitivity & Cooldown
16. **Sensitivity (0–1)**
* **Input type:** Float between 0.0 and 1.0 (default 0.5)
* **Description:** A general “mixture” parameter used internally to weight how aggressively the indicator leans into trend versus reversal. In practice, the code uses it to fine-tune exact thresholds for switching between trend and reversal conditions. You can leave it at 0.5 unless you want to bias more heavily toward either regime.
17. **Base Cooldown Bars Between Signals**
* **Input type:** Integer (default 5, min 0)
* **Description:** Once a long or short signal fires, the indicator will wait at least this many bars before allowing a new signal in the same direction. Prevents “signal flipping” on each bar. A higher number forces fewer, more spaced-out entries.
18. **Trend Confirmation Bars**
* **Input type:** Integer (default 3, min 1)
* **Description:** After the directional filters (+DI/–DI cross, price vs. SMA), the indicator still requires that price remains on the same side of the long SMA for at least this many consecutive bars before confirming “trend up” or “trend down.” Larger values smooth out false breakouts but may lag signals.
### G. Higher Timeframe Confirmation
19. **Use Higher Timeframe Confirmation**
* **Input type:** Boolean (default true)
* **Description:** If true, the indicator will request a block of values (SMA, +DI, –DI, ADX) from a higher timeframe (default 60 minutes) and require that the higher timeframe is also in agreement (strong uptrend or strong downtrend) before confirming your current-timeframe trend. This helps filter out lower-timeframe noise.
20. **Higher Timeframe (TF) for Confirmation**
* **Input type:** Timeframe (default “60”)
* **Description:** The chart timeframe (e.g., 5, 15, 60 minutes) whose trend conditions must also be true. It’s sent through a `request.security(..., lookahead=barmerge.lookahead_off)` call so that it never “paints ahead.”
### H. Dynamic TP/SL Parameters
21. **TP as ATR Multiple**
* **Input type:** Float (default 2.0, step 0.1)
* **Description:** When a trade is open, the “take-profit” price is determined by looking at the highest high (for longs) or lowest low (for shorts) observed since entry, and then plotting a cross (“X”) at that level when the trend finally flips. This is purely for display. However, separate from that, this parameter can be adapted if you want a strictly ATR–based TP. In the “Minimal” version, TP is ≈ (highest high) once trend inverts, but you could rewrite it to use `entry_price + ATR×TP_Multiplier`.
22. **SL as ATR Multiple**
* **Input type:** Float (default 1.0, step 0.1)
* **Description:** While in a trade, a trailing SL line is plotted each bar. Its value is always `entry_price ± (ATR × SL_Multiplier)`. When the trend inverts, the SL no longer updates, and you see it on the chart.
### I. Display and Mode Options
23. **Show Debug Lines**
* **Input type:** Boolean (default true)
* **Description:** When enabled, the indicator will plot all intermediate lines—ATR SMA, ATR Threshold, +DI, –DI, ADX (current and HTF), HTF SMA, etc.—so that you can diagnose exactly what’s happening. Turn this off to hide all debug information and only see entry/exit shapes.
24. **Enable Scalping Mode**
* **Input type:** Boolean (default false)
* **Description:** If true, many of the “base” parameters are halved (e.g., RSI length becomes 7 instead of 14, ATR length becomes 7 instead of 14, ADX length becomes 7, etc.), and the ADX threshold is multiplied by 0.8. This makes all oscillators and moving averages more reactive, suited for very short-term (scalping) setups.
---
## 2. Core Calculation Blocks
Below is a high-level description of each logical block (in code order), translated from Pine into conceptual steps.
### A. Adjust Inputs if “Scalping Mode” Is On
If **Scalping Mode** = true, then:
* `RSI_Length` becomes `max(1, round(Base_RSI_Length / 2))`
* `EMA_Length` becomes `max(1, round(Base_EMA_Length / 2))`
* `ATR_Length` becomes `max(1, round(Base_ATR_Length / 2))`
* `Price_Change_Period` becomes `max(1, round(Base_Price_Change_Period / 2))`
* `SMA_Long_Length`, `SMA_Short1_Length`, and `SMA_Short2_Length` are each halved (minimum 1).
* `ADX_Length` = `max(1, round(Base_ADX_Length / 2))`
* `ADX_Threshold` = `Base_ADX_Threshold × 0.8`
* `Cooldown_Bars` = `max(0, round(Base_Cooldown_Bars / 2))`
Otherwise, all adjusted lengths = their base values.
### B. RSI, EMA & “AI Score” on Current Timeframe
1. **Compute RSI:**
* Uses the (possibly adjusted) `RSI_Length`.
* Denote this as `RSI_Value`.
2. **Compute ATR & Its SMA:**
* `ATR_Value` = `ta.atr(ATR_Length)`.
* `ATR_SMA` = `ta.sma(ATR_Value, ATR_SMA_Length)`.
* Then define `Volatility_Increase` = (`ATR_Value > ATR_SMA`).
* If the volatility has increased, the weighting of RSI vs. EMA changes.
3. **Compute Weights:**
* If `Volatility_Increase == true`, then:
* `RSI_Weight = 0.7`
* `EMA_Weight = 0.3`
* Otherwise:
* `RSI_Weight = 0.3`
* `EMA_Weight = 0.7`
4. **RSI Signal Component (`RSI_Sig`):**
* If `RSI_Value > RSI_Overbought`, then `RSI_Sig = –1`.
* Else if `RSI_Value < RSI_Oversold`, then `RSI_Sig = +1`.
* Otherwise, `RSI_Sig = 0`.
5. **EMA Value & Signal Component (`EMA_Sig`):**
* `EMA_Value` = `ta.ema(close, EMA_Length)`.
* `EMA_Sig = +1` if the current close crosses **above** the EMA; `EMA_Sig = –1` if the current close crosses **below** the EMA; else `0`.
6. **Compute Raw “AI Score”:**
$$
Raw\_AI = (RSI\_Sig \times RSI\_Weight)\;+\;(EMA\_Sig \times EMA\_Weight)
$$
Then,
$$
AI\_Score = \frac{Raw\_AI}{(RSI\_Weight + EMA\_Weight)}
$$
(This normalization ensures the score always ranges between –1 and +1 if both weights sum to 1.)
### C. Dynamic ATR Multiplier & Volatility Filter
1. **Volatility Factor:**
$$
Volatility\_Factor = \frac{ATR\_Value}{ATR\_SMA}
$$
2. **Dynamic ATR Multiplier:**
$$
ATR\_Multiplier = ATR\_Multiplier\_Base \times \sqrt{Volatility\_Factor}
$$
3. **High Volatility Condition (`High_Volatility`):**
* If `Disable_Volatility_Filter == true`, then treat `High_Volatility = true` always.
* Else, `High_Volatility = (ATR_Value > ATR_SMA × ATR_Multiplier)`.
### D. Price Change Percentage
* **Compute Price Change:**
$$
Price\_Change = \frac{(Close - Close )}{Close } \times 100
$$
* This is the percent return from `Price_Change_Period` bars ago to now.
* For a valid long‐trend signal, we require `Price_Change > 0`; for a short trend, `Price_Change < 0`.
### E. Local SMAs for Trend/Reversal Filters
* `SMA_Close_Long` = `ta.sma(close, SMA_Long_Length)`.
* `SMA_Close_Short1` = `ta.sma(close, SMA_Short1_Length)`.
* `SMA_Close_Short2` = `ta.sma(close, SMA_Short2_Length)`.
These three SMAs help define the “local trend” and reversal breakout points:
* **Primary Trend Filter:**
* Price must be above `SMA_Close_Long` for an uptrend filter, or below `SMA_Close_Long` for a downtrend filter.
* **Reversal Filter:**
* A bullish reversal is detected if **(RSI < Oversold AND close crosses above EMA)** OR **(RSI < Oversold AND close crosses above SMA\_Close\_Short1)**.
* A bearish reversal is detected if **(RSI > Overbought AND close crosses below EMA)** OR **(RSI > Overbought AND close crosses below SMA\_Close\_Short1)**.
### F. Manual +DI, –DI & ADX on Current Timeframe
Instead of relying on the built-in `ta.adx`, the script calculates DI and ADX manually. This makes it easier to replicate the exact logic on a higher timeframe via `request.security`. The steps are:
1. **Directional Movement (DM) Components:**
* `Up_Move` = `high – high `
* `Down_Move` = `low – low`
* `Plus_DM` = `Up_Move` if (`Up_Move > Down_Move` AND `Up_Move > 0`), else `0`
* `Minus_DM` = `Down_Move` if (`Down_Move > Up_Move` AND `Down_Move > 0`), else `0`
2. **True Range (TR) Components:**
* `TR1` = `high – low`
* `TR2` = `abs(high – close )`
* `TR3` = `abs(low – close )`
* `True_Range` = `max(TR1, TR2, TR3)`
3. **Smoothed Averages (RMA):**
* `Sm_TR` = `ta.rma(True_Range, ADX_Length)`
* `Sm_Plus` = `ta.rma(Plus_DM, ADX_Length)`
* `Sm_Minus`= `ta.rma(Minus_DM, ADX_Length)`
4. **Compute DI%:**
$$
Plus\_DI = \frac{Sm\_Plus}{Sm\_TR} \times 100,\quad
Minus\_DI = \frac{Sm\_Minus}{Sm\_TR} \times 100
$$
5. **DX and ADX:**
$$
DX = \frac{|Plus\_DI - Minus\_DI|}{Plus\_DI + Minus\_DI} \times 100,\quad
ADX = ta.rma(DX, ADX_Length)
$$
These values are referred to as `(plus_di, minus_di, adx_val)` for the current timeframe.
---
## 3. Higher Timeframe (HTF) Confirmation Function
If **Use Higher Timeframe Confirmation** is enabled, the script calls a single helper (Pine) function `f_htf` with two parameters: the ADX length and the SMA length (both taken from the “base” or “scaled” values). Internally, `f_htf` simply reruns the manual DI/ADX logic (same as above) on the higher timeframe’s bar data, and also includes that timeframe’s closing price and its SMA for trend comparison.
* **Request.Security Call:**
```
= request.security(
syminfo.tickerid,
higher_tf,
f_htf(adx_length, sma_long_len),
lookahead=barmerge.lookahead_off
)
```
* `lookahead=barmerge.lookahead_off` ensures that no HTF value “paints” early; you always see only confirmed HTF bars.
* The returned tuple provides:
1. `ht_close` = HTF closing price
2. `ht_sma` = HTF SMA of length `sma_long_len`
3. `ht_pdi` = HTF +DI percentage
4. `ht_mdi` = HTF –DI percentage
5. `ht_adx` = HTF ADX value
---
## 4. Trend & Reversal Filters (Current & HTF)
### A. Current-Timeframe Trend Filter
1. **Uptrend\_Basic (Current TF)**
$$
(plus\_di > minus\_di)\;\land\;(adx\_val > ADX\_Threshold)\;\land\;(close > SMA\_Close\_Long)
$$
2. **Downtrend\_Basic (Current TF)**
$$
(minus\_di > plus\_di)\;\land\;(adx\_val > ADX\_Threshold)\;\land\;(close < SMA\_Close\_Long)
$$
3. **Trend Confirmation by Bars:**
* `Bars_Since_Below` = number of bars since `close <= SMA_Close_Long`.
* `Bars_Since_Above` = number of bars since `close >= SMA_Close_Long`.
* If `Uptrend_Basic == true` AND `Bars_Since_Below ≥ Trend_Confirmation_Bars` → mark `Uptrend_Confirm = true`.
* If `Downtrend_Basic == true` AND `Bars_Since_Above ≥ Trend_Confirmation_Bars` → mark `Downtrend_Confirm = true`.
### B. Reversal Filters (Current TF)
1. **Bullish Reversal (`Rev_Bullish`):**
* If `(RSI < RSI_Oversold AND close crosses above EMA_Value)` OR
`(RSI < RSI_Oversold AND close crosses above SMA_Close_Short1)`
→ then `Rev_Bullish = true`.
2. **Bearish Reversal (`Rev_Bearish`):**
* If `(RSI > RSI_Overbought AND close crosses below EMA_Value)` OR
`(RSI > RSI_Overbought AND close crosses below SMA_Close_Short1)`
→ then `Rev_Bearish = true`.
### C. Higher-Timeframe Trend Filter (HTF)
1. **HTF Uptrend (`HT_Uptrend`):**
$$
(ht\_pdi > ht\_mdi)\;\land\;(ht\_adx > ADX\_Threshold)\;\land\;(ht\_close > ht\_sma)
$$
2. **HTF Downtrend (`HT_Downtrend`):**
$$
(ht\_mdi > ht\_pdi)\;\land\;(ht\_adx > ADX\_Threshold)\;\land\;(ht\_close < ht\_sma)
$$
3. **Combine Current & HTF:**
* If **Use\_HTF\_Confirmation == true**, then:
* `Uptrend_Confirm := Uptrend_Confirm AND HT_Uptrend`
* `Downtrend_Confirm := Downtrend_Confirm AND HT_Downtrend`
* Otherwise, just use the current timeframe’s `Uptrend_Confirm` and `Downtrend_Confirm`.
4. **Define `CurrentTrend` (Integer):**
* `CurrentTrend = +1` if `Uptrend_Confirm == true`.
* `CurrentTrend = –1` if `Downtrend_Confirm == true`.
* Otherwise, `CurrentTrend = 0`.
5. **Reset “One Trade Per Trend”:**
* There is a persistent variable `LastTradeTrend`.
* Every time `CurrentTrend` flips (i.e., `CurrentTrend != CurrentTrend `), the code sets `LastTradeTrend := 0`.
* That allows one new entry once the detected trend has changed.
---
## 5. One‐Time “Cooldown” Logic
* **`LastSignalBar`**
* A persistent integer (initially undefined).
* After each confirmed long or short entry, `LastSignalBar` is set to the bar index where that signal fired.
* **`Bars_Since_Signal`**
* If `LastSignalBar` is undefined, treat as a very large number (so that initial signals are always allowed).
* Otherwise, `Bars_Since_Signal = bar_index – LastSignalBar`.
* **Cooldown Check:**
* A new long (or short) can only be generated if `(Bars_Since_Signal > Signal_Cooldown)`.
* This prevents multiple signals in rapid succession.
---
## 6. Entry Conditions (No Repaint)
All of the conditions below are calculated “intrabar,” but the script only actually registers a **signal** on **bar close** (`barstate.isconfirmed`) so that signals never repaint.
### A. Trend‐Based “Raw” Conditions
1. **Trend\_Long\_Raw:**
$$
(AI\_Score > AI\_Score\_Threshold)\;\land\;Uptrend\_Confirm\;\land\;High\_Volatility\;\land\;(Price\_Change > 0)
$$
2. **Trend\_Short\_Raw:**
$$
(AI\_Score < -AI\_Score\_Threshold)\;\land\;Downtrend\_Confirm\;\land\;High\_Volatility\;\land\;(Price\_Change < 0)
$$
### B. Reversal “Raw” Conditions
1. **Rev\_Long\_Raw:**
$$
Rev\_Bullish\;\land\;(CurrentTrend \neq +1)
$$
2. **Rev\_Short\_Raw:**
$$
Rev\_Bearish\;\land\;(CurrentTrend \neq -1)
$$
### C. Combine Raw Signals
* `Raw_Long = Trend_Long_Raw OR Rev_Long_Raw`.
* `Raw_Short = Trend_Short_Raw OR Rev_Short_Raw`.
### D. Confirmed Long/Short Signal Flags
On each new bar **close** (`barstate.isconfirmed == true`):
* **Long\_Signal\_Confirmed** can fire if:
1. `Raw_Long == true`
2. `LastTradeTrend != +1` (we haven’t already taken a long in this same trend)
3. `Bars_Since_Signal > Signal_Cooldown`
If all three hold, then on this bar close the code sets:
* `Long_Signal = true`
* `LastTradeTrend := +1`
* `LastSignalBar := bar_index`
Otherwise, `Long_Signal := false` on this bar.
* **Short\_Signal\_Confirmed** works the same way but with `Raw_Short`, `LastTradeTrend != -1`, etc.
If triggered, it sets `Short_Signal = true`, `LastTradeTrend := -1`, and `LastSignalBar := bar_index`. Otherwise `Short_Signal := false`.
* **Important:** If the bar is still forming (`else` branch of `barstate.isconfirmed`), then both `Long_Signal` and `Short_Signal` are forced to `false`. This guarantees that no shape or alert appears until the bar actually closes.
---
## 7. Plotting Entry/Exit Shapes
1. **Trend Long Signal (Triangle Up)**
* Condition: `Long_Signal == true` **AND** `Trend_Long_Raw == true`.
* Appearance: A small, semi-transparent lime green triangle drawn **below** the bar.
2. **Trend Short Signal (Triangle Down)**
* Condition: `Short_Signal == true` **AND** `Trend_Short_Raw == true`.
* Appearance: A small, semi-transparent maroon triangle drawn **above** the bar.
3. **Reversal Long Signal (Circle)**
* Condition: `Long_Signal == true` **AND** `Rev_Long_Raw == true`.
* Appearance: A tiny, more transparent green circle drawn **below** the bar.
4. **Reversal Short Signal (Circle)**
* Condition: `Short_Signal == true` **AND** `Rev_Short_Raw == true`.
* Appearance: A tiny, more transparent red circle drawn **above** the bar.
Since `Long_Signal` and `Short_Signal` only ever become true at bar close, these shapes are never repainted or removed once drawn.
---
## 8. Unified Alert Message
* As soon as a new bar closes with either `Long_Signal` or `Short_Signal == true`, an alert message is sent:
* If `Long_Signal`, then `alert_msg = "action=BUY"`.
* If `Short_Signal`, then `alert_msg = "action=SELL"`.
* If neither, `alert_msg = ""` (no alert).
* The code calls `alert(alert_msg, freq=alert.freq_once_per_bar)` only if `barstate.isconfirmed` and `alert_msg` is non‐empty. This ensures exactly one alert per confirmed bar, no intrabar pops.
---
## 9. Dynamic TP/SL Logic (Minimal Implementation)
Once a long or short position is “open,” the script tracks these variables:
1. **Persistent Flags and Prices** (all persist between bars until reset):
* `InLong` (Boolean)
* `InShort` (Boolean)
* `Long_Max` (Float)
* `Short_Min` (Float)
* `Entry_Price` (Float)
2. **On Bar Close:**
* If `Long_Signal == true` →
* Set `InLong := true`,
* `Entry_Price := close` of that bar,
* `Long_Max := high ` (last bar’s high, so that we’re not using “future” data).
* If `Short_Signal == true` →
* Set `InShort := true`,
* `Entry_Price := close`,
* `Short_Min := low `.
3. **While `InLong == true`:**
* Continuously update `Long_Max = max(Long_Max, current high)` on each bar (intrabar, but finalized each close).
* Compute a dynamic SL:
$$
SL_{Long} = Entry\_Price - (ATR \times SL\_ATR\_Multiplier).
$$
* If **current trend** flips to non-uptrend (`CurrentTrend != +1`), mark `ExitLong = true`.
* Then the routine plots `TP_Long = Long_Max` as a cross (“X”) at that level.
* Set `InLong := false` so that no further changes to `Long_Max` or `Entry_Price` happen on future bars.
4. **While `InShort == true`:**
* Continuously update `Short_Min = min(Short_Min, current low)`.
* Compute a dynamic SL:
$$
SL_{Short} = Entry\_Price + (ATR \times SL\_ATR\_Multiplier).
$$
* If trend flips to non-downtrend (`CurrentTrend != –1`), mark `ExitShort = true`.
* Then the routine plots `TP_Short = Short_Min`.
* Set `InShort := false` to freeze those values.
5. **Plotting TP/SL if “Show Debug” is On:**
* **TP Shapes:**
* When `ExitLong == true`, plot a solid lime “X” at `TP_Long` (highest high).
* When `ExitShort == true`, plot a solid maroon “X” at `TP_Short` (lowest low).
* **SL Lines:**
* If still `InLong`, draw a thin red line at `SL_Long` on each bar.
* If still `InShort`, draw a thin green line at `SL_Short`.
Thus, your charts visually show the highest‐high take-profit cross for longs, the lowest-low take-profit cross for shorts, and a continuously updating trailing SL until the trend flips. Because all of this is triggered on confirmed bars, nothing “jumps around” after the fact.
---
## 10. Debug‐Only Plot Lines (When Enabled)
When **Show Debug Lines** = true, the indicator will also plot:
1. **ATR SMA (Orange):**
* The simple moving average of ATR over `ATR_SMA_Length`.
2. **ATR Threshold (Yellow):**
* `ATR_SMA × ATR_Multiplier` (the dynamically scaled threshold).
3. **+DI & –DI (Current TF):**
* +DI plotted as a green line, –DI plotted as a red line (opacity \~70%).
4. **ADX (Current TF, Blue):**
* A blue line for the present timeframe’s ADX.
5. **ADX Threshold (Gray):**
* A horizontal gray line showing `ADX_Threshold`.
6. **+DI & –DI (HTF, Darker Colors):**
* If HTF confirmation is on, “HTF +DI” is a greener but more transparent line; “HTF –DI” is a redder but more transparent line.
7. **ADX (HTF, Blue but Transparent):**
* HTF ADX plotted in blue (high transparency).
8. **HTF SMA (Orange, Transparent):**
* The higher timeframe’s SMA (same length as `SMA_Long_Length`), drawn in fainter orange.
9. **Volatility Zone Fill (Yellow Tinted Area):**
* Fills the area between `ATR_SMA` and `ATR_SMA × ATR_Multiplier`.
* Indicates “normal” versus “high‐volatility” regimes.
These debug lines are purely visual aids. Disable them if you want a cleaner chart.
---
## 11. Putting It All Together — Step-By-Step Flow
1. **Read Inputs** (RSI lengths, EMA length, ATR settings, etc.).
2. **Optionally Halve All Lengths** if “Scalping Mode” is checked.
3. **Calculate Current TF Indicators:**
* RSI, ATR, ATR\_SMA, EMA, price change, various SMAs, DI/ADX.
4. **Compute “AI Score”** (weighted sum of RSI and EMA signals).
5. **Compute Dynamic ATR Multiplier** and decide if “High Volatility” is true.
6. **Compute Raw Trend/Reversal Conditions** on the current timeframe (without triggering yet).
7. **Fetch HTF Values** in one `request.security` call (SMAs, DI/ADX).
8. **Combine Current & HTF Trend Filters** to confirm `Uptrend_Confirm` or `Downtrend_Confirm`.
9. **Check Reversal Conditions** (price crossing EMA or SMA short, in overbought/oversold zones).
10. **Enforce “One Trade Per Trend”** (clear `LastTradeTrend` whenever `CurrentTrend` flips).
11. **Enforce Cooldown** (must wait at least `Signal_Cooldown` bars since the prior signal).
12. **On Bar Close:**
* If `Raw_Long` AND not already in a long trend AND cooldown met, then fire `Long_Signal`.
* Else if `Raw_Short` AND not already in a short trend AND cooldown met, then fire `Short_Signal`.
* Otherwise, no new signal on this bar.
13. **Plot Long/Short Entry Shapes** according to whether it was a Trend signal or a Reversal signal.
14. **Send Alert** (“action=BUY” or “action=SELL”) exactly once per confirmed bar.
15. **If New Long/Short Signal, Set `InLong`/`InShort`, Record Entry Price, Initialize `Long_Max`/`Short_Min`.**
16. **While `InLong` is true:** Update `Long_Max = max(previous Long_Max, current high)`. Compute `SL_Long`. If the current trend flips (no longer uptrend), set `ExitLong = true`, plot a “TP X,” and close the position logic.
17. **While `InShort` is true:** Similarly update `Short_Min`, compute `SL_Short`, and if trend flips, set `ExitShort = true`, plot a “TP X,” and close the position logic.
18. **Optionally Display Debug Lines** (ATR SMA, ATR threshold, DI/ADX, HTF DI/ADX, etc.).
---
## 12. How to Use in TradingView Community
When you publish this indicator to the TradingView community—choosing “Protected” or “Invite-only” visibility—you can paste the above description into the “Description” field. Users will see exactly what each input does, how signals are generated, and what the various plotted lines represent, **without ever seeing the script source**. In this way, the code itself remains hidden but the logic is fully documented.
1. **Go to “Create New Indicator”** on TradingView.
2. **Paste Your Pine Code** (the full indicator script) in the Pine editor and save it.
3. **Set Visibility = Protected** (or Invite-only).
4. **In the “Description” Text Box, paste the entirety of this document** (steps 1–11).
5. **Click “Publish Script.”**
Users who view your indicator will see its name (“AI Strat Adaptive v3 (NoRepaint)”), a list of all inputs (with default values), and the detailed English description above. They can then load it on any chart, adjust inputs, and see the plotted signals, TP/SL lines, and optional debug overlays—without accessing the underlying Pine code.
---
### Summary of Key Points
* **RSI, EMA, ATR, DI/ADX, and “AI Score”** work together to define “trend vs. reversal.”
* **Dynamic volatility filter** uses ATR and ATR\_SMA to adapt the weighting of RSI vs. EMA and decide whether “volatility is high enough” to permit a trend trade.
* **One trade per detected trend** and a **cooldown period** prevent over‐trading.
* **Higher timeframe confirmation** (optional) further filters out noise.
* **No-repaint logic**:
* All signals only appear at bar close (`barstate.isconfirmed`).
* HTF values are fetched with `lookahead=barmerge.lookahead_off`.
* **Entry shapes** (triangles and circles) clearly mark trend vs. reversal entries.
* **Dynamic TP/SL**: highest‐high (or lowest‐low) since entry is used as TP, ATR×multiplier as SL.
* **Debug mode** (optional) shows every intermediate line for full transparency.
Use this description verbatim (or adapt it slightly for your personal style) when publishing. That way, your community sees exactly how each component works—inputs, functions, filters—while the Pine source code remains private.
Directional Movement Index (DMI) + AlertsThis is a Study with associated visual indicators and Bullish/Bearish Alerts for Directional Movement (DMI). It consists of an Average Directional Index (ADX), Plus Directional Indicator (+DI) and Minus Directional Indicator (-DI).
Published by J. Welles Wilder in 1978 for use with currencies and commodities which are typically more volatile than stocks and have stronger trends.
Development Notes
---------------------------
This indicator, and most of the descriptions below, were derived largely from the TradingView reference manual. Feedback and suggestions for improvement are more than welcome, as well are recommended Input settings and best practices for use.
tradingview.com/chart/?solution=43000502250
Strategy Description
---------------------------
ADX defines whether or not there is a trend present; +DI and -DI compliment the ADX by taking direction into account. An ADX above 25 indicates a strong trend, and a Bullish alert is subsequently triggered when +DI is above -DI and a Bearish alert when -DI is above +DI.
Note that the Bullish or Bearish crossover alert will only trigger if ADX is simultaneously above 25 during the crossover event. If ADX later rises to 25 and +DI is still greater than -DI, or -DI greater than +DI, then a delayed alert will not trigger by design.
Basic Use
---------------------------
Acceptable DMI values are up to the trader's interpretation and may change depending on the financial instrument being examined. Recommend not changing any default values without being first familiar with their purpose and impact on the indicator at large.
Confidence in price action and trend is higher when two or more indicators are in agreement -- therefore we recommend not using this indicator by itself to determine entry or exit trade opportunities.
Recommend also choosing 'Once Per Bar Close' when creating alerts.
Inputs
---------------------------
ADX Smoothing - the time period to be used in calculating the ADX which has a smoothing component (14 is the Default).
DI Length - the time period to be used in calculating the DI (14 is the Default).
Key Level - any trade with the ADX above the key level is a strong indicator that it is trending (23 to 25 is the suggested setting).
Sensitivity - an incremental variable to test whether the past n candles are in the same bullish or bearish state before triggering a delayed crossover alert (3 is the Default). Filter out some noise and reduces active alerts.
Show ADX Option - two visual styles are provided for user preference, a visible ADX line or a background overlay (green or red when ADX is above the key level, for bullish or bearish, and gray when below).
Color Candles - an option to transpose the bullish and bearish crossovers to the main candle bars. Can be turned off in the Style Tab by deselecting 'Bar Colors'. Dark blue is bullish, dark purple is bearish, and the black inner color is neutral. Note that the outer red and green border will still be distinguished by whether each individual candle is bearish or bullish during the specified timeframe.
Indicator Visuals
---------------------------
Bullish or Bearish plot based on DMI strategy (ADX and +/-DI values).
Visual cues are intended to improve analysis and decrease interpretation time during trading, as well as to aid in understanding the purpose of this study and how its inclusion can benefit a comprehensive trading strategy.
Trend Strength
---------------------------
To analyze trend strength, the focus should be on the ADX line and not the +DI or -DI lines. An ADX reading above 25 indicates a strong trend, while a reading below 20 indicates a weak or non-existent trend. A reading between those two values would be considered indeterminable. Though what is truly a strong trend or a weak trend depends on the financial instrument being examined; historical analysis can assist in determining appropriate values.
Bullish DI Cross
---------------------------
1. ADX must be over 25 (strong trend) (value is determined by the trader)
2. +DI cross above -DI
3. Set Stop Loss at the current day's low (any +DI cross-backs below -DI should be ignored)
4. Set trailing stop if ADX strengthens (i.e., signal rises)
Bearish DI Cross
---------------------------
1. ADX must be over 25 (strong trend) (value is determined by the trader)
2. -DI cross above +DI
3. Set Stop Loss at the current day's high (any -DI cross-backs below +DI should be ignored)
4. Set trailing stop if ADX strengthens (i.e., signal rises)
Disclaimer
---------------------------
This post and the script are not intended to provide any financial advice. Trade at your own risk.
No known repainting.
Version 1.1
-------------------------
- Added multi-timeframe resolution using PineCoders secure security function to eliminate repainting.
- Cleaned up option for selecting ADX view; and added a colored line as a choice, based on same bullish, bearish, or neutral colors as the background.
- Added exit crossover indicator to aid in an overall strategy development. This ability pairs better with my CHOP Zone Entry Strategy which relies on DMI Exits. Note that exit conditions don't employ the sensitivity variable. Green labels are for Bullish exits and red are for Bearish.
-- Exit condition is triggered if in an active Bullish or Bearish position and ADX drops below 25, Or if either the -DI crosses above +DI (for previously Bullish) or +DI crosses above -DI (for previously Bearish).
- Added reverse position determination. Triggers when a Bullish entry occurs on the same candle as a Bearish exit, or vice versa. Green labels are for Bullish reverses and red are for Bearish.
- Added selectable option to choose visible labels -- Bearish, Bullish, Both, Exits, Reverses, or All.
-- Note that a reverse label will only show if the opposing entry and exit labels are set to show, otherwise the reverse will revert to the appropriate entry or exit on the chart.
- Added alerts to account for new conditions.
-- Note that alerts for crossovers, exits, and reverses will only be triggered if the associated labels are selected to be shown (i.e., what you choose to see on the chart is what you will be alerted to).
Version 1.2
-------------------------
- Changed exit condition to be decided on by whether ADX is below 25 and on a +/-DI crossover. Versus being either or. The previous version had too many false triggers. This variety can now show multiple Bullish or Bearish alerts before an Exit condition too. I'm tempted to simply make this condition based on ADX, and not DI … thoughts? See lines 138 and 139.
- Updated the Background view to have deeper shades of colors dependent upon the ADX trend strength.
- Added an Oscillator view for the ADX and momentum computations to color the histogram by trend. DI lines are hidden.
-- If ADX is Bullish, then the oscillator is colored light green in an uptrend and dark green in a downtrend; if Bearish, then its light red in an uptrend and dark redin a downtrend; if adx is below key level, then it is light gray in a downtrend and dark grey in the uptrend.
- Added option to Hide ADX in case only the Directional lines are desired. This could be useful if you would like to have the ADX oscillator in one panel and +/-DI crossovers in another.
- Added a Columnar view for the ADX. DI lines are hidden. This view is really simple and compact, with the trend strength still easily understood. Colors are the same as for the oscillator -- the deeper the shade of green or red, then the higher the ADX trend strength level.
- Added a Trend Strength label.
ADX Trend Strength Trade (Y/N) Setup Types
0 to 10 = Barely Breathing N N/A
10 to 20 = Weak Trend Y Range/Pre-Breakout
20 to 30 = Potentially Starting to Trend Y Early Stage Trend
30 to 50 = Strong Trend Y Ride the Wave
50 to 75 = Very Strong Trend N Exhaustion
75 to 100 = Extremely Strong Trend N N/A
Version 1.3
-------------------------
Updated to Pine Script v5 to resolve errors from the deprecated v4 version.
This is a reissue of a previously published script that was hidden due to a v4 compatibility issue.
'https://www.tradingview.com/script/9OoEHrv5-Directional-Movement-Index-DMI-Alerts/'

Didi's Needles setup screener Didi's Needles setup screener
I basically used the screener created by QuantNomad , made some modifications and used the indicators from the setup
Indicators used:
Didi Index, ADX, Bollinger Bands, Trix and Stochastic.
Signals from each column:
Column 'Symbol'
Blue Symbol: When the Didi, ADX and BB are with buy signals
Yellow Symbol: When Didi, ADX and BB are with sell signals
Red Symbol: When ADX, BB, Trix and Stoch are with signals to close the trade
ADX' Column
ADX Kick: When the ADX has given a Kick (Top or Bottom). ADX was rising and starts to fall
Uptrend: When the ADX is up and below the Level and the DI+ is above the DI-
Uptrend Strong: When the ADX is up and above the Level and the DI+ is above the DI-
Uptrend Falling: When the ADX is below and above the Level and the DI+ is above the DI-
Downtrend: When the ADX is below the level and the DI- is above the DI+
Downtrend Strong: When the ADX is above the level and the DI- is above the DI+
Downtrend Falling: When the ADX is below the level and the DI- is above the DI+
Didi' Column
Buy Alert: When the Fast Average crosses the Median to the upside (as long as it is not a False Point) = Needle Alert
Sell Alert: When Fast Average Crosses Median Down (as long as it is not a False Point) = Needle Alert
Needle Buy: When slow average crosses the median down = Needle confirmation
Needle Sell: When slow moving average crosses the median to high = Needle confirmation
Fake Buy: When the fast moving average crosses the median and the slow moving average is above the median and rising = False Point (Sell signal or if you are positioned on the buy side, hold the buy or raise the hand)
Fake Sell: When the fast moving average crosses the median and the slow moving average is below the median and falling = False Point (Buy signal or if you are positioned on the sell side, hold the sell or raise your hand)
BB' Column
Open Rising: When the Bollinger Bands are open and the Base Mean (BB) is rising
Open Falling: When the Bollinger Bands are open and the Base Mean (BB) is falling
Parallel Rising: When the Bollinger Bands are parallel and rising
Parallel Falling: When the Bollinger Bands are Parallel and falling
Close: When the Bollinger Bands are closed
Trix Column
Bought: When the Trix is above the MA (trix)
Sold: When the Trix is below the MA (trix)
Stoch Column
Bought: When %K is above %D
Sold: When %K is below %D
--------------------------
Rastreador para o setup de Agulhadas do Didi
Eu basicamente usei o screener criado por QuantNomad , fiz algumas modificações e usei os indicadores do setup
Indicadores usado:
Didi Index, ADX, Bandas de Bollinger, Trix e Estocástico.
Sinais de cada coluna:
Coluna 'Symbol'
Symbol Azul: Quando o Didi, ADX e BB estão com sinais de compra
Symbol Amarelo: Quando o Didi, ADX e BB estão com sinais de venda
Symbol Vermelho: Quando o ADX, BB, Trix e Stoch estão com sinais para fechar a operação
Coluna 'ADX'
Kick ADX: Quando o ADX deu um Kick (Topo ou Fundo). ADX vinha subinte e começa cair
Uptrend: Quando o ADX está subinte e abaixo do Nivel e o DI+ está acima do DI-
Uptrend Strong: Quando o ADX está subinte e acima do Nivel e o DI+ está acima do DI-
Uptrend Falling: Quando o ADX está cainte e acima do Nivel e o DI+ está acima do DI-
Downtrend: Quando o ADX está subinte e abaixo do Nivel e o DI- está acima do DI+
Downtrend Strong: Quando o ADX está subinte e acima do Nivel e o DI- está acima do DI+
Downtrend Falling: Quando o ADX está cainte e acima do Nivel e o DI- está acima do DI+
Coluna 'Didi'
Buy Alert: Quando a média rapida cruza a mediana para cima (contanto que não seja um Ponto Falso) = Alerta da Agulhada
Sell Alert: Quando a média rapida cruza a mediana para baixo (contanto que náo seja um Ponto Falso) = Alerta da Agulhada
Needle Buy: Quando a média lenta cruza a mediana para baixo = Confirmação da Agulhada
Needle Sell: Quando a média lenta cruza a mediana para cima = Confirmação da Agulhada
Fake Buy: Quando a média rapida cruza a mediana paa cima e a média lenta está acima da mediana e subindo = Ponto Falso (Sinal de venda ou caso esteja posicionado na compra, segurar a compra ou aumentar a mão)
Fake Sell: Quando a média rapida cruza a mediana para baixo e a média lenta está abaixo da mediana e caindo = Ponto Falso (Sinal de compra ou caso esteja posicionado na venda, segurar a venda ou aumentar a mão)
Coluna 'BB'
Open Rising: Quando as Bandas de Bollingers estão abertas e a média base (BB) está subindo
Open Falling: Quando as Bandas de Bollingers estão abertas e a média base (BB) está caindo
Parallel Rising: Quando as Bandas de Bollingers estão Paralelas e subindo
Parallel Falling: Quando as Bandas de Bollingers estão Paralelas e caindo
Close: Quando as Bandas de Bollingers estão fechadas
Coluna 'Trix'
Bought: Quando o Trix está acima da MA (trix)
Sold: Quando o Trix está abaixo da MA (trix)
Coluna 'Stoch'
Bought: Quando %K está acima do %D
Sold: Quando o %K está abaixo do %D

DMI PRO [JoseMetal]============
ENGLISH
============
- Description:
This study is a combination of all DMI components (DI+, DI- and ADX) into a simple line.
Other aspects of the indicator such as ADX levels are well known: 0-25 for weak or no trend, 25-50 for strong trend, 50-75 for very strong trend and 75-100 for extremely strong trend.
- Visual:
The ADX line takes a color depending on the trend, GREEN (BULLISH) for DI+ > DI- or RED for DI- > DI+ (BEARISH).
A signal line has been added to generate crossovers (which are marked with an arrow).
An increasing (getting stronger) ADX color is lighter when a decreasing (weaker) ADX is darker.
Also, green/red dots are shown in the top of the indicator when the ADX turns from decreasing ADX to increasing ADX, color depends on the trend (again, GREEN for BULLISH and RED for BEARISH).
- Usage:
There are some different ways to use this indicator which are similar to the DMI itself, you can just take crossovers to enter LONG or SHORT depending on the COLOR of the ADX (which shows the trend). You can enter/exit trades directly with this method when the crossover/cross under occurs respectively.
Other way (more risky) is to use the dots which may be trend continuation signals, so you can increase your position or enter a trade if you spot a nice trend (ADX higher than the minimum level).
You can also use this indicator as a trend filter for your strategy.
- Customization:
ADX levels, DMI and ADX periods, smoothing, colors... almost everything is configurable, i'll add even more if requested.
- Recommendations:
Any recommendation applied to the DMI is valid here like only entering trades if ADX is higher than 25 to ensure that you're in a trend and not in a range, 15-20 is more risky, but you can get more profits if you enter bottom/tops obviously.
============
ESPAÑOL
============
- Descripción:
Éste estudio es una combinación de todos los componentes del DMI (DI+, DI- y ADX) en una simple línea.
Otros aspectos del indicador como los niveles ADX son bien conocidos: 0-25 para tendencia débil o nula, 25-50 para tendencia fuerte, 50-75 para tendencia muy fuerte y 75-100 para tendencia extremadamente fuerte.
- Visual:
La línea ADX toma un color dependiendo de la tendencia, VERDE (ALCISTA) para DI+ > DI- o ROJO para DI- > DI+ (BAJISTA).
Se ha añadido una línea de señal para generar cruces (que se marcan con una flecha).
El color de un ADX creciente (cada vez más fuerte) es más claro cuando un ADX decreciente (más débil) es más oscuro.
Además, se muestran puntos verdes/rojos en la parte superior del indicador cuando el ADX pasa de ser decreciente a ser creciente, el color depende de la tendencia (de nuevo, VERDE para ALCISTA y ROJO para BAJISTA).
- Uso:
Hay varias formas de usar éste indicador que son similares al DMI mismo, puedes simplemente usar los cruces para entrar LONG o SHORT dependiendo del COLOR del ADX (que muestra la tendencia). Puedes entrar/salir de las operaciones directamente con este método cuando se produce el cruce al alza/cruce a la baja respectivamente.
Otra forma (más arriesgada) es utilizar los puntos que pueden ser señales de continuación de la tendencia, por lo que puede aumentar su posición o entrar en una operación si detecta una buena tendencia (ADX más alto que el nivel mínimo).
También puedes utilizar este indicador como un filtro de tendencia para tu estrategia.
- Personalización:
Niveles de ADX, períodos de DMI y ADX, suavizado, colores... casi todo es configurable, añadiré aún más personalización si lo pedís.
- Recomendaciones:
Cualquier recomendación aplicada al DMI es válida para éste indicador, como por ejemplo, sólo entrar en operaciones si el ADX es superior a 25 para asegurarte de que estás en una tendencia y no en un rango, 15-20 es más arriesgado pero puedes obtener más beneficios ya que podrías estar entrando en dips / tops.

SQZMOM + ADX
ENGLISH:
SQUEEZE MOMENTUM INDICATOR
The Squeeze Momentum Indicator is a momentum oscillator that indicates the explosiveness with which the price is going to move. Its first known version was called "TTM Squeeze" by John Carter explained in his book "Mastering the Trade" (chapter 11). and popularized on TradingView by a developer named LazyBear.
The black crosses in the middle line show that the market has just entered a consolidation. This means low volatility, the market is preparing for an explosive move (up or down). The gray crosses signify the "Squeeze". Carter suggests waiting until the first gray after a black cross and taking a position in the direction of the oscillator. For its part, LazyBear recommends using an additional indicator such as ADX to enhance the effectiveness of the points of entry and closing of positions.
IMPROVEMENTS IN UNDERSTANDING THE OSCILLATOR:
During the indicator creation process we were able to understand the oscillator logic in greater depth, and based on this knowledge we implemented improvements.
IMPROVEMENTS IN THE DEVELOPMENT OF THE OSCILLATOR:
SIDE PANEL:
• The ADX algorithm was incorporated, which is displayed numerically in the right panel of the indicator, it shows the value of the ADX and its directionality.
• An arrow type pointer was added to indicate the Directionality of the Oscillator.
• Two Exponential Moving Averages of 11 and 55 periods were added to the right panel, this will mark if the trend is bullish or bearish depending on the crossing of the EMAs.
• An indicator of the Squeeze of the indicator was also included, which marks the periods of consolidation of the price (OFF) and the periods where the price should react explosively.
• Added a function that allows the automatic color change of the panels based on the color of the oscillator and the ADX.
o ADX: Dark Green (Bullish Force).
o ADX: Light Green (Loss of bullish strength).
o ADX: Dark Red (Bearish Force).
o ADX: Light Red (Loss of bearish strength).
o ADX: Orange (Lost strength, Disinterest and low volume).
SIGNALS:
A very famous strategy that we have learned is that of the trading expert Jaime Merino, who by combining the Squeeze Momentum Indicator and a common ADX, managed to efficiently link the weakness of the ADX with the beginning of a bullish or bearish momentum. The parameterization of its strategy was signaled in buy and sell alerts, which are represented as follows:
B (Buy): It is activated when a bearish movement marked by the ADX (Negative Slope) ends and the oscillator takes bullish directionality (Bullish impulse).
S (Sell): It is activated when an upward movement marked by the ADX (Negative Slope) ends and the oscillator takes bearish directionality. (Bearish momentum).
FILTER:
In order to prevent any trader from trading against the trend, a filter was added that limits the alerts for bearish entries when the trend is up and vice versa, that is, when the EMA 10 is above the EMA55, it is understood that the trend is bullish in that time frame, therefore the bearish entry alerts will not be activated. It will be the decision of each trader whether to activate or deactivate this function.
ALERTS:
This is undoubtedly the most anticipated function by all Latin American traders, (Just kidding), but being aware, I am very proud of the implementation of alerts for each improvement made to this indicator, if you decide to use the Squeeze Momentum Indicator you can automate alerts for the following actions:
• Buy and Sell alerts.
• Alerts for activating the Squeeze to (ON).
• Oscillator quadrant change alerts
o Bullish momentum.
o Bearish momentum.
o Bullish force.
o Bearish force.
RECOMMENDATIONS:
One of the things that became clearer to us in the development of this indicator is the coloring of the quadrants, which is why we recommend the use of four colors, one for each oscillator grid.
ESPAÑOL:
El Squeeze Momentum Indicator es oscilador de momentum que nos indica la explosividad con que el precio se va a mover. Su primera versión conocida se llamo “TTM Squeeze” de John Carter explica en su libro "Mastering the Trade" (capítulo 11). y popularizada en TradingView por un desarrollador llamado LazyBear.
Las cruces negras en la línea media muestran que el mercado acaba de entrar en una consolidación. Esto significa baja volatilidad, el mercado se prepara para un movimiento explosivo (hacia arriba o hacia abajo). Las cruces grises significan el "Squeeze“. Carter sugiere esperar hasta el primer gris después de una cruz negra y tomar una posición en la dirección del oscilador. Por su parte LazyBear recomienda usar un indicador adicional como ADX para potenciar la efectividad de los puntos de entrada y cierre de las posiciones.
CUADRANTE DE IMPULSO: Los cuadrantes de impulso poseen el doble de potencia de los cuadrantes de fuerza, esto se debe a que su misión es cambiar la dirección del oscilador para generar las Ondas.
CUADRANTE DE FUERZA:
Los cuadrantes de fuerza poseen el menos de potencia que los cuadrantes de impulso, podríamos decir que este cuadrante representa la perdida en la fuerza del movimiento.
LOS COLORES:
Particularmente recomiendo usar la configuracion de colores que se presentan en la imagen anterior, ya que brinda mas coherencia en la realizacion del movimiento alcista y bajista.
IMPULSO ALCISTA: El oscilador se tiene pendiente POSITIVA y se encuentra por debajo del punto 0.
FUERZA ALCISTA: El oscilador se tiene pendiente POSITIVA y se encuentra por encima del punto 0.
IMPULSO BAJISTA: El oscilador se tiene pendiente NEGATIVA y se encuentra por encima del punto 0.
FUERZA BAJISTA: El oscilador se tiene pendiente NEGATIVA y se encuentra por debajo del punto 0.
MEJORAS EN LA COMPRENSIÓN DEL OSCILADOR:
Durante el proceso de creación del indicador pudimos comprender la logica del oscilador con mayor profundidad, y con base en este conocimiento implementamos mejoras
MEJORAS EN EL DESARROLLO DEL OSCILADOR:
PANEL LATERAL:
• Se incorporó el algoritmo del ADX el cual se visualiza en forma numérica en el panel derecho del indicador, el mismo muestra el valor del ADX y la direccionalidad de este.
• Se incorporó un señalador de tipo flecha que indica la Direccionalidad del Oscilador.
• Se añadió dos Medias móviles Exponenciales de 11 y 55 periodos al panel derecho, éste marcará si la tendencia es alcista o bajista en función a al cruce de las EMAs.
• También se incluyó un señalador del Squeeze del indicador, el cual marca los periodos de consolidación del precio (OFF) y los periodos donde el precio debería reaccionar de forma explosiva.
• Se añadió una función que permite el cambio de color automático de los paneles en función al color del oscilador y el ADX.
o ADX: Verde Oscuro (Fuerza alcista).
o ADX: Verde Claro (Perdida de fuerza alcista).
o ADX: Rojo Oscuro (Fuerza bajista).
o ADX: Rojo Claro (Perdida fuerza bajista).
o ADX: Naranja (Perdida fuerza, Desinterés y bajo volumen).
SEÑALES:
Una estrategia muy famosa que hemos aprendido es la del experto en trading Jaime Merino, quien combinando el Squeeze Momentum Indicator y un ADX comùn, logró relacionar de forma eficiente la debilidad del ADX con el comienzo de un impulso ALCISTA o BAJISTA. La parametrización de su estrategia fue señalizada en alertas de compra y venta, las cuales se representan de la siguiente manera:
B (Buy): Se activa cuando termina un movimiento bajista marcado por el ADX (Pendiente Negativa) y el oscilador toma Direccionalidad alcista (Impulso alcista).
S (Sell): Se activa cuando termina un movimiento alcista marcado por el ADX (Pendiente Negativa) y el oscilador toma Direccionalidad bajista. (Impulso bajista).
FILTRO:
Con la intención de evitar que ningún trader opere en contra de la tendencia, se añadió un filtro que limita las alertas entradas bajistas cuando la tendencia es alcista y viceversa, es decir, cuando la EMA 10 está por encima de la EMA55, se entiende que la tendencia es alcista en esa temporalidad, por lo cual las alertas de entradas bajistas no se activaran. Será decisión de cada trader si activa o desactiva esta función.
ALERTAS:
Esta sin duda es la función más esperada por todos los traders de Latinoamérica, (Es broma), pero siendo consientes, me siento muy orgulloso de la implementación de alertas para cada mejora realizada a este indicador, si decide usar el Squeeze Momentum Indicator podrá automatizar las alertas para las siguientes acciones:
• Alertas de Buy y Sell.
• Alertas para la activación del Squeeze a (ON).
• Alertas de cambios de cuadrantes del oscilador
o Impulso alcista.
o Impulso bajista.
o Fuerza alcista.
o Fuerza bajista.
RECOMENDACIONES:
Una de las cosas que nos quedó más claras en el desarrollo de este indicador, es la coloración de los cuadrantes, es por ellos que recomendamos el empleo de cuatro colores, uno para cada cuadricula del oscilador.

AlphaADX Trend Meter - Enhanced ADX VisualizationTechnical Overview
This indicator enhances the traditional Average Directional Index (ADX) with advanced visualization techniques and adaptive threshold management. It demonstrates several Pine Script programming concepts including dynamic color gradients, conditional plotting, and real-time information display systems.
Mathematical Methodology
Core ADX Calculation
Uses standard DMI (Directional Movement Index) calculation: ta.dmi(diLength, adxSmoothing)
Applies configurable smoothing to reduce noise while preserving trend signals
Maintains mathematical integrity of Welles Wilder's original ADX formula
Dynamic Color System
Gradient Implementation:
pinecolor.from_gradient(adxValue, minThreshold, maxThreshold, startColor, endColor)
Color Logic:
Strong trends (ADX > 25): Bright colors (green for bullish, red for bearish)
Weak trends (15 < ADX ≤ 25): Muted colors with transparency
Choppy markets (ADX ≤ 15): Gray coloring to indicate low directional movement
Gradient mode creates smooth color transitions based on ADX intensity
Adaptive Threshold Framework
While maintaining standard ADX interpretation levels, the indicator allows customization of:
Strong trend threshold (default: 25)
Weak trend threshold (default: 20)
Chop zone threshold (default: 15)
This flexibility accommodates different market conditions and trading styles.
Technical Features
1. Multi-Layer Visualization
Primary ADX Line: Color-coded based on strength and direction
Histogram Display: Shows ADX momentum with transparency effects
Trend Meter Bar: Simplified visual reference at bottom of chart
Background Zones: Subtle shading for strong trends and chop zones
2. Signal Generation
Automatic Detection:
Strong trend emergence (ADX crosses above strong threshold)
Chop zone entry warnings (ADX falls below chop threshold)
Trend direction changes in strong trending markets
Visual Markers:
Triangle arrows for strong trend signals
Cross markers for chop zone warnings
Color-coded based on bullish/bearish bias
3. Information Dashboard
Real-time table displaying:
Current ADX value with dynamic background coloring
Trend status classification (Strong/Weak/Neutral/Choppy)
Directional bias (Bullish ↑/Bearish ↓)
DI+ and DI- values for detailed analysis
4. Alert System
Programmatic alerts for:
Strong trend emergence
Entry into consolidation zones
Trend reversals during strong directional moves
Breakouts from choppy conditions
Programming Techniques Demonstrated
Advanced Pine Script Concepts:
Dynamic Color Functions: Custom color selection based on multiple conditions
Conditional Plotting: Different visual elements based on user preferences
Table Implementation: Real-time information display with formatting
Alert Integration: Multiple condition monitoring system
Input Validation: Parameter bounds and logical constraints
Visual Enhancement Methods:
Gradient color transitions for smooth visual feedback
Transparency effects to reduce visual clutter
Multi-component display system for comprehensive analysis
Customizable visual elements for user preference accommodation
Educational Value
This indicator serves as a learning tool for:
Enhanced ADX Implementation: Shows how to extend built-in indicators with additional functionality
Visual Design Principles: Demonstrates effective use of colors, transparency, and layout
User Interface Development: Table creation and information display techniques
Alert System Design: Comprehensive condition monitoring and notification
Configuration Options
ADX Parameters:
ADX Length: Period for directional movement calculation
DI Length: Directional indicator smoothing period
ADX Smoothing: Additional smoothing for noise reduction
Threshold Levels:
Strong Trend Level: Threshold for identifying strong directional movement
Weak Trend Level: Moderate trend identification threshold
Chop Zone Level: Low directional movement threshold
Visual Controls:
Trend Meter: Toggle bottom reference bar
Histogram: Show/hide ADX momentum bars
Signal Arrows: Enable/disable trend change markers
Info Table: Display/hide real-time information panel
Gradient Mode: Switch between smooth gradients and solid colors
Use Cases and Applications
Market Analysis:
Trend Identification: Determine current market directional strength
Regime Classification: Distinguish between trending and ranging markets
Timing Analysis: Identify optimal periods for trend-following strategies
Risk Management:
Environment Assessment: Avoid trading during low-ADX choppy periods
Position Sizing: Adjust trade size based on trend strength
Strategy Selection: Choose appropriate techniques based on market regime
Educational Purposes:
ADX Understanding: Visual representation of directional movement concepts
Pine Script Learning: Example of advanced indicator development techniques
Market Behavior: Observation of trend strength patterns across different timeframes
Limitations and Considerations
Technical Limitations:
ADX is a lagging indicator that confirms existing trends rather than predicting them
Requires sufficient price movement data for meaningful calculations
May generate false signals in very low volatility environments
Threshold levels may need adjustment for different asset classes
Usage Guidelines:
Most effective when combined with other forms of technical analysis
Consider market context and fundamental factors
Use appropriate timeframes for intended trading approach
Regular parameter review for optimal performance
Performance Notes:
Calculations optimized for real-time analysis
Visual elements designed to minimize chart clutter
Alert system prevents excessive notifications through condition filtering
Disclaimer
This indicator is designed for educational and analytical purposes. It demonstrates enhanced visualization of the ADX indicator and various Pine Script programming techniques. Users should understand that past performance does not guarantee future results and should always employ proper risk management practices. The indicator should be used as part of a comprehensive trading approach rather than as a standalone decision-making tool.
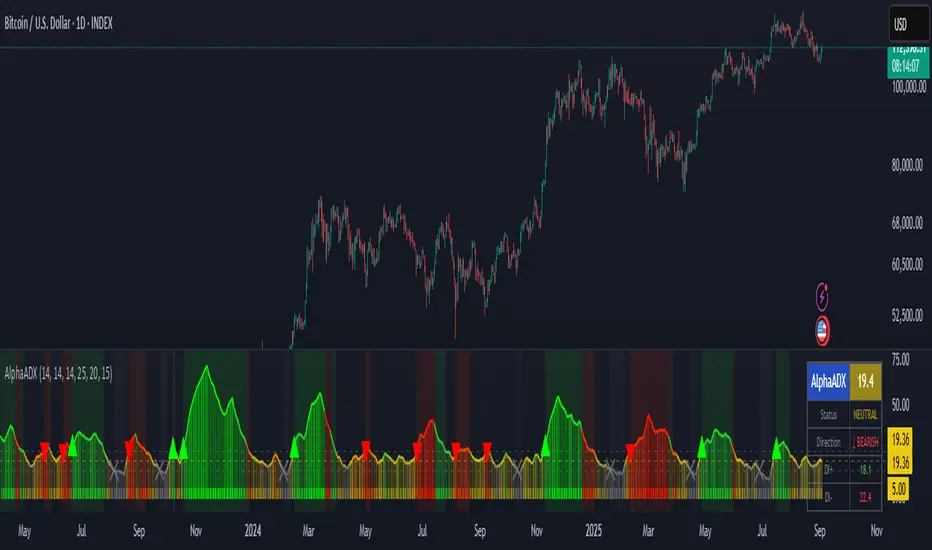
Kalman Trend Sniper# KALMAN TREND SNIPER
## ORIGINALITY STATEMENT
The Kalman Trend Sniper combines adaptive trend detection with precision entry validation to identify high-probability trading opportunities. Unlike static moving averages that use fixed parameters, this indicator adapts to changing market volatility through ATR-based gain adjustment and distinguishes trending from ranging markets using ADX regime detection.
The indicator's unique contribution is its three-phase entry validation system: signals must hold for three bars, undergo a pullback test to the signal level, and receive confirmation through price action before generating an entry. This structured approach helps traders enter established trends at favorable retracement levels rather than chasing momentum.
---
## TECHNICAL METHODOLOGY
### Kalman Filter Implementation
This indicator implements an Alpha-Beta variant of the Kalman filter, a recursive algorithm that estimates trend from noisy price data:
1. Prediction: kf = kf + velocity
2. Error calculation: error = price - kf
3. Correction: kf = kf + gain * error
4. Velocity update: velocity = velocity + (gain * error) / 2
The gain parameter determines filter responsiveness. Higher gain values track price more closely but increase noise sensitivity, while lower values provide smoother output but lag price changes.
### Adaptive Gain Mechanism
The indicator adjusts gain dynamically based on volatility:
Volatility Factor = Current ATR / Long-term ATR
Adaptive Gain = Base Gain * (0.7 + 0.6 * Volatility Factor)
This ATR ratio increases responsiveness during high-volatility periods and reduces sensitivity during consolidations, addressing the fixed-parameter limitation of traditional moving averages. The volatility factor is bounded between configurable minimum and maximum values to prevent extreme adjustments.
### Regime Detection
The indicator uses the Average Directional Index (ADX) to distinguish market conditions:
- Trending markets (ADX above threshold): Full gain applied, signals generated
- Ranging markets (ADX below threshold): Gain reduced 25%, fewer signals
This regime awareness helps reduce whipsaw signals during sideways consolidation periods.
### Signal Line Validation System
When the Kalman line changes direction in trending conditions, the indicator draws a horizontal signal line at the low (for long signals) or high (for short signals) of the signal candle. This line represents a potential support or resistance level.
The validation system then monitors three phases:
Phase 1 - Hold Period: Price must remain above (long) or below (short) the signal line for three consecutive bars. This requirement filters weak signals where price immediately violates the signal level.
Phase 2 - Test: After the hold period, the system waits for price to pull back and touch the signal line, with configurable tolerance for volatile instruments.
Phase 3 - Confirmation: Within eight bars of the test, a confirmation candle must close above (long) or below (short) the test candle's body, demonstrating renewed momentum. If confirmation does not occur within eight bars, the validation attempt expires.
Successful validation generates an R label at the entry point. This three-phase structure helps identify entries where trend direction and support/resistance validation align.
---
## USAGE INSTRUCTIONS
### Signal Interpretation
Triangle Signals:
- Upward triangle (teal): Kalman line turns bullish in trending market (ADX above threshold)
- Downward triangle (red): Kalman line turns bearish in trending market
Signal Lines (horizontal):
- Teal line: Potential long support level at signal candle low
- Red line: Potential short resistance level at signal candle high
- Gray line: First opposite-color candle after signal (initial reversal pressure)
R Labels (optional, disabled by default):
- Green R below price: Validation complete for long entry
- Red R above price: Validation complete for short entry
Stop Levels:
- Red dots: Long stop level (Kalman line minus ATR multiplier)
- Teal dots: Short stop level (Kalman line plus ATR multiplier)
### Dashboard Information
The dashboard displays real-time indicator state:
- Trend: Current Kalman direction (BULL/BEAR)
- Regime: Market classification (Trending when ADX exceeds threshold, Ranging otherwise)
- Gain: Current adaptive gain value
- Vol Factor: Volatility ratio (current ATR / long-term ATR)
- ADX: Trend strength (higher values indicate stronger trends)
- Z-Score: Standard deviation distance from Kalman line (when enabled)
- Stop Dist: Current ATR-based stop distance
- Lines: Number of active signal lines displayed
- R-Status: Validation system state (Idle / Waiting / Testing)
### Trading Applications
Trend Following Approach:
1. Wait for triangle signal in trending market (ADX above threshold)
2. Enter immediately at signal candle close or wait for pullback
3. Place stop at displayed stop level
4. Trail stop using Kalman line as dynamic support/resistance
Validation Entry Approach (conservative):
1. After triangle signal, observe three-bar hold period
2. Wait for pullback to signal line (test phase)
3. Enter on R label confirmation
4. Place stop below/above signal line
5. Provides higher probability entries but reduces trade frequency
Z-Score Mean Reversion (when enabled):
1. Watch for Z-Score exceeding entry threshold (default +/-2.0)
2. Consider counter-trend entries when price touches Kalman line
3. Target return to Kalman line (Z-Score near zero)
4. Use Z-Score threshold as stop level for extreme continuation
### Optimal Conditions
The indicator performs optimally in clearly trending markets where ADX consistently exceeds the threshold. Performance degrades in sideways, choppy conditions.
Recommended timeframes:
- 1-5 minute charts: Use Crypto_1M preset (faster adaptation)
- 15-60 minute charts: Use Crypto_15M preset (balanced)
- Hourly charts: Use Forex preset (smoother)
- Daily charts: Use Stocks_Daily preset (long-term trends)
Market conditions:
- High volatility (Vol Factor above 1.5): Expect faster adaptation, wider stops needed
- Normal volatility (Vol Factor 0.7-1.5): Standard behavior
- Low volatility (Vol Factor below 0.7): Expect slower adaptation, tighter stops possible
---
## PARAMETER DOCUMENTATION
### Kalman Filter Settings
Preset Mode: Select optimized configuration for specific markets
- Custom: Manual parameter control
- Crypto_1M: Base Gain 0.05, ATR 7 (fast response for 1-5 minute crypto charts)
- Crypto_15M: Base Gain 0.03, ATR 14 (balanced for 15-60 minute crypto charts)
- Forex: Base Gain 0.02, ATR 14 (standard for forex pairs)
- Stocks_Daily: Base Gain 0.01, ATR 20 (smooth for daily stock charts)
Base Gain (0.001-0.2): Core Kalman filter responsiveness parameter. Higher values increase sensitivity to price changes. Low values (0.01-0.02) provide smooth output with fewer whipsaws but slower trend changes. High values (0.06-0.08) offer fast response with more signals but increased whipsaw risk.
Adaptive (checkbox): When enabled, automatically adjusts gain based on ATR ratio. Recommended to keep enabled for dynamic volatility adaptation.
ATR (5-50): Short-term Average True Range period for current volatility measurement. Default 14 is industry standard. Lower values respond faster to volatility changes.
Long ATR (20-200): Long-term ATR period for baseline volatility comparison. Default 50 provides stable reference. The ratio between ATR and Long ATR determines adaptive adjustment magnitude.
Regime Filter (checkbox): Enables ADX-based trending/ranging detection. When enabled, reduces gain by 25 percent during ranging markets to minimize false signals.
ADX Period (7-30): Period for ADX calculation. Default 14 is standard. Lower values respond faster to trend strength changes.
Threshold (15-40): ADX level distinguishing trending from ranging markets. Default 25. Above threshold: trending (generate signals normally). Below threshold: ranging (reduce sensitivity).
Min Vol / Max Vol (0.3-3.0): Bounds for volatility factor adjustment. Prevents extreme gain changes during unusual volatility spikes or quiet periods. Default minimum 0.5, maximum 2.0.
Stop ATR x (1.0-3.0): Multiplier for ATR-based stop loss distance. Default 2.0 places stops two ATRs from Kalman line. Use 1.5 for tight stops (intraday), 2.5-3.0 for wide stops (swing trading).
Show Signals (checkbox): Displays triangle signals when Kalman changes direction in trending markets. Disable to use indicator purely as dynamic support/resistance without signals.
Z-Score (checkbox): Enables mean-reversion signal generation based on statistical deviation from Kalman line.
Period (10-100): Lookback period for Z-Score standard deviation calculation. Default 20 bars. Longer periods produce smoother, less sensitive readings.
Entry (1.5-3.5): Standard deviation threshold for Z-Score signals. Default 2.0 generates signals at plus/minus two standard deviations (approximately 95th percentile moves).
Bull / Bear Colors: Customize Kalman line colors for uptrend (default teal) and downtrend (default red).
Fill (checkbox): Shows semi-transparent fill between price and Kalman line for visual trend emphasis.
### Signal Line System Settings
Signal Lines (checkbox): Displays horizontal signal lines at low (long) or high (short) of signal candles. These function as dynamic support/resistance levels.
Reverse Lines (checkbox): Shows gray horizontal lines at first opposite-colored candle after signal. Helps identify initial resistance points in new trends.
Max Lines (0-20): Maximum number of signal lines to display simultaneously. Older lines are removed as new signals appear. Use 1-2 for clean charts, 3-5 for recent support/resistance history.
Style (Solid/Dotted/Dashed): Visual style for signal and reverse lines. Dotted provides subtle appearance, solid is most prominent.
Line % / Label % (0-100): Transparency percentage for lines and labels. Zero is fully opaque, 100 is invisible.
R Labels (checkbox): Shows R labels when validation confirmation occurs. Default disabled. Enable if you want visual confirmation of successful pullback entries.
Tolerance % (0-1.0): Price deviation tolerance for test candle detection. Zero requires exact touch. 0.5 allows 0.5 percent deviation for volatile instruments.
### Dashboard Settings
Show Dashboard (checkbox): Toggles visibility of information panel. Disable for clean chart presentation.
Position: Choose dashboard location from nine positions (Top/Middle/Bottom combined with Left/Center/Right).
---
## LIMITATIONS AND WARNINGS
This indicator is a technical analysis tool that processes historical price data. It does not predict future price movements.
Inherent limitations:
1. Lagging nature: Like all trend indicators, the Kalman filter lags price. Signals occur after trend changes begin, not before.
2. Ranging markets: Generates fewer signals and reduced performance when ADX falls below threshold. Not optimized for sideways consolidation.
3. Whipsaw risk: In choppy, indecisive markets near ADX threshold, signals may reverse quickly despite regime filtering.
4. Parameter sensitivity: Inappropriate Base Gain settings can cause over-trading (too high) or missed trends (too low).
5. Validation requirement: The three-phase confirmation system provides higher accuracy but significantly reduces trade frequency. Not all trends produce valid pullback entries.
Not suitable for:
- Scalping strategies requiring instant signals (Kalman filter has intentional smoothing)
- Ultra-high frequency trading (indicator updates once per bar close)
- Markets with extreme overnight gaps (stops may be exceeded)
- Strategies requiring signals on Heikin Ashi, Renko, Kagi, Point and Figure, or Range charts
Risk management requirements:
This indicator provides trend direction and signal levels but does not incorporate position sizing, risk management, or account balance considerations. Users must implement appropriate position sizing, maximum daily loss limits, and portfolio diversification. Past performance does not indicate future results.
Optimal usage:
- Works optimally in clearly trending markets where ADX consistently exceeds threshold
- Performance degrades in sideways, choppy conditions
- Designed for swing trading and position trading timeframes (15-minute and above)
- Requires confirmation from price action or additional technical analysis
---
## NO REPAINT GUARANTEE
This indicator operates on bar close confirmation only. All signals, signal lines, and validation labels appear exclusively when candles close. Historical signals remain exactly where they appeared. This makes the indicator suitable for automated trading and reliable backtesting. What you see in historical data matches what appeared in real-time.
---
## ALERTS
The indicator provides eight alert conditions:
1. Kalman Buy Signal: Fires when upward triangle appears (bullish trend change in trending market)
2. Kalman Sell Signal: Fires when downward triangle appears (bearish trend change in trending market)
3. Trend Change to Bullish: Fires whenever Kalman line changes to bullish (regardless of ADX)
4. Trend Change to Bearish: Fires whenever Kalman line changes to bearish (regardless of ADX)
5. SCT-R Long Retest Confirmed: Fires when green R label appears for long validation
6. SCT-R Short Retest Confirmed: Fires when red R label appears for short validation
7. SCT Test Long Detected: Fires when test candle appears for long signal (before confirmation)
8. SCT Test Short Detected: Fires when test candle appears for short signal (before confirmation)
Alert messages include context about bar close confirmation and current price levels.
---
## CALCULATION TRANSPARENCY
While complete proprietary optimization methodology is not disclosed, the core technical approach is fully explained: Alpha-Beta Kalman filter with ATR-based adaptive gain adjustment and ADX regime detection. The signal line validation system uses a three-phase structure (hold, test, confirmation) with configurable parameters. Users can understand indicator functionality and make informed decisions about application.
---
## DISCLAIMER
This indicator is provided as a technical analysis tool. It does not constitute financial advice, trading recommendations, or performance guarantees. All trading decisions carry risk. Users are responsible for their own trading decisions and risk management. Past results do not indicate future performance.
