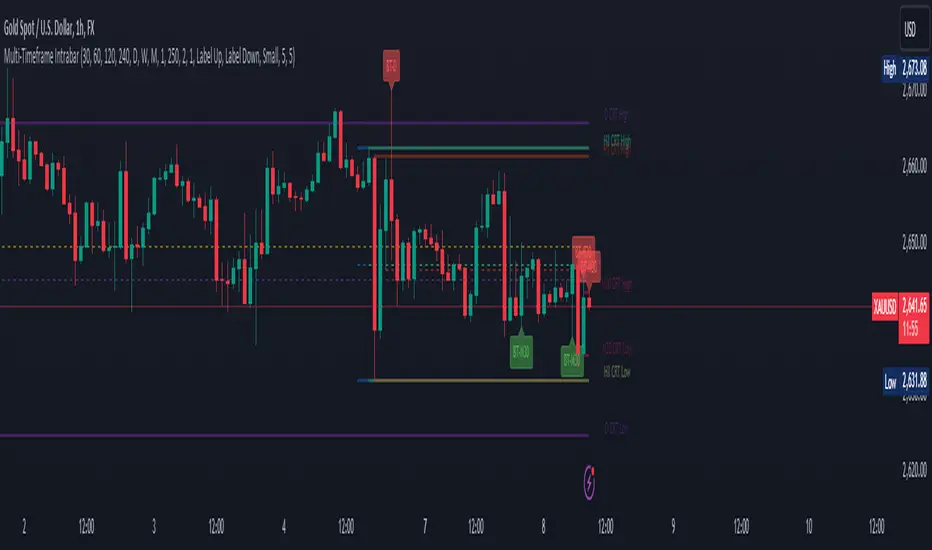
CRT candles Multi-Timeframe Intrabar(open Source ) # CRT candles Multi-Timeframe Intrabar Indicator( open source )
This advanced indicator visualizes Candle Range Theory (CRT) across multiple timeframes, providing traders with a comprehensive view of market structure and potential high-probability setups.
## Key Features:
- Supports 7 timeframes: 30 minutes, 1 hour, 2 hours, 4 hours, daily, weekly, and monthly
- Customizable color schemes for each timeframe
- Options to display mid-level (50%) lines for each range
- Bullish and bearish touch detection with customizable label display
- End-of-line labels for easy identification of CRT levels
- Flexible alert system for touch detections on each timeframe
- Adjustable minimum and maximum bar count for range validity
- Options for wick touch and body touch detection
## How It Works:
The indicator plots CRT ranges for each selected timeframe, identifying potential accumulation, manipulation, and distribution phases. It detects when price touches these levels, providing visual cues and optional alerts for potential trade setups.
snapshot
## Customization:
Users can fine-tune the indicator's appearance and functionality through various input options, including:
- Toggling timeframes on/off
snapshot
- Adjusting colors for range lines and mid-levels
- Controlling label display and count
- Setting alert preferences
- Adjusting line widths and label offsets
## Usage:
This indicator is designed for traders familiar with Candle Range Theory and multi-timeframe analysis. It can be used to identify potential entry and exit points, confirm trends, and spot potential reversals across different timeframes.
## Note:
This indicator is for educational and informational purposes only. Always combine with other forms of analysis and proper risk management when making trading decisions.
## Credits:
Inspired by Romeo's Candle Range Theory and developed to provide a comprehensive multi-timeframe analysis tool.
스크립트에서 "accumulation"에 대해 찾기
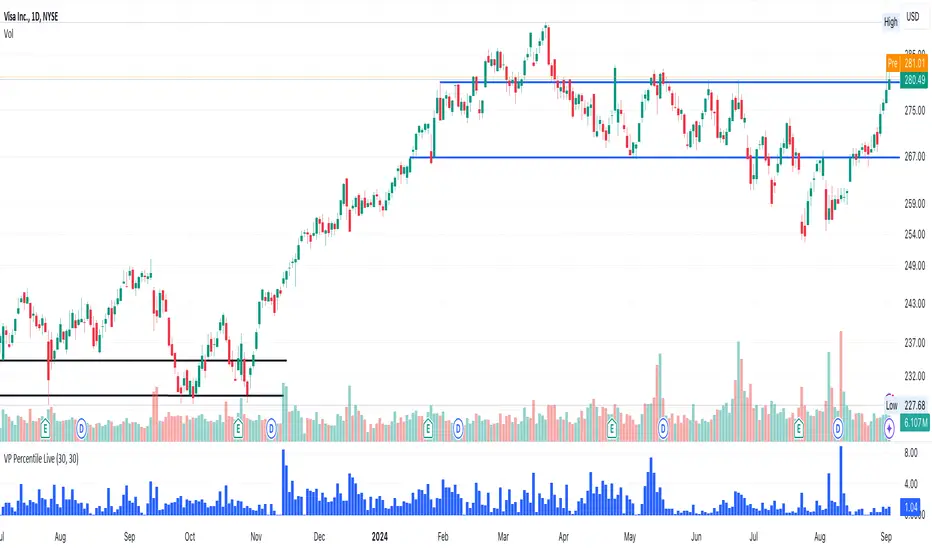
Support, Resistance & Liquidity Pool ZonesSupport, Resistance & Liquidity Pool Zones
This indicator automatically detects and plots support and resistance levels based on pivot points and highlights liquidity pool zones, areas where the trading volume exceeds the average over a set number of bars. It is designed to help traders identify key price levels and liquidity traps that can trigger significant market reactions.
Key Features:
Support & Resistance Levels:
The indicator identifies pivot highs and pivot lows as potential resistance and support levels, respectively.
You can customize the number of levels shown on the chart, making it easier to focus on the most recent and relevant price levels.
Liquidity Pool Zones:
The script detects liquidity pool zones, which are areas with above-average trading volume. These zones often act as regions of interest where price accumulation or distribution occurs, potentially leading to significant price moves.
Liquidity zones are shaded to help traders visually identify areas of high interest in the market.
Customizable Settings:
You can adjust the pivot period to fine-tune how the indicator calculates support and resistance.
Control the number of support/resistance levels displayed on the chart and the period used to detect liquidity pools.
Customize the colors for support, resistance, and liquidity zones to match your charting preferences.
Alerts:
The script includes built-in alerts for when the price breaks above resistance or falls below support, helping traders catch key breakout opportunities.
How It Works:
The script calculates support and resistance levels using pivot highs and lows based on the user-defined pivot period.
It monitors liquidity pool zones by comparing the current trading volume with the average volume over a customizable period. When the volume exceeds the set threshold, a liquidity pool zone is highlighted, providing insight into where the market may accumulate or distribute.
Alerts are triggered when the price breaks above the first resistance level or falls below the first support level, giving traders immediate notification of key market events.
How to Use:
Tune the Pivot Period: Adjust the pivot period to your preferred time horizon (default: 10 bars).
Set Liquidity Pool Parameters: Customize the number of bars considered for liquidity pool detection and the volume multiplier to detect high-volume zones.
Monitor Breakouts: Use the built-in alerts to catch potential breakout or breakdown opportunities near support and resistance levels.
This script is ideal for traders looking for an easy-to-use tool to visualize support and resistance levels and liquidity pools, aiding in decision-making and trade management.

Bitcoin Cycle Master [InvestorUnknown]The "Bitcoin Cycle Master" indicator is designed for in-depth, long-term analysis of Bitcoin's price cycles, using several key metrics to track market behavior and forecast potential price tops and bottoms. The indicator integrates multiple moving averages and on-chain metrics, offering a comprehensive view of Bitcoin’s historical and projected performance. Each of its components plays a crucial role in identifying critical cycle points:
Top Cap: This is a multiple of the Average Cap, which is calculated as the cumulative sum of Bitcoin’s price (price has a longer history than Market Cap) divided by its age in days. Top Cap serves as an upper boundary for speculative price peaks, multiplied by a factor of 35.
Time_dif() =>
date = ta.valuewhen(bar_index == 0, time, 0)
sec_r = math.floor(date / 1000)
min_r = math.floor(sec_r / 60)
h_r = math.floor(min_r / 60)
d_r = math.floor(h_r / 24)
// Launch of BTC
start = timestamp(2009, 1, 3, 00, 00)
sec_rb = math.floor(start / 1000)
min_rb = math.floor(sec_rb / 60)
h_rb = math.floor(min_rb / 60)
d_rb = math.floor(h_rb / 24)
difference = d_r - d_rb
AverageCap() =>
ta.cum(btc_price) / (Time_dif() + btc_age)
TopCap() =>
// To calculate Top Cap, it is first necessary to calculate Average Cap, which is the cumulative sum of Market Cap divided by the age of the market in days.
// This creates a constant time-based moving average of market cap.
// Once Average cap is calculated, those values are multiplied by 35. The result is Top Cap.
// For AverageCap the BTC price was used instead of the MC because it has more history
// (the result should have minimal if any deviation since MC would have to be divided by Supply)
AverageCap() * 35
Delta Top: Defined as the difference between the Realized Cap and the Average Cap, this metric is further multiplied by a factor of 7. Delta Top provides a historically reliable signal for Bitcoin market cycle tops.
DeltaTop() =>
// Delta Cap = Realized Cap - Average Cap
// Average Cap is explained in the Top Cap section above.
// Once Delta Cap is calculated, its values over time are then multiplied by 7. The result is Delta Top.
(RealizedPrice() - AverageCap()) * 7
Terminal Price: Derived from Coin Days Destroyed, Terminal Price normalizes Bitcoin’s historical price behavior by its finite supply (21 million bitcoins), offering an adjusted price forecast as all bitcoins approach being mined. The original formula for Terminal Price didn’t produce expected results, hence the calculation was adjusted slightly.
CVDD() =>
// CVDD stands for Cumulative Value Coin Days Destroyed.
// Coin Days Destroyed is a term used for bitcoin to identify a value of sorts to UTXO’s (unspent transaction outputs). They can be thought of as coins moving between wallets.
(MCR - TV) / 21000000
TerminalPrice() =>
// Theory:
// Before Terminal price is calculated, it is first necessary to calculate Transferred Price.
// Transferred price takes the sum of > Coin Days Destroyed and divides it by the existing supply of bitcoin and the time it has been in circulation.
// The value of Transferred Price is then multiplied by 21. Remember that there can only ever be 21 million bitcoin mined.
// This creates a 'terminal' value as the supply is all mined, a kind of reverse supply adjustment.
// Instead of heavily weighting later behavior, it normalizes historical behavior to today. By normalizing by 21, a terminal value is created
// Unfortunately the theoretical calculation didn't produce results it should, in pinescript.
// Therefore the calculation was slightly adjusted/improvised
TransferredPrice = CVDD() / (Supply * math.log(btc_age))
tp = TransferredPrice * 210000000 * 3
Realized Price: Calculated as the Market Cap Realized divided by the current supply of Bitcoin, this metric shows the average value of Bitcoin based on the price at which coins last moved, giving a market consensus price for long-term holders.
CVDD (Cumulative Value Coin Days Destroyed): This on-chain metric analyzes Bitcoin’s UTXOs (unspent transaction outputs) and the velocity of coins moving between wallets. It highlights key market dynamics during prolonged accumulation or distribution phases.
Balanced Price: The Balanced Price is the difference between the Realized Price and the Terminal Price, adjusted by Bitcoin's supply constraints. This metric provides a useful signal for identifying oversold market conditions during bear markets.
BalancedPrice() =>
// It is calculated by subtracting Transferred Price from Realized Price
RealizedPrice() - (TerminalPrice() / (21 * 3))
Each component can be toggled individually, allowing users to focus on specific aspects of Bitcoin’s price cycle and derive meaningful insights from its long-term behavior. The combination of these models provides a well-rounded view of both speculative peaks and long-term value trends.
Important consideration:
Top Cap did historically provide reliable signals for cycle peaks, however it may not be a relevant indication of peaks in the future.

Swiss Knife [MERT]Introduction
The Swiss Knife indicator is a comprehensive trading tool designed to provide a multi-dimensional analysis of the market. By integrating a wide array of technical indicators across multiple timeframes, it offers traders a holistic view of market sentiment, momentum, and potential reversal points. This indicator is particularly useful for traders looking to combine trend analysis, momentum indicators, volume data, and price action into a single, easy-to-read format.
---
Key Features
Multi-Timeframe Analysis : Evaluates indicators on Daily , 4-Hour , 1-Hour , and 15-Minute timeframes.
Comprehensive Indicator Suite : Incorporates MACD , Awesome Oscillator (AO) , Parabolic SAR , SuperTrend , DPO , RSI , Stochastic Oscillator , Bollinger Bands , Ichimoku Cloud , Chande Momentum Oscillator (CMO) , Donchian Channels , ADX , volume-based momentum indicators, Fractals , and divergence detection.
Market Sentiment Scoring : Aggregates signals from multiple indicators to provide an overall sentiment score.
Visual Aids : Displays EMA lines, trendlines, divergence signals, and a sentiment table directly on the chart.
Super Trend Reversal Signals : Identifies potential market reversal points by assessing the momentum of automated trading bots.
---
Explanation of Each Indicator
Moving Average Convergence Divergence (MACD)
- Purpose : Measures the relationship between two moving averages of price.
- Interpretation : A positive histogram suggests bullish momentum; a negative histogram indicates bearish momentum.
Awesome Oscillator (AO)
- Purpose : Gauges market momentum by comparing recent market movements to historic ones.
- Interpretation : Above zero indicates bullish momentum; below zero indicates bearish momentum.
Parabolic SAR (SAR)
- Purpose : Identifies potential reversal points in price direction.
- Interpretation : Dots below price suggest an uptrend; dots above price suggest a downtrend.
SuperTrend
- Purpose : Determines the prevailing market trend.
- Interpretation : Provides buy or sell signals based on price movements relative to the SuperTrend line.
Detrended Price Oscillator (DPO)
- Purpose : Removes trend from price to identify cycles.
- Interpretation : Values above zero suggest price is above the moving average; values below zero indicate it is below.
Relative Strength Index (RSI)
- Purpose : Measures the speed and change of price movements.
- Interpretation : Values above 50 indicate bullish momentum; values below 50 indicate bearish momentum.
Stochastic Oscillator
- Purpose : Compares a particular closing price to a range of its prices over a certain period.
- Interpretation : Values above 50 indicate bullish conditions; values below 50 indicate bearish conditions.
Bollinger Bands (BB)
- Purpose : Measures market volatility and provides relative price levels.
- Interpretation : Price above the middle band suggests bullishness; below the middle band suggests bearishness.
Ichimoku Cloud
- Purpose : Provides support and resistance levels, trend direction, and momentum.
- Interpretation : Bullish signals when price is above the cloud; bearish signals when price is below the cloud.
Chande Momentum Oscillator (CMO)
- Purpose : Measures momentum on both up and down days.
- Interpretation : Values above 50 indicate strong upward momentum; values below -50 indicate strong downward momentum.
Donchian Channels
- Purpose : Identifies volatility and potential breakouts.
- Interpretation : Price above the upper band suggests bullish breakout; below the lower band suggests bearish breakout.
Average Directional Index (ADX)
- Purpose : Measures the strength of a trend.
- Interpretation : DI+ above DI- indicates bullish trend; DI- above DI+ indicates bearish trend.
Volume Momentum Indicators (VolMom, CumVolMom, POCMom)
- Purpose : Analyze volume to assess buying and selling pressure.
- Interpretation : Positive values suggest bullish volume momentum; negative values indicate bearish volume momentum.
Fractals
- Purpose : Identify potential reversal points in the market.
- Interpretation : Up fractals may indicate a future downtrend; down fractals may indicate a future uptrend.
Divergence Detection
- Purpose : Identifies divergences between price and various indicators (RSI, MACD, Stochastic, OBV, MFI, A/D Line).
- Interpretation : Bullish divergences suggest potential upward reversal; bearish divergences suggest potential downward reversal.
- Note : This functionality utilizes the library from Divergence Indicator .
---
Coloring Scheme
Background Color
- Purpose : Reflects the overall market sentiment by combining sentiment scores from all indicators across different timeframes.
- Interpretation :
- Green Shades : Indicate bullish market sentiment.
- Red Shades : Indicate bearish market sentiment.
- Intensity : The strength of the color corresponds to the strength of the sentiment score.
Sentiment Table
- Purpose : Displays the status of each indicator across different timeframes.
- Interpretation :
- Green Cell : The indicator suggests a bullish signal.
- Red Cell : The indicator suggests a bearish signal.
- Percentage Score : Indicates the overall bullish or bearish sentiment on that timeframe.
Exponential Moving Averages (EMAs)
- Purpose : Provide dynamic support and resistance levels.
- Colors :
- EMA 10 : Lime
- EMA 20 : Yellow
- EMA 50 : Orange
- EMA 100 : Red
- EMA 200 : Purple
Trendlines
- Purpose : Visual representation of support and resistance levels based on pivot points.
- Interpretation :
- Upward Trendlines : Colored green , indicating support levels.
- Downward Trendlines : Colored red , indicating resistance levels.
- Note : Trendlines are drawn using the library from Simple Trendlines .
---
Utility of Market Sentiment
The indicator aggregates signals from multiple technical indicators across various timeframes to compute an overall market sentiment score . This comprehensive approach helps traders understand the prevailing market conditions by:
Confirming Trends : Multiple indicators pointing in the same direction can confirm the strength of a trend.
Identifying Reversals : Divergences and fractals can signal potential turning points.
Timeframe Alignment : Aligning signals across different timeframes can enhance the probability of successful trades.
---
Divergences
Divergence occurs when the price of an asset moves in the opposite direction of a technical indicator, suggesting a potential reversal.
- Bullish Divergence : Price makes a lower low, but the indicator makes a higher low.
- Bearish Divergence : Price makes a higher high, but the indicator makes a lower high.
The indicator detects divergences for:
RSI
MACD
Stochastic Oscillator
On-Balance Volume (OBV)
Money Flow Index (MFI)
Accumulation/Distribution Line (A/D Line)
By identifying these divergences, traders can spot early signs of trend reversals and adjust their strategies accordingly.
---
Trendlines
Trendlines are essential tools for identifying support and resistance levels. The indicator automatically draws trendlines based on pivot points:
- Upward Trendlines (Support) : Connect higher lows, indicating an uptrend.
- Downward Trendlines (Resistance) : Connect lower highs, indicating a downtrend.
These trendlines help traders visualize the trend direction and potential breakout or reversal points.
---
Super Trend Reversals (ST Reversal)
The core idea behind the Super Trend Reversals indicator is to assess the momentum of automated trading bots (often referred to as 'Supertrend bots') that enter the market during critical turning points. Specifically, the indicator is tuned to identify when the market is nearing bottoms or peaks, just before it shifts direction based on the triggered Supertrend signals. This approach helps traders:
Engage Early : Enter the market as reversal momentum builds up.
Optimize Entries and Exits : Enter under favorable conditions and exit before momentum wanes.
By capturing these reversal points, traders can enhance their trading performance.
---
Conclusion
The Swiss Knife indicator serves as a versatile tool that combines multiple technical analysis methods into a single, comprehensive indicator. By assessing various aspects of the market—including trend direction, momentum, volume, and price action—it provides traders with valuable insights to make informed trading decisions.
---
Citations
- Divergence Detection Library : Divergence Indicator by DevLucem
- Trendline Drawing Library : Simple Trendlines by HoanGhetti
---
Note : This indicator is intended for informational purposes and should be used in conjunction with other analysis techniques. Always perform due diligence before making trading decisions.
---

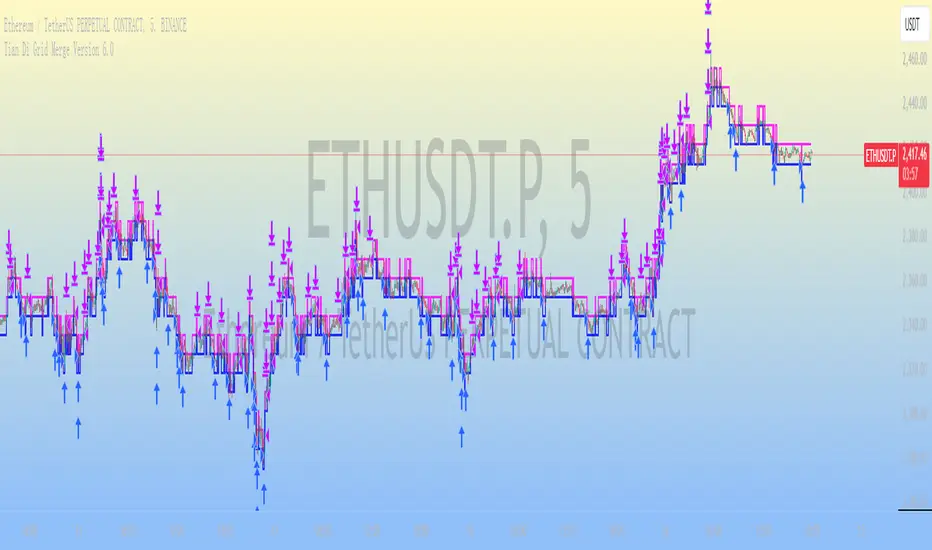
Tian Di Grid Merge Version 6.0
Strategy Introduction:
1. We know that the exchange can only set a maximum of 100 grids. However, our grid strategy can set a maximum of 350 grids.
2. We have added the modes of proportional and differential warehousing.
3. It should be noted that we have not set any filtering conditions, which means that when the price falls below the grid, we will execute a buy action at the closing price, and when the price falls above the grid, we will execute a sell action;
4. We suggest limiting the trading time cycle to 5 meters, as sometimes errors may appear on TV due to the dense grid or the inability to draw so many grids;
5. Please ensure that the minimum spacing between each grid is not less than 0.1%, as this is extremely difficult to profit from, and on the other hand, it may not function due to excessively dense spacing;
6. The maximum number of grids is 350, and the minimum number is currently 3;
matters needing attention:
Don't choose to go long or short together, and don't choose to go even short or short;
Closing position setting: It is recommended to select it to avoid order accumulation;
Unable to trade: If unable to trade normally, switch to a 1m cycle;
Number of cells: Calculate it yourself, 350 is just the maximum number of cells that can be adjusted;
Grid spacing: minimum 0.1%, below which no profit can be made;
Position value: default is 100u, which is the amount already leveraged;
Multiple investment: The order amount for each order is the same, and there is no need for multiple investment;
Open both long and short positions: You can open multiple positions for one account and open one position for one account. Do not open both long and short positions for the same target at the same time
VWAP PressureKey Features and Utility:
Intrabar Focus: Unlike standard VWAP, which provides a cumulative average throughout the day, the Intrabar VWAP focuses on volume-weighted price calculations within shorter time frames. This allows traders to see how price and volume interact moment-to-moment, offering a granular view of market sentiment.
Market Pressure Analysis: The indicator examines the difference between a smoothed weighted average price of the close and intrabar price movements. This analysis helps in identifying the market pressure at high volume areas. When the market exhibits high volume at low prices within a bar, it suggests accumulation, whereas high volume at high prices indicates distribution.
Momentum and Pressure Shift Signals: By applying a modified MACD calculation to the smoothed difference, the indicator provides signals on shifts in market pressure. Positive values indicate upward price momentum (buying pressure), while negative values suggest downward momentum (selling pressure).

Uptrick: Momentum-Volatility Composite Signal### Title: Uptrick: Momentum-Volatility Composite Signal
### Overview
The "Uptrick: Momentum-Volatility Composite Signal" is an innovative trading tool designed to offer traders a sophisticated synthesis of momentum, volatility, volume flow, and trend detection into a single comprehensive indicator. This tool stands out by providing an integrated view of market dynamics, which is critical for identifying potential trading opportunities with greater precision and confidence. Its unique approach differentiates it from traditional indicators available on the TradingView platform, making it a valuable asset for traders aiming to enhance their market analysis.
### Unique Features
This indicator integrates multiple crucial elements of market behavior:
- Momentum Analysis : Utilizes Rate of Change (ROC) metrics to assess the speed and strength of market movements.
- Volatility Tracking : Incorporates Average True Range (ATR) metrics to measure market volatility, aiding in risk assessment.
- Volume Flow Analysis : Analyzes shifts in volume to detect buying or selling pressure, adding depth to market understanding.
- Trend Detection : Uses the difference between short-term and long-term Exponential Moving Averages (EMA) to detect market trends, providing insights into potential reversals or confirmations.
Customization and Inputs
The Uptrick indicator offers a variety of user-defined settings tailored to fit different trading styles and strategies, enhancing its adaptability across various market conditions:
Rate of Change Length (rocLength) : This setting defines the period over which momentum is calculated. Shorter periods may be preferred by day traders who need to respond quickly to market changes, while longer periods could be better suited for position traders looking at more extended trends.
ATR Length (atrLength) : Adjusts the timeframe for assessing volatility. A shorter ATR length can help day traders manage the quick shifts in market volatility, whereas longer lengths might be more applicable for swing or position traders who deal with longer-term market movements.
Volume Flow Length (volumeFlowLength): Determines the analysis period for volume flow to identify buying or selling pressure. Day traders might opt for shorter periods to catch rapid volume changes, while longer periods could serve swing traders to understand the accumulation or distribution phases better.
Short EMA Length (shortEmaLength): Specifies the period for the short-term EMA, crucial for trend detection. Shorter lengths can aid day traders in spotting immediate trend shifts, whereas longer lengths might help swing traders in identifying more sustainable trend changes.
Long EMA Length (longEmaLength): Sets the period for the long-term EMA, which is useful for observing longer-term market trends. This setting is particularly valuable for position traders who need to align with the broader market direction.
Composite Signal Moving Average Length (maLength): This parameter sets the smoothing period for the composite signal's moving average, helping to reduce noise in the signal output. A shorter moving average length can be beneficial for day traders reacting to market conditions swiftly, while a longer length might help swing and position traders in smoothing out less significant fluctuations to focus on significant trends.
These customization options ensure that traders can fine-tune the Uptrick indicator to their specific trading needs, whether they are scanning for quick opportunities or analyzing more prolonged market trends.
### Functionality Details
The indicator operates through a sophisticated algorithm that integrates multiple market dimensions:
1. Momentum and Volatility Calculation : Combines ROC and ATR to gauge the market’s momentum and stability.
2. Volume and Trend Analysis : Integrates volume data with EMAs to provide a comprehensive view of current market trends and potential shifts.
3. Signal Composite : Each component is normalized and combined into a composite signal, offering traders a nuanced perspective on when to enter or exit trades.
The indicator performs its calculations as follows:
Momentum and Volatility Calculation:
roc = ta.roc(close, rocLength)
atr = ta.atr(atrLength)
Volume and Trend Analysis:
volumeFlow = ta.cum(volume) - ta.ema(ta.cum(volume), volumeFlowLength)
emaShort = ta.ema(close, shortEmaLength)
emaLong = ta.ema(close, longEmaLength)
emaDifference = emaShort - emaLong
Composite Signal Calculation:
Normalizes each component (ROC, ATR, volume flow, EMA difference) and combines them into a composite signal:
rocNorm = (roc - ta.sma(roc, rocLength)) / ta.stdev(roc, rocLength)
atrNorm = (atr - ta.sma(atr, atrLength)) / ta.stdev(atr, atrLength)
volumeFlowNorm = (volumeFlow - ta.sma(volumeFlow, volumeFlowLength)) / ta.stdev(volumeFlow, volumeFlowLength)
emaDiffNorm = (emaDifference - ta.sma(emaDifference, longEmaLength)) / ta.stdev(emaDifference, longEmaLength)
compositeSignal = (rocNorm + atrNorm + volumeFlowNorm + emaDiffNorm) / 4
### Originality
The originality of the Uptrick indicator lies in its ability to merge diverse market metrics into a unified signal. This multi-faceted approach goes beyond traditional indicators by offering a deeper, more holistic analysis of market conditions, providing traders with insights that are not only based on price movements but also on underlying market dynamics.
### Practical Application
The Uptrick indicator excels in environments where understanding the interplay between volume, momentum, and volatility is crucial. It is especially useful for:
- Day Traders : Can leverage real-time data to make quick decisions based on sudden market changes.
- Swing Traders : Benefit from understanding medium-term trends to optimize entry and exit points.
- Position Traders : Utilize long-term market trend data to align with overall market movements.
### Best Practices
To maximize the effectiveness of the Uptrick indicator, consider the following:
- Combine with Other Indicators : Use alongside other technical tools like RSI or MACD for additional validation.
- Adapt Settings to Market Conditions : Adjust the indicator settings based on the asset and market volatility to improve signal accuracy.
- Risk Management : Implement robust risk management strategies, including setting stop-loss orders based on the volatility measured by the ATR.
### Practical Examples and Demonstrations
- Example for Day Trading : In a volatile market, a trader notices a sharp increase in the momentum score coinciding with a surge in volume but stable volatility, signaling a potential bullish breakout.
- Example for Swing Trading : On a 4-hour chart, the indicator shows a gradual alignment of decreasing volatility and increasing buying volume, suggesting a strengthening upward trend suitable for a long position.
### Alerts and Their Uses
- Alert Configurations : Set alerts for when the composite score crosses predefined thresholds to capture potential buy or sell events.
- Strategic Application : Use alerts to stay informed of significant market moves without the need to continuously monitor the markets, enabling timely and informed trading decisions.
Technical Notes
Efficiency and Compatibility: The indicator is designed for efficiency, running smoothly across different trading platforms including TradingView, and can be easily integrated with existing trading setups. It leverages advanced mathematical models for normalizing and smoothing data, ensuring consistent and reliable signal quality across different market conditions.
Limitations : The effectiveness of the Uptrick indicator can vary significantly across different market conditions and asset classes. It is designed to perform best in liquid markets where data on volume, volatility, and price trends are readily available and reliable. Traders should be aware that in low-liquidity or highly volatile markets, the signals might be less reliable and require additional confirmation.
Usage Recommendations : While the Uptrick indicator is a powerful tool, it is recommended to use it in conjunction with other analysis methods to confirm signals. Traders should also continuously monitor the performance and adjust settings as needed to align with their specific trading strategies and market conditions.
### Conclusion
The "Uptrick: Momentum-Volatility Composite Signal" is a revolutionary tool that offers traders an advanced methodology for analyzing market dynamics. By combining momentum, volatility, volume, and trend detection into a single, cohesive indicator, it provides a powerful, actionable insight into market movements, making it an indispensable tool for traders aiming to optimize their trading strategies.

Volume-Price PercentileDescription:
The "Volume-Price Percentile Live" indicator is designed to provide real-time analysis of the relationship between volume percentiles and price percentiles on any given timeframe. This tool helps traders assess market activity by comparing how current volume levels rank relative to historical volume data and how current price movements (specifically high-low ranges) rank relative to historical price data. The indicator visualizes the ratio of volume percentile to price percentile as a histogram, allowing traders to gauge the relative strength of volume against price movements in real time.
Functionality:
Volume Percentile: Calculates the percentile rank of the current volume within a user-defined rolling period (default is 30 bars). This percentile indicates where the current volume stands in comparison to historical volumes over the specified period.
Price Percentile: Calculates the percentile rank of the current candle's high-low difference within a user-defined rolling period (default is 30 bars). This percentile reflects the current price movement's strength relative to past movements over the specified period.
Percentile Ratio (VP Ratio): The indicator plots the ratio of the volume percentile to the price percentile. This ratio helps identify periods when volume is significantly higher or lower relative to price movement, providing insights into potential market imbalances or strength.
Real-Time Data: By fetching data from a lower timeframe (e.g., 1-minute), the indicator updates continuously within the current timeframe, offering live, intra-candle updates. This ensures that traders can see the histogram change in real-time as new data becomes available, without waiting for the current candle to close.
How to Use:
Adding the Indicator: To use this indicator, add it to your chart on TradingView by selecting it from the Indicators list once it is published publicly.
Setting Parameters:
Volume Period Length: This input sets the rolling window length for calculating the volume percentile (default is 30). You can adjust it based on the desired sensitivity or historical period relevance.
Candle Period Length: This input sets the rolling window length for calculating the price percentile based on the high-low difference of candles (default is 30). Adjust this to match your trading style or analysis period.
Interpreting the Histogram:
The histogram represents the volume percentile divided by the price percentile.
Above 1: A value greater than 1 indicates that volume is relatively strong compared to price movement, which may suggest high activity or potential accumulation/distribution phases.
Below 1: A value less than 1 suggests that price movement is relatively stronger than volume, indicating potential weakness in volume relative to price moves.
Near 1: Values close to 1 suggest a balanced relationship between volume and price movement.
Application: Use this indicator to identify potential breakout or breakdown scenarios, assess the strength of price movements, and confirm trends. When volume percentile consistently leads price percentile, it might signal sustained interest and support for the current price trend. Conversely, if volume percentile lags significantly, it might warn of potential trend weakness.
Best Practices:
Multiple Timeframe Analysis: While the indicator provides real-time updates on any timeframe, consider using it alongside higher timeframe analysis to confirm trends and volume behavior across different periods.
Customization: Adjust the period lengths based on the asset’s typical volume and price behavior, as well as your trading strategy (e.g., short-term scalping vs. long-term trend following).
Complement with Other Indicators: Use this indicator in conjunction with other volume-based tools, trend indicators, or momentum oscillators to gain a comprehensive view of market dynamics.
1 (or) 5-Minute Scalping Strategy - KGP1-Minute Scalping Strategy - KGP
Overview: This indicator is designed for short-term traders who engage in 1 (or) 5-minute scalping. It combines several technical analysis tools to provide buy and sell signals, helping traders make informed decisions quickly.
Key Features:
VWAP (Volume Weighted Average Price):
Purpose: VWAP provides the average price a security has traded at throughout the day, based on both volume and price.
Usage: Helps identify the overall trend and potential entry points. When the price is above VWAP, it indicates a bullish trend; when below, it indicates a bearish trend.
RSI (Relative Strength Index):
Purpose: RSI measures the speed and change of price movements, indicating overbought or oversold conditions.
Usage: The RSI values between 30 and 70 are used to filter trades. A value above 70 indicates overbought conditions, while below 30 indicates oversold conditions.
Custom OBV (On Balance Volume):
Purpose: OBV uses volume flow to predict changes in stock price.
Usage: Helps confirm the strength of a trend. Increasing OBV indicates accumulation (buying pressure), while decreasing OBV indicates distribution (selling pressure).
Multi-Timeframe Analysis:
Purpose: Confirms signals by analyzing RSI on a higher timeframe (5-minute chart).
Usage: Ensures that signals on the 1-minute chart align with the broader trend on the 5-minute chart, reducing false signals.
Signals:
Buy Signal:
Triggered when the price crosses above the VWAP, and the RSI is between 50 and 70 on both the 1-minute and 5-minute charts.
Visual Cue: A green “BUY” label appears below the bar.'
Sell Signal:
Triggered when the price crosses below the VWAP, and the RSI is between 30 and 50 on both the 1-minute and 5-minute charts.
Visual Cue: A red “SELL” label appears above the bar.
Alerts:
Buy Alert: Notifies you when a buy signal is detected.
Sell Alert: Notifies you when a sell signal is detected.
Additional Visuals:
VWAP Line: Plotted in blue to show the average price based on volume.
OBV Line: Plotted in purple to indicate volume flow.
RSI Line: Plotted in orange with horizontal lines at 70 (overbought) and 30 (oversold) levels.

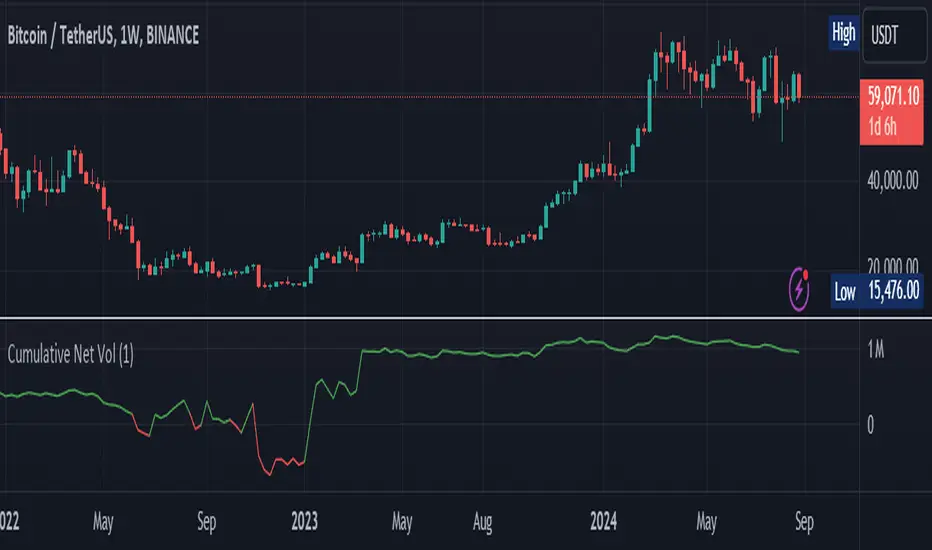
Cumulative Net VolumeCumulative Calculation: Summarizes the net volume (buying minus selling volume) cumulatively, providing a running total that reflects the aggregate trading pressure.
Custom Timeframe Flexibility: Users can choose to analyze the volume on a custom timeframe, enhancing adaptability for various trading strategies.
Color-Coded Visualization: Features an intuitive color scheme where green indicates a net buying dominance and red signals net selling dominance, making it easier to interpret shifts in market dynamics.
Versatility: Suitable for all types of assets available on TradingView including cryptocurrencies like Bitcoin, stocks, forex, and more.
Utility: This tool is particularly useful for identifying trends in buying or selling pressure, which could be pivotal during significant market events or when assessing the potential for a trend reversal. By understanding the accumulation and distribution phases through the cumulative net volume, traders can make more informed decisions.
Perfect for both novice traders looking to get a grip on volume analysis and seasoned professionals seeking an edge in their trading tactics.
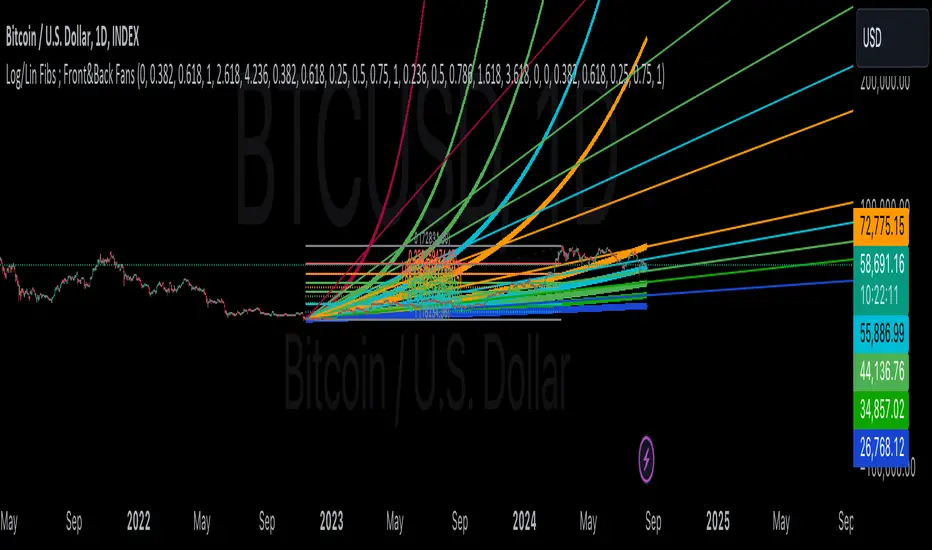
Linear and Logarithmic Fibonacci Levels and (Price&Time) FansIntroduction
The Fibonacci Retracement tool is a go-to for traders looking to spot potential support and resistance levels. By measuring the distance between swing highs and lows, you can apply Fibonacci ratios like 0.236, 0.382, and 0.618 to predict key market levels.
Traditionally, these levels are set by dividing this distance into equal parts—known as Linear Levels. A more refined approach, Logarithmic Price and Time Levels, divides the distance into proportionally equal segments. Plus, this indicator now includes Fibonacci fans, adding another layer of analysis by projecting potential price levels using trendlines based on Fibonacci ratios.
This tool makes it easier to identify both Linear and Logarithmic levels while also leveraging Fibonacci fans for a more complete market view.
Applications
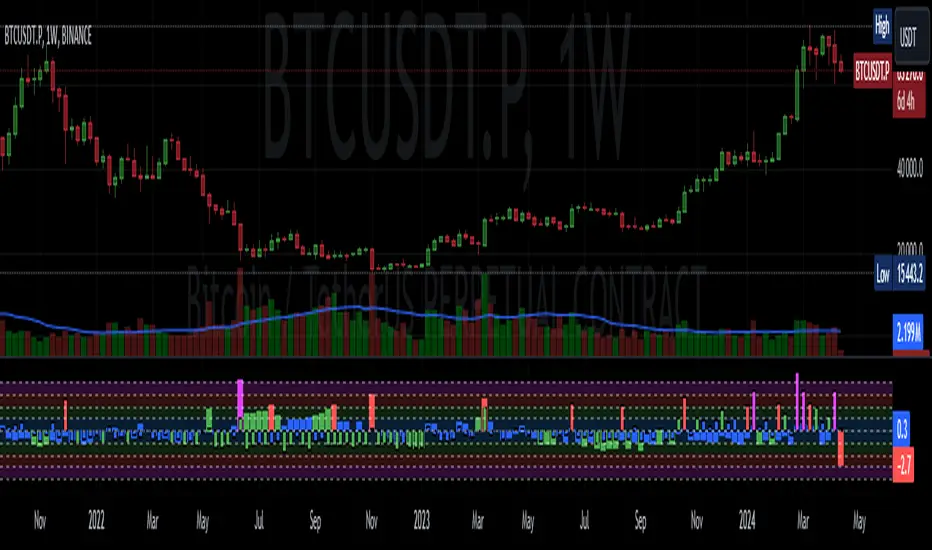
Logarithmic Levels and Fibonacci fans are ideal for volatile markets. In crypto, they’re especially effective for BTCUSDT (check out the wick from January 23, 2024). They also help spot accumulation and distribution patterns in high-volume altcoins like FETUSDT . In traditional markets, they’re useful for tracking stocks like TSLA and NVDA with extreme price swings, as well as indices in inflation-affected markets like XU100 , or recession-hit currency pairs like JPYUSD .
How to Use
This indicator is intuitive and similar to TradingView’s Fibonacci Tool. Select your reference levels (Level 1 and Level 0), then tweak the settings to customize your analysis, including adding Fibonacci fans for extra insights.
Why It’s Different
Unlike TradingView’s tool, which forces you to switch to a logarithmic scale (messing with other indicators and trend lines), this indicator lets you view both Linear and Logarithmic levels—and Fibonacci fans on Price and Time Series—without changing your chart’s scale. The original Fibonacci Code was derived from zekicanozkanli, modified and upgraded to plot fib front and back fans as well. Due to TV Max Plot restrictions I need to publish just Front and Back and Front Fibs separately.
Linear and Logarithmic Fibonacci Levels and FansIntroduction
The Fibonacci Retracement tool is a go-to for traders looking to spot potential support and resistance levels. By measuring the distance between swing highs and lows, you can apply Fibonacci ratios like 0.236, 0.382, and 0.618 to predict key market levels.
Traditionally, these levels are set by dividing this distance into equal parts—known as Linear Levels. A more refined approach, Logarithmic Levels, divides the distance into proportionally equal segments. Plus, this indicator now includes Fibonacci fans, adding another layer of analysis by projecting potential price levels using trendlines based on Fibonacci ratios.
This tool makes it easier to identify both Linear and Logarithmic levels while also leveraging Fibonacci fans for a more complete market view.
Applications
Logarithmic Levels and Fibonacci fans are ideal for volatile markets. In crypto, they’re especially effective for BTCUSDT (check out the wick from January 23, 2024). They also help spot accumulation and distribution patterns in high-volume altcoins like FETUSDT . In traditional markets, they’re useful for tracking stocks like TSLA and NVDA with extreme price swings, as well as indices in inflation-affected markets like XU100 , or recession-hit currency pairs like JPYUSD .
How to Use
This indicator is intuitive and similar to TradingView’s Fibonacci Tool. Select your reference levels (Level 1 and Level 0), then tweak the settings to customize your analysis, including adding Fibonacci fans for extra insights.
Why It’s Different
Unlike TradingView’s tool, which forces you to switch to a logarithmic scale (messing with other indicators and trend lines), this indicator lets you view both Linear and Logarithmic levels—and Fibonacci fans—without changing your chart’s scale. The original Fibonacci Code was derived from zekicanozkanli, modified and upgraded to plot fib fans as well.

BTC - Power Law OscillatorDescription:
The BTC - Power Law Oscillator is a technical analysis tool designed to help traders and investors identify potential overbought and oversold conditions in the Bitcoin market. This oscillator is based on a power law model that approximates Bitcoin's historical price trajectory, providing a framework for understanding deviations from this trajectory over time.
Key Features:
Exponential Model: The oscillator uses an exponential model that represents Bitcoin's price growth over time since its inception on January 3, 2009. This model is mathematically expressed as:
price=exp(5.71×ln(days since inception)−38.16)
This captures the long-term growth trend of Bitcoin, allowing for the analysis of deviations from this model.
Deviation Analysis: The Power Law Oscillator measures the percentage deviation of Bitcoin's closing price from the model price. This deviation is expressed as a percentage to illustrate how far the current price is from the expected model trajectory.
Normalization: The oscillator values are normalized to a 0-100 range. A quadratic transformation is applied to enhance sensitivity to higher values, allowing for better visualization and interpretation of extreme conditions.
Bands and Zones:
Upper Band (50): Indicates the 20% threshold. Values above this band suggest overbought conditions, where Bitcoin's price may be significantly above the expected trajectory.
Lower Band (15): Indicates the 5% threshold. Values below this band suggest oversold conditions, where Bitcoin's price may be significantly below the expected trajectory.
Top Zone: The area above the upper band is shaded red, highlighting potential sell or caution areas.
Bottom Zone: The area below the lower band is shaded green, highlighting potential buy or accumulation areas.
Benefits:
Trend Analysis: Helps identify long-term trends and potential reversals by analyzing price deviations from a theoretical model based on historical growth.
Market Timing: Assists in market timing decisions by indicating overbought and oversold conditions with visual bands and zones.
Enhanced Sensitivity: The quadratic normalization enhances sensitivity to changes in the oscillator, providing clearer signals for traders.
Usage Tips:
Complementary Tool: Use this oscillator in conjunction with other technical indicators and fundamental analysis for more comprehensive market insights.
Risk Management: Always employ sound risk management strategies when trading, as no single indicator can guarantee accurate predictions.
Market Context: Consider the broader market context, as Bitcoin's volatility can lead to significant short-term fluctuations.
The BTC - Power Law Oscillator provides a unique perspective on Bitcoin's price movements by leveraging a mathematical model to understand historical growth trends and deviations. Use this tool to gain deeper insights into market dynamics and enhance your trading strategy.

Logarithmic and Linear Fibonacci LevelsIntroduction
Fibonacci levels are a technical analysis tool used by some traders to identify potential support and resistance levels. The principle for determining these levels is to take the distance between selected reference high and low points (swing high and swing low in general) as 1 unit and mark the ratios derived from the Fibonacci sequence, such as 0.236, 0.382, 0.618, etc., over this 1 unit. In the conventional method of level determination, the 1 unit is divided into equal distances within itself, and Fibonacci levels are determined based on these equal distances. These types of levels are called Linear Levels . A relatively less common method involves dividing the 1 unit into progressively smaller, more accurately described as proportionally equal, distances and determining Fibonacci levels based on these distances. These types are called Logarithmic Levels . The purpose of this indicator is to provide ease of use in determining both Linear and Logarithmic levels.
Where can it be Used?
Logarithmic Levels can be used in any instrument where volatility is high for any reason. Specifically in crypto, Logarithmic Levels work very well for BINANCE:BTCUSDT (to observe this, please study the wick from January 23, 2024). As another example, Logarithmic Levels can be used to identify potential accumulation and distribution schemes in altcoins with relatively high volume and market capitalization (refer to the chart provided above BINANCE:FETUSDT ). Additionally, when analyzing traditional markets, Logarithmic Levels can be beneficial for stocks with highly inflated or deflated prices (e.g., NASDAQ:TSLA , NASDAQ:NVDA ), in stock markets of countries battling high inflation (e.g., BIST:XU100 ), or in currency pairs of countries experiencing a recession (e.g., FX_IDC:JPYUSD ).
How can it be Used?
It is designed similarly to the Fibonacci Tool provided by Trading View to ensure users feel familiar with it. When you start the indicator, select the reference levels (Level 1 and Level 0), then click on the indicator settings to choose specific levels and customize them according to your preferences.
What Makes it Unique?
Indeed, in the Fibonacci Tool provided by Trading View, we can see both linear and logarithmic levels. However, to view logarithmic levels, it is necessary to switch the relevant instrument's Super Chart to a logarithmic scale. This causes the levels we want to remain 'linear' to also be displayed in their logarithmic form, potentially leading to errors in other indicators we use, incorrect functioning of trend lines drawn in linear scaling, and so on. Additionally, when the Super Chart is scaled logarithmically, it prevents the ability to set alerts for prices and trend lines. This indicator was created to avoid these problems without needing to change the chart's scaling method and to allow the simultaneous viewing of both Linear and Logarithmic levels.

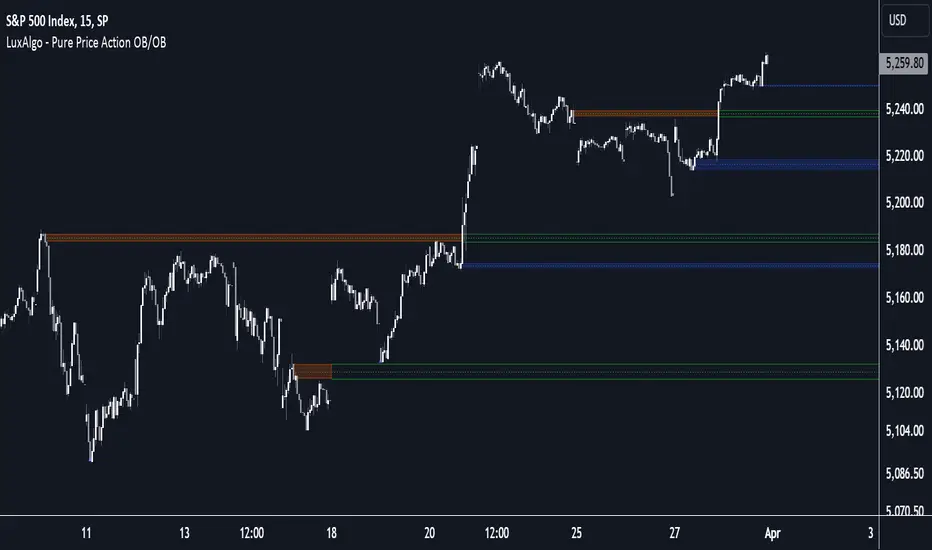
Pure Price Action Order & Breaker Blocks [LuxAlgo]The Pure Price Action Order & Breaker Blocks indicator is a pure price action adaptation of our previously published and highly popular Order-Blocks-Breaker-Blocks script.
Similar to its earlier version, this indicator detects order blocks that can automatically turn into breaker blocks on the chart once mitigated. However, the key difference/uniqueness is that the pure price action version relies solely on price patterns, eliminating the need for length definitions. In other words, it removes the limitation of user-defined inputs, ensuring a robust and objective analysis of market dynamics.
🔶 USAGE
An order block is a significant area on a price chart where there was a notable accumulation or distribution of orders, often identified by a strong price move followed by consolidation. Traders use order blocks to identify potential support or resistance levels.
A mitigated order block refers to an order block that has been invalidated due to subsequent market movements. It may no longer hold the same significance in the current market context. However, when the price mitigates an order block, a breaker block is confirmed. It is possible that the price might trade back to this breaker block, potentially offering a new trading opportunity.
Users can optionally enable the "Historical Polarity Changes" labels within the settings menu to see where breaker blocks might have previously provided effective trade setups.
This feature is most effective when using replay mode. Please note that these labels are subject to backpainting.
🔶 DETAILS
The swing points detection feature relies exclusively on price action, eliminating the need for numerical user-defined settings.
The first step involves detecting short-term swing points, where a short-term swing high (STH) is identified as a price peak surrounded by lower highs on both sides. Similarly, a short-term swing low is recognized as a price trough surrounded by higher lows on both sides.
Intermediate-term swing and long-term swing points are detected using the same approach but with a slight modification. Instead of directly analyzing price candles, we now utilize the previously detected short-term swing points. For intermediate-term swing points, we rely on short-term swing points, while for long-term swing points, we use the intermediate-term ones.
🔶 SETTINGS
Detection: Market structure used to detect swing points for creating order blocks.
Show Last Bullish OB: Number of the most recent bullish order/breaker blocks to display on the chart.
Show Last Bearish OB: Number of the most recent bearish order/breaker blocks to display on the chart.
Use Candle Body: Allows users to use candle bodies as order block areas instead of the full candle range.
🔹 Style
Show Historical Polarity Changes: Allows users to see labels indicating where a swing high/low previously occurred within a breaker block.
🔶 RELATED SCRIPTS
Pure-Price-Action-Structures.
Order-Blocks-Breaker-Blocks.
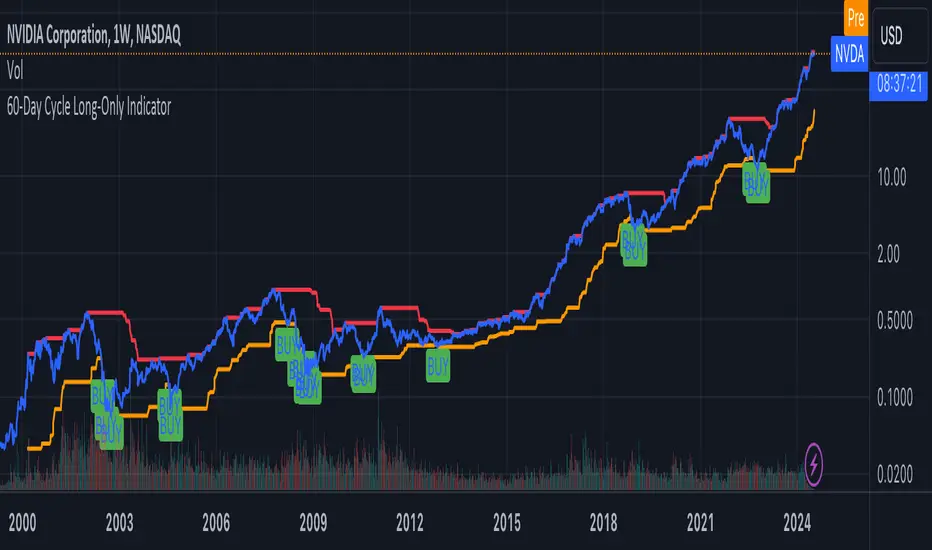
60-Day Cycle Long-Only IndicatorThe following indicator generates ‘Buy’ signals based on rotating 60-day cycles. The general theory is that when buying strong, growth-oriented assets, 60-day micro-cycles culminate into larger macro-cycles.
Summary:
Explaining the Upper and Lower Bounds in the 60-Day Cycle Strategy:
1. Cycle High (Upper Bound):
The cycle high is the highest closing price of the asset over the past 60 days. This value acts as the upper boundary of the 60-day cycle, indicating the peak price level during this period. When the current closing price is above this boundary, it suggests a potential distribution phase, where the asset might be overbought, and larger players may be selling off their positions. In the strategy, the cycle high is plotted as a red line on the chart, helping traders visually identify the upper limit of the 60-day trading range.
2. Cycle Low (Lower Bound):
The cycle low is the lowest closing price of the asset over the past 60 days. This value acts as the lower boundary of the 60-day cycle, indicating the trough price level during this period. When the current closing price is below this boundary, it suggests a potential accumulation phase, where the asset might be oversold, and larger players may be accumulating positions at lower prices. In the strategy, the cycle low is plotted as an orange line on the chart, helping traders visually identify the lower limit of the 60-day trading range.
How These Bounds Are Calculated:
• Cycle High: Calculated using the highest closing price over the last 60 trading days. In Pine Script, this is achieved with the function ta.highest(close, cycle_length), where cycle_length is set to 60 days.
• Cycle Low: Calculated using the lowest closing price over the last 60 trading days. In Pine Script, this is achieved with the function ta.lowest(close, cycle_length), where cycle_length is set to 60 days.
Interpretation and Application:
• Buy Signal: A buy signal is generated when the closing price crosses above the cycle low. This indicates a potential end to the bearish phase and the start of a bullish trend.
• Distribution Phase: When the closing price crosses above the cycle high, it suggests the market is in a distribution phase, potentially signaling a bearish trend or a sell-off period.
Example:
On a trading chart, the cycle high and cycle low are plotted as horizontal lines, with their colors distinguishing them (red for cycle high and orange for cycle low). These lines create a visual range within which the asset's price has moved over the last 60 days, helping traders quickly assess whether the current price is near the upper or lower bound.
By identifying and plotting these upper and lower bounds, traders can better understand the current market phase and make more informed trading decisions based on the 60-day cycle strategy. This indicator can be used across various assets.
Candle Range Detector [UAlgo]The "Candle Range Detector " is a Pine Script™ indicator designed to identify trading opportunities based on the concept of price consolidation and breakout. It analyzes the price range of a specified number of previous candles and detects when subsequent candles stay within that range (consolidation). The indicator then highlights potential breakouts above or below the range and provides calculated Take Profit (TP) and Stop Loss (SL) levels based on your chosen method (percentage or Average True Range - ATR).
🔶 Key Features
Configurable Range: Define the minimum number of candles required to establish a valid price range.
Breakout Detection: Identify potential breakouts above or below the established range based on your selection (close price or wick).
Take Profit & Stop Loss Levels: The indicator calculates TP and SL levels based on your chosen method (percentage or ATR) and user-defined multipliers. The calculated TP and SL levels are visualized as horizontal lines with corresponding labels ("Take Profit" and "Stop Loss").
Optional Count Display: You can choose to display the number of candles currently within the range.
🔶 Disclaimer:
Not Financial Advice: This indicator is intended for educational and informational purposes only. It does not constitute financial advice or recommendations to buy, sell, or hold any financial instruments.
Use at Own Risk: Trading involves substantial risk of loss and is not suitable for all investors. Users of this indicator should exercise caution and conduct their own research and analysis before making any trading decisions.
Performance Not Guaranteed: Past performance is not indicative of future results. While the indicator aims to assist traders in analyzing market trends, there is no guarantee of accuracy or success in trading operations.
🔷 Related Scripts
Range Finder

[SGM Volatility Lvl]Choppiness Index (CI)
The Choppiness Index is a technical analysis tool used to determine whether a market is trending or consolidating. CI values range between 0 and 100:
- Higher values (close to 100) indicate a choppy market (i.e., the market is consolidating and not trending strongly).
- Lower values (close to 0) signify a trending market (either up or down).
In this script:
- CI values above 62 are considered to represent high volatility.
- CI values below 28 are viewed as representing lower volatility or consolidation.
How the Indicator Works
Choppiness Index Calculation
The CI is calculated using the average true range (ATR) and the high-low range over the specified length:
ci = 100 * math.log10(math.sum(ta.atr(1), length_line) / (ta.highest(length_line) - ta.lowest(length_line))) / math.log10(length_line)
Volatility Determination
The script determines the market's volatility state based on CI:
if ci >= 62
ischarge := 2
if ci <= 28
ischarge := 0
- ischarge = 2 indicates high volatility.
- ischarge = 0 indicates consolidation.
Line Setup
Lines are set on the chart based on the market's volatility:
- If CI increases and indicates high volatility, a line (colored with `volcolor`) is drawn at the close price of the bar.
- If CI decreases and indicates consolidation, a line (colored with `conColor`) is drawn at the close price of the bar.
Line Extension
The lines are automatically extended to the next indicator update or bar:
for i = 0 to array.size(ray) - 1
if i < array.size(ray) - 1
current_line = array.get(ray, i)
next_line = array.get(ray, i + 1)
if not na(current_line) and not na(next_line)
line.set_x2(current_line, line.get_x1(next_line))
else
line.set_x2(current_line, bar_index)
Relevance
Identifying Key Levels
The indicator helps traders identify key levels as follows:
- High Volatility : Lines indicating high volatility suggest strong trending movements. These levels can signify breakout points or areas where the price has made significant moves.
- Consolidation : Lines indicating consolidation suggest the market is ranging. These levels can be used to identify sideways movements, areas of accumulation or distribution, and potential breakout zones.
Potential Future Points of Interest
- High Volatility Lines: Can serve as resistance or support levels if the market revisits these areas.
- Consolidation Lines: Highlight potential zones for price breakouts or reversals when the market transitions from consolidation to a trending phase.
In summary, this indicator can be particularly useful for traders looking to identify periods of high volatility and consolidation. By marking such periods on the chart, traders can better understand market behavior and spot potential trading opportunities.

MVRV-Z adjusted EN version (by ilyaevp95)Descriptions:
The MVRV Z-Score indicator is a powerful tool designed by original authors Murad Mahmudov and David Puell for BTC to help traders make informed decisions about their cryptocurrency investments. It is based on the MVRV (Market Value to Realized Value) metric, which measures the relationship between the market capitalization and the realized capitalization of a cryptocurrency. The indicator provides signals for accumulating or selling an asset based on deviations in market capitalization from realized capitalization.
How it works:
Market Capitalization : This is the total value of coins that have been issued at a given point in time. Market capitalization is calculated by multiplying the current price of the asset by the number of coins that have been issued.
Realized Capitalization (Realized Price) : This is the amount of money that has been spent on purchasing a particular asset. In the context of cryptocurrencies, it represents the sum of all transaction values for a specific blockchain. Realized capitalization can be calculated using historical data on transaction prices.
MVRV Metric : The MVRV metric compares market capitalization with realized capitalization, providing a measure of how overvalued or undervalued a cryptocurrency is relative to its historical transaction data. A high MVRV value indicates that the market is overvaluing the asset, while a low MVRV suggests undervaluation.
Z-Score Calculation : The Z-score is a statistical measure that normalizes the deviation of market capitalization from its mean value (realized capitalization) to a standard deviation. This makes it possible to compare assets that have different values and time periods, as it takes into account the volatility of the market.
Note: For accurate Z-score calculation, you need to use the indicator on a chart with a mostly complete historical data set for a specific cryptocurrency.
Signals : Based on the Z-score, the indicator generates signals for accumulation or sale. If the Z-score falls below a certain threshold (negative), it may indicate an opportunity to accumulate the asset. Conversely, if the Z-score rises above a positive threshold, it could suggest a potential sell signal.
The indicator uses a color-coded system to provide traders with visual cues:
Green background indicates a signal to accumulate.
Orange (Red) background indicates a signal to sell.
Deviations exceeding the specified thresholds by 1 and 2 Z (positive direction), 0.5 and 1 Z (negative direction) are highlighted in a brighter color, indicating more extreme deviations.
Note: The signals provided by this indicator should not be considered financial advice. Traders should conduct their own research (DYOR) before making any investment decisions.
Parameters: The indicator provides several parameters for customization:
Blockchain : The blockchain for which the analysis is performed. This allows the user to select the specific blockchain they are interested in analyzing. The default value is BTC.
Z threshold for positive deviations : This parameter sets the threshold above which the deviation will be considered positive. A higher value will result in fewer signals, while a lower value may generate more false signals. The default value is 3.0.
Z threshold for negative deviations : Similar to the previous parameter, this sets the threshold below which the deviation will be considered negative. The default value is 0.
Market Capitalization : There are two types of market capitalization available: Standard and Free float coin capitalization. Free float is calculated by multiplying its current price by the total number of units in free circulation - the number that are not locked in any contracts or other forms of restriction. For DASH, ZEC, BAT and ALGO available only Free float capitalization. The default value is "Standard"
Negative Deviation Filter Mode : When enabled, if the deviation has been positive for a certain number of previous weeks (the default value is 40 weeks), the indicator will not generate a signal to accumulate. This helps to avoid false signals during the start of a bearish market. This may be helpful for volatile coins, whose price can drastically fall below the realized price after the end of a bull market. The default setting is "disabled".
Display Options:
MVRV plot : Displays the MVRV metric for the selected blockchain.
Z-Score plot : Shows the Z-score calculated by the indicator.
Realized Price plot : Provides a visual representation of the realized price of the cryptocurrency on main chart.
S ignal Display : Choose whether to display signals on the main chart or in a separate panel.
Historical mode : Choose whether to show signals for all historical data on the chart or for a certain number of periods. The default setting is "disabled".

ICT Propulsion Block [LuxAlgo]The ICT Propulsion Block indicator is meant to detect and highlight propulsion blocks, which are specific price structures introduced by the Inner Circle Trader (ICT).
Propulsion Blocks are essentially blocks located where prices interact with preceding order blocks. Traders often utilize them when analyzing price movements to identify potential turning points and market behavior or areas of interest in the market.
🔶 USAGE
An order block is a significant area on a price chart where there was a notable accumulation or distribution of orders, often identified by a strong move in price followed by a consolidation or sideways movement. Traders use order blocks to identify potential support or resistance levels.
A Propulsion Block, on the other hand, is a concept taught by the Inner Circle Trader (ICT) and refers to a specific type of order block that interacts with the preceding order block. Traders often analyze propulsion blocks to identify potential turning points and areas of interest in the market.
A mitigated order block refers to an order block that has been invalidated or nullified due to subsequent market movements or developments. It no longer holds the same significance or relevance in the current market context.
Let's explore a bearish order block and propulsion block scenario commonly utilized by ICT traders in their trading strategies.
🔶 SETTINGS
🔹 Order & Propulsion Blocks
Swing Detection Length: Lookback period used to detect swing points for creating order blocks and/or propulsion blocks.
Mitigation Price: Allows users to choose between the closing price or the candle's wick for mitigation.
Highlight Propulsion Block Signals: Highlights the propulsion block and its sentiment for easier identification and analysis.
Remove Unassociated Order Blocks: Eliminate order blocks that are not associated with any propulsion block.
Remove Mitigated Blocks: Eliminates mitigated order blocks and propulsion blocks along with their associated order blocks, streamlining the visualization for clearer analysis.
Most Recent Blocks: Activates processing of the specified number of most recent blocks according to the option. If not enabled, the script defaults to processing the last 125 occurrences.
🔹 Order & Propulsion Blocks Style
Bullish Order & Propulsion Blocks: Toggles the visibility of bullish order and propulsion blocks, along with color customization options.
Bearish Order & Propulsion Blocks: Toggles the visibility of bearish order and propulsion blocks, along with color customization options.
Block Labels: Toggles the visibility of order and propulsion block labels, and label size customization option.
🔶 RELATED SCRIPTS
Order-Blocks-Breaker-Blocks .

AMDX/XAMD indicatorThe AMDX/XAMD indicator is designed to highlight specific trading sessions on the chart using distinct colors and optional vertical lines. Users can choose between two session types, AMDX or XAMD, and customize the visual appearance of the sessions. This tool is particularly useful for traders who want to analyze market behavior during different trading periods.
Meaning of AMDX:
A: Accumulation
M: Manipulation
D: Distribution
X: Continuation Or Reversal
Features:
Session Highlighting:
AMDX Sessions: Split into four segments - A, M, D, X.
XAMD Sessions: Split into four segments - X, A, M, D.
Customizable Colors:
Choose individual colors for each session (A, M, D, X).
Adjust the transparency of the session boxes for better visual integration with the chart.
Drawing Styles:
Box Style: Draws colored boxes around the session ranges.
Line Style: Draws vertical lines at session start and end times.
Vertical Lines:
Option to enable or disable vertical lines at session boundaries.
Customizable line style: Solid, Dotted, or Dashed.
Session Labels:
Automatically labels each session for easy identification.
Customization Options:
Session Type: Select between AMDX and XAMD session types.
Colors: Set custom colors for each session and vertical lines.
Border Width: Adjust the width of the session box borders.
Transparency: Control the transparency level of the session boxes.
Drawing Style: Choose between Box and Line styles for session representation.
Vertical Lines: Enable or disable vertical lines and select the line style.
How It Works:
The indicator calculates the start and end times for each session based on the selected session type (AMDX or XAMD). It then draws either boxes or lines to highlight these sessions on the chart. The indicator also includes options to draw vertical lines at the session boundaries and labels each session with a corresponding letter (A, M, D, X).
Use Cases:
Market Session Analysis: Easily identify and analyze market behavior during different trading sessions.
Intraday Trading: Helps intraday traders to focus on specific time segments of the trading day.
Visual Segmentation: Provides a clear visual segmentation of the trading day, aiding in better decision-making.
Times for AMDX/XAMD session:
A Session: 18:00 (previous day) to 03:00 (current day)
M Session: 03:00 to 09:00
D Session: 09:00 to 12:00
X Session: 12:00 to 18:00
Time for the XAMD session :
X Session: 18:00 (previous day) to 00:00 (current day)
A Session: 00:00 to 09:00
M Session: 09:00 to 12:00
D Session: 12:00 to 18:00
sVPSA - standardized Volume Price Spread AnalysisDear Analysts and Traders,
I want to introduce my new indicator - sVPSA - standardized Volume Price Spread Analysis. For me, this script is helpfully in Technical Analysis mainly with Wyckoff and VSA methodologies. Maybe You are in circle of people who used my previous script - normalized Volume Price Spread Analysis. I work with him a lot of time, but I come to a conclusion that I can do better...
Theory concept...
What is a big volume? How big was this spread? It was extreme high or just high? How to do an answer for this and a lot other questions related to this subject? My thoughts was directed to statistics. In my first script I used to x/max normalized data. It was good, but susceptible for high deviation events. So, I choose standardization method with smaller sensitivity on violent events - z-Score standardization Description of z-Score formula:
Z = (x-mean)/standard deviation
Probability of event are descriptive by probability density function - The Normal Distribution.
en.wikipedia.org
en.Wikipedia.org
This is base of script methodology, let’s go deeper in indicator.
X axis is time, date. Y axis is standard deviation. Narrow bar represent price spread, wide one is volume. Colors are corresponding to deviation, blue < sigma, green > sigma, red > 2*sigma and fuchsia > 3*sigma. Appearance is full editable.
Data collection starts from left to right. There is two possibilities to use, constans number of bars or visible data range, also indicator permit to overscore linear regression from data. There is a possibility to set an alert.
Short introduction how put an interpretation on visualized data.
For this example I used constans value of data collection, 52 bars. So, from left I see great, fuchsia volume bar with low spread. This record respond Celsius withdrawals pause. This is bar with the biggest volume on presented chart, more than four sigmas. Spread value is near one sigma. I should consider this via one of Wyckoffs laws - effort vs result. I see a three bars in turn, they tenor tells me that bear market is possible near end. Accumulation structure near new year, spring test and bullish momentum bar near march are approval of this idea. Next high spread bars have volume near mean value. Effort is low but result is great. Interesting is last bar, with -2,8 deviation of volume. I see the lowest volume value on chart, so he’s deviation is strong to negative side. This script require a little of practise and can be a potent tool in Technical Analysis.
If You have a concept how to improve my script or You experience bug, please, send me feedback.
I hope that You consider my work as useful.
I wish You great trades and faultless analysis.
CatTheTrader
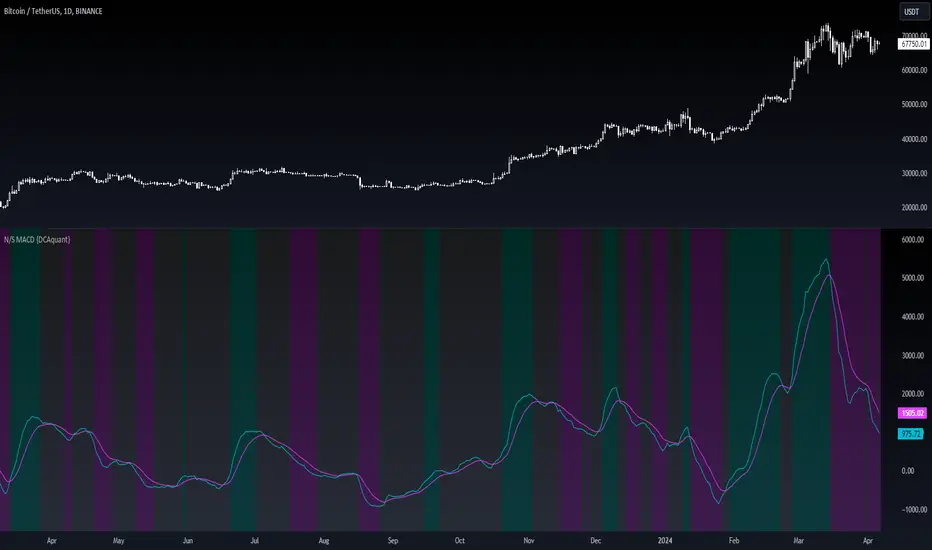
Neutral State MACD {DCAquant}The Neutral State MACD {DCAquant}
The Neutral State MACD {DCAquant} offers a nuanced interpretation of the classic MACD (Moving Average Convergence Divergence) indicator. By focusing on the neutrality of price movements, it serves to identify periods where the market lacks a defined directional bias, often seen as potential phases of accumulation or distribution before a new trend emerges.
Characteristics of the Neutral State MACD {DCAquant}:
Enhanced MACD Formula: Incorporates a neutral zone detection system into the traditional MACD framework to spotlight periods of market equilibrium.
Neutral Zone Threshold: A user-defined parameter that establishes a range within which the MACD and the signal line convergence is considered indicative of a neutral state.
Color-Coded Visualization: Utilizes color variations to illustrate the relationship between the MACD line and the signal line, accentuating the detection of neutral states, bullish crossovers, and bearish crossovers.
Functionality:
MACD and Signal Line Calculation: Employs fast and slow EMA inputs to generate the MACD line, contrasted against a signal line to capture momentum shifts.
Neutral State Detection: Assesses the proximity between the MACD and signal lines relative to the neutral zone threshold, identifying periods where neither bullish nor bearish momentum is dominant.
Background Highlighting: Modifies the chart's background color to reflect the current state of the market—neutral (gray), bullish divergence (teal), or bearish divergence (purple).
Interpretation and Trading Strategy:
Market Phases Identification: Traders can spot periods of equilibrium that may precede significant market moves, aiding in the timing of entry and exit points.
Momentum Analysis: The MACD line's cross above the signal line suggests increasing bullish momentum, whereas a cross below may signal growing bearish momentum.
Trend Confirmation: Acts as a confirmation tool when aligned with trend-following strategies, providing additional validation for trade setups.
Customization and User Guidance:
Adjustable Parameters: Allows for fine-tuning of length settings and the neutral zone threshold to match different trading styles and market conditions.
Complementary Indicator: Can be paired with volume indicators, price action patterns, or other oscillators to form a comprehensive trading system.
Disclaimer:
The Neutral State MACD {DCAquant} is a sophisticated tool meant for educational and strategic development. Traders should integrate it within a broader analytical framework and consider additional market factors. It is not a standalone signal for trades and should be used with caution and proper risk management. Trading decisions should always be made in the context of well-researched strategies and responsible investment practices.