X-volume assessment numberSee source code for more details. Src1 = distribution and Src2 = accumulation.Pine Script® 인디케이터mastermind9631의2215
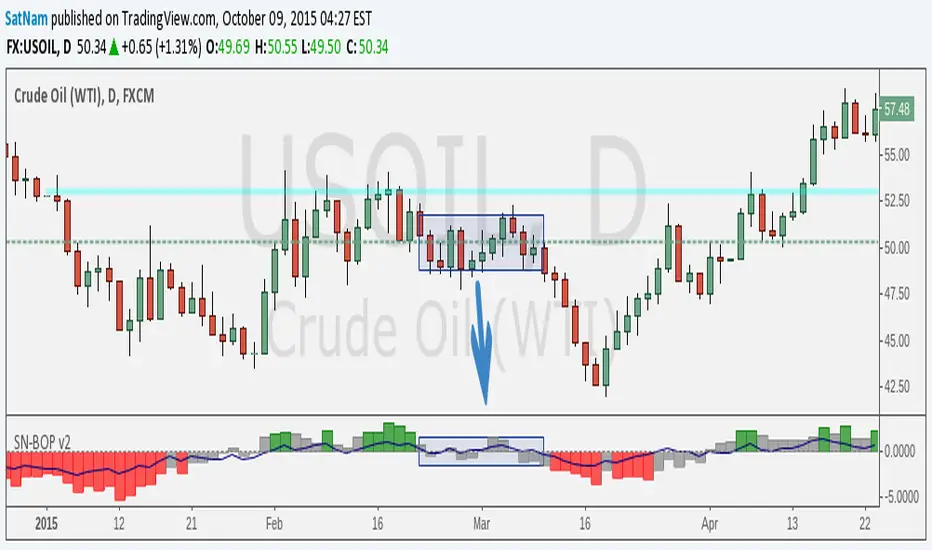
SN Smoothed Balance of Power v2Hi all, here is an updated version of the indicator script I published yesterday. The goal of this indicator is to try and find darkpool activity. The indicator itself is not enough to fully identify darkpool but it should be able to detect quiet accumulation. What makes this Balance of Power different from others on TV is that it is smoothed by using a moving average. Notes: - The values that are default are completely arbitrary except for the VWMA length (a 14-day period for the 1D chart is the norm). For instance the limit where it shows red/green I picked because it works best for the 1D chart I am using. Other TF's and charts will need tweaking of all the values you find in the options menu to get the best results. - I modified the indicator such that it is usable on charts that do not show volume. HOWEVER, this chart is default to NYMEX: CL1!. To get different volume data this needs to be changed in the option menu. - I am in no way an expert on darkpool/HFT trading and am merely going from the information I found on the internet. Consider this an experiment. Credits: - Lazybear for some of the plotting-code - Igor Livshin for the formula - TahaBintahir for the Symbol-code (although I'm not sure who the original author is...)Pine Script® 인디케이터SatNam의44517
Indicators: Volume Zone Indicator & Price Zone IndicatorVolume Zone Indicator (VZO) and Price Zone Indicator (PZO) are by Waleed Aly Khalil. Volume Zone Indicator (VZO) ------------------------------------------------------------ VZO is a leading volume oscillator that evaluates volume in relation to the direction of the net price change on each bar. A value of 40 or above shows bullish accumulation. Low values (< 40) are bearish. Near zero or between +/- 20, the market is either in consolidation or near a break out. When VZO is near +/- 60, an end to the bull/bear run should be expected soon. If that run has been opposite to the long term price trend direction, then a reversal often will occur. Traditional way of looking at this also works: * +/- 40 levels are overbought / oversold * +/- 60 levels are extreme overbought / oversold More info: drive.google.com Price Zone Indicator (PZO) ------------------------------------------------------------ PZO is interpreted the same way as VZO (same formula with "close" substituted for "volume"). Chart Markings ------------------------------------------------------------ In the chart above, * The red circles indicate a run-end (or reversal) zones (VZO +/- 60). * Blue rectangle shows the consolidation zone (VZO betwen +/- 20) I have been trying out VZO only for a week now, but I think this has lot of potential. Give it a try, let me know what you think. Pine Script® 인디케이터LazyBear의1414 2.5 K
Volume ProfileVolume Profile Liquidity Map Volume Profile Liquidity Map is a market structure analysis tool designed to visualize volume distribution across price levels and identify key liquidity zones where major market activity occurs. The indicator combines: range-based volume profile accumulation and distribution areas high-liquidity nodes reaction zones with increased probability of price response This provides traders with a clear structural map showing: where support and resistance are formed where institutional positions are concentrated where price is likely to slow down, reverse, or accelerate Practical Value Fast identification of price holding levels Precise zones for entries, scaling, and profit taking Clear understanding of where the market is building positions vs. moving through The tool is especially effective during: consolidation ranges accumulation phases liquidity-driven trading environments Methodology This is not a signal-based indicator. It functions as a structural market map, allowing decisions to be made using real volume distribution rather than lagging technical signals.Pine Script® 인디케이터jjart의63
Harmonic Frequency Visualizer [BackQuant]Harmonic Frequency Visualizer Overview Harmonic Frequency Visualizer is a cycle-analysis and cross-asset resonance tool that uses a simplified Discrete Fourier Transform (DFT) to measure how strongly specific cycle periods are present in price. It is not a “trend indicator” and it is not trying to predict direction by itself. Its job is to quantify rhythm: which repeating periods (in bars) are currently dominant, whether those cycles are expanding or contracting (phase direction), and whether multiple instruments are sharing the same dominant periods at the same time (resonance). This indicator has two main output modes: Spectrum : a frequency “snapshot” showing amplitude at each tested period for up to five instruments. Spectrogram : a history heatmap showing how the spectrum evolves through time (for the chart instrument). Spectrum Spectrogram On top of that, it produces a Dominant Cycle Oscillator derived from the dominant cycle’s phase, which gives a continuous cycle position metric (peak/trough style zones) without repainting. This is designed for traders who want cycle context the same way they want volatility context: not as a magic signal, but as structure. What “frequency” and “cycles” mean in trading terms A cycle period (say 21 bars) means: “a repeating pattern that tends to complete one full oscillation every 21 bars.” If price contains such a pattern, the DFT will detect a strong correlation between price and a 21-bar sine/cosine wave. Markets do not have perfectly stable periodic motion, but they often show: Mean-reverting swings around value. Trend pulses with pullback cadence. Volatility clustering that creates rhythmic expansions and contractions. Cycle tools are trying to measure those repeating components, and DFT is the standard mathematical way to do it. Where DFT comes from (the core idea) The Discrete Fourier Transform comes from Fourier analysis, a foundational signal processing concept: Fourier’s idea : any sufficiently well-behaved signal can be expressed as a sum of sine and cosine waves at different frequencies, each with: An amplitude (how strong that wave is). A phase (where you are within the wave cycle). In continuous math you get the Fourier Transform. In sampled data (like candles) you use the Discrete Fourier Transform. It converts a time series (price over time) into a frequency description (strength of different cycles). In markets: Time domain: candles and price series. Frequency domain: cycle periods and their strengths. Why sine and cosine, not just sine A sine wave alone cannot represent every phase alignment cleanly. DFT uses both cosine and sine components because together they form an orthogonal basis that can represent any phase shift. You can think of it like this: Cosine component captures “in-phase” alignment with the cycle. Sine component captures “quadrature” (90-degree shifted) alignment. Combining them gives full information: amplitude + phase. Mathematically, a single frequency component can be written as: A * cos(ωt + φ) But DFT estimates A and φ by separately accumulating cosine and sine projections. How this script implements the DFT (and what it is actually measuring) This is not a full-spectrum FFT across every frequency. It is a targeted DFT across a fixed set of cycle periods: Tested periods The script tests 8 predefined periods: 5, 8, 13, 21, 34, 55, 89, 120 These are Fibonacci-like cycle candidates commonly used in cycle/market structure work. The point is not that Fibonacci is magic. The point is that these represent a reasonable spread from short to long rhythms without needing hundreds of frequencies (which would be heavy in Pine). Normalization step (important) Before computing the DFT, the script normalizes the series: mn = SMA(src, lookback) sd = stdev(src, lookback) norm = (src - mn) / sd (if sd != 0) Why normalize: DFT amplitude depends on the scale of the input series. If you compare BTC and TLT raw prices, the magnitude is meaningless. Z-score normalization makes amplitude more comparable across instruments and regimes. So the spectrum is measuring “cyclical structure in standardized deviations,” not raw dollars. Projection onto cosine and sine For each tested period P: ω = 2π / P (angular frequency for that period) Compute: - sCos = Σ(norm * cos(ωk)) - sSin = Σ(norm * sin(ωk)) Interpretation: You are correlating the last window of normalized price with a cosine wave of period P. And also correlating it with a sine wave of period P. If the price has a strong P-bar rhythm, these sums grow in magnitude. Window length detail The script uses: window = min(lookback - 1, 99) So even if lookback is 200, the internal DFT accumulation caps at 100 bars for performance stability. This is a deliberate trade: stable computation in Pine, while still letting you define normalization lookback and overall context. Amplitude computation Once sCos and sSin are computed: raw magnitude = sqrt(sCos² + sSin²) This is the length of the vector (sCos, sSin). That vector length is the standard way to combine the orthogonal components into one strength metric. Then it scales it into a 0–100 “display amplitude”: amp = sqrt(sCos² + sSin²) / lookback * 100 * sensitivity amp is capped to 100 So: Higher amplitude means stronger alignment with that cycle period. Sensitivity is a user control to amplify or damp the display scaling. Important: amplitude here is not a probability, and it is not guaranteed “signal quality.” It is a standardized “how much of that cycle exists in the recent window” metric. Phase computation Phase is computed using atan2(sSin, sCos). That matters because: A simple atan(sin/cos) fails in different quadrants. atan2 correctly resolves the angle from -π to +π. Phase tells you where you are within the cycle: Two cycles can have same amplitude but opposite phase. Phase is what lets you infer “approaching peak vs trough” behavior. Dominant cycle selection The script chooses the dominant cycle as the period with the highest amplitude among the tested periods: domIdx = argmax(amp ) domAmp = max amplitude domPhase = phase at domIdx This dominant cycle is used for: Spectrogram history matrix (chart symbol). Dominant cycle oscillator. Data window outputs (dominant period, oscillator value). Spectrum View: what you see and how to read it In Spectrum mode, the indicator draws a frequency snapshot for up to five instruments. Each instrument gets a spectrum line (or bars/area depending on style) plotted across the 8 periods on the x-axis, with amplitude (0–100) on the y-axis. X-axis meaning Each x position corresponds to a period (5 → 120 bars). You are not looking at “frequency in Hz.” You are looking at “period in bars,” which is more intuitive in trading. Y-axis meaning Amplitude is a scaled measure of how strongly that period is present in the recent normalized data. Higher means stronger. Plot styles Waveform: connects amplitude points into a continuous shape, best for seeing spectrum shape. Bars: draws vertical bars per period, best for quick comparison. Area: similar to waveform but filled toward baseline for emphasis. Dominant peaks and phase direction labels The script highlights dominant cycles per symbol (if enabled): If max amplitude > 20, it labels that peak with the symbol name. If Show Phase Direction is enabled, it appends ▲ or ▼. Phase direction logic: rising = sin(phase) < 0 ▲ means cycle is in a “rising” phase segment ▼ means cycle is in a “falling” phase segment This is not “price will rise now.” It is “the dominant cycle’s instantaneous phase suggests you are on the upward vs downward half of that oscillation.” In real markets, you use this as context, not as a standalone trade trigger. It also draws small ▲/▼ markers on secondary peaks (amp > 15) to show phase direction of other meaningful cycles, giving you a richer picture than “one dominant period.” Resonance Zones: cross-asset harmonic alignment Resonance is where this tool becomes more than a single-chart curiosity. What resonance means here A resonance zone is flagged when at least 3 out of 5 instruments have strong amplitude at the same tested period. Mechanically: For each period i: - Count instruments with amp > 30 - If count >= 3, mark resonance at that period When resonance is detected: A vertical highlight box is drawn behind that period. A ⚡ marker is printed at the top. Interpretation: Multiple assets are expressing a similar cycle length at the same time. This can indicate macro rhythm, shared liquidity timing, or cross-market synchronization. This is especially useful when your instrument set includes: Rates proxy (TLT), commodities (oil, gold), and crypto indices. You can visually spot when markets are “vibrating” together at a shared period. Resonance is not automatically bullish or bearish. It is telling you “cycle length agreement,” which can help with timing models and contextual trade planning. Spectrogram View: frequency over time Spectrum mode is a snapshot. Spectrogram mode adds time evolution. What a spectrogram is A spectrogram is a 2D heatmap where: Rows = different periods (frequency bands). Columns = time history (bars ago → now). Color = amplitude strength. This allows you to see: Which cycles are persistent vs fleeting. When dominant cycle shifts occur (energy moves from one period to another). Cycle regime transitions (short cycles dominating in chop vs longer cycles dominating in trend). How the script builds the spectrogram matrix It maintains a matrix with: NUM_PERIODS rows (8 periods) histBars columns (history length) Each bar: Remove the oldest column. Append the newest amplitude array from chartSpec. So the spectrogram is always a rolling history of the chart symbol’s cycle amplitudes. It does not attempt to store five symbols (too heavy), it focuses on the active chart for time evolution. Heat coloring Amplitude values map to a custom gradient: Low = dark blue Mid = blue/cyan to orange High = yellow This makes dominant energy bands visually obvious. A stable bright band means persistent cycle dominance. Dominant Cycle Oscillator: phase mapped to a 0–100 oscillator The oscillator is derived from the dominant cycle phase (chart symbol): oscRaw = cos(domPhase) oscValue = 50 + 50 * oscRaw (maps -1..1 into 0..100) Interpretation: When cos(phase) ≈ +1, oscillator near 100 (cycle peak zone). When cos(phase) ≈ -1, oscillator near 0 (cycle trough zone). Midline 50 corresponds to the quarter-cycle transition points. It also colors the oscillator by phase direction: oscRising = sin(domPhase) < 0 Rising phase = green-ish Falling phase = red-ish This gives you a clean timing reference: The dominant period tells you the cycle length. The oscillator tells you where you are within that cycle. It is not forecasting price. It is telling you the current phase position of the strongest detected cycle component. Alerts and practical timing usage Alerts are based on the oscillator: Cross above 80: dominant cycle entering peak zone. Cross below 20: dominant cycle entering trough zone. Cross 50: midline cross (phase transition). In practice, you use these as “timing context” alerts, for example: If your trend model is bullish and cycle oscillator enters trough zone, it can hint at a favorable pullback timing window. If you are mean-reversion trading and cycle peak zone aligns with resistance, that confluence matters. Again: cycle timing needs structure confirmation. The oscillator alone is not a trade system. Multi-instrument design and non-repaint behavior The indicator requests five external instruments via request.security. It uses: close with lookahead_on This forces the data to be “previous confirmed close” so the spectral calculations do not repaint intra-bar. That matters because cycle measures can change drastically within a bar if you let them use live values. So: Spectra for external symbols are based on confirmed historical closes. Chart symbol spectrogram and oscillator are also stable in the sense they depend on confirmed series values (dominant phase updates bar-to-bar). Key parameters and how they change behavior Analysis Lookback Affects normalization and the DFT window cap: Higher lookback stabilizes mean/stdev normalization and reduces random shifts. Lower lookback makes the tool more reactive but more prone to regime noise. Because the inner DFT accumulation caps at 100 bars, very high lookback mostly affects normalization rather than the raw projection length. Sensitivity Scales displayed amplitude: Higher sensitivity makes peaks stand out more. Lower sensitivity compresses amplitude. It is a display control, not a physics constant. View Mode Spectrum: cross-asset snapshot comparison, resonance detection. Spectrogram: time evolution of cycle energy for chart symbol. Show Phase Direction Adds ▲/▼ markers derived from sin(phase). Useful for quick cycle position intuition, but do not treat ▲ as “buy.” Show Resonance Zones Marks periods where many instruments share strong energy. Useful for macro rhythm alignment. Highlight Dominant Cycles Labels peaks. If you disable it, the chart becomes cleaner but less informative. Spectrogram History Controls how many columns are stored. Higher makes a longer heatmap but costs more drawing. Limitations and what not to assume This tool is honest DSP applied to market data, but market data is not a stationary sine wave generator. Key limitations: Cycles drift. Dominant period can shift as regime changes. The tool only tests 8 candidate periods. If the true dominant period is 30, it will express as energy near 34 or distributed across neighbors. Normalization helps comparability, but does not make amplitude “absolute truth.” DFT assumes a stable frequency over the window. Markets often violate that. Phase-based oscillators are timing aids, not predictors. This is why the indicator is best used as: Context for entries/exits, not a standalone system. A way to see when cycle energy concentrates or disperses. A way to detect when multiple markets share a timing rhythm. How to use it properly (workflows) 1) Cycle regime identification If short periods (5–13) dominate, market is often choppy, reactive, and mean-reverting. If mid periods (21–55) dominate, market often shows swing structure. If long periods (89–120) dominate, market can be in slower macro drift, trend legs, or compressed volatility regimes. 2) Timing layer for an existing strategy Use your trend model to decide direction. Use dominant cycle oscillator to decide timing within that direction. Use spectrogram to avoid trading when dominant period is unstable or flipping rapidly. 3) Cross-asset confirmation If you see resonance at a period, watch whether your main instrument is also showing strength there. Resonance can justify holding a cycle-based timing thesis with more confidence because it is not isolated. 4) Expectation management If the spectrum is flat (no peaks above threshold), that is information: No clean dominant cycle, randomness dominates. Cycle-based timing will be unreliable. Summary Harmonic Frequency Visualizer uses a targeted Discrete Fourier Transform across predefined cycle periods to measure amplitude and phase of cyclical components in price. It supports multi-instrument spectrum comparison, resonance detection when several markets share strong energy at the same periods, and a spectrogram heatmap for the chart instrument showing how cycle dominance evolves over time. A dominant cycle oscillator maps phase into a 0–100 timing readout with alerts for peak/trough/midline transitions. It is a cycle context engine designed to complement trend, structure, and risk models, not replace them.Pine Script® 인디케이터BackQuant의68
Paradigm Shift: Delivery StateDescription by way of Example using weekly and 4h readings. THIS INDICATOR IS NOT MADE TO OPERATE BELOW A 4H chart. It is looking for Weekly and 4h price delivery that an ICT trader would call messy. Spikes well below OB but which then turn in the logical direction. A series of FVG that are never returned to or themselves are printed over but then turn support or resistance against the run through. So it is designed to indicate the overall level of stress on algorithm delivery. When you see a significantly higher stress level on the 4h trading is still doable but be careful of sloppy delivery. When you see a significant stress level on the weekly then be very very careful on the lower levels and consider staying out for the time being. The state of price delivery can be seen by anyone. But I have incorporated readings of the global bond market and currency correlations as confluent evidence of the reading for the state of price delivery. The term "grinder" is my word for algorithmic delivery. Contrary to ICT I believe that buying and selling pressure are real determinants of market movement up or down. However, I believe that that pressure is pushed through the algo like meat through a meat grinder to ensure a fair and equitable and efficient delivery of that pressure. So price always moves according to algorithmic principles, but those principles are driven by external pressure. The greater the pressure the more the algo stutters and gaps in its effort to smooth out an efficient delivery of price. This Indicator is looking for those stressors. The Weekly State: "Symmetrical" / Stress: 2% * What it means: At the highest level, the "New Paradigm" has not yet broken the system. A 2% stress level is effectively "Background Noise." This indicates that the global bond market and currency correlations are currently holding their historical norms. * The Price Delivery: Because it is Symmetrical, the "Grinder" is in an efficient mode. Weekly expansions are likely being met with orderly retracements. There are no "Ominous" breakaway gaps on the weekly timeframe yet. * The Dalio View: We are still in the "Accumulation" or "Buffering" phase of the cycle. The systemic heart attack is not happening this week. 2. The 4h State: "Saturated" / Stress: 44% * What it means: While the Weekly is calm, the 4h is heating up. A 44% stress level means that local bond volatility (the US10Y proxy) is higher than it has been 44% of the time over the last year. This is a significant "Step-Up" in pressure. * The Price Delivery: Because it is Saturated, the 4h "Grinder" is starting to struggle with the "meat" being fed into it. * The Result: You will likely see "Deep Stop Runs" and "PD Array Overtravel." Price might not just tap an Order Block; it might blast 15 pips through it before reversing. * Delivery is "Unclean": The 4h Fair Value Gaps might only get partially filled, or price might leave "jagged" wicks that make lower-timeframe entries frustrating. 3. How to Trade This Divergence (Practical Logic) When the Higher Timeframe (HTF) is stable (2%) but the Lower Timeframe (LTF) is stressed (44%), it creates a specific environment: * The "Opaque Trap": You might see a perfect ICT Silver Bullet setup on the 15m, but because the 4h is "Saturated," the setup will likely be messier than usual. You should expect "Judas Swings" to be more violent and "FVG Retracements" to be less precise. * Confidence in the HTF: Since the Weekly is at 2%, you can trust the Overall Direction. If the Weekly is bullish, any "Saturated" mess on the 4h is likely just an aggressive re-accumulation rather than a systemic reversal. * The "Stay Out" Warning: You only need to worry when that 4h Stress (44%) begins to "infect" the Weekly. If the Weekly Stress moves from 2% to 20% to 50%, that is your signal that the Paradigm is Shifting and the "Grinder" is about to start teleporting price. Pine Script® 인디케이터BLKMonk의7
Internal vs External Liquidity Zones [Alpha Extract]A sophisticated dual-timeframe market structure visualization system that identifies and maps internal (short-term) and external (long-term) liquidity levels with comprehensive Break of Structure (BOS) and Change of Character (CHoCH) detection across both timeframes. Utilizing pivot-based zone creation with ATR-scaled heights and sweep classification, this indicator delivers institutional-grade liquidity mapping distinguishing between major swing liquidity (external) and minor retracement liquidity (internal) for multi-dimensional market structure analysis. The system's hierarchical structure framework combined with objective arrow projection and state-based zone coloring provides complete smart money concept implementation for advanced order flow trading. 🔶 Understanding Internal vs External Structure External Structure represents major swing points using longer pivot lengths (default 10 bars), identifying significant highs and lows that define the broader market range and trend direction. These are the key levels where large institutional positions likely exist, stop losses cluster, and major trend reversals may occur. External structure breaks (eBOS/eCHoCH) signal significant shifts in market sentiment and often precede sustained directional moves. Internal Structure captures minor swing points within the external range using shorter pivot lengths (default 3 bars), revealing short-term liquidity pools formed during retracements, consolidations, and minor corrections. These represent areas where smaller participants' stops accumulate and where price often reacts before continuing toward external objectives. Internal structure breaks (iBOS/iCHoCH) provide early warning signals and tactical entry opportunities within the broader external trend context. The relationship between internal and external structure creates a hierarchical framework: external zones define the "what" (overall bias and major objectives), while internal zones reveal the "how" (tactical path and entry models). When internal structure breaks bullish while within an external bearish range, it signals potential reversal setup. When internal breaks align with external direction, it confirms trend strength. 🔶 Advanced Dual-Pivot Detection Framework Implements separate pivot calculation systems for external and internal structure with configurable lookback periods optimizing for different swing magnitudes. The system identifies external pivots using extended length capturing major swing extremes, detects internal pivots using compressed length for minor retracement highs/lows, and optionally requires internal pivots occur within current external range boundaries ensuring hierarchical structure coherence. // Dual Structure Detection External_Pivot_High = ta.pivothigh(high, External_Length, External_Length) External_Pivot_Low = ta.pivotlow(low, External_Length, External_Length) Internal_Pivot_High = ta.pivothigh(high, Internal_Length, Internal_Length) Internal_Pivot_Low = ta.pivotlow(low, Internal_Length, Internal_Length) // Optional Range Requirement Valid_Internal = requireInside ? (pivot within ) : true 🔶 BOS and CHoCH Detection System Break of Structure (BOS) occurs when price breaks a recent structure point in the direction of the current trend, confirming trend continuation. The system identifies BOS when: Price breaks above previous high while trend remains bullish (bullish BOS) Price breaks below previous low while trend remains bearish (bearish BOS) Previous structure point hasn't been violated yet Change of Character (CHoCH) signals potential trend reversal when price breaks structure counter to the established trend direction. The system detects CHoCH when: Price breaks above previous high while trend was bearish (bullish CHoCH - reversal signal) Price breaks below previous low while trend was bullish (bearish CHoCH - reversal signal) Both external (e-prefix) and internal (i-prefix) structures generate independent BOS/CHoCH labels, enabling multi-timeframe structure analysis where eCHoCH may signal major reversal while iBOS confirms minor trend within that reversal. 🔶 Intelligent Zone Creation Architecture Features ATR-based or tick-based zone height calculation with separate sizing for internal and external liquidity levels, creating visual boxes centered on pivot points. The system calculates zone dimensions using configurable ATR multiples (default 0.40x) or fixed tick counts, positions zones symmetrically above/below pivot levels, and applies distinct color schemes distinguishing external highs (red), external lows (white), internal highs (cyan), and internal lows (blue). 🔶 Equal High/Low Detection Mode Provides advanced internal zone mode that only creates zones when consecutive internal pivots form equal highs or equal lows within ATR-based tolerance, filtering noise and highlighting significant accumulation/distribution patterns. The system tracks previous internal pivots, compares new pivots against tolerance threshold, creates averaged zone when equality detected, and ignores isolated pivots that don't form patterns, reducing visual clutter while emphasizing institutional liquidity clustering. 🔶 Comprehensive Sweep Classification System Implements three sweep detection modes distinguishing between liquidity grabs and genuine breakouts with state-based zone coloring: Wick Mode: Marks zone as swept when wick touches but close remains outside Close Mode: Requires close through zone for sweep classification Wick+Close Classify Mode: Distinguishes sweeps (S - wick touches, close outside) from breaks (B - close through zone) The system transitions zones through three states: Active (0 - untouched), Swept (1 - liquidity grabbed), Broken (2 - fully breached), applying progressive transparency increases to visually distinguish state changes and enabling traders to identify false breakouts versus genuine structural violations. 🔶 Objective Arrow Projection Framework Features intelligent objective labeling that triggers when internal zones are swept, projecting arrows pointing toward opposite external structure as probable targets. The system generates "->ExtH" labels when internal low swept (suggesting move toward external high) and "->ExtL" labels when internal high swept (suggesting move toward external low), providing smart money concept implementation where internal liquidity grabs often precede runs toward external objectives. 🔶 Dynamic Zone Management System Maintains separate arrays for external and internal zones with configurable history modes and maximum zone limits. The system implements "Latest Only" mode (clears previous external zones of same side when new pivot detected) or "Keep History" mode (preserves all zones up to maximum limit), automatically expires oldest zones when limits reached, and optionally clears all internal zones when new external pivot forms, maintaining clean chart presentation while preserving relevant liquidity context. 🔶 Trend Momentum Scoring Engine Calculates sophisticated trend state using dual-component analysis combining momentum (price change normalized by volatility) with strength (MA separation and slope alignment). The system generates TrendScore objects containing momentum value, strength percentage, direction (-1/0/+1), and confidence score (0-100), uses these scores to classify BOS versus CHoCH by comparing previous and current trend states, and provides objective structural classification beyond simple price level violations. 🔶 Adaptive Zone Extension Logic Implements intelligent right-edge management where active zones extend to current bar but freeze at touch/sweep point when cut-on-touch enabled. The system continuously updates zone right boundaries during active state, locks boundary at bar of first violation, and maintains locked position through subsequent bars, creating visual history of when liquidity was accessed while preventing misleading forward projection of filled zones. 🔶 Multi-State Visual Feedback System Provides comprehensive color and transparency modulation based on zone state with two visual style options. "Soft Fill" mode uses semi-transparent fills with subtle borders, while "Outline" mode displays only colored borders with transparent fills. The system applies progressive transparency increases: Active (light), Swept (medium), Broken (heavy), with independent control over fill and border transparency enabling customization from subtle hints to prominent highlighting. 🔶 Structure Line Visualization Architecture Creates dashed horizontal lines connecting structure break points to current bar with BOS/CHoCH labels positioned at midpoint between break bar and detection bar. The system draws lines at exact structure level, applies color coding matching bullish (green) or bearish (red) classification, and uses compact labels (eBOS, eCHoCH, iBOS, iCHoCH) for instant structural event identification without cluttering chart with excessive text. 🔶 Performance Optimization Framework Utilizes efficient array management with configurable maximum limits (default 120 zones each type), automatic cleanup of oldest elements, and optional hiding of filled zones reducing active object count. The system includes intelligent state tracking minimizing recalculation overhead, optimized sweep detection using simple comparison logic, and streamlined zone update loops processing only active zones for consistent performance across extended sessions. 🔶 Why Choose Internal vs External Liquidity Zones ? This indicator delivers institutional-grade market structure analysis through hierarchical dual-timeframe liquidity mapping with comprehensive BOS/CHoCH detection. The distinction between external (major swing) and internal (minor retracement) structure provides complete smart money concept implementation where external zones define bias and targets while internal zones reveal tactical entries and stop hunts. The system's sweep classification distinguishes liquidity grabs from genuine breakouts, objective arrows project probable targets based on internal sweeps toward external levels, and comprehensive BOS/CHoCH labeling across both timeframes enables multi-dimensional structural analysis. Perfect for order flow traders implementing ICT concepts, liquidity-based strategies, or market maker models in cryptocurrency, forex, and futures markets where understanding the relationship between internal accumulation and external objectives is essential for high-probability trade location and proper risk management.Pine Script® 인디케이터AlphaExtract의562
stelaraX - Chaikin Money FlowstelaraX – Chaikin Money Flow stelaraX – Chaikin Money Flow is a volume-based momentum indicator designed to measure buying and selling pressure over a defined period. By combining price location within the candle and traded volume, it helps identify whether capital is flowing into or out of an asset. This indicator is part of the stelaraX ecosystem, focused on clean technical analysis and AI-supported chart evaluation stelarax.com Core logic The Chaikin Money Flow (CMF) evaluates where the closing price lies within the high–low range and weights this position by volume. The result is averaged over a user-defined lookback period and normalized by total volume. Key principles: * closes near the high contribute positive money flow * closes near the low contribute negative money flow * values above zero indicate net buying pressure * values below zero indicate net selling pressure * higher absolute values reflect stronger conviction Readings beyond typical threshold levels suggest sustained accumulation or distribution rather than short-term noise. Visualization The script plots: * the Chaikin Money Flow as a histogram in a separate indicator pane * green bars when CMF values are positive * red bars when CMF values are negative * a zero reference line for directional context * additional reference levels at +0.05 and −0.05 for pressure strength This layout makes shifts in capital flow and volume-backed momentum easy to interpret. Use case This indicator is intended for: * identifying accumulation and distribution using volume flow * confirming trend direction with volume confirmation * spotting divergences between price and money flow * filtering false breakouts and weak price moves * supporting volume-based and smart money concepts It works particularly well when combined with price structure, trend filters, or AI-assisted chart evaluation. Disclaimer This indicator is provided for educational and technical analysis purposes only and does not constitute financial advice or trading recommendations. All trading decisions and risk management remain the responsibility of the user. Pine Script® 인디케이터stelaraX_official의2
DCR/WCR Indicator with SPY Relative StrengthOverview This indicator displays Daily Close Range (DCR) and Weekly Close Range (WCR) metrics to help traders identify momentum, buying/selling pressure, and relative strength compared to the S&P 500 (SPY). The data is presented in a clean, color-coded table that can be positioned anywhere on your chart. What This Indicator Measures Daily Close Range (DCR) Formula: (Close - Low) / (High - Low) × 100 Purpose: Shows where the current candle closed within its daily range as a percentage (0-100%) Interpretation: 90-100% (Strong Buy): Price closed near the daily high, indicating strong buying pressure and bullish momentum 70-90% (Bullish): Price closed in the upper portion of the range, suggesting buyers are in control 30-70% (Neutral): Price closed near the middle, indicating consolidation or indecision 10-30% (Bearish): Price closed in the lower portion, suggesting sellers are gaining control 0-10% (Strong Sell): Price closed near the daily low, indicating strong selling pressure and bearish momentum Weekly Close Range (WCR) Formula: (Weekly Close - Weekly Low) / (Weekly High - Weekly Low) × 100 Purpose: Analyzes where the stock finished the week relative to the weekly high and low Interpretation: ≥60% (Accumulation): Closing in the top 40% of the weekly range suggests institutional buying and strong support. This often indicates smart money is entering positions 40-60% (Neutral): Middle of the range shows indecision with neither buyers nor sellers in clear control ≤40% (Distribution): Closing in the bottom 60% suggests selling pressure and potential institutional distribution SPY Relative Strength Comparison The indicator calculates the difference between your stock's DCR/WCR and SPY's DCR/WCR to determine relative strength: Much Stronger (+20% or more): Your stock is significantly outperforming the market - exceptional relative strength Stronger (+10% to +20%): Your stock is outperforming the market Similar (-10% to +10%): Your stock is moving in line with the broader market Weaker (-10% to -20%): Your stock is underperforming the market Much Weaker (-20% or less): Your stock is significantly underperforming - consider this a warning sign Trading Use Cases Confirming Breakouts High DCR (>70%) during a breakout confirms strong buying interest High WCR (>60%) suggests institutional support for the move If both are strong while SPY is weak, you've identified exceptional relative strength Identifying Reversals Extremely low DCR (<10%) after a downtrend may signal capitulation Rising DCR while WCR remains strong suggests a bounce is sustainable Divergence between DCR and SPY can highlight emerging leadership Volume Confirmation High WCR (>60%) with strong volume = institutional accumulation (bullish) Low WCR (<40%) with high volume = institutional distribution (bearish) Use in conjunction with volume analysis for best results Market Context Compare your stock's metrics to SPY to understand if momentum is stock-specific or market-wide Stocks showing strength while SPY is weak often become market leaders Stocks showing weakness while SPY is strong should be avoided or exited Customization Options Table Position: Choose from 9 positions to place the table anywhere on your chart (top/middle/bottom × left/center/right) SPY Comparison Toggle: Enable or disable the SPY relative strength comparison rows Best Practices Use Multiple Timeframes: DCR gives you intraday momentum, WCR provides the weekly trend Combine with Volume: High WCR with strong volume is particularly bullish Monitor Divergences: When DCR and WCR diverge, it may signal a change in trend Relative Strength Matters: Focus on stocks showing strength vs SPY for better risk/reward Context is Key: A high DCR in a downtrend may just be a bounce; always consider the bigger picture Color Coding The indicator uses intuitive color coding: Green: Bullish signals (high DCR/WCR, outperformance vs SPY) Yellow: Neutral signals (middle range, similar to SPY) Red: Bearish signals (low DCR/WCR, underperformance vs SPY) Note: This indicator works on all timeframes and asset types. It's particularly useful for swing traders and investors looking to identify momentum and institutional activity. Always use in conjunction with other technical analysis tools and proper risk management.Pine Script® 인디케이터usefulMind2379의118
Central Bank Liquidity Gap IndicatorThis indicator measures the gap between global liquidity growth and stock market growth to identify potential buying opportunities. Liquidity drives markets. When central banks print money, that liquidity eventually flows into stocks and other assets. If we spot when liquidity growth is outpacing market growth, we can spot moments when the market is "due" to catch up. I like this quote: Earnings don't move the overall market; it's the Federal Reserve Board... focus on the central banks and focus on the movement of liquidity." - Stanley Druckenmiller How Central Bank Liquidity Gap Indicator Works The indicator calculates a simple divergence: Divergence = Liquidity Growth % − S&P 500 Growth % Green bars = Liquidity is growing faster than the market (bullish) Red bars = Market is growing faster than liquidity (less bullish) Multi-Country M2 Money Supply Unlike basic M2 indicators, this one lets you combine money supply data from multiple economies, including US, UK, Canada, China, Eurozone, Switzerland and Japan. Each country's M2 is automatically weighted by its actual size (converted to USD). Larger economies have more influence on the global liquidity picture. I've added a discount for China. China's M2 weight is reduced by 50% to account for capital controls that limit how much Chinese liquidity flows into global markets and into the US market. Fed Net Liquidity You can also blend in Fed Net Liquidity for a more precise US liquidity measure: Net Liquidity = Fed Balance Sheet − Treasury General Account − Reverse Repo This captures the actual liquidity the Fed has injected into financial markets, not just the broad money supply. How To Read It The Buy Zone (5%+ Divergence) When the divergence exceeds +5%, the indicator enters the "Buy Zone" (highlighted with green background). This means liquidity is significantly outpacing market growth — historically a good buy signal. The Support Table The info table shows: Component weights: How much each country's M2 contributes Corr w/ SPX: Current correlation between liquidity and SPX (are they moving together?) Leads SPX by X: Does past liquidity predict future SPX moves? (higher = more predictive) Divergence %: Current divergence value Signal Correlation Stats Corr w/ SPX: Measures if liquidity and SPX are moving in sync right now Leads SPX: Measures if liquidity changes predict future SPX moves. A positive value here suggests liquidity is a leading indicator. Potential Use Cases Long-term investing: Wait for 5%+ divergence (buy zone) to accumulate index funds, ETFs, or stocks Leveraged ETFs: Use buy zone signals to time entries into UPRO, TQQQ, SSO (higher risk, higher reward) Crypto: Bitcoin and crypto markets also correlate with global liquidity — use this for BTC accumulation timing Risk management: Avoid adding positions when divergence is deeply negative Important Notes This is a long-term indicator and not for daytrading. It works best used on Daily/Weekly timeframes It identifies accumulation zones and not precise bottoms Truly yours, Henrique Centieiro Inspired by the relationship between M2 money supply and market performance, enhanced with multi-country liquidity tracking and Fed balance sheet analysis. Let me know if you have questions/suggestions. Pine Script® 인디케이터HenriqueCentieiro의4443
XAUUSD ELIRANTo build a professional and accurate description of your strategy, I have distilled the information you shared into a neat "Trading Plan". This strategy combines strict financial discipline with a desire for consistent growth in the Forex market. Here is a suggestion for describing your strategy: The "Safe Profit" Strategy: Capital Management and Growth in the Forex Market The strategy focuses on preserving equity while creating cash flow for withdrawal and leveraging profits to purchase additional trading portfolios. The goal is to reduce personal risk and increase purchasing power in the market. 1. Capital and Withdrawal Goals Starting Capital/Base: $2,250. Periodic Profit Target: $1,000. Withdrawal Policy: Upon reaching the profit target, the $1,000 is immediately withdrawn for "cash out" and reinvestment in additional trading portfolios. 2. Operational Logic (The Workflow) The strategy operates in cycles of accumulation -> withdrawal -> expansion: Accumulation phase: Focus on trading Forex assets with the aim of achieving a return of approximately 44% on the base portfolio. Withdrawal phase: Defining the first $1,000 as net profit that leaves the market to ensure "money in your pocket". Expansion phase: Using part of the profit that is withdrawn to purchase an additional trading portfolio, which allows for increased trading volume without increasing the risk on the original portfolio. 3. Advantages of the strategy Psychological risk management: Knowing that you are withdrawing money "home" reduces mental stress and allows for cleaner decision-making. Smart leverage: Purchasing additional portfolios creates diversification of risks between different accounts. Self-discipline: Pre-defined profit and withdrawal targets prevent the "greed trap" that exists in Forex.Pine Script™ 전략elirancr24의48
CPR OI Toolkit - All in one indicatorThis is experimental indicator which is an extend my pre triple EMA indicator. I have been using this indicator to identify potential entry and exit for commodity market. I had used it for couple of week and it helps. I would like to share with you. It is meant identify and analyze then plan your trade. I have developed this indicator using Google Antigravity , which is an awesome tool for developing trading indicator and strategies. My CPR OI tool kit includes following. Triple EMA Stochastic - for trend catching Previous Low/high base trial and visual indication Price action concepts Reversion logic. Visual indication - buy / sell / setup initialization / exit Visual dashboard. --- ## 🎨 Visual Signal Guide | Marker | Meaning | Action | |--------|---------|--------| | 🔵 Tiny Blue Circle | Stochastic bullish setup START | Wait for EMA + breakout | | 🟢 Green Triangle UP | **LONG ENTRY** - All conditions met | **ENTER LONG** | | 🔴 Red Triangle DOWN | **SHORT ENTRY** | **ENTER SHORT** | | 🟠 Orange Circle | **EXIT** - EMA1/2 cross | **CLOSE POSITION** | | 💧 Aqua "R" | Mean reversion long | Scalp opportunity | | 💜 Fuchsia "R" | Mean reversion short | Scalp opportunity | --- ## 💰 Open Interest Interpretation | Status | Price vs Prev | OI Change | Meaning | |--------|---------------|-----------|---------| | **Long Accumulation**🟢 | ↑ | ↑ | Bulls building positions | | **Short Accumulation**🔴 | ↓ | ↑ | Bears building positions | | **Short Covering**🟡 | ↑ | ↓ | Bears exiting (bullish) | | **Long Unwinding**🟠 | ↓ | ↓ | Bulls exiting (bearish) | --- ## 🔔 Alerts (All Enabled by Default) 1. "LONG Signal | Stochastic confirmed | EMA Bullish" 2. "SHORT Signal | Stochastic confirmed | EMA Bearish" 3. "EMA Alignment: BULLISH/BEARISH" 4. "Position CLOSED - Trailing Stop Hit" --- Pine Script® 인디케이터trade_crush의88716
Volume Divergence Detector - COT EnhancedVolume Divergence Detector – COT Enhanced This advanced indicator analyzes institutional vs retail money flow to uncover hidden market intent, focusing on Gold and Gold Futures. Instead of relying on simple volume spikes, the script separates smart money (institutions, commercial hedgers, large speculators) from retail traders using a blend of: Volume-based accumulation/distribution Price momentum RSI behavior MACD divergence Institutional-sized volume detection Optional real CFTC Commitment of Traders (COT) data The result is a dynamic money-flow model designed to expose who is truly controlling the market. 🔹 Institutional Flow Engine Large-volume activity is tracked and converted into a smoothed institutional money line. Heavy volume is weighted more aggressively to highlight professional accumulation and distribution. When volume fades, flow naturally decays to avoid stale signals. If enabled, weekly CFTC COT data is blended into the calculation (70% internal model, 30% real positioning), providing genuine futures-market confirmation for Gold. Positive values indicate institutional buying. Negative values indicate institutional selling. 🔹 Retail Flow Engine Retail behavior is modeled using: RSI momentum (retail follows trends) MACD breakout behavior Smaller volume spikes Retail flow reacts faster and decays quicker, reflecting emotional trading and late entries. Extreme retail positioning often signals potential reversals. 🔹 Core Signals The indicator automatically detects: Institutional Takeover When institutional flow crosses above retail. Retail Takeover When retail flow crosses above institutions (often a warning sign). Bullish Setup Institutions buying + retail selling. Bearish Setup Institutions selling + retail buying. Extreme Divergence Institutional and retail flows at opposite extremes. These zones often precede major reversals or powerful trend continuations. Clear BUY / SELL labels appear directly on the chart, positioned dynamically using ATR to avoid candle overlap. 🔹 Visual Feedback Background shading shows which side currently dominates Extreme divergence adds special highlighting Real-time labels display institutional and retail values A built-in information table summarizes: Institutional flow Retail flow Dominant side Flow spread Current signal COT status Everything updates live on the last bar. 🔹 Alerts Included Custom alerts are provided for: Institutional control Retail control Bullish setups Bearish setups Extreme divergence Perfect for automation or hands-off monitoring. ⚠️ Important Notes COT data works only on Gold Futures symbols. Spot Gold uses volume-based estimation only. Designed for directional bias and timing, not blind entries. Always confirm with structure and price action. Created by xqweasdzxcv A professional-grade money flow system built to follow smart capital instead of emotional traders.Pine Script® 인디케이터xqweasdzxcv의35
Finger Print.Finger Print. Isolates and Accumulates the "True" components of each candle: - True Upper Wick (buying pressure beyond the body) - True Body (conviction from open to close) - True Lower Wick (selling pressure beyond the body). By measuring each non-overlapping extension (true wicks) and the directional body separately, the indicator reveals building Pressure (wick accumulation) versus actual Conviction (body momentum) over a user-defined sum of bars. Three cumulative lines track these Raw forces, while three Smoothing agents highlight sustained momentum and trend strength. Dual Background Flashes highlight Historical extremes measured as Percentile given the Lookback period. Source any Component / Smoother line from Zero % Line, or Wick-to-Wick / Smoother-to-Smoother Spread – flagging unusually wide/tight conviction gaps or pressure imbalances. The result is a clean, pressure-focused oscillator that separates noise from genuine directional force, helping traders spot Accumulation , Exhaustion , or Hidden Strength before price confirms it.Pine Script® 인디케이터telephonejack의9
ICT Power of 3 identify the high-probability Power of 3 pattern by analyzing price behavior rather than just specific times of day. It focuses on how the market builds, traps, and then expands. 1. Accumulation (The Setup) Logic: The script monitors volatility using the Average True Range (ATR). When volatility drops below its recent average, the script recognizes that orders are being "accumulated." Visual: A Blue Dotted Box appears. This marks the equilibrium zone where buy and sell side liquidity is being engineered above and below the high/low of the range. 2. Manipulation (The Trap) Logic: The script looks for a "Sweep." This is defined as price moving outside the blue accumulation box but failing to sustain that move. In the video, this is the "Judas Swing" or false breakout. Visual: A Red Diamond appears above or below the bar. This signals that the script has detected a liquidity grab—essentially, the market has "tricked" breakout traders into the wrong side of the market. 3. Distribution (The Expansion) Logic: This is identified through Displacement. The script calculates the average candle body size. When a candle appears that is significantly larger (based on your Displacement Multiplier), it confirms that "Smart Money" has entered the market. Visual: A Green Triangle appears. This marks the start of the distribution phase, which is the "meat" of the move where you want to be positioned.Pine Script® 인디케이터day_trade_mind의40
Micha Stocks Buyers Breakout RatingMicha Stocks Buyers Breakout Rating (ByBr) ======================================== This indicator is a custom rating system designed to identify high-probability "Buy" setups by analyzing Volume Conviction, Price Action, and Seller Exhaustion. It assigns a rating from 4 to 10 for every valid signal, helping traders filter out weak breakouts and focus on high-conviction moves. How it Works The script uses a multi-tiered logic system to grade every green candle: 1. Volume Tiers (The Engine) --Extreme Conviction (Rating 10): Volume is 2.5x higher than the short-term average. --High Conviction (Rating 7-8): Volume is 1.5x higher than the short-term average. 2. Sustained Accumulation (Rating 5-6) Identifies persistent buying pressure where the last X -----bars (default 5) have all been green/up candles. --Bonus Points The script awards extra points to the base rating for high-quality candle shapes: --Strong Close: Price closes in the top 25% of the daily range. --Hammer Candle: Long lower wick (rejection of lows) with a small body. 3. Seller Exhaustion (The Reversal - Rating 3-4) This logic identifies "dip buys" where sellers have lost control. It requires: --Downtrend: Price is below the recent high. --Confirmation: Either a "Volume Washout" (recent panic selling) or a "Supply Dry Up" (volume dropping below average). How to Use -------------- Look for Triangles: A triangle appears below the bar when a signal is detected. Read the Number: The number (4-10) indicates the strength of the signal. 10: Extreme Volume Breakout (highest confidence). 7-8: Strong Volume Breakout. 4: Reversal/Dip Buy opportunity (Seller Exhaustion). Tooltip: Hover over the label to see exactly which logic triggered the signal (e.g., "Extreme Conviction" vs "Sustained Accumulation"). Settings ---------- Short Lookback: Adjust the sensitivity of the trend detection (Default: 5). Volume Multipliers: Adjust how strict the volume requirements are for high ratings.Pine Script® 인디케이터edry20의12
BERNA (Boundary-Encoded Resonance Network Architecture)BERNA — Boundary-Encoded Resonance Network Architecture BERNA is a research-grade indicator that estimates the remaining structural capacity of the current market regime. Unlike trend, volatility, or momentum tools, BERNA does not measure price direction — it measures how much of the regime’s internal capacity has already been consumed. This script implements the BERNA model published on Zenodo (Bülent Duman, 2026). It is intentionally minimal and uses only OHLC data. What BERNA measures BERNA outputs a structural capacity state: τ = Σ / Θ (normalized structural stress) Λ = Θ − Σ (remaining structural capacity) Interpretation: High Λ / low τ → the regime has structural endurance Rising τ → capacity is being consumed τ → 1 (Λ → 0) → rupture proximity (capacity exhaustion) This makes BERNA a forward-looking structural capacity variable, not a price oscillator. What is inside this script This implementation contains the following components: Efficiency proxy (DERYA-like, but not the full public DERYA) BERNA uses a simple microstructure efficiency proxy computed as: E = |close − open| / (high − low) This is conceptually “DERYA-like” but it is not the full DERYA framework. No external/public DERYA source code is embedded here. Standard technical primitives used This script uses only basic primitives commonly found in technical analysis: Absolute value and range normalization Thresholding (regime binning) Power transform on range (rng^p) There is no EMA, RSI, MACD, ATR, ADX, Fisher, Kaufman, or other indicator embedded. All computations are internal and deterministic. 3-state structural regime binning (K = 3) The efficiency proxy E is discretized into three regimes using user thresholds: Low efficiency Mid efficiency High efficiency Each regime has its own capacity Θ and stress multiplier β. Structural stress accumulation (Σ) and rupture proximity Stress increment is defined as: dΣ = β · (1 − E) · (range^p) Σ accumulates inside a regime and is capped by Θ. In this prototype, Σ resets on regime change by construction (regime-gated accumulation). The rupture proximity is expressed through τ and Λ. How to use BERNA BERNA is designed as a regime-health and fragility overlay, not a buy/sell trigger. Typical uses: Detect when an ongoing move is structurally late-stage (τ high, Λ low) Avoid initiating trades when capacity is nearly exhausted Compare structural resilience across assets and regimes Use alongside price/trend/volume systems for context Do not use BERNA alone as a trading signal. BERNA tells you “how much structure is left”, not “where price will go.” Visuals Efficiency (E) shows the bar-level microstructure efficiency proxy τ shows normalized structural stress (capacity consumption) Λ shows remaining structural capacity Dotted lines mark warning and critical rupture proximity levels Important notes BERNA is not RSI, MACD, ATR, ADX, Fisher, Kaufman, or a volatility model BERNA does not predict price direction BERNA does not issue entry/exit signals BERNA is a structural capacity diagnostic This script does not embed any external/public indicator code; all logic is implemented directly in Pine. Risk and disclaimer This script is provided for research and analytical purposes only. It is not financial advice and must not be used as a standalone trading system. Markets are uncertain. All trading decisions and risks remain entirely the responsibility of the user. BERNA: Boundary-Encoded Resonance Network Architecture A Structural Failure Theory of Financial Regimes Based on Endogenous Capacity Depletion Author: Duman, Bülent Affiliation: Independent Researcher Reference: zenodo.orgPine Script® 인디케이터blntduman의7
Smart Money Structure | GainzAlgo📊 OVERVIEW: ================ Smart Money Structure Analysis is a professional-grade market structure and order-flow system designed to identify institutional trading behavior through volatility-adaptive logic, multi-timeframe trend alignment, and volume-based confirmation. This indicator implements original mathematical models to detect Change of Character (CHoCH), Break of Structure (BOS), cumulative volume dynamics, and trend convergence across seven timeframes — delivering high-probability trade signals with significantly reduced noise. Unlike basic indicator combinations, this system functions as a unified trading framework, where volatility adaptation, structure analysis, and volume confirmation continuously reinforce each other to provide precise, context-aware signals. ⭐ WHY THIS SYSTEM IS UNIQUE AND WORTHY OF PUBLICATION: ===================================================== This is not a collection of common indicators placed together. Smart Money Structure Analysis represents a cohesive institutional methodology, engineered so that: - Volatility adjusts signal sensitivity in real time - Multi-timeframe trends define directional bias - Market structure determines timing - Volume confirms institutional participation - Advanced filters eliminate low-quality setups Each component is mathematically linked to the others, creating a workflow that cannot be replicated by stacking separate indicators. 🔗 SYNERGISTIC INTEGRATION – HOW THE SYSTEM WORKS TOGETHER: ========================================================== 🧠 1. CONTEXT-AWARE VOLATILITY ADAPTATION ATR-based volatility logic dynamically adjusts all momentum thresholds: - Higher volatility → stronger confirmation required - Lower volatility → sensitivity increases to capture valid moves This prevents over-signaling in choppy markets and under-signaling during expansion phases — a core flaw in static indicators. 📐 2. MULTI-TIMEFRAME TREND CONVERGENCE ENGINE Seven timeframes are analyzed simultaneously: 1M • 5M • 15M • 30M • 1H • 4H • 1D Each timeframe is scored using EMA + VWAP alignment, producing a composite Trend Strength Score from -100 to +100. The stronger the alignment across timeframes, the higher the probability of continuation — instantly visible through the real-time dashboard. 🏗️ 3. INSTITUTIONAL MARKET STRUCTURE (CHoCH & BOS) The system automatically identifies the two core smart money concepts: - CHoCH (Change of Character): Signals potential trend exhaustion or reversal zones - BOS (Break of Structure): Confirms trend continuation and institutional commitment Structure zones are visualized with persistent, color-coded levels and clouds, providing precise contextual timing rather than lagging signals. 📊 4. CUMULATIVE VOLUME DELTA (CVD) CONFIRMATION CVD tracks the cumulative difference between buying and selling pressure: - Rising CVD → accumulation - Falling CVD → distribution - Divergence vs price → early reversal warning Volume participation is categorized into Low / Medium / High, adding depth beyond simple volume bars. 🛡️ 5. SIX-LAYER PROFESSIONAL SIGNAL FILTERING Every signal must pass through up to six independent confirmation layers: 1. Volatility-adjusted momentum 2. Higher timeframe trend alignment 3. Lower timeframe conflict prevention 4. Institutional volume confirmation 5. Structural breakout validation 6. Repeated-signal restriction This dramatically reduces false positives while preserving only high-quality institutional setups. 🧮 DETAILED CORE SYSTEMS: ======================== 📏 ADAPTIVE MOMENTUM FORMULA - Momentum Threshold = Base × (1 + (ATR ÷ Price) × 2) - Pre-Momentum Factor = Base × (1 − (ATR ÷ Price) × 0.5) 📊 TREND STRENGTH CALCULATION - Trend Strength = (Sum of 7 timeframe scores ÷ 7) × 100 📦 CVD LOGIC - Close > Previous Close → Buy volume added - Close < Previous Close → Sell volume subtracted - Cumulative sum reveals institutional intent 🧠 STRUCTURE DETECTION - Pivot-based swing logic - Candle confirmation - Configurable lookback periods - Non-repainting visualization 🧩 ADVANCED ANALYSIS TOOLS: ========================== 🧲 LIQUIDITY ZONE DETECTION Identifies probable retail stop-loss clusters where institutions often initiate stop hunts before true directional moves. 📦 MARKET PROFILE & ORDER FLOW IMBALANCE Detects buy/sell dominance using volume ratios, highlighting accumulation and distribution zones before large price moves. 🔄 RSI DIVERGENCE SCANNER Identifies bullish and bearish divergences that frequently precede structure shifts and trend reversals. 🎨 VISUAL SYSTEM & DASHBOARD: ============================ 📊 SMART MONEY MATRIX - Composite trend strength - System confidence % - CVD value - Directional grid for all timeframes 📈 TREND PREDICTION MATRIX (Optional) Forecasts short-term directional bias using trend, momentum, and volatility data. 🏷️ SIGNAL LABELS - BUY / SELL → Fully confirmed entries - READY → Momentum building - BOS / CHoCH → Structure events - FLOW / LIQ / BULL / BEAR → Advanced confirmations ⚙️ CORE FEATURES: ================ 1. Multi-Timeframe Trend Convergence 2. Smart Money Structure Detection (CHoCH & BOS) 3. Adaptive Volatility-Based Momentum 4. Cumulative Volume Delta (CVD) 5. Six-Layer Signal Filtering 6. Liquidity Zone Detection 7. Order Flow & Market Profile Analysis 8. Divergence Scanner 9. Dynamic Trendlines 10. Institutional-Grade Dashboard 📘 WHO THIS INDICATOR IS FOR: ============================ - Scalpers: Noise-filtered precision on lower timeframes - Day Traders: High-probability continuation setups - Swing Traders: Multi-timeframe alignment & structure zones - Reversal Traders: Divergence + CHoCH confirmation ⚠️ IMPORTANT DISCLAIMER: ======================== This indicator is a technical analysis and educational tool only. It does not provide financial advice or trade recommendations. Trading involves substantial risk, and losses are a natural part of trading. Past performance does not guarantee future results. All trading decisions remain the sole responsibility of the user.Pine Script® 인디케이터GainzAlgo의6363 7 K
ICT Market Regime Detector [TradeHook]🔮 Overview The **ICT Market Regime Detector** is an advanced market condition classifier designed to identify the current market environment and provide context-aware trading guidance. Rather than generating buy/sell signals, this indicator focuses on answering the crucial question: *"What type of market am I trading in right now?"* Understanding market regime is fundamental to successful trading. The same strategy that works brilliantly in a trending market can fail spectacularly during consolidation. This indicator automatically classifies market conditions into one of eight distinct regimes, each requiring different trading approaches. --- 🎯 Regime Classifications The indicator identifies these market states: | Regime | Description | Recommended Approach | |------------------------|--------------------------------------------------|--------------------------------------| | *STRONG TREND* |Directional momen. w/ healthy struc| Cont.entries with OTE pullbacks | | **WEAK TREND** | Gradual drift with retracements | Conservative Order Block entries | | **ACCUMULATION** | Institutional buying within range | Longs near range lows | | **DISTRIBUTION** | Institutional selling within range | Shorts near range highs | | **CONSOLIDATION** | Tight range, low volatility squeeze | Wait for breakout | | **EXPANSION** | Volatile breakout phase | Momentum following | | **REVERSAL** | Structural transition period | Wait for confirmation | | **CHOPPY** | No clear edge | **Avoid trading** | --- ⚙️ How It Works **Trend Analysis Engine** - Calculates ADX (Average Directional Index) using Wilder's smoothing method - Monitors +DI/-DI for directional bias - Detects trend health via EMA alignment - Identifies exhaustion through RSI divergence **Volatility Analysis Engine** - Measures current vs historical volatility ratio - Classifies as LOW, NORMAL, HIGH, or EXTREME - Tracks volatility expansion/contraction phases **Range Analysis Engine** - Calculates dynamic support/resistance boundaries - Tracks price position within range (0-100%) - Detects range narrowing (squeeze) and expansion patterns **Institutional Activity Detection** - Volume spike identification - Absorption candle patterns (large wicks, small body) - Displacement candles (large body, small wicks) - Accumulation/Distribution pattern recognition --- 🛡️ Risk Management Features **Daily Loss Limit** - Set maximum daily loss as percentage of account - Visual warning when approaching limit - Alert when limit is breached **Maximum Daily Trades** - Configurable trade counter per session - Prevents overtrading - Session reset options (NY Open, London Open, etc.) **Trading Readiness Checklist** - Clear regime ✓/✗ - Kill zone active ✓/✗ - HTF alignment ✓/✗ - Volatility normal ✓/✗ - Loss limit OK ✓/✗ - Trades remaining ✓/✗ --- 📊 Multi-Timeframe Analysis The indicator includes 4H timeframe regime alignment to ensure lower timeframe setups align with higher timeframe bias. Trades taken with HTF alignment historically have higher probability. --- ⏰ Kill Zone Integration Built-in ICT Kill Zone detection: - 🌙 Asian Session (Range Building) - 🇬🇧 London Open (Prime Execution) - 🇺🇸 NY AM (Prime Execution) - 🔫 Silver Bullet (10-11 AM EST) - 🇺🇸 NY PM (Afternoon Opportunities) Configurable UTC offset for your timezone. --- 🎨 Visual Features - **Regime-Colored Bars** - Instantly see current market state - **Comprehensive Dashboard** - All metrics in one panel - **Adjustable Table Size** - Tiny/Small/Normal/Large - **Flexible Positioning** - Place dashboard in any corner - **Optional Regime Labels** - Mark regime changes on chart --- ⚠️ Important Notes 1. This indicator is a **decision support tool**, not a signal generator 2. Always combine with proper price action analysis 3. Past regime identification doesn't guarantee future performance 4. Risk management settings are for tracking purposes only - actual position management should be done through your broker 5. The indicator works best on liquid markets with consistent volume data --- 📚 Educational Purpose This indicator is designed for educational purposes to help traders understand market structure and regime classification. It implements concepts from ICT (Inner Circle Trader) methodology including: - Market structure analysis - Kill zone timing - Institutional activity patterns - Multi-timeframe confluence --- 🔧 Inputs Summary **Master Toggles** - Enable/Disable indicator, regime detection, recommendations, risk management, alerts **Core Settings** - Analysis lookback periods (short/medium/long) - ADX thresholds for trend classification - Volatility spike multiplier **Risk Management** - Max daily loss percentage - Max daily trades - Account size for P&L calculation - Session reset timing **Visualization** - Dashboard on/off and position - Regime zones and labels - Bar coloring - Table text size --- 💡 Tips for Use 1. **Don't trade CHOPPY regimes** - The indicator explicitly warns when no edge exists 2. **Respect the checklist** - Trade only when multiple conditions align 3. **Adjust ADX thresholds** - Different instruments may require fine-tuning 4. **Monitor regime duration** - Fresh regime changes often present the best opportunities 5. **Use with other TradeHook indicators** - Designed to complement the MTMGBS system ⚖️ DISCLAIMER This indicator is for **educational and informational purposes only**. It does not constitute financial advice. Trading involves substantial risk of loss and is not suitable for all investors. Past performance is not indicative of future results. Always conduct your own analysis and consult with a qualified financial advisor before making trading decisions. Pine Script® 인디케이터Making_Trades_Matter의업데이트됨 11100
ETH - Log Regression BandsETH – Log Regression Bands: Detailed Description (Math + How to Use) Overview This indicator plots a long-term “fair value” growth curve for ETH and surrounds it with multiple upper and lower bands. The goal is to estimate where price sits relative to a long-term trend that is best interpreted in **logarithmic (percentage) terms**, not raw dollars. The bands create clear zones showing when ETH is historically cheap or expensive relative to that long-term curve. --- Why use logarithms? Price action is typically more meaningful in **percentage moves** than in absolute dollar moves. * A move from $100 → $200 is +100% * A move from $2000 → $2100 is only +5% By modelling the natural logarithm of price, multiplicative growth becomes additive. That makes long-term growth easier to model and band spacing more consistent across very different price regimes. So instead of modelling (P), the indicator models: --- The growth model: Power-law curve The indicator uses “time since inception” as the x-axis. However, rather than using time directly, it uses the logarithm of time: where (t) is the number of days (or bars) since the first data point. It then fits a straight-line model in log-log space: Substituting back in: Exponentiating both sides gives the curve in normal price units: This is a **power-law** trend curve. It naturally produces a smooth, slowly bending long-term curve similar to the “log regression” curves often seen in macro crypto reports. --- What “expanding regression” means The model uses all data available from the beginning of the chart up to the current bar. That means: * Early in the asset’s history the curve can change more because there are fewer points. * Over time the curve becomes more stable as more history is included. Important note: this does **not** repaint past bars. It simply means the current curve will update as new data comes in. --- Measuring “typical deviation” from the curve (residual volatility) Once the trend curve is fitted in log space, the indicator measures how far price typically wanders away from it. At any time point: * Actual log price is (y = \ln(P)) * Predicted log price from the curve is (\hat{y} = a + b\ln(t)) The **residual** is: The indicator computes the standard deviation of these residuals: This (\sigma) is a measure of typical “distance from trend” in log terms. --- Building the bands (the key idea) The bands are evenly spaced in **log space** using multiples of (\sigma). A band number (k) is created by shifting the log-trend up or down: Upper band (k): Lower band (k): Where: * (k) is the band number (1, 2, 3, …) * (s) is a user-chosen spacing factor (band spacing) * (\sigma) is the residual standard deviation Converting back to normal price: Upper band (k): Lower band (k): Why bands look like “translated copies” Because shifting by a constant in log space equals multiplying by a constant in price space: So the bands are the same underlying curve scaled up or down by fixed multipliers. That produces the smooth “stacked curve” look associated with macro log regression charts. --- Optional curve shift (manual adjustment) A manual offset can be applied in log space. This is useful if you want to align the entire structure slightly higher or lower. Because the shift is applied to (\ln(P)), this is not an additive dollar adjustment. It scales the entire curve by a constant factor: * Positive shift → multiplies all bands upward * Negative shift → multiplies all bands downward --- How to interpret the zones The base curve represents a long-term “trend center” in log-growth terms. * Price near the base curve → near long-term trend * Price in upper bands → expensive relative to long-term trend * Price in lower bands → cheap relative to long-term trend Because the bands are built using residual volatility in log space, “cheap/expensive” is measured in a way that remains meaningful across different eras and price levels. --- Long-term buy zones (Lower 1 and Lower 2) **Lower 1** and **Lower 2** are intended as **long-term accumulation zones**. When ETH trades in these zones, it is significantly below the long-term growth curve in log terms, which typically corresponds to: * deep bear markets, * high fear / capitulation phases, * long accumulation periods. A simple long-term framework many users apply: * **Accumulate gradually when price enters Lower 1** * **Accumulate more aggressively when price enters Lower 2** * Reduce risk / take profits progressively in higher upper bands These are not guarantees — they are **statistical “distance from trend” zones**, designed to help structure long-term decisions. --- ## Notes / limitations * This indicator is a **macro trend tool**, not an intraday trading system. * The curve is derived from historical behavior; it can shift slowly as new data arrives. * Extremely new market regimes or structural changes can reduce reliability. * Use alongside risk management and additional confirmation if trading. --- Pine Script® 인디케이터Giovanni_Ambrosio의10
CVD Complete Volume Analysis ProCVD Complete Volume Analysis Pro | Order Flow & Absorption Introduction: In the world of modern trading, Price is the advertisement, but Volume is the fuel. However, standard volume indicators on TradingView are often insufficient. They tell you how much was traded, but they don’t tell you how it was traded. Was that large volume spike aggressive buying driving the trend? or was it a "buying frenzy" hitting a wall of passive limit orders (absorption)? The CVD Complete Volume Analysis Pro (v5) is an advanced institutional-grade Order Flow engine. By utilizing 1-second intrabar data, this indicator reconstructs the "Tick Rule" to separate Aggressive (Market) orders from Passive (Limit) orders. It calculates Cumulative Volume Delta (CVD), detects Absorption/Distribution anomalies, and utilizes an embedded Logistic Regression model to predict daily directional bias. This is not just an indicator; it is a complete Order Flow Dashboard designed to aid and support complex footprint charts for the everyday trader. 🏗️ How It Works: The "Micro-Structure" Engine Most volume indicators on TradingView look at the close of a 1-minute or 5-minute bar to guess the volume direction. This script goes deeper. 1. The 1-Second Granularity Using TradingView's request.security_lower_tf capability, this script pulls 1-second resolution data regardless of the chart timeframe you are on. It analyzes the price movement every second. It applies the "Tick Rule": If price moves up, volume is classified as Buy. If price moves down, volume is classified as Sell. This allows for a highly accurate reconstruction of Buying vs. Selling pressure that standard indicators miss. 2. The "Cluster" Concept The script aggregates these 1-second data points into Clusters. Default: 60 seconds (1 minute) per cluster. This creates a normalized "Heartbeat" of the market, allowing us to compare the efficiency of volume over fixed time windows, removing the noise of time-based chart distortions. 3. The "Passive" Detection Logic (The Core Feature) This is the most powerful aspect of the tool. It calculates the relationship between Effort (CVD) and Result (Price Move). The Baseline: The script calculates a rolling statistical baseline (Standard Deviation) of how much price should move for a given amount of Delta. Absorption (Hidden Buying): If we see massive Aggressive Selling (Negative CVD) but price refuses to drop (or drops significantly less than the statistical model predicts), the script identifies this as Passive Buying. Distribution (Hidden Selling): If we see massive Aggressive Buying (Positive CVD) but price refuses to rise, the script identifies this as Passive Selling. 📊 The Dashboard Breakdown The on-screen dashboard is your command center. It updates in real-time to provide a snapshot of the market's internal mechanics. Section 1: Flow Analysis This section analyzes the current session's behavior. Flow Type: Categorizes the market state using algorithmic logic. Aggressive Buying/Selling: The market is trending, and aggressive participants are winning. Strong Accumulation/Distribution: A reversal signal. Aggressive participants are trapped, and passive whales are absorbing order flow. Flow vs. Price: Detects divergences instantly. Bullish Divergence: Net Flow is Positive, but Price is down (indicates manipulation or temporary suppression). Bearish Divergence: Net Flow is Negative, but Price is up (indicates a "trap" move). Section 2: Volume Breakdown A detailed ledger of the day's activity. Aggressive Buy/Sell: Market orders executing at the ask/bid. This represents "Impatience." Passive Buy/Sell: The estimated volume of Limit Orders absorbing the aggressive flow. This represents "Intent." Net Flow: The mathematical sum of all buy pressure minus sell pressure. Section 3: Net Positioning (Multi-Day) Markets don't happen in a vacuum. This section looks back (default 5 days) to see the accumulated inventory. Bias: Are we in a multi-day accumulation or distribution phase? Activity Type: High Hidden Activity: Indicates a fighting market with heavy limit orders (choppy/reversal prone). Mostly Aggressive: Indicates a trending market with low resistance. Section 4: Predictive Model (Machine Learning) The script features an embedded Logistic Regression Model. It trains on the last N days of Flow Data (CVD, Net Aggressive, Net Passive, Passive Ratios). It outputs a Probability Score (0% to 100%) regarding the likelihood of an UP close for the current session. Note: This is a probability model based on order flow history, not a guarantee. Use it as a bias confirmation tool. 🧠 Educational: How to Trade With This Strategy 1: The "Absorption" Reversal Context: Price hits a major resistance level. Look at the Dashboard: You want to see "Flow Type" switch to "Strong Distribution". The Logic: Price is rising, and aggressive buyers are hitting the ask. However, the script detects that for every buy order, a passive seller is absorbing it. Price stops moving up despite high volume. The Trigger: When Price creates a lower low on the chart while the dashboard shows Distribution, this is a high-probability short entry. Strategy 2: The Flow Divergence Context: Price is trending down. Look at the Dashboard: Price is making new lows, but the "Net Flow" is turning Green (Positive), or the "Cum CVD" is sloping upwards. The Logic: This is "Effort vs. Result." Sellers are exhausted. They are pushing price down, but the net flow is shifting to buyers. The Trigger: Enter Long on the first structure break. Strategy 3: Trend Continuation Context: Market is opening or breaking a range. Look at the Dashboard: You want "Full Alignment." Signals: "Flow Type" says Aggressive Buying, Net Flow is Positive, and the Predictive Model shows >60% Bullish Probability. The Logic: There is no passive resistance. Aggressive buyers are pushing price up freely. The Trigger: Buy pullbacks. ⚙️ Settings & Configuration Cluster Size: The number of 1-second bars to group together. Use 60 (1 min) for Scalping. Use 300 (5 min) for Day Trading. Average Length: The baseline for statistical calculations. Higher numbers = smoother baselines but slower adaptation. Detection Settings: Passive Multiplier: Adjusts the sensitivity of the absorption estimation. 1.0 is standard. Increase to 1.5 if you only want to see extreme anomalies. Daily Tracking: History Days: How many days of data to display in the table. Note: Due to TradingView data limits, keeping this between 3-5 days ensures the most stability. ⚠️ Important Technical Limitations Please read this section carefully to understand the constraints of the Pine Script environment: Data Depth (The 100k Limit): TradingView limits request.security_lower_tf to approximately 100,000 intrabars. This means the script can typically only "see" the last 3 to 5 days of true 1-second data. If you set History Days or Training Days too high (e.g., 20 days), the script may return 0 values for older dates because the high-resolution data simply doesn't exist on the server. Approximation of Ticks: While 1-second data is extremely precise, it is still an aggregation. In extremely high-volatility events (like CPI releases), multiple ticks happen inside one second. The script attributes the volume of that second based on the close relative to the open/prev close. It is the best approximation possible on TradingView, but not a replacement for Level 3 Tick Data feeds. Calculation Time: This is a heavy script. On lower-end devices or when loading on many charts simultaneously, you may experience a "Calculation took too long" warning. If this happens, reduce the History Days to 3. 🛡️ Disclaimer No Repainting: This indicator uses strict historical referencing and does not repaint closed clusters. Not Financial Advice: This tool provides data visualization. Order flow is a subjective art. Always manage your risk. Author's Note: I built this tool because I wanted the power of Order Flow footprint charts without the visual clutter. By using statistical baselines to detect passive liquidity, we can finally see the "invisible hand" of the market directly on our TradingView charts. I hope this adds value to your trading. 👍 If you find this script useful, please leave a Boost and a Comment below!Pine Script® 인디케이터jaydesaigu의1313 1.4 K
Multi Cycles Slope-Fit System MLMulti Cycles Predictive System : A Slope-Adaptive Ensemble Executive Summary: The MCPS-Slope (Multi Cycles Slope-Fit System) represents a paradigm shift from static technical analysis to adaptive, probabilistic market modeling. Unlike traditional indicators that rely on a single algorithm with fixed settings, this system deploys a "Mixture of Experts" (MoE) ensemble comprising 13 distinct cycle and trend algorithms. Using a Gradient-Based Memory (GBM) learning engine, the system dynamically solves the "Cycle Mode" problem by real-time weighting. It aggressively curve-fits the Slope of component cycles to the Slope of the price action, rewarding algorithms that successfully predict direction while suppressing those that fail. This is a non-repainting, adaptive oscillator designed to identify market regimes, pinpoint high-probability reversals via OB/OS logic, and visualize the aggregate consensus of advanced signal processing mathematics. 1. The Core Philosophy: Why "Slope" Matters: In technical analysis, most traders focus on Levels (Price is above X) or Values (RSI is at 70). However, the primary driver of price action is Momentum, which is mathematically defined as the Rate of Change, or the Slope. This script introduces a novel approach: Slope Fitting. Instead of asking "Is the cycle high or low?", this system asks: "Is the trajectory (Slope) of this cycle matching the trajectory of the price?" The Dual-Functionality of the Normalized Oscillator The final output is a normalized oscillator bounded between -1.0 and +1.0. This structure serves two critical functions simultaneously: Directional Bias (The Slope): When the Combined Cycle line is rising (Positive Slope), the aggregate consensus of the 13 algorithms suggests bullish momentum. When falling (Negative Slope), it suggests bearish momentum. The script measures how well these slopes correlate with price action over a rolling lookback window to assign confidence weights. Overbought / Oversold (OB/OS) Identification: Because the output is mathematically clipped and normalized: Approaching +1.0 (Overbought): Indicates that the top-weighted algorithms have reached their theoretical maximum amplitude. This is a statistical extreme, often preceding a mean reversion or trend exhaustion. Approaching -1.0 (Oversold): Indicates the aggregate cycle has reached maximum bearish extension, signaling a potential accumulation zone. Zero Line (0.0): The equilibrium point. A cross of the Zero Line is the most traditional signal of a trend shift. 2. The "Mixture of Experts" (MoE) Architecture: Markets are dynamic. Sometimes they trend (Trend Following works), sometimes they chop (Mean Reversion works), and sometimes they cycle cleanly (Signal Processing works). No single indicator works in all regimes. This system solves that problem by running 13 Algorithms simultaneously and voting on the outcome. The 13 "Experts" Inside the Code: All algorithms have been engineered to be Non-Repainting. Ehlers Bandpass Filter: Extracts cycle components within a specific frequency bandwidth. Schaff Trend Cycle: A double-smoothed stochastic of the MACD, excellent for cycle turning points. Fisher Transform: Normalizes prices into a Gaussian distribution to pinpoint turning points. Zero-Lag EMA (ZLEMA): Reduces lag to track price changes faster than standard MAs. Coppock Curve: A momentum indicator originally designed for long-term market bottoms. Detrended Price Oscillator (DPO): Removes trend to isolate short-term cycles. MESA Adaptive (Sine Wave): Uses Phase accumulation to detect cycle turns. Goertzel Algorithm: Uses Digital Signal Processing (DSP) to detect the magnitude of specific frequencies. Hilbert Transform: Measures the instantaneous position of the cycle. Autocorrelation: measures the correlation of the current price series with a lagged version of itself. SSA (Simplified): Singular Spectrum Analysis approximation (Lag-compensated, non-repainting). Wavelet (Simplified): Decomposes price into approximation and detail coefficients. EMD (Simplified): Empirical Mode Decomposition approximation using envelope theory. 3. The Adaptive "GBM" Learning Engine This is the "Machine Learning" component of the script. It does not use pre-trained weights; it learns live on your chart. How it works: Fitting Window: On every bar, the system looks back 20 days (configurable). Slope Correlation: It calculates the correlation between the Slope of each of the 13 algorithms and the Slope of the Price. Directional Bonus: It checks if the algorithm is pointing in the same direction as the price. Weight Optimization: Algorithms that match the price direction and correlation receive a higher "Fit Score." Algorithms that diverge from price action are penalized. A "Softmax" style temperature function and memory decay allow the weights to shift smoothly but aggressively. The Result: If the market enters a clean sine-wave cycle, the Ehlers and Goertzel weights will spike. If the market explodes into a linear trend, ZLEMA and Schaff will take over, suppressing the cycle indicators that would otherwise call for a premature top. 4. How to Read the Interface: The visual interface is designed for maximum information density without clutter. The Dashboard (Bottom Left - GBM Stats) Combined Fit: A percentage score (0-100%). High values (>70%) mean the system is "Locked In" and tracking price accurately. Low values suggest market chaos/noise. Entropy: A measure of disorder. High entropy means the algorithms disagree (Neutral/Chop). Low entropy means the algorithms are unanimous (Strong Trend). Top 1 / Top 3 Weight: Shows how concentrated the decision is. If Top 1 Weight is 50%, one algorithm is dominating the decision. The Matrix (Bottom Right - Weight Table) This table lifts the hood on the engine. Fit Score: How well this specific algo is performing right now. Corr/Dir: Raw correlation and Direction Match stats. Weight: The actual percentage influence this algorithm has on the final line. Cycle: The current value of that specific algorithm. Regime: Identifies if the consensus is Bullish, Bearish, or Neutral. The Chart Overlay The Line: The Gradient-Colored line is the Weighted Ensemble Prediction. Green: Bullish Slope. Red: Bearish Slope. Triangles: Zero-Cross signals (Bullish/Bearish). "STRONG" Labels: Appears when the cycle sustains a value above +0.5 or below -0.5, indicating strong momentum. Background Color: Changes subtly to reflect the aggregate Regime (Strong Up, Bullish, Neutral, Bearish, Strong Down). 5. Trading Strategies: A. The Slope Reversal (OB/OS Fade) Concept: Catching tops and bottoms using the -1/+1 normalization. Signal: Wait for the Combined Cycle to reach extreme values (>0.8 or <-0.8). Trigger: The entry is taken not when it hits the level, but when the Slope flips. Short: Cycle hits +0.9, color turns from Green to Red (Slope becomes negative). Long: Cycle hits -0.9, color turns from Red to Green (Slope becomes positive). B. The Zero-Line Trend Join Concept: Joining an established trend after a correction. Signal: Price is trending, but the Cycle pulls back to the Zero line. Trigger: A "Triangle" signal appears as the cycle crosses Zero in the direction of the higher timeframe trend. C. Divergence Analysis Concept: Using the "Fit Score" to identify weak moves. Signal: Price makes a Higher High, but the Combined Cycle makes a Lower High. Confirmation: Check the GBM Stats table. If "Combined Fit" is dropping while price is rising, the trend is decoupling from the cycle logic. This is a high-probability reversal warning. 6. Technical Configuration: Fitting Window (Default: 20): The number of bars the ML engine looks back to judge algorithm performance. Lower (10-15) for scalping/quick adaptation. Higher (30-50) for swing trading and stability. GBM Learning Rate (Default: 0.25): Controls how fast weights change. High (>0.3): The system reacts instantly to new behaviors but may be "jumpy." Low (<0.15): The system is very smooth but may lag in regime changes. Max Single Weight (Default: 0.55): Prevents one single algorithm from completely hijacking the system, ensuring an ensemble effect remains. Slope Lookback: The period over which the slope (velocity) is calculated. 7. Disclaimer & Notes: Repainting: This indicator utilizes closed bar data for calculations and employs non-repainting approximations of SSA, EMD, and Wavelets. It does not repaint historical signals. Calculations: The "ML" label refers to the adaptive weighting algorithm (Gradient-based optimization), not a neural network black box. Risk: No indicator guarantees future performance. The "Fit Score" is a backward-looking metric of recent performance; market regimes can shift instantly. Always use proper risk management. Author's Note The MCPS-Slope was built to solve the frustration of "indicator shopping." Instead of switching between an RSI, a MACD, and a Stochastic depending on the day, this system mathematically determines which one is working best right now and presents you with a single, synthesized data stream. If you find this tool useful, please leave a Boost and a Comment below! Pine Script® 인디케이터jaydesaigu의39
Market Regime Guard PRO Institutional No-Trade ZonesThis dashboard automatically blocks trading on structurally dangerous market days caused by volatility compression, inside-day accumulation, rising VIX liquidation risk, EMA breakdowns, and thin liquidity traps. Most traders lose not because their entries are bad — but because they trade on structurally dangerous market days. This dashboard automatically blocks trading on contraction, liquidation-risk, inside-day, and volatility-trap days. Then list what it detects: • Inside Days (institutional absorption) • NR7 contraction traps • ATR volatility compression • EMA structure breakdown • Rising VIX liquidation risk • News & holiday liquidity traps Promise: Only trade when the market structure is favorable. Use this as your universal go/no-go trading permission system. If it’s GREEN → Trade. If it’s RED → Stand Aside or Be careful Works on: SPY, QQQ, TQQQ, NVDA, PLTR, TSLA, BTC, ES, NQ, Forex & Crypto. 🧭 How to Use the Market Regime Table This table is your go / no-go permission system. Start by checking it on SPY and QQQ — these represent the overall U.S. market and the Nasdaq growth complex. • If SPY and QQQ are GREEN → market structure is favorable • If either is RED → stand aside or reduce risk Once the market is GREEN, you can then apply the same table to individual stocks (NVDA, PLTR, TSLA, AMD, etc.) to confirm that the stock’s structure is also favorable before taking any trades. Rule of thumb: Market first. Stock second. Only trade when both are GREEN. This one rule alone dramatically improves win rate, drawdown, and consistency. FULL DESCRIPTION Most traders don’t lose because their entries are bad — They lose because they trade on structurally dangerous market days. On these days: • Institutions absorb liquidity • Volatility contracts • Fake breakouts dominate • Stop hunts explode • Real expansion does not occur This indicator automatically identifies and blocks: • Inside-day accumulation traps • NR7 contraction traps • Falling ATR volatility compression • EMA structure breakdowns • Rising VIX liquidation risk • Thin liquidity / holiday risk • News-day volatility traps It gives you a clear desk-style verdict: Status Meaning 🟢 GREEN Market structure favorable – trade normally 🔴 RED Structural danger – stand aside This is not an entry system. This is your permission system. 🛠 HOW TO USE Add indicator to your chart Check table in top-right Trade only on GREEN days Avoid RED days completely 📈 Personal Note This regime filter has been instrumental in my own trading journey. After struggling during my first few years in the market, I realized that the biggest losses didn’t come from bad strategies — they came from trading on the wrong days. Learning to stand aside on structurally dangerous market days and only trade when conditions are favorable dramatically improved my consistency and overall returns. 🧠 Why Market Regime Matters Even More for Day Traders Most day-trader losses do not come from bad entries. They come from: • Choppy inside-day conditions • Liquidity absorption • Falling volatility (no follow-through) • Stop-hunt behavior • News / thin liquidity traps Your filter directly blocks every one of these traps. So for day traders, this tool: • Prevents revenge trading • Stops death-by-a-thousand-cuts days • Filters out random chop days • Protects capital on slow days • Preserves psychological capital 📈 Why It Also Improves Swing Trading For swing traders, this tool: • Avoids entering during contraction • Avoids entering before expansions • Avoids bear-regime traps • Improves follow-through probability • Reduces drawdown • Improves R-multiple expectancy Which means: Fewer trades Higher quality trades More profit per trade The Universal Truth The market does not pay you for activity. It pays you for selectivity. This filter improves timing, not tactics. Your entries can be identical — your results improve simply because you’re trading on the right days. ⚠️ Disclaimer This indicator is provided for educational and informational purposes only and does not constitute financial, investment, or trading advice. Trading stocks, options, futures, forex, and cryptocurrencies involves substantial risk and may result in the loss of some or all of your invested capital. Past performance is not indicative of future results. This tool does not guarantee profits and should be used as a market structure filter and risk-management aid only. Always perform your own analysis, use proper position sizing, and consult a licensed financial professional before making any trading decisions. You are solely responsible for all trades taken using this indicator.Pine Script® 인디케이터TrendRiderPro의14