Kira EMA9 EMA21 VWAP ZONES//@version=5
indicator("Kira EMA9 EMA21 VWAP ZONES", overlay=true)
// === EMAs ===
ema9 = ta.ema(close, 9)
ema21 = ta.ema(close, 21)
// === VWAP ===
vwapLine = ta.vwap(hlc3)
// === CONDITIONS ===
isBuy = ema9 > ema21 and close > vwapLine
isSell = ema9 < ema21 and close < vwapLine
noTrade = not isBuy and not isSell
// === PLOTS ===
plot(ema9, color=color.green, linewidth=2)
plot(ema21, color=color.red, linewidth=2)
plot(vwapLine, color=color.blue, linewidth=2)
// === BACKGROUND ZONES ===
bgcolor(isBuy ? color.new(color.green, 85) :
isSell ? color.new(color.red, 85) :
color.new(color.gray, 85))
// === BUY / SELL ARROWS EVERY BAR ===
plotshape(isBuy, title="BUY", style=shape.triangleup,
location=location.belowbar,
color=color.green, size=size.tiny)
plotshape(isSell, title="SELL", style=shape.triangledown,
location=location.abovebar,
color=color.red, size=size.tiny)
// === ALERTS ===
alertcondition(isBuy, title="BUY ZONE ACTIVE",
message="BUY zone active on {{ticker}}")
alertcondition(isSell, title="SELL ZONE ACTIVE",
message="SELL zone active on {{ticker}}")
스크립트에서 "VWAP"에 대해 찾기

FlowFusion Money Flow — FP + VWAP Drift + PVT (−100..+100)Title (ASCII only)
FlowFusion Money Flow — Flow Pressure + Rolling VWAP Drift + PVT (Normalized −100..+100)
Short Description
Original money-flow oscillator combining Flow Pressure, Rolling VWAP Drift, and PVT Momentum into one normalized score (−100..+100) with a signal line, thresholds, optional component plots, and ready-made alerts.
Full Description (meets “originality & usefulness”)
What’s original
FlowFusion Money Flow is not a generic mashup. It builds a single score from three complementary, volume-aware components that target different facets of order flow:
Flow Pressure (FP) — In-bar directional drive scaled by relative volume.
Drive
=
close
−
open
max
(
high
−
low
,
tick
)
∈
=
max(high−low, tick)
close−open
∈ .
Relative Volume
=
volume
average volume over
𝑓
𝑝
𝐿
𝑒
𝑛
=
average volume over fpLen
volume
.
𝐹
𝑃
𝑟
𝑎
𝑤
=
Drive
×
RelVol
FP
raw
=Drive×RelVol then squashed (softsign) to
.
Why it belongs: distinguishes real pushes (big body and big volume) from noise.
Rolling VWAP Drift — Direction of VWAP itself over a rolling window, normalized by ATR.
𝑉
𝑊
𝐴
𝑃
𝑡
=
∑
(
𝑇
𝑃
×
𝑉
𝑜
𝑙
)
∑
𝑉
𝑜
𝑙
VWAP
t
=
∑Vol
∑(TP×Vol)
over vwapLen.
Drift
=
𝑉
𝑊
𝐴
𝑃
𝑡
−
𝑉
𝑊
𝐴
𝑃
𝑡
−
1
𝐴
𝑇
𝑅
=
ATR
VWAP
t
−VWAP
t−1
→ squashed to
.
Why it belongs: persistent VWAP movement signals sustained accumulation/distribution.
PVT Momentum — Price-Volume Trend standardized (z-score) and squashed.
𝑃
𝑉
𝑇
𝑡
=
𝑃
𝑉
𝑇
𝑡
−
1
+
𝑉
𝑜
𝑙
×
Δ
𝐶
𝑙
𝑜
𝑠
𝑒
𝐶
𝑙
𝑜
𝑠
𝑒
𝑡
−
1
PVT
t
=PVT
t−1
+Vol×
Close
t−1
ΔClose
.
𝑧
=
𝑃
𝑉
𝑇
−
SMA
(
𝑃
𝑉
𝑇
)
StDev
(
𝑃
𝑉
𝑇
)
z=
StDev(PVT)
PVT−SMA(PVT)
→ squashed to
.
Why it belongs: captures volume-weighted trend pressure without relying on price alone.
Composite score:
Score
=
𝑤
𝐹
𝑃
⋅
𝐹
𝑃
+
𝑤
𝑉
𝑊
𝐴
𝑃
⋅
𝑉
𝑊
𝐴
𝑃
_
𝐷
𝑟
𝑖
𝑓
𝑡
+
𝑤
𝑃
𝑉
𝑇
⋅
𝑃
𝑉
𝑇
_
𝑀
𝑜
𝑚
𝑤
𝐹
𝑃
+
𝑤
𝑉
𝑊
𝐴
𝑃
+
𝑤
𝑃
𝑉
𝑇
Score=
w
FP
+w
VWAP
+w
PVT
w
FP
⋅FP+w
VWAP
⋅VWAP_Drift+w
PVT
⋅PVT_Mom
with a Signal = SMA(Score, sigLen). Thresholds mark strong accumulation/distribution zones.
How it works (step-by-step)
Compute FP, VWAP Drift, PVT Momentum.
Normalize each to the same
scale.
Weighted average → FlowFusion Score.
Smooth with a Signal line to reduce whipsaw.
Optional background shading when Score exceeds thresholds.
How to use
Direction filter:
Score > 0 favors longs; Score < 0 favors shorts.
Momentum turns:
Score crosses above Signal → setup for long; below → setup for short.
Strength zones:
Above Upper Threshold (default +40) = strong buy pressure; below Lower (−40) = strong sell pressure.
Confluence:
Best near S/R, trendlines, or HTF bias. For scalping on 1–5m, consider sigLen 9–13 and thresholds ±40 to ±50.
Alerts included: zero cross, zone entries, and Score/Signal crossovers.
Inputs (key)
fpLen (20): relative-volume lookback for Flow Pressure.
vwapLen (34): rolling VWAP window.
pvtLen (50): PVT z-score window.
sigLen (9): Signal smoothing.
Weights: wFP, wVWAP, wPVT to bias the blend.
Thresholds: upperBand / lowerBand (defaults +40/−40).
Display: toggle component plots and background shading.
Best practices
Trending markets: increase wVWAP (VWAP Drift) or widen thresholds.
Ranging markets: increase wFP and wPVT; take quicker profits.
News: wait for bar close confirmation or reduce size.
Data quality: use consistent volume feeds (especially in crypto).
Limitations
Oscillators can stay extreme in strong trends; use structure/trend filters.
Volume anomalies (illiquid pairs, API glitches) can distort signals—sanity-check with another venue when possible.
Disclaimer
This indicator is for educational purposes only and is not financial advice. Trading involves risk; past performance does not guarantee future results. Always paper-trade first and use appropriate risk controls.

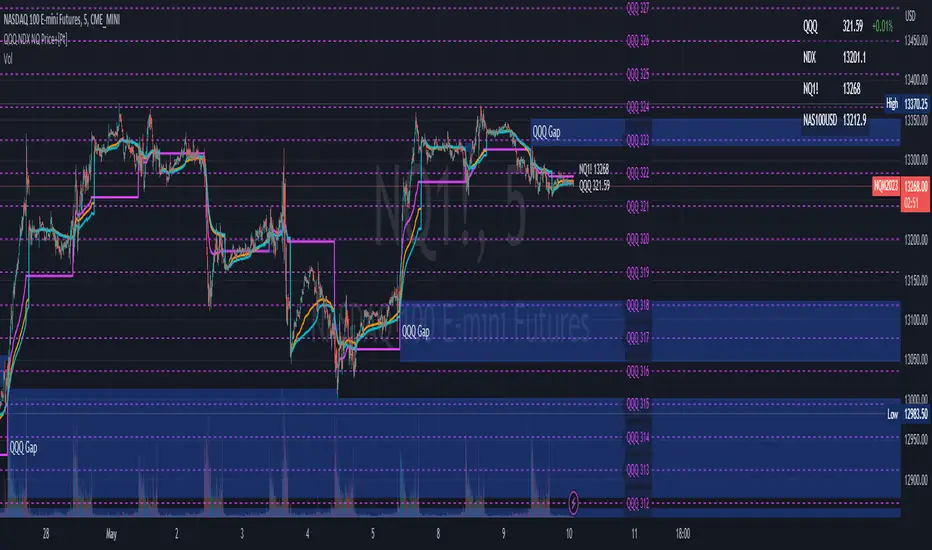
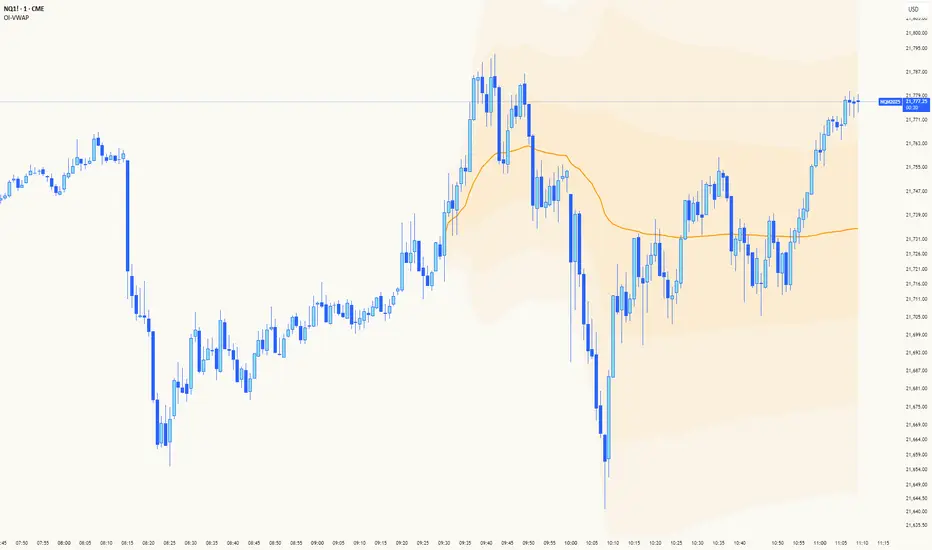
Big Money TrackerOI-Anchored VWAP: Big Money Position Tracker
Understanding VWAP in Big Money Trading
Volume Weighted Average Price (VWAP) is the benchmark most widely used by institutions to assess their execution quality and market timing. It represents the average price a security has traded at throughout the day, weighted by volume.
Why Institutions Care About VWAP:
Portfolio managers often mandate trades to be executed at or better than VWAP
Large orders are broken down and executed around VWAP to minimize market impact
Trading desks use VWAP as a neutral price to assess if they're buying too high or selling too low
Algorithmic trading systems use VWAP as a key reference for order execution
The OI-VWAP Edge
This indicator takes Big Money VWAP trading to the next level by anchoring VWAP calculations to significant Open Interest (OI) changes. This helps identify not just where institutions are trading, but where they're establishing significant positions in the crypto markets.
Key Features:
Dynamic OI-based VWAP anchoring that identifies where large positions are established
Previous VWAP level tracking to monitor historical Big Money interest points
Smart sweep detection system for both current and previous VWAP levels
Standard deviation bands for volatility context
What Makes This Indicator Unique:
Uses aggregated Open Interest data from major exchanges (Binance, BitMEX, Bybit, Kraken)
Automatically detects significant OI increases to anchor VWAP levels
Tracks both current and previous Big Money reference prices
Identifies potential stop runs and liquidity sweeps
Trading Applications:
The indicator helps identify where large positions are established and how they might influence price action:
Defense Zones: When price approaches a VWAP level with high OI, institutions often defend their positions
Liquidation Levels: Previous VWAP levels can become liquidation targets for trapped positions
Stop Runs: Sweep detection helps identify when large players might be hunting stops or creating liquidity
Mean Reversion: SD bands help identify potential reversal zones around Big Money average prices
Best Practices:
Look for price reaction at current VWAP when OI is increasing
Monitor sweeps of previous VWAP levels for potential reversals
Use SD bands to gauge volatility expansion/contraction around Big Money positions
Pay attention to failed sweeps as they often indicate strong position defense
Trading Scenarios:
// Bullish Position Defense:
// 1. High OI increase creates new VWAP (Big Money entry)
// 2. Price tests VWAP from above (retest of entry)
// 3. Failed bearish sweeps = shorts trapped
// 4. Strong defense + trapped shorts = potential squeeze
// Bearish Liquidation:
// 1. Previous VWAP level above current price
// 2. High OI trapped at higher prices
// 3. Price sweeps above then fails = more trapped longs
// 4. Break below = potential cascading liquidations
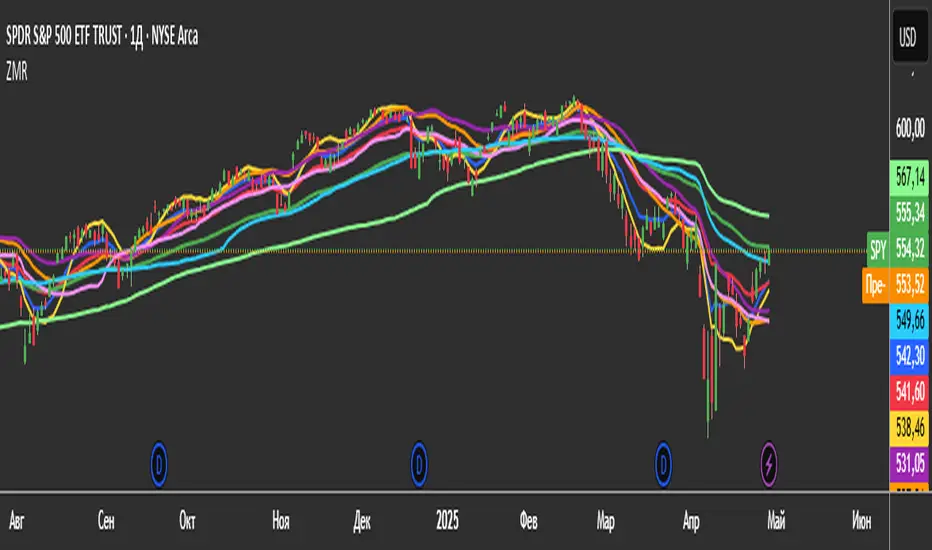
3 Zero Lag + 3 Moving Averages + 3 RVWAPThe "3 Zero Lag + 3 Moving Averages + 3 RVWAP" (ZMR) indicator combines three groups of tools for technical analysis.
1. Three Customizable Moving Averages (MAs):
Configuration for Each MA:
Choice of 7 types (SMA, EMA, WMA, HMA, VWMA, LSMA, SMMA).
Independent periods and price sources for each line.
Visualization:
MA1 (Blue), MA2 (Red), MA3 (Green).
2. Three Zero Lag EMAs (ZLEMA) with Individual Settings:
Lag Reduction: Corrects traditional EMA lag using:
Adjusted Price = 2 * Current Price - Price .
Flexibility:
Unique lengths (20, 50, 70) and individual price sources for each ZLEMA (HLC3, HL2, Close, etc.).
Colors:
ZLEMA1 (Yellow), ZLEMA2 (Orange), ZLEMA3 (Purple).
3. Three Rolling VWAPs with Custom Parameters:
Volume-Weighted Average Price (VWAP):
Calculated for three periods (20, 50, 100) with dedicated price sources for each VWAP.
Colors:
VWAP1 (Pink), VWAP2 (Light Blue), VWAP3 (Neon Green).
NASDAQ VWAP Distance Histogram (Multi-Symbol)📊 VWAP Distance Histogram (Multi-Symbol)
This custom indicator plots a histogram of price strength relative to the VWAP (Volume-Weighted Average Price).
The zero line is VWAP.
Histogram bars above zero = price trading above VWAP (strength).
Histogram bars below zero = price trading below VWAP (weakness).
Unlike a standard VWAP overlay, this tool lets you monitor multiple symbols at once and aggregates them into a single, easy-to-read histogram.
🔑 Features
Multi-Symbol Support → Track up to 10 different tickers plus the chart symbol.
Aggregation Options → Choose between average or median deviation across enabled symbols.
Percent or Raw Values → Display distance from VWAP as % of price or raw price points.
Smoothing → Apply EMA smoothing to calm intraday noise.
Color-Coded Histogram → Green above VWAP, red below.
Alerts → Trigger when the aggregate crosses above/below VWAP.
Heads-Up Table → Shows number of symbols tracked and current aggregate reading.
⚡ Use Cases
Market Breadth via VWAP → Monitor whether your basket of stocks is trading above or below VWAP.
Index Substitution → Create your own “mini index” by tracking a hand-picked set of tickers.
Intraday Confirmation → Use aggregate VWAP strength/weakness to confirm entries and exits.
Relative Strength Spotting → Switch on/off specific tickers to see who’s holding above VWAP vs. breaking down.
🛠️ Settings
Include Chart Symbol → Toggle to include the current chart’s ticker.
Smoothing → EMA length (set to 0 to disable).
Percent Mode → Show results as % of price vs. raw difference.
Aggregate Mode → Average or median across all active symbols.
Symbol Slots (S1–S10) → Enter tickers to track alongside the chart.
⚠️ Notes
Works best on intraday charts since VWAP is session-based.
Designed for confirmation, not as a standalone entry/exit signal.
Ensure correct symbol format (e.g., NASDAQ:AAPL if needed).
✅ Tip: Combine this with your regular price action strategy. For example, if your setup triggers long and the histogram is well above zero, that’s added confirmation. If it’s below zero, caution — the basket shows weakness.

Range + VWAP + Gann Levels + ZL AMA + Gann Square Num# Multi-Strategy Market Analysis Indicator
## Overview
This comprehensive indicator combines several powerful technical analysis tools to help traders identify potential price movements, market trends, and key support/resistance levels. By integrating price range prediction, volume-weighted averages, adaptive moving averages, and Gann-based mathematical levels, this indicator provides a complete toolkit for market analysis.
## Components & How They Work
### 1. Range Calculator
**What it does:** Calculates the expected price range based on current volatility, useful for predicting potential price movements during a specific time period.
**How it works:**
- Uses the current price level and VIX (Volatility Index) to estimate how far the price might move in a given number of days
- Applies the square root of time principle (volatility grows with the square root of time)
- Displays upper and lower bounds of the expected price range
- Shows the calculation details in a convenient table
**How to use it:**
- Enter the current price level, VIX value, and number of days
- red line indicates potential resistance
- green line indicates potential support
- Useful for options trading, setting stop-loss levels, or preparing for upcoming market events
### 2. Gann Square Numbers
**What it does:** Identifies mathematically significant price levels based on square numbers.
**How it works:**
- Takes the square root of the current price
- Calculates the next 5 square numbers above the current price (upper levels)
- Calculates the 5 square numbers below the current price (lower levels)
- Draws these levels as horizontal lines on the chart
**How to use it:**
- Pink lines (upper levels) show potential resistance levels
- Blue lines (lower levels) show potential support levels
- These mathematical levels often coincide with significant market reactions
- Based on W.D. Gann's theory that price tends to respect mathematical square numbers
### 3. Zero Lag Adaptive Moving Average (AMA)
Bullish Scenario
Bearish Scenario
**What it does:** Provides a dynamic moving average that adapts to changing market conditions, reducing lag during trends while filtering noise during sideways markets.
**How it works:**
- Calculates an "Efficiency Ratio" that measures the directional movement relative to volatility
- Adjusts the smoothing factor based on market efficiency
- Uses a faster smoothing factor during trending markets and slower smoothing during sideways markets
- Background color changes to indicate the trend direction (green for uptrend, red for downtrend)
**How to use it:**
- When price is above the AMA line with green background: Strong uptrend
- When price is below the AMA line with red background: Strong downtrend
- Helpful for trend identification and potential entry/exit points
### 4. Gann Stepline Levels
**What it does:** Creates dynamic support and resistance levels based on multiple SMAs (Simple Moving Averages) of different lengths.
**How it works:**
- Calculates two key dynamic levels:
- Gann 50% Level: Average of 90 and 144-period SMAs
- Gann Level: Average of six different SMAs (90, 144, 180, 216, 240, 288)
- These levels adjust automatically as the market evolves
**How to use it:**
- Blue line (Gann 50% Level) acts as dynamic support in uptrends and resistance in downtrends
- Orange line (Gann Level) serves as a longer-term trend indicator
- Price interaction with these levels often indicates potential reversal or continuation points
### 5. Anchored VWAP (Volume-Weighted Average Price)
**What it does:** Shows the average price weighted by volume starting from a specific anchor point.
**How it works:**
- Calculates the average price weighted by volume from a chosen anchor period (Session, Day, Week, Month)
- Resets calculations at the beginning of each new period
- Shows where the current price is relative to the average trading price
**How to use it:**
- Price above VWAP: Bullish bias, buyers are in control
- Price below VWAP: Bearish bias, sellers are in control
- VWAP often acts as dynamic support/resistance level
- Institutional traders often use VWAP for order execution
## Key Benefits
- **Comprehensive Analysis:** Combines volatility-based, trend-following, volume-weighted, and mathematical approaches
- **Multi-timeframe Perspective:** Different components operate on various timeframes for a complete market view
- **Visual Clarity:** Color-coded lines and background help quickly identify market conditions
- **Customizable Components:** Range Calculator, VWAP, and Gann Square Numbers can be adjusted to fit your trading style
## How to Interpret When Used Together
- **Strong Trend Confirmation:** When AMA shows a trend and price respects the Gann Dynamic levels
- **Reversal Signals:** When price reaches the expected range bounds and encounters a Gann Square Number
- **High-Probability Zones:** Areas where multiple components show support/resistance at similar levels
- **Volatility Assessment:** Compare the expected range from the Range Calculator with the actual price movement
This indicator combines statistical, trend-following, and mathematical approaches to market analysis, providing traders with a well-rounded view of market conditions and potential price movements.

A-VWAP The Anchored VWAP (Volume-Weighted Average Price) is a powerful multi-functional tool that adapts to price action and volume dynamics to identify trend bias, support/resistance zones, and potential reversal points. This enhanced version integrates dynamic color-coded signals (green/red) to simplify decision-making for swing traders, intraday scalpers, and position managers.
Dynamic Trend Bias Identification
Green A-VWAP (Bullish Control): Activates when price sustains above the anchored VWAP. Highlights bullish momentum, suggesting institutional buying dominance and potential continuation setups.
Red aVWAP (Bearish Control): Triggers when price holds below the anchored VWAP. Signals bearish pressure, indicating distribution phases or downtrends.
Swing-Level Targeting
Green aVWAP serves as dynamic support for profit-taking on short positions during pullbacks and adding New long positions.
Red aVWAP becomes resistance for profit closure on Long trades. Price dipping far below red aVWAP may signal oversold conditions, with red aVWAP acting as a resistance target.
Strategic Applications
Swing Trading: Use green/red aVWAP to define trend alignment and position direction
Swing Short or Swing Long Target
Swing Long Entry or Swing Short Target
Intraday: nchored VWAP (aVWAP) with Standard Deviation (STDV) bands provides a powerful framework for identifying mean-reversion opportunities when price extends away from its volume-weighted fair value. Identifying Overextended Moves, Executing the Trade, Managing Risk
Institutional Flow Tracking: Monitor how price interacts with aVWAP to gauge institutional accumulation/distribution.
Standard Deviation Bands for Volatility Context
The indicator integrates ±1 and ±2 standard deviation bands around the Anchored VWAP. These bands quantify price dispersion, acting as dynamic boundaries for mean reversion or trend acceleration:
Tightening Bands: Signal low volatility, often preceding breakouts.
Expanding Bands: Reflect heightened volatility, indicating strong Resistance/Support.
Use these bands to identify overextended price levels.
Multi-Timeframe Anchoring Strategy
Lower Timeframe 15-Minute High/Low Focus:
For intraday scalping or short-term trades, anchor the VWAP to swing highs or lows on the 15-minute Low/High.
Higher Timeframe 1-Hour High/Low Focus:
For swing trading, anchor the VWAP to major swing points on the 1-hour Low/High. This aligns with broader market structure, offering clarity on institutional accumulation/distribution zones. A sustained green zone above the HTF VWAP signals alignment with the higher-timeframe trend.
Anchored VWAP Most Powerful tool
The enhanced VWAP with Anchoring empowers traders to harmonize short-term precision with higher-timeframe context. Whether scalping on the 15-minute chart or swing trading, this tool adapts to your strategy’s rhythm. By anchoring to critical highs/lows and layering volatility bands, it transforms raw price action into a structured roadmap—guiding entries, exits, and risk management with institutional-grade clarity.
Master the markets across timeframes with an indicator that scales with your ambition.

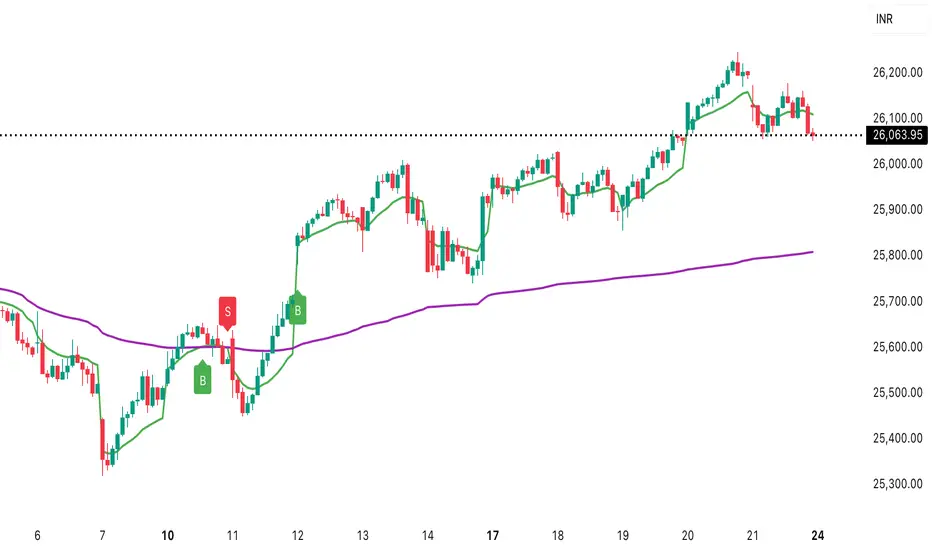
MVSF 6.0[ELPANO]The "MVSF 6.0 " indicator, which stands for Multi-Variable Strategy Framework, overlays on price charts to aid in trading decisions. It combines various moving averages and volume data to generate buy and sell signals based on predefined conditions.
Key features of the indicator include:
Moving Averages: It uses three exponential moving averages (EMAs) with lengths of 200, 100, and 50, and two simple moving averages (SMAs) with lengths of 14 and 9. These averages are combined into a single average line to detect trends.
Volume Analysis: The volume is assessed over a specified period (default is 2 bars) to determine its trend relative to its average, influencing the color and interpretation of signals.
Price Source and VWAP: Users can select the price (close, low, or high) used for calculations. The volume-weighted average price (VWAP) serves as a potential benchmark or condition in signal generation.
Signal Generation: Buy and sell signals are based on the relationship of the price to the average line and VWAP, the direction of the last candle, and the trend direction of the average line. These signals are visually represented on the chart.
Customization: Traders can toggle the visibility of signals, entry points, the average line, and even use these elements as conditions for filtering signals.
This script is designed to be flexible, allowing traders to modify settings according to their strategy needs. The description and implementation aim to provide clarity on how each component works together to assist in trading decisions, adhering to best practices for creating and publishing trading scripts.
*************************************
Der Indikator "MVSF 6.0 ", der für Multi-Variable Strategy Framework steht, wird über Preisdiagramme gelegt, um bei Handelsentscheidungen zu helfen. Er kombiniert verschiedene gleitende Durchschnitte und Volumendaten, um Kauf- und Verkaufssignale basierend auf vordefinierten Bedingungen zu generieren.
Wesentliche Merkmale des Indikators umfassen:
Gleitende Durchschnitte: Es werden drei exponentielle gleitende Durchschnitte (EMAs) mit Längen von 200, 100 und 50 sowie zwei einfache gleitende Durchschnitte (SMAs) mit Längen von 14 und 9 verwendet. Diese Durchschnitte werden zu einer einzelnen Durchschnittslinie kombiniert, um Trends zu erkennen.
Volumenanalyse: Das Volumen wird über einen festgelegten Zeitraum (standardmäßig 2 Balken) bewertet, um seinen Trend im Vergleich zum Durchschnitt zu bestimmen, was die Farbe und Interpretation der Signale beeinflusst.
Preisquelle und VWAP: Benutzer können den für Berechnungen verwendeten Preis (Schluss-, Tief- oder Hochkurs) auswählen. Der volumengewichtete Durchschnittspreis (VWAP) dient als mögliche Benchmark oder Bedingung bei der Generierung von Signalen.
Signalgenerierung: Kauf- und Verkaufssignale basieren auf dem Verhältnis des Preises zur Durchschnittslinie und zum VWAP, der Richtung der letzten Kerze und der Trendrichtung der Durchschnittslinie. Diese Signale werden visuell auf dem Diagramm dargestellt.
Anpassung: Händler können die Sichtbarkeit von Signalen, Einstiegspunkten, der Durchschnittslinie und sogar deren Verwendung als Bedingungen für die Filterung von Signalen ein- und ausschalten.
Dieses Skript ist so konzipiert, dass es flexibel ist und Händlern erlaubt, die Einstellungen gemäß ihren Strategiebedürfnissen zu modifizieren. Die Beschreibung und Implementierung zielen darauf ab, Klarheit darüber zu schaffen, wie jede Komponente zusammenarbeitet, um bei Handelsentscheidungen zu helfen, und halten sich an die besten Praktiken für die Erstellung und Veröffentlichung von Handelsskripten.

PivotBoss VWAP Bands (Auto TF) - FixedWhat this indicator shows (high level)
The indicator plots a VWAP line and three bands above (R1, R2, R3) and three bands below (S1, S2, S3).
Band spacing is computed from STD(abs(VWAP − price), N) and multiplied by 1, 2 and 3 to form R1–R3 / S1–S3. The script is timeframe-aware: on 30m/1H charts it uses Weekly VWAP and weekly bands; on Daily charts it uses Monthly VWAP and monthly bands; otherwise it uses the session/chart VWAP.
VWAP = the market’s volume-weighted average price (a measure of fair value). Bands = volatility-scaled zones around that fair value.
Trading idea — concept summary
VWAP = fair value. Price above VWAP implies bullish bias; below VWAP implies bearish bias.
Bands = graded overbought/oversold zones. R1/S1 are near-term limits, R2/S2 are stronger, R3/S3 are extreme.
Use trend alignment + price action + volume to choose higher-probability trades. VWAP bands give location and magnitude; confirmations reduce false signals.
Entry rules (multiple strategies with examples)
A. Momentum breakout (trend-following) — preferred on trending markets
Setup: Price consolidates near or below R1 and then closes above R1 with above-average volume. Chart: 30m/1H (Weekly VWAP) or Daily (Monthly VWAP) depending on your timeframe.
Entry: Enter long at the close of the breakout bar that closes above R1.
Stop-loss: Place initial stop below the higher of (VWAP or recent swing low). Example: if price broke R1 at ₹1,200 and VWAP = ₹1,150, set stop at ₹1,145 (5 rupee buffer below VWAP) or below the last swing low if that is wider.
Target: Partial target at R2, full target at R3. Trail stop to VWAP or to R1 after price reaches R2.
Example numeric: Weekly VWAP = ₹1,150, R1 = ₹1,200, R2 = ₹1,260. Buy at ₹1,205 (close above R1), stop ₹1,145, target1 ₹1,260 (R2), target2 ₹1,320 (R3).
B. Mean-reversion fade near bands — for range-bound markets
Setup: Market is not trending (VWAP flatish). Price rallies up to R2 or R3 and shows rejection (pin bar, bearish engulfing) on increasing or neutral volume.
Entry: Enter short after a confirmed rejection candle that fails to sustain above R2 or R3 (prefer confirmation: close back below R1 or below the rejection candle low).
Stop-loss: Just above the recent high (e.g., 1–2 ATR or a fixed buffer above R2/R3).
Target: First target VWAP, second target S1. Reduce size if taking R3 fade as it’s an extreme.
Example numeric: VWAP = ₹950, R2 = ₹1,020. Price spikes to ₹1,025 and forms a bearish engulfing candle. Enter short at ₹1,015 after the next close below ₹1,020. Stop at ₹1,035, target VWAP ₹950.
C. Pullback entries in trending markets — higher probability
Setup: Price is above VWAP and trending higher (higher highs and higher lows). Price pulls back toward VWAP or S1 with decreasing downside volume and a reversal candle forms.
Entry: Long when price forms a bullish reversal (hammer/inside-bar) with a close back above the pullback candle.
Stop-loss: Below the pullback low (or below S2 if a larger stop is justified).
Target: VWAP then R1; if momentum resumes, trail toward R2/R3.
Example numeric: Price trending above Weekly VWAP at ₹1,400; pullback to S1 at ₹1,360. Enter long at ₹1,370 when a bullish candle closes; stop at ₹1,350; first target VWAP ₹1,400, second target R1 ₹1,450.
Exit rules and money management
Basic exit hierarchy
Hard stop exit — when price hits initial stop-loss. Always use.
Target exit — take partial profits at R1/R2 (for longs) or S1/S2 (for shorts). Use trailing stops for the remainder.
VWAP invalidation — if you entered long above VWAP and price returns and closes significantly below VWAP, consider exiting (condition depends on timeframe and trade size).
Price action exit — reversal patterns (strong opposite candle, bearish/bullish engulfing) near targets or beyond signals to exit.
Trailing rules
After price reaches R2, move stop to breakeven + a small buffer or to VWAP.
After price reaches R3, trail by 1 ATR or lock a defined profit percentage.
Position sizing & risk
Risk per trade: commonly 0.5–2% of account equity.
Determine position size by RiskAmount ÷ (EntryPrice − StopPrice).
If the stop distance is large (e.g., trading R3 fades), reduce position size.
Filters & confirmation (to reduce false signals)
Volume filter: For breakouts, require volume above short-term average (e.g., >20-period average). Breakouts on low volume are suspect.
Trend filter: Only take breakouts in the direction of the higher-timeframe trend (for example, use Daily/Weekly trend when trading 30m/1H).
Candle confirmation: Prefer entries on close of the confirming candle (not intrabar noise).
Multiple confirmations: When R1 break happens but RSI/plotted momentum indicator does not confirm, treat signal as lower probability.
Special considerations for timeframe-aware logic
On 30m/1H the script uses Weekly VWAP/bands. That means band levels change only on weekly candles — they are strong, structural levels. Treat R1/R2/R3 as significant and expect fewer, stronger signals.
On Daily, the script uses Monthly VWAP/bands. These are wider; trades should allow larger stops and smaller position sizes (or be used for swing trades).
On other intraday charts you get session VWAP (useful for intraday scalps).
Example: If you trade 1H and the Weekly R1 is at ₹2,400 while session VWAP is ₹2,350, a close above Weekly R1 represents a weekly-level breakout — prefer that for swing entries rather than scalps.
Example trade walkthrough (step-by-step)
Context: 1H chart, auto-mapped → Weekly VWAP used.
Weekly VWAP = ₹3,000; R1 = ₹3,080; R2 = ₹3,150.
Price consolidates below R1. A large bullish candle closes at ₹3,085 with volume 40% above the 20-bar average.
Entry: Buy at close ₹3,085.
Stop: Place stop at ₹2,995 (just under Weekly VWAP). Risk = ₹90.
Position size: If risking ₹900 per trade → size = 900 ÷ 90 = 10 units.
Targets: Partial take-profit at R2 = ₹3,150; rest trailed with stop moved to breakeven after R2 is hit.
If price reverses and closes below VWAP within two bars, exit immediately to limit drawdown.
When to avoid trading these signals
High-impact news (earnings, macro announcements) that can gap through bands unpredictably.
Thin markets with low volume — VWAP loses significance when volumes are extremely low.
When weekly/monthly bands are flat but intraday price is volatile without clear structure — prefer session VWAP on smaller timeframes.
Alerts & automation suggestions
Alert on close above R1 / below S1 (use the built-in alertcondition the script adds). For higher-confidence alerts, require volume filter in the alert condition.
Automated order rules (if you automate): use limit entry at breakout close plus a small slippage buffer, immediate stop order, and OCO for TP and SL.

MJBFX VWAP WITH SIGNALSThe MJBFX VWAP Channel is a custom-built volume-weighted average price indicator designed around the MJBFX trading methodology.
This tool tracks multiple rolling VWAPs anchored to a user-defined timeframe (default: 1H), then calculates percentile levels (Max, Upper, Median, Lower, Min) to create a dynamic channel. These levels act as key support and resistance zones that adapt to market conditions.
🔶 Features:
Adjustable anchor period and VWAP count (up to 500 VWAPs)
Percentile-based VWAP levels (Max, Upper, Median, Lower, Min)
Customisable colours, widths, and line styles
Optional gradient channel fills
Anchor period highlights for session awareness
MJBFX Branded Signals:
🟠 Buy – Triggered when price crosses above the lower VWAP (MJBFX Orange)
⚪ Sell – Triggered when price crosses below the upper VWAP (MJBFX Grey)
Built-in alert conditions for automated trade notifications
🔶 How to Use:
The VWAP channel provides a dynamic structure for intraday trading.
Buy opportunities often occur when price sweeps below the lower band and reclaims it.
Sell opportunities often occur when price sweeps above the upper band and rejects.
Use in confluence with market structure, session timing, and your trading plan (e.g., MJB-FX Asian Sweep strategy).

Ober Trend Oscillator [by Oberlunar]The Ober Trend Oscillator by Oberlunar unifies a volume-weighted view of price with order-flow information in a single, disciplined signal. At its core is a Triple Hull Moving Average applied to the session VWAP. This pairing is intentional: the Hull family is widely used because its quadratic weighting and internal differencing reduce phase lag versus SMA/EMA while preserving a smooth, readable contour; running it on top of VWAP anchors the calculation to a price already “risk-weighted” by volume, which behaves in practice like a microstructural equilibrium level. Around VWAP, the indicator computes standard-deviation envelopes that provide statistical context; excursions to the far band against the prevailing direction often mark probabilistic excess and become the first checkpoint for signal qualification.
The order-flow module is built on a tick-rule Cumulative Volume Delta, the most robust choice when native bid/ask deltas are unavailable. Volumes are signed by up- or down-moves, cumulatively integrated, then smoothed by a configurable EMA. To make the series comparable across instruments and timeframes, the CVD is standardised via an adjustable z-score window. This normalisation matters because it reframes “push” and “exhaustion” as deviations from recent behaviour rather than absolute thresholds tied to each market’s idiosyncratic liquidity. When enabled, a pivot-based divergence engine searches for fresh local highs or lows in price that the CVD refuses to confirm and annotates the symbol Δ with the percentage size of the divergence on price, on CVD, or both. Quantifying divergence avoids binary, eye-ball readings and lets you compare the relative strength of signals over time.
Signal generation follows a two-stage logic. Stage one is regime detection by the THMA on VWAP. The slope of the long THMA defines the primary trend, while the instantaneous difference between the THMA and its own lag sets the “serpentine” colour that conveys the local direction of pressure. Using slope on the longer window is deliberate: trend-following practice shows that slope filters materially reduce false positives in choppy regimes. Stage two enforces contextual alignment between price and higher-timeframe VWAP bands. For a long, the THMA computed on the higher-timeframe VWAP must sit below the current curve and below the second lower deviation, consistent with either a mean-reverting excess or early re-accumulation; shorts are defined symmetrically. Volume-flow confirmation is then required through either a rising CVD, a supportive z-score, or a detected pivot divergence in the same direction. To discourage over-trading, signals alternate by design and a strict colour gate is applied: a green diamond is never printed on a red line and bullish divergences are not drawn when the serpentine indicates bearish pressure. This visual consistency is not cosmetic; it reduces cognitive dissonance between filters and execution signal and improves reading discipline.
Parameters are organised to make these choices explicit. The main THMA length controls the oscillator’s sensitivity to VWAP, while the “trend” and “long-term” lengths drive the slope filter, with the latter acting as the regime anchor. The higher timeframe used to compute THMA on VWAP is the context-alignment knob and enables true multi-period operation, which is essential in fractal markets such as crypto, FX and equity indices. The VWAP deviation multiplier sets the breadth of the statistical bands; values modestly below one are a deliberate default to keep excess detection sensitive without turning the envelopes into a very wide channel. The ATR window that drives the line’s thickness is not a visual gimmick: thickness adapts to volatility and communicates the movement’s energy at a glance, much like an adaptive envelope.
The CVD package offers full control. A dedicated timeframe lets you decouple order-flow estimation from the chart’s timeframe when a slower, more reliable read of pressure is preferred. The calculation mode can reference Close-to-Close for responsiveness or HL2 for slightly greater robustness to closing noise, depending on the instrument’s microstructure. EMA smoothing governs granularity, the slope lookback sets how many observations are required to validate an inflection, and the z-score length defines the statistical horizon for normalisation—longer windows make the signal steadier, shorter windows make it more tactical. The pivot divergence option with percentage sizing grades relevance rather than merely flagging presence. Measuring both the price change between pivots and the CVD change is intentional: the most actionable divergences exhibit not only directionally opposing shapes but also a quantitative mismatch between price and flow; putting the two numbers side by side clarifies whether price is outrunning flow or flow is reversing ahead of price.
On the attached weekly Bitcoin example, the turquoise serpentine highlights impulsive phases while red denotes retracement or distribution. Δ labels with “P:%” and “C:%” mark points where price sets a new extreme without a matching CVD extreme; the percentage annotation helps distinguish a trivial imbalance from a credible exhaustion. Diamonds appear only when their colour agrees with the serpentine, and their location relative to the higher-TF VWAP bands clarifies when the market stops pushing “with volume” and starts pushing “against volume”—often the operational cue that precedes mean reversion or a consolidation before the next impulse.
Three methodological choices deserve emphasis. The THMA-on-VWAP architecture addresses the classic lag-versus-noise trade-off by combining a low-lag smoother with a volume-anchored base series that reflects institutional execution practice. Z-scoring the CVD is consistent with a statistical reading of flow that reasons in deviations from expected behaviour rather than fixed thresholds, which is particularly relevant on assets with shifting liquidity regimes. Finally, the colour gate plus signal alternation mitigates the well-known clustering of false positives in sideways markets: you do not print green on red or red on green, and you do not fire the same direction twice in a row without an opposite transition, which avoids hammering into the same move.
Practical usage is straightforward. Select your trading timeframe and align context with a higher timeframe in the VWAP-THMA; tune the VWAP deviation multiplier to match the instrument’s excess profile; choose an equal or slower CVD timeframe to extract structural pressure; enable divergence sizing when you want to measure, not only see, the gap between price and flow. Signals can also be drawn on the main chart, so next to candles, you will see both the execution diamonds and Δ labels with their percentage sizes. If you work with higher-timeframe inputs via `request.security`, be aware that those series confirm only at their own close; you can require confirmation for both the higher-TF VWAP and CVD timeframes to eliminate any practical repaint. Integrated alerts tied to THMA+VWAP+CVD validation convert discretionary reading into a monitorable workflow consistent with systematic routines.
Known limitations are stated explicitly. Tick-rule CVD is an approximation and, while standard in the absence of native bid/ask deltas, it may diverge from “true” delta on venues with unusual execution dynamics; normalisation helps but does not eliminate this. Pivot divergences depend on swing definition and require sensitivity calibration to avoid over-signalling on erratic markets. By construction, the oscillator favours trending contexts with statistically motivated pullbacks; during prolonged congestion, signals will naturally thin out, and the standardised CVD becomes the primary discriminator.
In sum, the Ober Trend Oscillator is a dual-channel reader: the THMA-on-VWAP line tells you about regime and movement quality, and the normalised CVD tells you about the pressure sustaining that movement. When the two stories align, continuation probability improves; when they diverge, the Δ annotation quantifies the gap and offers an objective basis for judging whether you are seeing a healthy pause or an impending reversal. The integration of volume-weighted price, simple statistics, and order-flow makes the indicator genuinely multi-period, capable of scaling from intraday to swing without changing its visual language or its decision criteria.
Oberlunar 👁️⭐

Smoothed SuperTrend with VWAP Confirmation [CHE] Smoothed SuperTrend with Automated Optimization and VWAP Confirmation
Overview
The "Smoothed SuperTrend with VWAP Confirmation" is an advanced technical analysis indicator designed for precise trend identification and trading signal generation. This script integrates a smoothed version of the popular SuperTrend indicator with an additional layer of confirmation using the Volume-Weighted Average Price (VWAP). The combination of these two elements offers traders a powerful tool for identifying optimal entry and exit points in the market.
Key Features
1. Smoothed SuperTrend
- Super Smoother Algorithm: The SuperTrend in this script is not just a regular one; it is enhanced by the Super Smoother filter, which reduces market noise and provides more reliable trend signals.
- Customizable Parameters: Traders can adjust three different sets of SuperTrend parameters (factor and ATR length), allowing them to tailor the indicator to their specific trading strategies.
- Automatic Optimization: The script automatically evaluates the performance of each SuperTrend parameter set and selects the one with the best cumulative performance. This selection process can be set to pick either the best or the worst performing parameter set, depending on the trader's preference.
2. VWAP Confirmation
- Precise Trend Confirmation: Once the best-performing SuperTrend is identified, the script further refines the signals by using VWAP as a confirmation tool. VWAP is a highly respected indicator in the trading community, often used to assess the true average price of an asset.
- Long and Short Signal Generation: The script generates Long and Short signals only when the price action is confirmed by both the SuperTrend and VWAP. For a Long signal, the price must be above the VWAP, and for a Short signal, it must be below the VWAP. This dual confirmation ensures higher accuracy and reduces the likelihood of false signals.
3. Visual and Informative Labels
- Signal Labels: Upon confirmation of a trend reversal by both the SuperTrend and VWAP, the script plots clear labels on the chart, indicating confirmed Long or Short signals. These labels are customizable in terms of color, text, and size, ensuring they fit seamlessly into any chart setup.
- Best Parameters Display: At the close of the most recent bar, the script displays a label that provides detailed information about the best-performing SuperTrend parameters and their cumulative performance. This feature keeps traders informed about which settings are currently most effective.
Input Customization Options
1. Super Smoother Length
- Traders can define the length of the Super Smoother filter, which is used to smooth both price data and ATR (Average True Range) values. This input allows traders to control the sensitivity of the indicator, with shorter lengths providing faster responses and longer lengths offering smoother trends.
2. SuperTrend Parameters
- Factor: For each of the three SuperTrends, traders can set a unique factor that determines the distance of the SuperTrend bands from the average price. A higher factor results in wider bands and fewer signals, while a lower factor results in narrower bands and more signals.
- ATR Length: Traders can also specify the length of the ATR used in each SuperTrend calculation. A longer ATR period captures broader market volatility, while a shorter period focuses on more immediate price movements.
3. Label Settings
- Label Colors: The script allows full customization of label colors for Long and Short signals, ensuring that they match the trader’s chart aesthetics.
- Label Text Colors and Sizes: Traders can adjust the text color and size of the labels for Long, Short, and information labels, allowing them to prioritize visibility and readability on their charts.
4. Performance Selection Mode
- Best or Worst Performer: This input allows traders to select whether the script should optimize for the best or worst performing SuperTrend parameter set. This flexibility is useful in different market conditions, where a trader might want to analyze either the strongest trend or focus on a contrarian strategy.
5. VWAP Calculation
- The script automatically recalculates the VWAP based on trend changes, ensuring that the confirmation signals are as accurate and relevant as possible to the current market context.
Important Note
This script is designed to provide more accurate trend signals and confirmations, but like all technical indicators, it should not be used in isolation. It is recommended to use this tool as part of a broader trading strategy, including proper risk management and consideration of fundamental market conditions.
Conclusion
The "Smoothed SuperTrend with VWAP Confirmation" script is an innovative trading tool that combines the strengths of the SuperTrend and VWAP indicators. By integrating smoothing techniques and automatic parameter optimization, this indicator provides traders with more accurate and reliable trend signals. The added confirmation by VWAP further enhances the precision of the entry and exit points, making it an excellent choice for traders looking to improve their technical analysis and trading outcomes. This tool is especially valuable for those who prefer customizable inputs and a systematic approach to trading, ensuring that the indicator adapts to various market conditions and individual trading styles.
Best regards
Chervolino

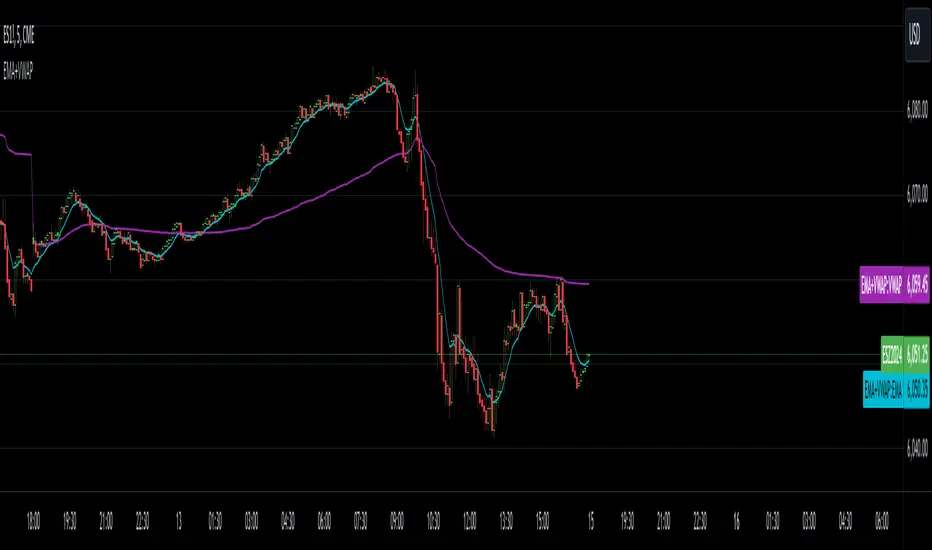
True Moving VWAPHaven't found any moving VWAPs that calculate correctly (were weighted by time rather than volume) - this is correctly weighted VWAP.

Daily vs Monthly VWAP CrossoverDaily vs Monthly VWAP Crossover Strategy
Description:
Overview This indicator is a trend-following tool designed to identify significant shifts in market sentiment by comparing short-term institutional value against the longer-term trend. It utilizes Anchored VWAP (Volume Weighted Average Price) logic to track the average price paid by traders for the current Day versus the current Month.
How It Works Unlike standard Moving Averages which lag significantly, VWAP factors in volume, making it a preferred benchmark for institutional traders.
Daily VWAP (Fast Line): Anchors at the start of the current trading day. It represents the intraday equilibrium price.
Monthly VWAP (Slow Line): Anchors at the start of the current month. It represents the broader value consensus for the month.
The indicator calculates these values cumulatively on every tick/bar, regardless of the chart timeframe selected (e.g., 30m, 1h).
Trading Logic & Signals The strategy is based on the concept of value migration:
BUY Signal (Bullish Reversal): Triggers when the Daily VWAP crosses ABOVE the Monthly VWAP. This suggests that short-term buying pressure and volume are pushing the price higher than the monthly average cost basis, indicating a potential breakout or trend continuation.
SELL Signal (Bearish Reversal): Triggers when the Daily VWAP crosses BELOW the Monthly VWAP. This indicates that intraday weakness has dragged the price below the month's average value, signaling potential downside momentum.
Features
Visual Crossovers: Clearly marked "B" (Buy) and "S" (Sell) labels on the chart.
Trend Background: The background color changes subtly (Green/Red) to indicate the current dominance of the Daily vs. Monthly trend.
Alerts: Fully compatible with TradingView alerts for real-time notifications on crossovers.
Best Practices
Timeframe: Designed optimally for intraday charts such as 30-minute or 1-hour timeframes.
Confirmation: As with any VWAP strategy, this works best when combined with price action analysis (e.g., breakout of key resistance) rather than used blindly in choppy, sideways markets.
QuantumFlowTraderQuantumFlowTrader
Adaptive Flow Visualizer with Multi-ATR Volatility Engine and Multi-EMA Clouds
Overview
QuantumFlowTrader is an adaptive market flow visualizer that integrates multiple EMA clouds, a session VWAP framework, and a tested multi-ATR volatility engine.
It is built to help traders interpret directional strength, institutional balance, and volatility synchronization across any asset and timeframe available on TradingView.
How It Works
1. Multi-EMA Clouds — Trend Structure and Flow Context
QuantumFlowTrader employs several EMA-based cloud layers to represent short-, medium-, and long-term structure simultaneously.
Each cloud adapts dynamically to price movement, revealing trend alignment and momentum stacking across depths of the market.
When all EMA clouds align in the same direction, the color gradient intensifies (green for bullish, red for bearish).
When structure conflicts, transparency increases, signaling mixed or transitional phases.
This multi-cloud approach allows traders to see structure, flow, and trend shifts at a glance, eliminating guesswork and highlighting transitions between trend and consolidation.
2. Session VWAP — Institutional Equilibrium and Reaction Zones
The Session VWAP represents the real-time mean price that institutional participants often reference.
QuantumFlowTrader enhances it with tested adaptive deviation envelopes, which highlight zones where price frequently reacts or pauses.
These deviation zones dynamically expand or contract with volatility, defining institutional fair-value regions and potential continuation or mean-reversion boundaries.
VWAP color automatically changes based on whether price trades above or below the equilibrium, giving immediate visual feedback on session bias.
3. QuantumFlow ATR Engine — Core Innovation
At the heart of QuantumFlowTrader is its proprietary multi-ATR engine, a deeply tested system that runs multiple ATR calculations and deviation layers at the same time.
Unlike single-metric approaches, this composite engine merges several ATRs with different sensitivities and deviations to identify synchronized volatility alignment.
When all ATR layers align bullish, a green up-arrow appears below the bar.
When all align bearish, a red down-arrow appears above the bar.
This configuration has been tested for many years across market types and volatility regimes.
Its goal is to detect moments when price action, volatility, and structure converge, which historically coincide with the start or continuation of strong directional flows.
This multi-ATR architecture is what makes QuantumFlowTrader genuinely unique among volatility-based systems.
Adaptability Across Assets and Timeframes
QuantumFlowTrader is universally adaptable:
Works effectively on any timeframe, from scalping to swing or position trading.
Performs consistently across Forex, Stocks, Indices, Commodities, and Crypto.
The internal algorithms automatically adjust their sensitivity and scaling to the selected chart’s behavior, ensuring smooth adaptation to different volatility environments.
This makes it suitable for traders who want a consistent analytical framework adaptable to both short-term and long-term contexts.
Customization and Alerts
EMA Clouds: adjust colors, transparency, and visibility for each structural layer.
VWAP Zones: toggle the equilibrium line and deviation visualization.
ATR Arrows: control arrow appearance and size for bullish/bearish events.
Dynamic Scaling: built-in adaptive multiplier auto-balances volatility response.
Built-in alerts:
Buy Condition: all ATR layers bullish and price above VWAP.
Sell Condition: all ATR layers bearish and price below VWAP.
These alerts identify situations where both directional flow and volatility alignment agree.
Originality and Value
QuantumFlowTrader is not a mash-up of public indicators.
Its originality lies in how it integrates:
Multiple EMA clouds for layered structural analysis.
Session VWAP with adaptive deviation zones to reveal institutional equilibrium and price reactions.
A proprietary multi-ATR engine that combines several ATR and deviation configurations simultaneously for volatility confirmation.
Together, these systems produce a unified, adaptive visualization of market structure, volatility, and flow — helping traders stay aligned with dynamic directional conditions while filtering out low-efficiency noise.
Example — Multi-Timeframe Integration (Optional Use)
While QuantumFlowTrader works effectively on any single chart, many traders use a three-screen workflow to synchronize trend, momentum, and execution:
1 Screen: 15-minute, Defines dominant trend direction (multi-EMA cloud + VWAP bias).
2 Screen: 5-minute, Confirms flow alignment and momentum coherence.
3 Screen: 1-minute, Executes entries when ATR arrows appear in the same direction as the 15-minute trend.
Example workflow:
1. Identify overall direction from 15m cloud and VWAP structure.
2. Wait for 5m confirmation.
3. Time entries on 1m using ATR arrows aligned with the higher timeframe.
This structure enhances precision and reduces counter-trend exposure.
Best Practices and Limitations
Always use proper risk management and forward testing before applying live.
Author’s Instructions:
To request access, please contact the author through the TradingView profile.

STEVEN Breakout VWAP (M1/M5/M15)This strategy combines breakout detection, VWAP confirmation, and ATR-based risk management to identify high-probability trading setups.
It automatically generates Long and Short entries when price action breaks key levels and aligns with VWAP direction, providing clear visual signals and automated backtesting capability.
🔍 How It Works
Breakout Detection:
The script identifies when price breaks above recent highs or below recent lows (based on the last 10 candles).
VWAP Confirmation:
A Long signal is generated when price breaks above resistance and stays above VWAP.
A Short signal is generated when price breaks below support and stays below VWAP.
ATR-based Stop Loss & Take Profit:
Stop Loss = 1× ATR (adjustable).
Take Profit = 1.5× risk (Risk/Reward 1:1.5).
Both are calculated dynamically at signal time.
Backtesting Ready:
Fully compatible with TradingView’s Strategy Tester, allowing users to analyze performance, win rate, and profit factors automatically.
🧩 Visual Features
Green triangles below the bars → Long signal.
Red triangles above the bars → Short signal.
Orange VWAP line → confirms trend direction.
⚙️ Inputs
ATR Length and Multiplier
VWAP Display toggle
Stop Loss and Risk/Reward settings
Signal marker size

Hurst Criticality EngineThe Hurst Criticality Engine (HCE) is an advanced trading indicator designed to detect potential breakout (BUY) and exhaustion (SELL) conditions by combining multi‑scale Hurst exponent analysis with tactical confirmations such as VWAP, RSI, volume spikes, Fibonacci log‑periodic patterns and price channels.
It is optimized for traders seeking structured confluence in volatile or trending markets, and can be applied across different timeframes, from intraday scalping (1m–15m) to swing trading (1h–4h).
What It Does
HCE identifies potential turning points and momentum shifts by evaluating market persistence and volatility across several dimensions. It generates three main types of labels:
CRITICAL Signals: Triggered when multiple Hurst scales align and tactical validations confirm the setup. These can indicate breakout (BUY) or exhaustion (SELL) conditions.
CPC (Critical Pivot Confirmation): Appears at structural highs or lows validated by Hurst exponent alignment and VWAP context.
PIVOT Labels: Marks confirmed structural highs (▼) and lows (▲) that can be used to anticipate reversals or continuation setups.
A dynamic Tactical Panel shows real‑time information on signal strength, VWAP zones, last confirmed signals and the current alignment of the Hurst scales.
How It Works
The indicator integrates several analytical components, each designed to filter noise and add context:
Hurst Exponent Analysis:
Evaluates price persistence across up to five customizable time scales (default: 10, 20, 40, 80, 160 bars).
A signal is considered when at least a minimum number of scales (default: 3) align as bullish (>0.6) or bearish (<0.4).
Rolling VWAP with Standard Deviation Bands:
Plots a rolling VWAP and three customizable bands (±1σ, ±2σ, ±3σ).
Signals are validated if price is correctly positioned relative to VWAP (above for BUY, below for SELL) or if it breaks the outermost band, suggesting volatility extremes.
RSI and Volume Confirmation:
Uses RSI (default: 14‑period) to confirm momentum alignment (e.g., oversold for BUY, overbought for SELL).
Incorporates volume spikes (default: 1.5× average) as an additional confirmation of institutional participation.
Fibonacci Log‑Periodic Patterns:
Validates critical signals by checking whether price oscillations align with harmonic Fibonacci ratios (default: 0.618).
Channel Detection:
Runs a 50‑bar regression channel to identify structural boundaries.
Signals are reinforced when price interacts significantly with channel extremes or breaks out from them.
Dynamic Scoring System:
Every signal receives a score from 0 to 8 based on the confluence of all the above factors.
Scores ≥6 indicate strong alignment, 4–5 medium, 2–3 weak and ≤1 neutral.
Why This Combination?
Each component provides different insights: the Hurst exponent captures market persistence, VWAP defines value areas, RSI and volume confirm momentum and participation, while Fibonacci and channels provide structural references. This synergy allows HCE to filter noise and focus on conditions where multiple factors align, increasing the reliability of the setups.
How to Use It
Add the Indicator to the Chart:
Works on any instrument and timeframe (e.g., 1m, 5m, 15m for scalping; 1h, 4h for swing trading).
Configure Settings:
General Parameters: Set the minimum number of Hurst scales, cooldown between signals and spacing mode (manual or adaptive).
Tactical Validations: Enable or disable RSI, volume, Fibonacci or channel filters.
VWAP Settings: Adjust length (default: 50 bars) and deviation bands.
Hurst Scales: Enable up to five scales and customize their lengths.
Tactical Panel and Labels: Choose compact or detailed view and toggle the display of CRITICAL, CPC, PIVOT or Observation labels.
Interpret Signals:
CRITICAL (B/S): Labels appear above/below price with tooltips showing the signal score, VWAP status and momentum context.
CPC (⚡CPC↑ / ⚡CPC↓): Indicates critical pivots confirmed at structural highs or lows.
PIVOT (▲ / ▼): Marks confirmed highs/lows for additional context.
Observation Labels (⚠️): Highlight potential setups not meeting full CRITICAL criteria.
Monitor the Tactical Panel:
Displays the VWAP zone, number of aligned Hurst scales, signal score and last confirmed signals.
Recommendations
Use HCE as a confluence filter, not as a standalone entry tool.
Focus on signals with Medium (4–5) or Strong (≥6) scores.
Combine CPC and PIVOT labels with broader context for swing or reversal trades.
Apply on clean charts (without overlapping indicators) for optimal visualization.
Always use proper risk management, as no indicator can predict outcomes with certainty.
Chart Setup and Alerts
The script includes customizable alerts for CRITICAL, CPC, PIVOT and VWAP breakouts.
For clear visualization, use it on charts without clutter.
Works best on liquid markets (e.g., forex, crypto, stocks) and in volatile or trending conditions

EMA with VWAPThis indicator combines two popular technical analysis tools: the Exponential Moving Average (EMA) and the Volume Weighted Average Price (VWAP), into a single, powerful overlay on your chart. It allows you to analyze both trend direction using the EMA and institutional interest and fair value using the VWAP, all while saving valuable indicator slots on your TradingView layout.
Key Features:
- Exponential Moving Average (EMA):
- Calculates the EMA based on a user-defined Length and Source (e.g., close, open, hl2).
- Includes an optional Offset to shift the EMA line forward or backward on the chart.
- Offers a Smoothing Line feature, allowing you to further smooth the EMA using various moving average types (SMA, EMA, SMMA (RMA), WMA, VWMA) with a customizable Smoothing Length.
- EMA and Smoothing Line can be toggled on or off.
- EMA and Smoothing Line have independent offset capabilities.
Volume Weighted Average Price (VWAP):
-Calculates the VWAP, a crucial indicator that reflects the average price weighted by volume.
- Offers a wide range of Anchor Periods for resetting the VWAP calculation, including: Session, Week, Month, Quarter, Year, Decade, Century, Earnings, Dividends, and Splits.
- Includes an optional Offset to shift the VWAP line.
- Option to Hide VWAP on 1D or Above timeframes to focus on intraday analysis.
- Provides up to three customizable Standard Deviation Bands above and below the VWAP, visually representing volatility and potential support/resistance levels.
- Bands can be calculated using either "Standard Deviation" or "Percentage" methods.
- Bands can be turned on or off independently.
How to Use:
- EMA: Use the EMA to identify the overall trend direction. An upward-sloping EMA suggests an uptrend, while a downward-sloping EMA suggests a downtrend. The Smoothing Line can help confirm the EMA's trend.
- VWAP: The VWAP acts as a benchmark for the "fair" price of an asset during the selected anchor period. Prices above the VWAP may indicate bullish sentiment, while prices below may indicate bearish sentiment.
- Bands: The Standard Deviation Bands can help identify potential overbought and oversold conditions. Price reaching the upper bands might suggest overbought levels, while price reaching the lower bands might suggest oversold levels.
Customization:
- The indicator offers extensive customization through its settings:
- EMA Settings: Adjust the EMA length, source, offset, smoothing method, and smoothing length.
- VWAP Settings: Choose the VWAP anchor period, source, offset, and whether to hide it on daily or higher timeframes.
- VWAP Bands Settings: Control the visibility, multiplier, and calculation method for each of the three standard deviation bands.
Benefits:
- Consolidated Analysis: Combines two essential indicators into one, providing a comprehensive view of price action and volume.
- Saves Indicator Slots: Frees up valuable indicator slots on your TradingView chart.
- Highly Customizable: Offers a wide range of settings to tailor the indicator to your specific trading style and preferences.
- Visual Clarity: Clearly displays the EMA, VWAP, and optional bands on the chart, facilitating quick and easy analysis.
This combined EMA and VWAP indicator is a valuable tool for traders of all levels, offering a powerful and flexible way to analyze market trends and identify potential trading opportunities.
TrendWave EMA/VWAP IndicatorThe TrendWave EMA/VWAP Indicator is a powerful technical analysis tool designed for traders seeking to enhance their market strategies. By combining the dynamic Exponential Moving Average (EMA) and the Volume Weighted Average Price (VWAP), this indicator provides valuable insights into price trends and potential trading signals, allowing for informed decision-making in various market conditions.
Key Features:
Exponential Moving Average (EMA):
The EMA component helps traders identify the direction of the prevailing trend by giving more weight to recent price action. This responsiveness makes the EMA an essential tool for trend-following strategies.
Customizable Length: Users can adjust the EMA length (default set to 50 periods) to align with their specific trading style and preferences.
Volume Weighted Average Price (VWAP):
The VWAP is crucial for evaluating the average price of a security throughout the trading day, factoring in volume. It serves as a benchmark for price action and can help traders identify significant support and resistance levels.
Real-time Benchmarking: The VWAP enables traders to assess current prices against historical averages, improving their entry and exit strategies.
Signal Generation:
The TrendWave EMA/VWAP Indicator generates clear buy and sell signals based on the interaction between the price and the VWAP:
Bullish Signal: Triggered when the price crosses above the VWAP, indicating a potential upward movement.
Bearish Signal: Triggered when the price crosses below the VWAP, suggesting a potential downward movement.
These signals are visually represented with intuitive arrows on the chart, facilitating quick recognition of trading opportunities.
User-Friendly Interface:
The indicator allows traders to enable or disable components (EMA and VWAP) based on their preferences, ensuring a personalized trading experience.
Clear color coding enhances visual clarity: the EMA is displayed in blue, while the VWAP is shown in orange.
Use Cases:
Trend Following: Use the EMA to confirm the direction of the trend and make trades that align with that trend.
Price Action Analysis: Employ the VWAP to determine the average trading price and identify key support/resistance levels.
Signal Confirmation: Combine signals from both the EMA and VWAP to enhance trading strategies and decision-making.
The TrendWave EMA/VWAP Indicator is an essential addition to any trader's toolkit. By leveraging the strengths of both the EMA and VWAP, this indicator empowers traders to make informed, data-driven decisions and capitalize on market movements with confidence.

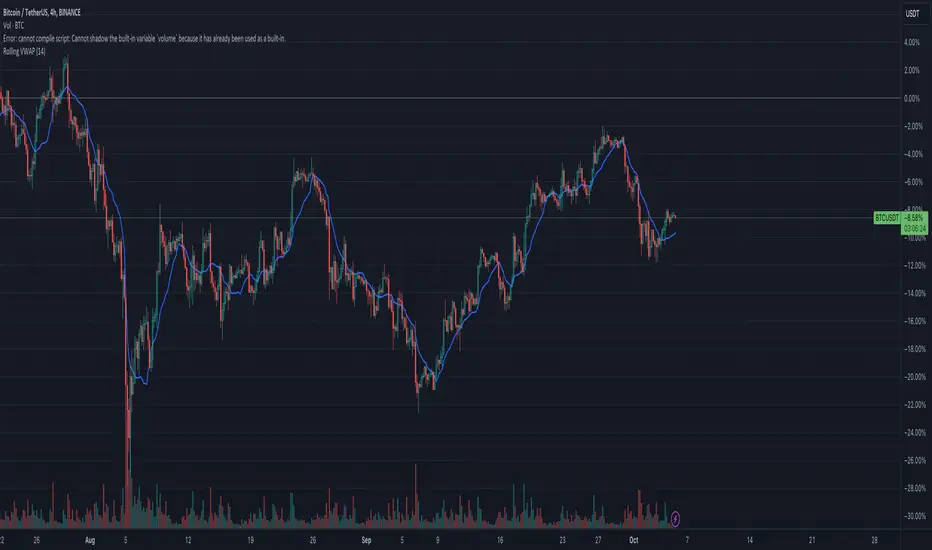
Rolling VWAPGuide for Traders
What is the Rolling VWAP?
The Volume Weighted Average Price (VWAP) is a key indicator used by traders to assess the average price of an asset, weighted by volume over a specified period. Unlike a simple moving average, the VWAP accounts for trading volume, making it a more accurate reflection of price action and market sentiment.
The Rolling VWAP in this script dynamically updates based on a user-defined period, allowing traders to view the average price over a chosen number of bars. This is particularly useful for identifying trends and potential entry or exit points in the market.
Key Benefits of Using Rolling VWAP
Better Market Insight: VWAP provides insight into where most trading is occurring, helping you gauge the strength of a price move.
Support and Resistance Levels: It often acts as dynamic support or resistance, signaling areas where price might reverse.
Trend Confirmation: A rising VWAP suggests a bullish trend, while a falling VWAP indicates a bearish trend.
Informed Entry/Exit Decisions: Use the VWAP to find entry points below it in an uptrend or exit points above it in a downtrend.
How to Use this Script:
Custom Period Input:
You can modify the "VWAP Period" to adjust the number of bars considered in the rolling calculation.
The default period is 14 bars, but you can set it based on your strategy (e.g., shorter for intraday trading, longer for swing trading).
Chart Interpretation
Bullish Signals: When the price is above the VWAP line, it suggests upward momentum, and you may consider buying opportunities.
Bearish Signals: When the price is below the VWAP, it indicates downward momentum, and you may consider selling or shorting opportunities.
Reversion to VWAP: Prices often revert to the VWAP after extended moves away from it, offering potential trade setups.
Combine with Other Indicators:
Momentum Indicators: Use with RSI, MACD, or moving averages for confirmation.
Volume Analysis: VWAP works well when combined with volume indicators to assess if a breakout is supported by high trading volume.
Customization:
Traders can customize the script's period and plot color to fit their charting preferences.
Practical Tips:
Intraday Traders: Use shorter periods (e.g., 5 or 10) to capture VWAP trends in fast-moving markets.
Swing Traders: Use longer periods (e.g., 50 or 100) to assess longer-term price and volume trends.
By integrating this Rolling VWAP into your strategy, you can better understand where the majority of trading volume has occurred, allowing you to make more informed decisions in your trading process.
F.B_Volume Weighted Average Price MTFThe F.B_Volume Weighted Average Price MTF (VWAP MTF) indicator calculates the volume-weighted average price of a security across different timeframes. The VWAP is a powerful indicator used by both institutional and retail traders to make better trading decisions.
Functionality:
Timeframe:
The indicator allows you to adjust the timeframe for the VWAP calculation via the settings. By default, the timeframe is set to weekly ("W").
Restart at new timeframe:
At each new period in the chosen timeframe, the VWAP calculations are reset, and a new VWAP is calculated.
VWAP Calculation:
The VWAP is calculated by the volume-weighted average of the typical prices (High, Low, and Close) of the security. This calculation takes into account the volume of each transaction to provide an accurate average price.
Visualization:
The VWAP is displayed as a line on the chart, and the color of the line changes depending on the price position relative to the VWAP:
Green: The current closing price is above the VWAP (bullish signal).
Red: The current closing price is below the VWAP (bearish signal).
Options:
Show barcolors:
This option allows you to display the colors of the candles based on their position relative to the VWAP (green for bullish, red for bearish).
Show previous VWAP close:
This option shows the closing value of the VWAP from the previous period to provide historical reference points.
Interpretation:
Bullish Signal:
If the current price is above the VWAP, this indicates that the market trend is upward, which could be considered a buying opportunity.
Bearish Signal:
If the current price is below the VWAP, this indicates that the market trend is downward, which could be considered a selling signal.

Standard Deviation Buy Sell Signals [UOI]The "Standard Deviation Buy Sell Signals" which is a Mean and VWAP Deviation Super Pack that includes many additional features is an advanced technical analysis tool designed to assist traders in making well-informed decisions in the financial markets. It incorporates various functions and calculations to provide a comprehensive analysis of price movements, trends, and potential trading opportunities in different timeframes. The Super Pack combines elements of volume-weighted average price (VWAP), mean calculation on multiple time frames, standard deviation signals and bands, overbought and oversold signals, measures of central tendency, and multiple time frame calculations of mean reversion. A truly unique indicator.
Here is the details of the supper pack and what is included:
1. VWAP (Volume-Weighted Average Price): The Mean and VWAP Deviation Super Pack includes VWAP, which calculates the average price of a security weighted by its trading volume. This helps traders identify the average price at which a significant amount of trading activity has occurred and can serve as a reference point for determining whether the current price is overvalued or undervalued.
2. Standard Deviation Signals and Bands: The Super Pack incorporates standard deviation signals and bands to measure the volatility of price movements. By calculating the standard deviation of price data, it identifies price levels that deviate significantly from the average, indicating potential overbought or oversold conditions. The standard deviation bands provide visual boundaries that help traders assess the likelihood of a price reversal or continuation. The bands are hidden to avoid too many lines but you can enable them in the setting. See image below:
3. Overbought and Oversold Signals: Using the standard deviation calculations, the Mean and VWAP Deviation Super Pack generates overbought and oversold signals. These signals indicate when a security's price has moved to an extreme level, suggesting a potential reversal or correction in the near future. Traders can use these signals to time their entries or exits in the market. You can change the RSI number in the setting to get more or less signals.
4. Measures of Central Tendency: The Super Pack incorporates measures of central tendency, such as the mean, median, or mode, to provide a sense of the average or typical price behavior. These measures help traders identify the prevailing trend or price direction and assess the likelihood of a trend continuation or reversal. This provide reassurance of whether price is too far from center in multiple time frames.
5. Multiple Time Frame Calculation of Mean Reversion: The Mean and VWAP Deviation Super Pack employs multiple time frame calculations to identify mean reversion opportunities. It compares the current price with the historical average price over different time periods, allowing traders to identify situations where the price has deviated significantly from its mean and is likely to revert back to its average value. This can be useful for swing trading or short-term trading strategies.
By combining these various functions, the Mean and VWAP Deviation Super Pack provides traders with a comprehensive analysis of price dynamics, trend strength, potential reversals, and mean reversion opportunities. It aids in making more informed trading decisions and improving overall trading performance.
Why is this super pack indicator an essential trading strategy for every trader:
Standard deviation and mean reversion are valuable tools for traders, especially when the market is in a ranging phase. A ranging market is characterized by price movements that oscillate between defined support and resistance levels, with no clear trend in either direction. In such market conditions, standard deviation and mean reversion strategies can be particularly effective. Here's why:
1. Standard Deviation: Standard deviation is a statistical measure that quantifies the volatility or dispersion of price data around its average. In a ranging market, where prices tend to fluctuate within a certain range, standard deviation can help identify overbought and oversold levels. When the price reaches the upper end of the range, the standard deviation bands widen, indicating higher volatility and a potential selling opportunity. Conversely, when the price reaches the lower end of the range, the bands narrow, suggesting lower volatility and a potential buying opportunity. Traders can use these signals to anticipate price reversals and take advantage of the predictable nature of ranging markets.
2. Mean Reversion: Mean reversion is a concept that suggests prices tend to move back toward their average or mean over time. In a ranging market, where prices repeatedly move between support and resistance levels, mean reversion strategies can be highly effective. By identifying when the price has deviated significantly from its mean, traders can anticipate a potential reversal back toward the average. When the price reaches extreme levels, indicating overbought or oversold conditions, traders can enter positions in the opposite direction, expecting the price to revert to its mean. Mean reversion strategies can be implemented using various indicators, including Bollinger Bands, moving averages, or standard deviation bands.
3. Range Boundaries: In a ranging market, the upper and lower boundaries of the price range serve as reliable reference points for traders. Standard deviation and mean reversion strategies capitalize on the repetitive nature of price movements within these boundaries. Traders can set their entry and exit points based on the standard deviation bands or mean reversion signals to take advantage of price reversals near the range boundaries. By properly identifying and reacting to these levels, traders can profit from the price oscillations within the range.
4. Risk Management: Standard deviation and mean reversion strategies provide traders with clear entry and exit points, allowing for effective risk management. By placing stop-loss orders beyond the range boundaries or the standard deviation bands, traders can limit their potential losses if the price continues to move against their positions. Additionally, by taking profits near the opposite range boundary or when the price reverts back to the mean, traders can secure their gains and maintain a disciplined approach to trading.
Standard deviation and mean reversion strategies offer traders a systematic approach to capitalize on ranging markets. But the cherry on top is the overbought and oversold signals:
The concept of overbought and oversold levels is widely used in technical analysis to identify potential reversals in price trends. Typically, indicators like the Relative Strength Index (RSI) are employed to determine when an asset may be overbought or oversold. However, you have developed a unique approach by incorporating an interactive variable with RSI and Average True Range (ATR) to create a distinct overbought and oversold signal. Here's why this approach stands out:
1. Divergence: Your approach introduces a divergence concept by combining RSI and ATR. Traditionally, overbought and oversold signals rely solely on RSI readings. However, by considering the interaction between RSI and ATR, you bring a new dimension to these signals. The divergence occurs when the RSI indicates overbought conditions while simultaneously ATR crosses over into bearish territory, or when the RSI signals oversold conditions along with ATR crossing over into bullish territory. This divergence adds an extra layer of confirmation to the overbought and oversold signals.
2. Reduced False Signals: The incorporation of ATR in conjunction with RSI helps filter out false signals that may occur during trending market conditions or short squeezes. Trend days or periods of increased volatility can cause RSI to remain in overbought or oversold territory for an extended period, generating numerous signals that may not be reliable. By considering the crossing of ATR into bearish or bullish territory, your approach adds a dynamic element to the signal generation process. This interactive variable helps ensure that the overbought and oversold signals are not solely based on RSI getting hot, reducing the likelihood of false signals during trending or volatile periods.
3. Improved Timing: The interaction between RSI and ATR provides a more nuanced approach to timing overbought and oversold signals. By waiting for the ATR to confirm the RSI signal, you introduce an additional condition that enhances the precision of the timing. The bearish or bullish crossover of ATR serves as a confirmation that market conditions align with the overbought or oversold signal indicated by RSI. This combined approach allows for more accurate entry or exit points, increasing the potential profitability of trades.
4. Customization and Adaptability: By creating this interactive variable with RSI and ATR, you have developed a customizable approach that can be adapted to different trading styles and preferences. Traders can adjust the sensitivity of the signals by modifying the parameters of the RSI and ATR. This flexibility allows for a personalized trading experience and enables traders to align the signals with their specific risk tolerance and market conditions.
This approach to overbought and oversold signals utilizing RSI and ATR introduces a unique perspective to technical analysis. By incorporating divergence and interactive variables, you enhance the reliability of these signals while reducing false readings. This approach provides improved timing and adaptability, making it a valuable tool for traders seeking to identify potential reversals in price trends with greater accuracy and confidence.
HOW to avoid fake signals?
When it comes to trading with standard deviation as a strategy, it's important to note that on extreme trend days, this indicator may generate false signals. This occurs because standard deviation is primarily designed to measure volatility and deviations from the mean in a range-bound market. During strong trending periods, the price tends to move in one direction with minimal deviations, rendering the standard deviation less effective.
To avoid trading based solely on standard deviation during extreme trend days, it is advisable to incorporate additional indicators that can provide insights into the stock's trend or squeeze conditions. These indicators can help determine whether the market is experiencing a strong trend or a squeeze, allowing you to avoid false signals generated by standard deviation.
By utilizing complementary indicators such as trend-following indicators (e.g., moving averages, trendlines) or volatility indicators (e.g., Bollinger Bands), you can gain a more comprehensive understanding of the market environment. These indicators can help confirm whether the stock is in a trending phase or experiencing a squeeze, helping you avoid entering trades solely based on standard deviation during these extreme trend days.
In summary, while standard deviation is a valuable tool in range-bound markets, it may produce unreliable signals on extreme trend days. By incorporating other indicators that provide insights into the stock's trend or squeeze conditions, traders can better assess the market environment and avoid false signals generated by standard deviation during these periods. This approach enhances the overall effectiveness and accuracy of trading strategies, leading to more informed and profitable decision-making.
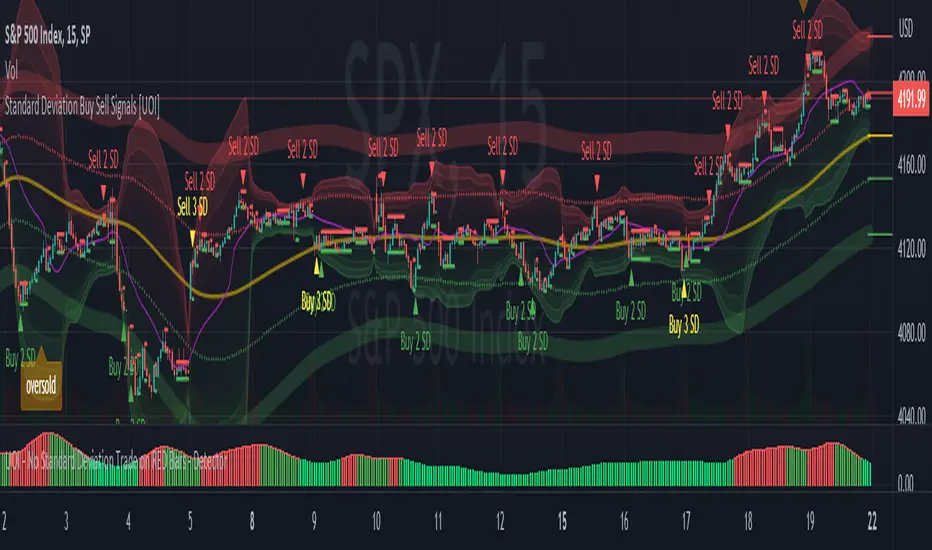
QQQ NDX NQ Price Converter+ [Pt]This is a + version of my original QQQ NDX NQ Price Converter indicator
Description
The QQQ NDX NQ Price Converter is a powerful and easy-to-use tool that allows traders to view corresponding price levels for linked instruments in real-time. This includes QQQ, NDX, NQ, and NAS100USD. Although these instruments often move in sync, differences in price movements, volume, and trading hours can create unique key levels and support/resistance areas for each. By mapping these levels on the same chart, traders can more easily spot trading opportunities and improve their chances of success.
Customizable features
- multiplier from the closest whole number price level
- line color
- line style
- label position / size
- # of levels to display
- toggle current price display table
|| ------------------------------------------------------------------------------------------------------------------------------------------------------------------------------------||
This script includes the following premium unique features.
QQQ / NDX Gaps detector
A gap is an area on a chart where the price between two bars changes significantly without any trades happening between them. Such gaps often occur when a strong shift in sentiment happens during the hours when markets are usually closed. This indicator highlights these gaps on the chart and extends them further until they have been covered (i.e., when a newer bar has crossed that gap).
Overnight gaps from QQQ or NDX can be mapped directly onto NQ chart
VWAPs
VWAPs of these linked instruments can be mapped onto the chart. For example, NQ VWAP mapped onto QQQ chart, or vise versa. This allows for clear visualization of the price action near these VWAP levels.
Custom Cross Instruments Price Targets
Want to trade QQQ options while watching NQ chart or vise versa? You can set upto 8 price targets and see the corresponding converted price level. No need to switch between charts to try to figure out which price level corresponds to which.