Above VWAP (Y/N)Background-only overlay script.
It does not plot VWAP, does not draw any lines, and exists only to color the chart background based on above / below VWAP.
스크립트에서 "VWAP"에 대해 찾기

AggBands (v1) [qrsq]The "AggBands" indicator is a custom trading indicator designed to provide a consolidated view of the price action across multiple assets or trading pairs. It combines the price data from multiple tickers and calculates an aggregated price using user-defined weights for each ticker.
The indicator starts by defining the tickers to be included in the aggregation. You can choose from predefined configurations such as "BTC PAIRS," "CRYPTO TOTAL MARKET CAP," "TOP 5 PAIRS," "TOP 5 MEMECOINS," "SPX," "DXY," or "FANG." Each configuration includes specific tickers or indices relevant to the chosen category.
The indicator then fetches the closing, high, and low prices for each ticker and applies the user-defined weights to calculate the aggregated prices. The aggregated prices are normalized within a specified length to provide a consistent scale across different assets or pairs.
Next, the indicator calculates the midpoint, which is the average of the highest high and lowest low of the aggregated prices over a specified aggregation period.
To assess the volatility, the indicator calculates the price range and applies the Average True Range (ATR) indicator to determine the volatility value. The standard deviation is then computed using the price range and aggregation period, with an additional scaling factor applied to the volatility value.
Based on the standard deviation, the indicator generates multiple bands above and below the midpoint. By default, three standard deviation bands are calculated, but the user can choose between one and five bands. The upper and lower bands are smoothed using various moving average (MA) types, such as Simple Moving Average (SMA), Exponential Moving Average (EMA), Smoothed Moving Average (SMMA/RMA), Weighted Moving Average (WMA), Volume Weighted Moving Average (VWMA), Volume Weighted Average Price (VWAP), or Arnaud Legoux Moving Average (ALMA). The user can also adjust the length, offset, and sigma parameters for the moving averages.
The indicator can optionally smooth the midpoint, upper bands, and lower bands using a separate set of moving average parameters.
The indicator can be useful for traders and analysts who want to gain a consolidated view of price movements across multiple assets or trading pairs. It helps identify trends, volatility, and potential support and resistance levels based on the aggregated price and standard deviation bands. Traders can use this information to make informed decisions about trading strategies, risk management, and market analysis.

rth vwapPlots the RTH (regular trading hours) VWAP. This is intended for instruments with volume only and mostly for futures. Time zone is set to EST, but start and end times of the VWAP can be configured. Standard setting is set to US equity index futures regular trading hours of 9:30 EST to 16:00 EST.

VWOP: Volume Weighted & Oscillated PriceWhile playing around with the standard "ta.vwap" I wondered why there was no length input, so I did some research on what the underlying calculation actually is, and did my best to augment it so as to allow for a variable length based on an oscillator value.
Normal VWAP = (Number of Shares Bought x Typical Price) / Total Volume
In my VWOP Calculation, typical price is replaced by selected moving average type or "matype" and then multiplied by the volume.
Then a total value is calculated using math.sum with a length value that changes according to a selected oscillator's value. The total is then divided by
the sum of just volume using the same oscillating length value. Result is then passed through the selected"matype" once more to give the final result.
Indicator designed for use as a entry/exit indicator in conjunction with more traditional moving averages and/or signal filters. Useful for taking volume + an oscillator into account along with price, instead of just the price as with a simple moving average.

UV IndicatorUV Indicator (Ultimate VWAP Indicator) is using Volume Weighted Average Price to find Direction of the Trend, and Resistance & Support.
- Circle and Square shapes represent the point of Resistance and Support.
- Teal and Maroon background colors represent Uptrend and Downtrend of the Market.
- Numbers represent the Spread Percentages.

The Systemtable viewed bullish/bearish indicator. uses 9 & 20 ema crossings along with macd & rsi to identify the bullish/bearish trend. ability to toggle vwaps + emas.
Goal to consolidate the various indicators for users that don't pay for premium ++

Daytrading Suite: Neon TPO + FVG v6.1Here is the summary of the code and the trading guide in English.
---
### 1. Code Summary: What does the chart show?
The script combines three dimensions of trading into a single chart:
* **The Context (TPO / Market Profile - Yesterday):**
* **Gold Zone (Center):** Yesterday's **POC (Point of Control)**. This was the "fairest price". It often acts as a magnet.
* **White Dashed Lines:** The **VAH (Value Area High)** and **VAL (Value Area Low)**. Yesterday, 70% of all trading volume happened between these lines. This is the area of "Balance".
* **The Structure (HTF - 1 Hour+):**
* **Red/Green Boxes (Right Edge):** Automatic **Supply & Demand Zones** based on the 1-hour chart (or your setting). They indicate major resistance and support levels.
* **The Timing (Entries):**
* **Neon FVG Boxes (Small):** "Fair Value Gaps". These represent imbalances in price. If price revisits these, it is often your **entry signal**.
* **Lines (VWAP, EMA, PDH/PDL):** Act as dynamic support and trend indicators.
---
### 2. Trading Strategy: How to use it
Do not just trade every colored spot. You must combine **Location (TPO)** with **Signal (FVG)**.
#### Step A: The Open (Where are we?)
In the morning (or at the US Open), check where the price is relative to the **white TPO lines**.
1. **Inside the White Lines (In Balance):**
* The market is undecided. Expect ranging/choppy behavior.
* **Strategy:** Buy at the bottom edge (VAL), Sell at the top edge (VAH). The target is often the Gold Zone (POC) in the middle.
2. **Outside the White Lines (Imbalance):**
* The market is seeking new prices. Danger of a Trend!
* **Strategy:** If price breaks above VAH and tests it from above -> **Long**. If it breaks below VAL -> **Short**.
#### Step B: The Setup (The High Probability Scenario)
Here is the "Rejection" Setup (Long Example):
1. Price drops to the lower white line (**VAL**) or into a green **Demand Zone**.
2. It bounces (shows a wick).
3. In the process, a small **green Neon FVG** is formed.
4. **Entry:** Limit Order at the top of the Neon FVG.
5. **Target:** The Gold Zone (POC) or the upper white line (VAH).
6. **Stop Loss:** Below the recent swing low.
#### Step C: Warning Signals (When NOT to trade)
* **In "No Man's Land":** If the price is sitting right in the middle between Gold (POC) and White (VAH/VAL), do nothing. The risk is 50/50. Wait until price hits an edge.
* **Against the Flow:** If EMA 9 and 21 are pointing steeply downwards, do not buy blindly at the VAL just because the line is there. Wait for confirmation (FVG).
### Pre-Trade Checklist:
1. **Level:** Am I at a white line (VAH/VAL) or the Gold Zone (POC)?
2. **Structure:** Do I have an HTF Demand/Supply Zone backing me up?
3. **Trigger:** Do I see a Neon FVG pointing in my direction?

SMAs TimePortalPlots 5× SMAs from 3 different timeframes - plus current chart timeframe
Plots 2× VWAPs with bands.
Meant for personal use, but maybe you can find it useful too.
Disclaimer: Beware I might update this with big changes in the future.

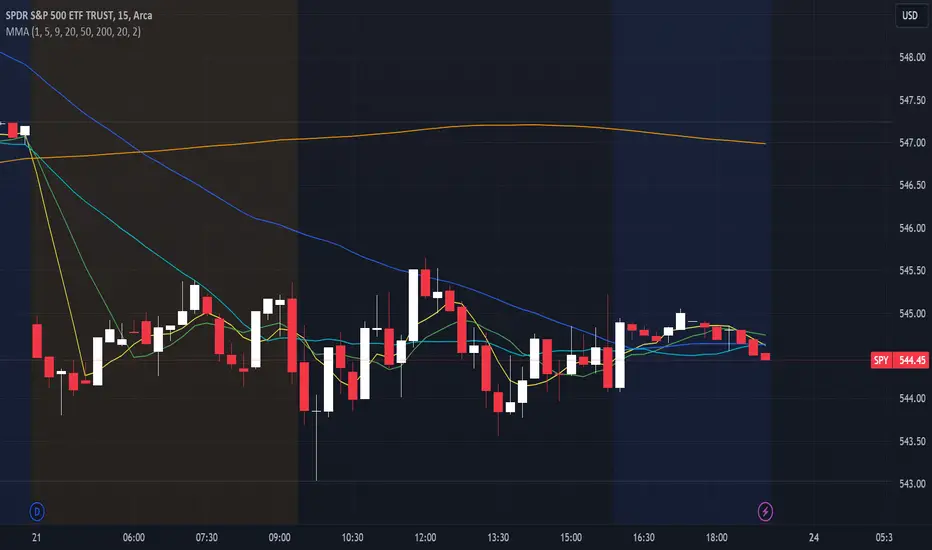
Periodic Moving AveragesIndicator plots three simple moving averages (MA) that are reset at the beginning of period, specified by a user.
Red MA is based on highs
Blue MA is based on close
Green MA one is based on lows.
Moving averages often act as support /resistance levels. They can also help to identify intraday trend. It is important to realize that none of the moving averages is universal as price behavior changes from day to day. On the chart I’ve highlighted several occurrences when one of MAs (different ones) provided support for price.
Parameters:
PERIOD – period for which MAs are plotted. They are reset at the beginning of each period. Period cannot be lower than chart’s timeframe
LENGTH – length of moving averages. If set to 0 then parameter is ignored and MAs are calculated on all bars, available in the period
VWAP? – if checked then moving averages will be calculated as volume weighted price
Disclaimer
This indicator should not be used as a standalone tool to make trading decisions but only in conjunction with other technical analysis methods.


Institutional Rolling VWAPs • 3 lines Institutional Rolling VWAPs • 3 lines + editable σ bands. 3 x modifiable vwaps, time anchored, same for ltf and htf

Multiple Moving Averages, Bollinger Bands, VWAP Options - Lett5 simple moving averages.
You decide:
1. The type of moving average
2. The length of the moving average
3. To show Bollinger Bands
4. To show VWAP.
Crossover Alerts for Yesterday O/H/L/C , Today Vwap [Zero54]This is a very simple script/indicator that trigger alerts every time the script triggers the following conditions.
1) Script crosses yesterday's (previous day's) high
2) Script crosses yesterday's (previous day's) low
3) Script crosses yesterday's (previous day's) open
4) Script crosses yesterday's (previous day's) close
5) Script crosses today's vwap.
I developed this to keep track of the scripts I follow and I find it useful. Hope you will find it useful too.
Steps to use:
1) Open the ticker for which you want to set the alerts.
2) Add this indicator to the chart.
3) Right Click on the text and set choose "Add Alert"
4) After you have done with setting up the alert, feel free to remove the indicator from the chart. It is not necessary for the indicator to be added in the chart in order for it to work.
5) Repeat 1-4 for all the scripts for which you want to set the alerts.
Be advised: During market open, if you have set alerts for multiple scripts, a tsunami of alerts may be triggered.
If you like this alert indicator, please like/boost it. Feel free to re-use this code however you may wish to. Cheers!

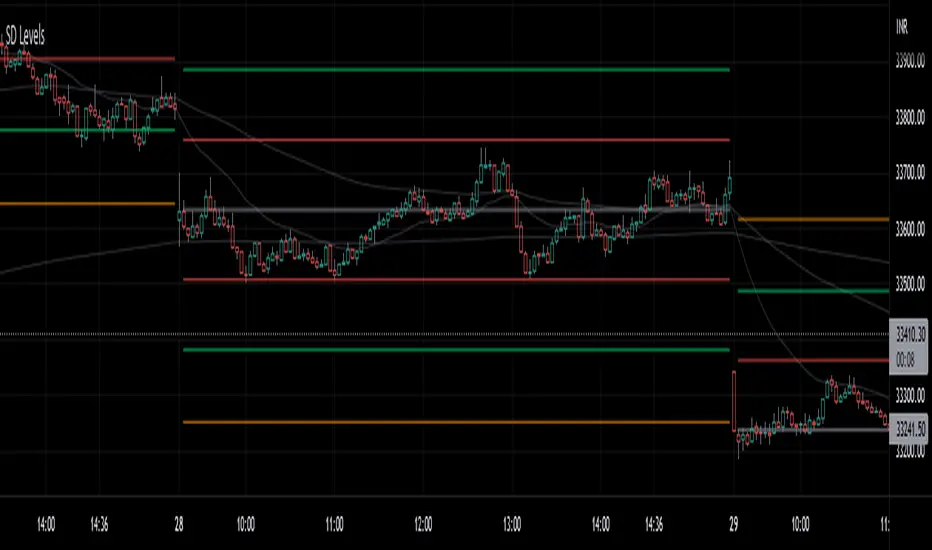
SD LevelsSD Levels is an indicator for the gap-up gap down markets
Works best on 5minute and lower time frames.
Involves standard deviation levels, Emas and Vwap.
Colorful lines are standard deviation levels which are +0.33,-0.33,+0.66,-0.66,+1.00 and -1.00 based.
Static Gray line is settlement line based on the first candle of the day and the tf you choose (default source OHLC4, also works good on close source)
Alternative Daily Reference Points for Intra-hour ChartsThis is a different version of my www.tradingview.com used high, lows and pivots. One problem with pivot points is the number of calculation methods. The alternative version shows historical lows, closes, highs one basic period back.
► On lower timeframes - hour or less - this will show High, Low and Close from the previous day, two days ago, the previous week and two weeks ago and VWAP.
► On 1h daily reference points need to be enabled. On higher timeframes, daily reference points will not be shown. On the daily chart, weekly levels need to be enabled to still show and will be disabled on all higher periods.
► It is configured only for normal timeframes. If you use something like 17-minutes timeframe, you will have to allow this timeframe in the code.
Bear in mind, using all lines at the same time can be a little confusing and price doesn't react to every one of them. You can probably disable lows in the uptrend or scratch closes to simplify your chart.
Have a great trade!

Price Deviation from vwapIt indicate the deviation of avg price from vwap. It is best use with 5 min candlestick


OHLC/GAP/EMA/VWAP all in oneThis script will plot the current open and previous high low and close. The overnight gap between the current open and the previous close is highlighted. Also included is the 10 EMA, 20 EMA and the VWAP. This is good for people who are limited on the amount of indicators they can use.

EMA + VWAP Strategy# EMA + VWAP Crossover Strategy
## Overview
This is a trend-following intraday strategy that combines fast and slow EMAs with VWAP to identify high-probability entries. It's designed primarily for 5-15 minute charts and includes a smart filter to avoid trading when VWAP is ranging flat.
## How It Works
### Core Concept
The strategy uses three main components working together:
- **Fast EMA (9)** - Responds quickly to price changes and generates entry signals
- **Slow EMA (21)** - Acts as a trend filter to keep you on the right side of the market
- **VWAP** - Serves as a dynamic support/resistance level and the primary trigger for entries
### Entry Rules
**Long Entry:**
- EMA 9 crosses above VWAP (bullish momentum)
- EMA 9 is above EMA 21 (confirming uptrend)
- VWAP has a clear directional slope (not flat/ranging)
- Only during weekdays (Monday-Friday)
**Short Entry:**
- EMA 9 crosses below VWAP (bearish momentum)
- EMA 9 is below EMA 21 (confirming downtrend)
- VWAP has a clear directional slope (not flat/ranging)
- Only during weekdays (Monday-Friday)
### The VWAP Flat Filter
One of the key features is the VWAP slope filter. When VWAP is moving sideways (flat), it indicates the market is likely consolidating or ranging. The strategy skips these periods because crossover signals tend to be less reliable in choppy conditions. You'll see small gray diamonds at the top of the chart when VWAP is considered flat.
### Risk Management
The strategy uses a proper risk-reward approach with multiple stop loss options:
1. **ATR-Based (Recommended)** - Adapts to market volatility automatically. Default is 1.5x ATR(14), which gives your trades room to breathe while protecting capital.
2. **Swing Low/High** - Places stops at recent price structure points for a more technical approach.
3. **Slow EMA** - Uses the trend-defining EMA as your stop level, good for trend-following with wider stops.
4. **Fixed Percentage** - Simple percentage-based stops if you prefer consistency.
Take profits are automatically calculated based on your risk-reward ratio (default 2:1), meaning if you risk $100, you're aiming to make $200.
### Weekday Trading Filter
The strategy includes an option to trade only Monday through Friday. This is particularly useful for crypto markets where weekend liquidity can be thin and price action more erratic. You can toggle this on/off to test whether avoiding weekends improves your results.
### Visual Features
- **Color-coded background** - Green tint when EMA 9 is above EMA 21 (bullish bias), red tint when below (bearish bias)
- **ATR bands** - Dotted lines showing where stops would be placed (when using ATR stops)
- **Active trade levels** - Solid red line for your stop loss, green line for your take profit when you're in a position
- **Weekend highlighting** - Gray background on Saturdays and Sundays when weekday filter is active
## Best Practices
**Timeframe:** Designed for 5-minute charts but can be adapted to other intraday timeframes.
**Markets:** Works on any liquid market - stocks, forex, crypto, futures. Just make sure there's enough volume.
**Position Sizing:** The strategy uses percentage of equity by default. Adjust based on your risk tolerance.
**Backtesting Tips:**
- Test with and without the weekday filter to see which performs better on your instrument
- Try different ATR multipliers (1.0-2.5) to find the sweet spot between stop-outs and letting profits run
- Experiment with risk-reward ratios (1.5R, 2R, 3R) to optimize for your win rate
**What to Watch:**
- Win rate vs. profit factor balance
- How many trades are filtered out by the VWAP flat condition
- Performance difference between weekdays and weekends
- Whether the trend filter (EMA 21) is keeping you out of bad trades
## Parameters You Can Adjust
- Fast EMA length (default 9)
- Slow EMA length (default 21)
- VWAP flat threshold (default 0.01%)
- Stop loss type and parameters
- Risk-reward ratio
- Weekday trading on/off
- ATR length and multiplier
## Disclaimer
This strategy is for educational purposes. Past performance doesn't guarantee future results. Always test thoroughly on historical data and paper trade before risking real money. Use proper position sizing and never risk more than you can afford to lose.
---
*Built with Pine Script v5 for TradingView*

AMT VWAP [hardi]█ OVERVIEW
AMT VWAP is a clean, minimalist VWAP indicator with Standard Deviation bands, designed to complement the Auction Market Theory (AMT) trading methodology by Fabio Valentino.
This indicator focuses on one thing and does it well: displaying VWAP and its deviation bands clearly on your chart.
█ FEATURES
- Daily VWAP with automatic reset
- ±1 Standard Deviation bands (cyan)
- ±2 Standard Deviation bands (orange) - extreme zones
- Clean labels that don't clutter your chart
- Info table showing current bias and zone
- Compact Mode for mobile/smartphone users
- Fully customizable colors and settings
- Built-in alerts for all levels
█ HOW TO USE
VWAP (Volume Weighted Average Price) represents the "fair value" where most volume has transacted. In AMT methodology:
BIAS DETERMINATION:
- Price ABOVE VWAP = Bullish bias (buyers in control)
- Price BELOW VWAP = Bearish bias (sellers in control)
TRADING ZONES:
- ±1 SD: Normal deviation zone - potential mean reversion area
- ±2 SD: Extreme zone - high probability reversal area (95%+ reversion rate)
ENTRY STRATEGIES:
1. Trend Following: Buy pullbacks to VWAP in uptrend, sell rallies to VWAP in downtrend
2. Mean Reversion: Fade moves at ±2 SD bands with confirmation
█ RECOMMENDED SETUP
Use this indicator together with:
- TradingView's built-in "SVP HD" (Session Volume Profile) for POC/VAH/VAL levels
- AMT CVD indicator (companion indicator) for order flow analysis
This combination gives you the complete AMT toolkit:
- SVP HD → Key levels (POC, VAH, VAL)
- AMT VWAP → Dynamic support/resistance & bias
- AMT CVD → Aggression, Absorption, Exhaustion signals
█ SETTINGS
Display Settings:
- Compact Mode - Enable for cleaner mobile view
- Show Labels - Toggle level labels
- Label Size - Adjust for your screen
VWAP Settings:
- Band Multipliers - Adjust SD band distance (default: 1.0 and 2.0)
- Colors - Fully customizable
- Line widths - Adjust visibility
Alerts:
- Near VWAP
- Near ±1 SD
- Near ±2 SD (extreme zones)
█ METHODOLOGY
This indicator is based on Auction Market Theory as taught by Fabio Valentino:
"The market is a continuous auction seeking fair value. VWAP represents this fair value dynamically throughout the session. Deviations from VWAP create trading opportunities as price tends to revert to the mean."
Key principles:
- Read, don't predict
- Location over technique
- Evidence-based entries
█ ALERTS
Set alerts for:
- Price approaching VWAP (potential support/resistance)
- Price at ±1 SD (first deviation - watch for reaction)
- Price at ±2 SD (extreme - high probability reversal zone)
█ NOTES
- Works on all timeframes
- Best used on 15m for intraday entries
- VWAP resets daily at market open
- Combine with volume profile for best results
█ CREDITS
Based on Auction Market Theory methodology by Fabio Valentino.
Indicator developed for the trading community.
If you find this useful, please leave a like! 👍
vwap, volume-weighted-average-price, standard-deviation, bands, auction-market-theory, amt, fabio-valentino, mean-reversion, trend-following, intraday, day-trading, support-resistance, fair-value

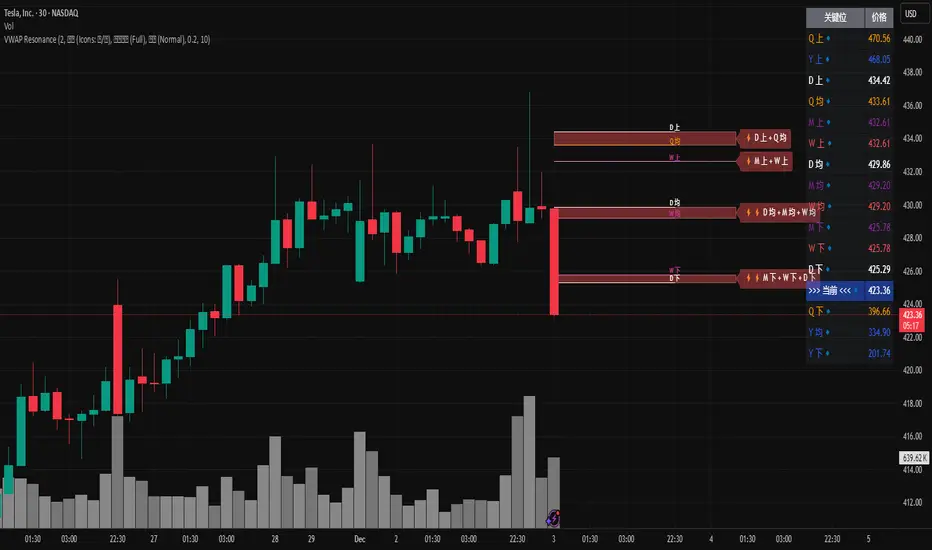
MTF VWAP Resonance [By Testeded]📈 MTF VWAP Resonance Hunter
(多级别 VWAP 共振捕猎者 - 终极版)
🇬🇧 English Description
1. Design Philosophy: The Institutional Edge
While typical indicators measure simple price action, VWAP (Volume Weighted Average Price) measures Value and Institutional Cost.
Professional traders and algorithms anchor their decisions to time-based benchmarks: Daily, Weekly, Monthly, and Quarterly. When prices return to these levels, they are testing the average cost basis of the market participants from that period.
The Logic of "Multi-Level Resonance" (MTF): A single VWAP line can be broken. However, when the Daily VWAP, Weekly Upper Band, and Quarterly Basis all overlap at the exact same price level, a "Market Consensus" is formed. This tool uses a background algorithm to detect these overlaps across 6 Timeframes (4H to Year) and visualizes them as "Resonance Boxes" instead of cluttering your chart with lines.
2. Key Features
⚓ Anchored VWAP Engine: Calculates VWAP + Standard Deviation Bands for 4H, Daily, Weekly, Monthly, Quarterly, and Yearly cycles simultaneously.
⚡ Smart Resonance Radar: Automatically detects when levels from different timeframes cluster together.
2-Line Confluence: ⚡ (Watch)
3-Line Confluence: ⚡⚡ (Strong)
4+ Line Confluence: ⚡⚡⚡ (Iron Wall)
🧘 Visual Modes (Zen / Focus):
Full Mode: Shows lines, dashboard, and resonance boxes.
Focus Mode: Hides lines, keeps dashboard and boxes.
Zen Mode: Hides EVERYTHING except the Resonance Boxes. Pure price action.
🏢 The Quarterly Line: Specifically designed to track the Quarterly VWAP, a critical level for institutional rebalancing and earnings cycles.
🎨 Customizable UI: Adjustable table text size (Small to Huge) and display styles.
3. How to Trade
Identify the Wall: Look for Red Boxes (Resistance) or Green Boxes (Support) with high star ratings (⚡⚡).
Read the Dashboard: Check the label (e.g., Q VWAP + W Lower). This tells you exactly who is defending this level (e.g., "Quarterly Buyers defending cost").
Sniper Entry: Wait for price to touch the Resonance Box. These levels often trigger sharp reversals or major breakouts.
🇨🇳 中文说明 (Chinese Description)
1. 设计哲学:多级别的全局视角
布林带反映的是波动率,而 VWAP(成交量加权平均价) 反映的是**“真金白银的持仓成本”**。
机构交易者和算法通常会锚定特定的时间周期进行交易:日内、周线、月线以及季度线。 “多级别共振”的逻辑: 单一周期的 VWAP 很容易失效。但是,当 日线 VWAP、周线上轨 和 季度线成本 在同一个价格位置重叠时,意味着短线、中线和长线资金在此处达成了**“价值共识”。 本指标通过后台算法,同时监控 6个时间周期 (4H - 年线),将这些重叠的价位转化为可视化的“共振框”**,提供一个多级别的全局视角。
2. 核心功能
⚓ 全周期锚定 VWAP:后台实时计算 4H, 日线, 周线, 月线, 季度线, 年线 的 VWAP 及其标准差轨道。
⚡ 智能共振雷达:自动检测不同周期的关键位重叠。
2线共振:⚡ (关注)
3线共振:⚡⚡ (强力支撑/阻力)
4线以上:⚡⚡⚡ (核弹级/铁壁共振)
🧘 显示模式 (Zen / Focus):
全面模式:显示所有线条 + 表格 + 共振框。
专注模式:隐藏线条,保留表格 + 共振框。
极简模式 (Zen):隐藏一切干扰,只显示共振框。像狙击手一样只看目标。
🏢 季度线增强:特别加入了 Quarterly VWAP (季度线),这是机构季末调仓和财报周期的重要防守线。
🎨 高度客制化:支持调整表格文字大小(从“小”到“巨大”),适配各种分辨率屏幕。
3. 实战用法
寻找“墙壁”:关注图表上的 红色共振框 (阻力) 或 绿色共振框 (支撑),尤其是带有 ⚡⚡ 标志的区域。
解读筹码:看一眼右上角的仪表盘标签(例如 Q VWAP + W Lower)。这意味着“季度级别的平均成本”与“周线级别的超卖线”重合,支撑力度极强。
警报交易:开启警报功能。不需要盯着屏幕,当价格撞上共振框时,指标会自动通知你。
Kalman VWAP Filter [BackQuant]Kalman VWAP Filter
A precision-engineered price estimator that fuses Kalman filtering with the Volume-Weighted Average Price (VWAP) to create a smooth, adaptive representation of fair value. This hybrid model intelligently balances responsiveness and stability, tracking trend shifts with minimal noise while maintaining a statistically grounded link to volume distribution.
If you would like to see my original Kalman Filter, please find it here:
Concept overview
The Kalman VWAP Filter is built on two core ideas from quantitative finance and control theory:
Kalman filtering — a recursive Bayesian estimator used to infer the true underlying state of a noisy system (in this case, fair price).
VWAP anchoring — a dynamic reference that weights price by traded volume, representing where the majority of transactions have occurred.
By merging these concepts, the filter produces a line that behaves like a "smart moving average": smooth when noise is high, fast when markets trend, and self-adjusting based on both market structure and user-defined noise parameters.
How it works
Measurement blend : Combines the chosen Price Source (e.g., close or hlc3) with either a Session VWAP or a Rolling VWAP baseline. The VWAP Weight input controls how much the filter trusts traded volume versus price movement.
Kalman recursion : Each bar updates an internal "state estimate" using the Kalman gain, which determines how much to trust new observations vs. the prior state.
Noise parameters :
Process Noise controls agility — higher values make the filter more responsive but also more volatile.
Measurement Noise controls smoothness — higher values make it steadier but slower to adapt.
Filter order (N) : Defines how many parallel state estimates are used. Larger orders yield smoother output by layering multiple one-dimensional Kalman passes.
Final output : A refined price trajectory that captures VWAP-adjusted fair value while dynamically adjusting to real-time volatility and order flow.
Why this matters
Most smoothing techniques (EMA, SMA, Hull) trade off lag for smoothness. Kalman filtering, however, adaptively rebalances that tradeoff each bar using probabilistic weighting, allowing it to follow market state changes more efficiently. Anchoring it to VWAP integrates microstructure context — capturing where liquidity truly lies rather than only where price moves.
Use cases
Trend tracking : Color-coded candle painting highlights shifts in slope direction, revealing early trend transitions.
Fair value mapping : The line represents a continuously updated equilibrium price between raw price action and VWAP flow.
Adaptive moving average replacement : Outperforms static MAs in variable volatility regimes by self-adjusting smoothness.
Execution & reversion logic : When price diverges from the Kalman VWAP, it may indicate short-term imbalance or overextension relative to volume-adjusted fair value.
Cross-signal framework : Use with standard VWAP or other filters to identify convergence or divergence between liquidity-weighted and state-estimated prices.
Parameter guidance
Process Noise : 0.01–0.05 for swing traders, 0.1–0.2 for intraday scalping.
Measurement Noise : 2–5 for normal use, 8+ for very smooth tracking.
VWAP Weight : 0.2–0.4 balances both price and VWAP influence; 1.0 locks output directly to VWAP dynamics.
Filter Order (N) : 3–5 for reactive short-term filters; 8–10 for smoother institutional-style baselines.
Interpretation
When price > Kalman VWAP and slope is positive → bullish pressure; buyers dominate above fair value.
When price < Kalman VWAP and slope is negative → bearish pressure; sellers dominate below fair value.
Convergence of price and Kalman VWAP often signals equilibrium; strong divergence suggests imbalance.
Crosses between Kalman VWAP and the base VWAP can hint at shifts in short-term vs. long-term liquidity control.
Summary
The Kalman VWAP Filter blends statistical estimation with market microstructure awareness, offering a refined alternative to static smoothing indicators. It adapts in real time to volatility and order flow, helping traders visualize balance, transition, and momentum through a lens of probabilistic fair value rather than simple price averaging.

Institutional Rolling VWAPs • 3 lines + editable σ bands3 rolling vwaps, time stamped, same on htf and lft for high level execution
