VWAP & Volume Correlation### **Calculating the Correlation Between VWAP (Volume-Weighted Average Price) and Volume (VOLUME) Over a Period of Time**
#### **Breakdown & Understanding**
- **VWAP (Volume-Weighted Average Price)**: Similar to an average price but weighted by volume, representing the average price at which market participants traded during a specific period.
- **VOLUME (Trading Volume)**: The total amount of assets traded over a certain period.
- **CORR (Correlation)**: Measures the relationship between two variables, ranging from **-1 to 1**:
- **Close to 1**: VWAP and volume **move in sync**—when volume increases, VWAP also rises, and when volume decreases, VWAP also falls.
- **Close to -1**: VWAP and volume **move inversely**—when volume increases, VWAP decreases, and vice versa.
- **Close to 0**: No significant relationship between VWAP and volume.
#### **Examples**
- If the correlation is **high (close to 1)**, it indicates that an increase in trading volume leads to a higher VWAP, suggesting that large amounts of capital are being traded at higher prices, which could indicate a **strong market**.
- If the correlation is **low (close to 0)**, it suggests that there is **no stable relationship** between VWAP and volume.
- If the correlation is **close to -1**, it means that **higher trading volume leads to a lower VWAP**, possibly indicating that heavy selling pressure is pushing prices down.
#### **Practical Applications**
- **Identifying Market Trends**: If VWAP and volume have a strong correlation, it could indicate that the current trend is stable.
- **Detecting Anomalies**: If the correlation suddenly drops or turns negative, it may signal a shift in market behavior, such as **large-scale selling or sudden price surges**.
#### **How to Use This Indicator**
- **When the correlation is close to 1 (Blue)**:
- VWAP and volume are moving **in sync**, suggesting a stable market trend.
- **When the correlation is close to -1 (Red)**:
- **Higher volume is causing VWAP to drop**, which could indicate institutional distribution or unusual market movements.
- **When the correlation fluctuates significantly**:
- It suggests **market sentiment is changing**, and it may be worth watching for a potential trend reversal.
By monitoring VWAP and volume correlation, traders can **better understand market conditions, detect institutional activity, and refine their trading strategies**. 🚀
스크립트에서 "VWAP"에 대해 찾기

VWAP Periodic Close [LuxAlgo]The VWAP Periodic Close script offers an advanced tool for analyzing the Volume Weighted Average Price (VWAP) across various timeframes.
This tool enables traders to visualize VWAP close levels for daily, weekly, monthly, quarterly, and yearly periods, offering a comprehensive view of price behavior across different time frames. It helps in identifying key levels where the VWAP closes at the end of each specified period.
🔶 USAGE
This script is designed to enhance your trading strategy by plotting VWAP close levels on your chart for different time periods. This helps traders easily identify historical VWAP levels and analyze price action relative to these levels, particularly useful for identifying key support and resistance levels providing insights into potential future price behavior.
Supports VWAP closes for multiple timeframes, including historical periods (e.g., 3 months back, 3 quarters back, 3 years back). The labels provide context and detailed information about the VWAP close at a specific point in time and enhance the clarity and usefulness of the VWAP data presented on the chart.
Users can toggle the display of VWAP lines for different periods and customize the colors for each timeframe (e.g., distinct colors for monthly, quarterly, and yearly closes).
🔶 SETTINGS
The script offers a range of customizable settings to tailor the analysis to your trading needs.
🔹 Volume Weighted Average Price (VWAP)
VWAP Close Level: Toggle the display of VWAP levels at the end of each period (daily, weekly, monthly, quarterly, yearly).
VWAP Origin: Toggle the display of the VWAP line for each period.
VWAP Source: Choose the data source for VWAP calculations (default is HLC3).
Historical Closes: Define the number of historical VWAP levels to plot.
Line/Label Offset: Adjust the offset for positioning lines and labels on the chart.
🔹 Themes
Theme Selection: Choose between "Day," "Night," or "Custom" themes to adjust the color scheme of VWAP lines and labels.

VWAP BreadthThe Concept
The volume-weighted average price (VWAP) is an indicator that gives the average price of a security based on both volume and price. VWAP is calculated by adding up the dollars traded (price*volume) and dividing it by the total volume. Generally speaking, prices above VWAP is bullish, while prices below VWAP is bearish.
VWAP can also be used as a breadth indicator, represented by the % of stocks above VWAP (orange line in above chart). However, the raw data of daily VWAP breadth is extremely noisy and hard for traders to decipher any tradable pattern.
This script aims to address this issue by adding multiple bars of VWAP breadth together, and then calculating the mean and standard deviation (STDEV) of previous accumulated VWAP breadth values.
The Signals:
20 days of accumulated VWAP breadth shows that:
1. Big market (S&P500 or Nasdaq) rallies happen when VWAP breadth is above mean.
2. Big market selloffs happen when VWAP breadth is below mean.
3. VWAP breadth above +2 STDEV is overbought but still bullish (overbought suggests strong buying interest despite the potential for a temporary pullback).
4. VWAP breadth below -2 STDEV is oversold but still bearish (oversold suggests strong selling interest despite the potential for a temporary rebound).
5. A VWAP breadth decreasing during an uptrend forms a bearish divergence.
6. A VWAP breadth increasing during a downtrend forms a bullish divergence.
The Variables:
Users can change how many bars of data to add together. I personally use 20 bars of accumulated data in daily charts.
The STDEV lookback period has a default value of 1000 bars, and does not need to be changed unless users experience lag.

[Top] VWAP + RSI Divergence IndicatorThe “VWAP RSI Divergence Indicator” combines the Volume Weighted Average Price (VWAP), Relative Strength Index (RSI), divergence detection, and volume confirmation to identify high-probability trading opportunities.
How It Works:
The indicator integrates three powerful methodologies:
1. Volume Weighted Average Price (VWAP):
VWAP calculates an average price weighted by volume, providing critical insights into the fair value of an asset within the trading session.
Includes standard deviation bands (+1/-1 and +2/-2) around the VWAP, offering key levels of support, resistance, and price extremities.
2. Relative Strength Index (RSI):
A momentum oscillator that measures the speed and change of recent price movements.
RSI levels define overbought and oversold conditions, offering traders insight into potential reversal zones.
3. Divergence Detection:
Identifies divergences between price action and RSI, signaling potential reversals or continuations.
Detects both Regular Divergences (signifying potential reversals) and Hidden Divergences (indicating possible continuation of current trends).
Core Features:
Real-Time Divergence Detection: Automatically detects and clearly labels Regular and Hidden Divergences with included tooltips to help you identify trading opportunities.
VWAP and Standard Deviation Bands: Visualizes important dynamic support/resistance levels on the chart.
RSI-Based Heat Map: Offers intuitive heat map coloring between standard deviation bands, colored dynamically according to RSI levels and divergence activity.
Optional Volume-Based Candle Coloring: Enhances visual insight by coloring candles according to volume relative to a moving average.
Customizable Alerts: Provides alerts for divergences and standard deviation band breaches, enabling traders to act swiftly.
What Makes It Unique:
Integrated Divergence and VWAP Analysis: Unlike typical divergence indicators, this tool uniquely combines RSI divergence signals with VWAP analysis, enhancing signal reliability by considering both price momentum and volume-weighted price dynamics.
Dynamic RSI Heat Map and Volume Coloring: Incorporates advanced visual customization through dynamic coloring based on RSI levels and divergences, as well as volume-based bar coloring, designed to allow you to understand detailed information at a glance.
How to Use:
Identify Divergences: Watch for divergence labels indicating potential reversals (Regular Divergence) or continuations (Hidden Divergence).
Monitor VWAP Bands: Use VWAP bands as dynamic support/resistance levels, particularly observing price reactions at +1/-1 and +2/-2 standard deviation extremes.
Volume Confirmation: Combine divergence signals with volume-colored bars to confirm strength or weakness behind potential moves.
Leverage Alerts: Enable customizable alerts to stay promptly informed about key divergences and price extremes, ensuring timely decision-making.

Neural Adaptive VWAPNeural Adaptive VWAP with ML Features is an advanced trading indicator that enhances traditional Volume Weighted Average Price (VWAP) calculations through machine learning-inspired adaptive algorithms and predictive volume modeling.
🌟 Key Features:
🧠 Machine Learning-Inspired Adaptation
Dynamic weight adjustment system that learns from prediction errors
Multi-feature volume prediction using time-of-day patterns, price momentum, and volatility
Adaptive learning mechanism that improves accuracy over time
📊 Enhanced VWAP Calculation
Combines actual and predicted volume for forward-looking VWAP computation
Session-based reset with proper daily anchoring
Confidence bands based on rolling standard deviation for dynamic support/resistance
🎯 Advanced Signal Generation
Volume-confirmed crossover signals to reduce false entries
Color-coded candle visualization based on VWAP position
Multi-level strength indicators (strong/weak bullish/bearish zones)
⚙️ Intelligent Feature Engineering
Normalized volume analysis with statistical z-score
Time-series pattern recognition for intraday volume cycles
Price momentum and volatility integration
Sigmoid activation functions for realistic predictions
📈 How It Works:
The indicator employs a sophisticated feature engineering approach that extracts meaningful patterns from:
Volume Patterns: Normalized volume analysis and historical comparisons
Temporal Features: Time-of-day and minute-based cyclical patterns
Market Dynamics: Price momentum, volatility, and rate of change
Adaptive Learning: Error-based weight adjustment similar to neural network training
Unlike static VWAP indicators, this system continuously adapts its calculation methodology based on real-time market feedback, making it more responsive to changing market conditions while maintaining the reliability of traditional VWAP analysis.
🔧 Customizable Parameters:
VWAP Length (1-200 bars)
Volume Pattern Lookback (5-50 periods)
Learning Rate (0.001-0.1) for adaptation speed
Prediction Horizon (1-10 bars ahead)
Adaptation Period for weight updates
📊 Visual Elements:
Blue Line: Adaptive VWAP with predictive elements
Red/Green Bands: Dynamic confidence zones
Colored Candles: Position-based strength visualization
Signal Arrows: Volume-confirmed entry points
Info Table: Real-time performance metrics and weight distribution
🎯 Best Use Cases:
Intraday Trading: Enhanced execution timing with volume prediction
Institutional-Style Execution: Improved VWAP-based order placement
Trend Following: Adaptive trend identification with confidence zones
Support/Resistance Trading: Dynamic levels that adjust to market conditions

VWAP Direction HistogramThe ** VWAP Direction Histogram ** indicator is a powerful tool for traders looking to gauge the directional bias of the Volume Weighted Average Price (VWAP). VWAP is a critical metric that combines price and volume to provide a weighted average price, often used to identify institutional trading activity and support/resistance levels. This indicator builds upon the traditional VWAP by calculating its directional changes over a customizable lookback period, providing clear visual cues to traders through a color-coded histogram.
By identifying whether VWAP is rising or falling over the specified lookback period, this indicator helps traders determine the prevailing trend bias in the market. A positive VWAP direction suggests upward momentum and a bullish trend bias, while a negative direction indicates downward momentum and bearish sentiment. This information is further reinforced by coloring the chart candles based on the VWAP trend, enabling quick visual analysis and enhancing decision-making for trend-following strategies. Whether you're trading intraday or longer-term, the ** VWAP Direction Histogram ** offers an intuitive and effective way to align your trades with market trends.

Fixed Range Anchored VWAPFixed Range Anchored VWAP
Description:
This indicator expands upon the popular Anchored VWAP concept by introducing user-defined start and end dates, allowing traders to select and analyze specific zones of interest. The VWAP is a widely recognized benchmark utilized by traders to assess the average price paid for a security, factoring in both volume and price. By incorporating volume data, the VWAP offers a comprehensive view of market sentiment and provides significant insights into intraday price action.
The Fixed Range Anchored VWAP takes the VWAP concept a step further by enabling traders to define a custom start and end date. This feature allows them to zoom in on specific periods of interest, such as earnings announcements, major news events, or significant price swings. By narrowing the focus to a specific time range, traders can gain a more detailed understanding of how the VWAP interacts with price movements within that specific zone.
How to Use:
1. Set the Start and End Dates: Define the desired start and end dates for the analysis period.
2. Analyze Price Movements: Observe how the VWAP interacts with price action within the defined range.

Nifty VWAPVWAP - Volume-Weighted Average price (VWAP)
The script draws Daily VWAP for Nifty , based on Futures Volume or underlying Index Stocks based on user input
NIFTY INDICES IS WIEGHTAGE OF 50 STOCKS AS DECIDED BY EXCHANGE.
NIFTY VWAP CALCULATES COMBINED VWAP OF THESE 50 STOCKS AND GENERATES VWAP FOR NIFTY
It works with BANKNIFTY as well. Please change the Symbol and Futures Volume symbol to "NSE:BANKNIFTY" and "NSE:BANKNIFTY1!"
BANK NIFTY INDICES IS WIEGHTAGE OF 12 STOCKS AS DECIDED BY EXCHANGE.
BANK NIFTY VWAP CALCULATES COMBINED VWAP OF THESE 12 STOCKS AND GENERATES VWAP FOR BANK NIFTY
This script is intended for educational purposes only.
26/06/2022 WEIGHT AGE OF INDEX STOCKS (%)
RELIANCE INDS = 12.51
HDFCBANK = 8.38
INFY = 7.58
ICICIBANK = 7.21
HDFC = 5.75
TCS = 4.8
KOTAKBANK = 3.74
ITC = 3.26
HINDUNILVR = 2.89
LT = 2.75
AXISBANK = 2.49
SBIN = 2.47
BHARTIARTL = 2.28
BAJFINANCE = 2.23
ASIANPAINT = 1.78
HCLTECH = 1.52
MARUTI = 1.46
M_M = 1.36
SUNPHARMA = 1.28
TITAN = 1.27
TATASTEEL = 1.17
TATAMOTORS = 1.1
POWERGRID = 1.1
BAJAJFINSV = 1.08
NTPC = 1.02
TECHM = 1.01
ULTRACEMCO = 0.97
WIPRO = 0.97
NESTLEIND = 0.87
HINDALCO = 0.85
INDUSINDBK = 0.83
HDFCLIFE = 0.77
ONGC = 0.76
GRASIM = 0.74
DRREDDY = 0.73
JSWSTEEL = 0.73
ADANIPORTS = 0.73
SBILIFE = 0.71
CIPLA = 0.71
BAJAJ_AUTO = 0.69
TATACONSUM = 0.63
DIVISLAB = 0.63
UPL = 0.59
BRITANNIA = 0.59
APOLLOHOSP = 0.56
COALINDIA = 0.56
EICHERMOT = 0.53
HEROMOTOCO = 0.5
BPCL = 0.43
SHREECEM = 0.41

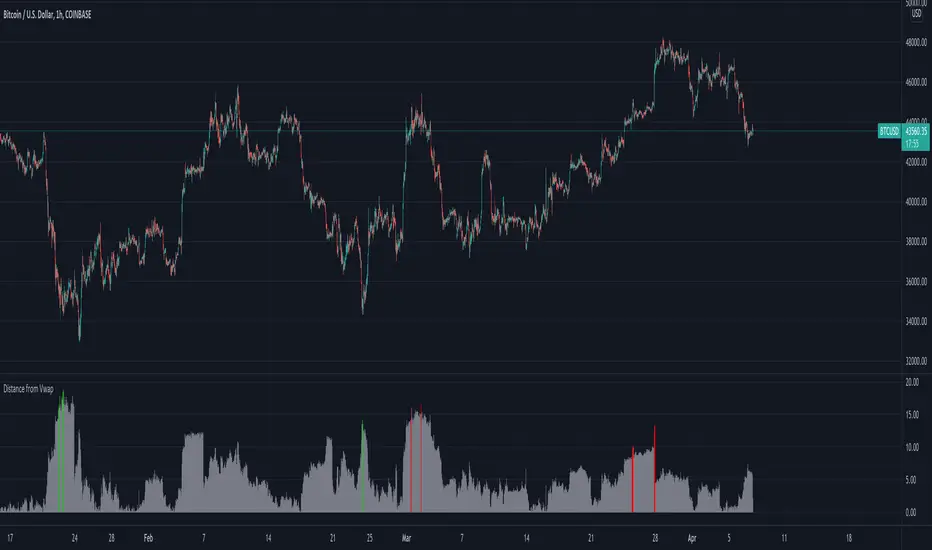
Distance from Vwap// How it Works \\
Measuring the distance of the close price from a higher timeframe VWAP - Volume Weighted Average Price
There is a threshold which is calculated by looking back at the previous x amount of bars and storing the highest/lowest values
If the distance from the vwap stretches above that threshold, the histogram will go green if price is above VWAP and red if its below the vwap
If the distance from the vwap reaches below the low threshold you will see the histogram flashes orange
// Settings \\
In the settings you have the ability to change what timeframe the indicator is calculated on, as well as this you can change the timeframe the VWAP is calculated on.
I always recommend using a higher timeframe vwap as they tend to me more respected
e.g on the hourly timeframe, I use the weekly VWAP, on 1 minute timeframe you may want to use 4 hour timeframe but obviously feel free to experiment
// Use Case \\
When histogram is flashing green, prices is pulling far away from the vwap, obviously you don't want to be buying a falling knife but if you have levels of confluence this can help spot reversals.
I personally wait until the first candle after its been green to get confirmation of the fall weakening. Vica versa for reds and shorts/sells.
When you see orange flashes, this shows that price has been consolidating and the price is very close to the higher time frame VWAP which could be considered a safe entry point as they tend to lead to a big move to follow
// Suggestions \\
Happy for anyone to make any suggestions on changes which could improve the script,
// Terms \\
Feel free to use the script, If you do use the script could you please just tag me as I am interested to see how people are using it. Good Luck!
VWAP Multiple [Huntersull]This is a VWAP/Price multiple analysis, in the same vein as something like the Mayer multiple.
It finds the VWAP of price and volume starting at the bar you choose when initiating the script (You can also drag the starting point line on the chart to change it later), and calculates the running VWAP total for every following bar until the current bar.
It then takes the hlc3 of price for each bar and divides it by the VWAP value of that bar, giving a multiple over VWAP price.
This is then charted with your choice of an SMA, EMA, or WMA using VWAP as the source, and a default length of 200, which is also modifiable.
When VWAP is over the moving average, it is filled green. When VWAP is below the moving average, it is filled red.
--------------------------------------------
This is not meant to be a trading indicator, but a tool for general bull/bear market and trend analysis. Use at your own risk.

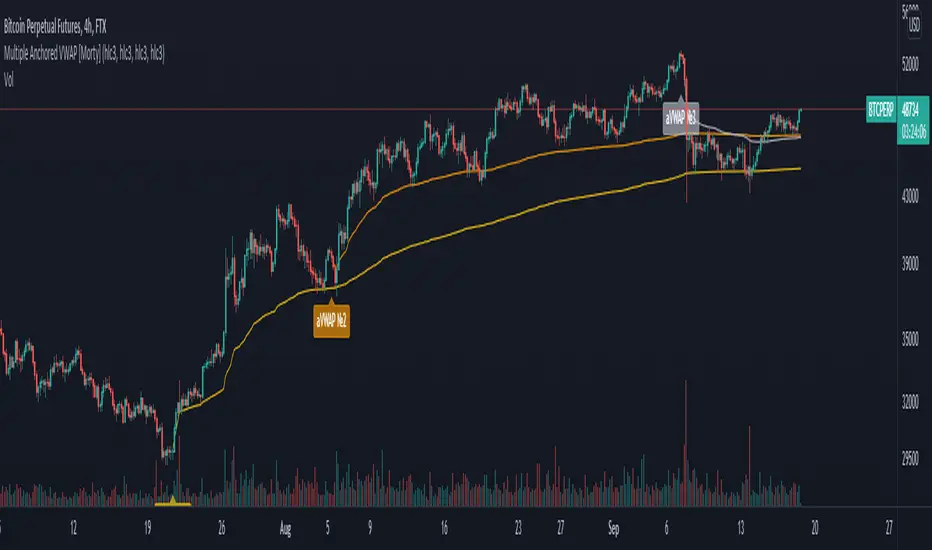
Multiple Anchored VWAP [Morty]The Anchored VWAP (aVWAP) indicator ties VWAP calculations to a specific price bar chosen by the trader. Anchored VWAP allows you to specify the price bar where calculations begin, making it easy to see whether the bulls or bears have been in charge since a very specific point in time. The starting price bar that is chosen generally marks a shift in market psychology, such as a significant high or low, earnings, news, or other announcements. The Anchored VWAP line is charted using price and volume data from that significant event onward.
This indicator plots up to 4 aVWAP lines in the chart.
Features:
- plot up to 4 aVWAP lines
- custom start date of aVWAP
- custom line color
- optional label of starting price bar
- optional custom resolution
----------------------------------------------------
锚定VWAP(aVWAP)指标将VWAP的计算与交易者选择的特定价格柱联系起来。锚定VWAP允许你指定计算开始的价格柱,使你很容易看到自一个非常具体的时间点以来,是牛市还是熊市在起作用。所选择的起始价格条通常标志着市场心理的转变,如一个重要的高点或低点、收益、新闻或其他公告。锚定VWAP线是使用从该重大事件开始的价格和成交量数据绘制的。
该指标在图表中最多绘制了4条aVWAP线。
特色:
- 绘制多达4条aVWAP线
- 自定义aVWAP的开始日期
- 自定义线的颜色
- 可选的起始价格条的标签
- 可选的自定义分辨率
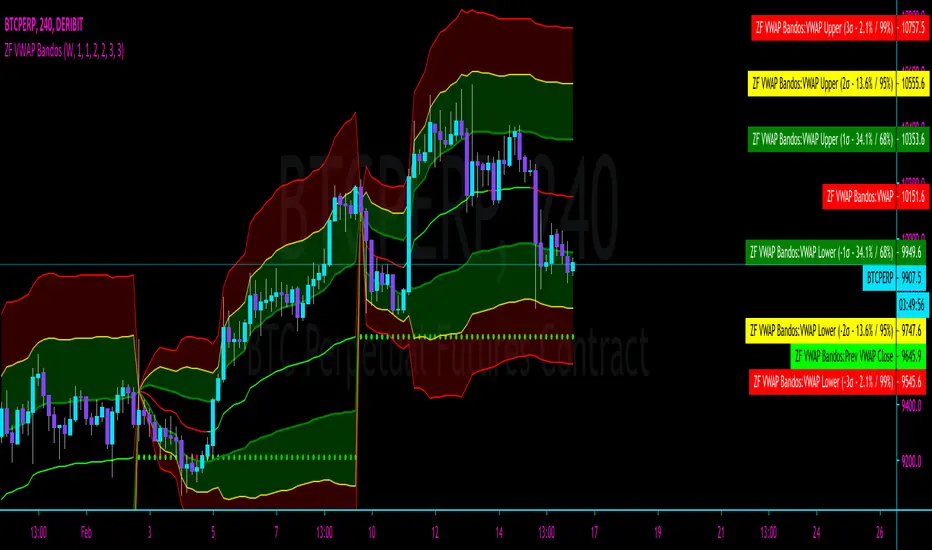
ZFelds' OrderFlow VWAP BandosVWAP with 3 standard deviations, based on the "Orderflow VWAP from NinjaTrader.
When Price is ABOVE VWAP = VWAP turns GREEN
When Price is BELOW VWAP = VWAP turns RED
The Standard Deviation Bands are considered "echoes" of the VWAP with different multipliers, acting as support/resistance and areas of interest.
Big thanks to @CryptoMF and @Barnz from The Cave for the assistance with this indicator.
VWAP Anomaly V1I made some late reading yesterday and discovered the importance of the VWAP indicator, above all the idea that when the current price exits it it will always bounce back. Therefore I decided to build an indicator which detects when the current price escapes the VWAP margin. The indicator shows this three things:
1) When the current price exits the VWAP margin.
2) The strength of a VWAP trend
3) VWAP bounce point (Blue dots which can be used as support or resistance)
By using the VWAP Anomaly V1 indicator, you can know if you find yourself in a reversal zone, and get a great entry point. Please, do have in mind no indicator is perfect, by using other indicator with the VWAP Anomaly Indicator your chances of success increase by a significant level. NOTE: Follow my predictions under your own risk

Multi-Day VWAP
Chart the multi-day Volume Weighted Average Price ( VWAP ). Normally, the VWAP is tracked for the current day, from the first bar of the day (regular or extended session). The VWAP shows the current value of:
-> sum(hlc3 * volume , barsForDay) / sum( volume , barsForDay),
-> where 'barsForDay' is the total number bars that have elapsed during the day for the chart interval.
The multi-day version tracks the VWAP for N days back, by averaging the previous N - 1 day bars VWAP and the current VWAP for the current bar (chart interval).
This is very different that simply using a volume weighted moving average , since the closing VWAP values are used for the historical day bars. The results are interesting for intraday trades... especially for values of 1, 2, 3, 4, and 5 days.
Enjoy.

Moving VWAP-KAMA CloudMoving VWAP-KAMA Cloud
Overview
The Moving VWAP-KAMA Cloud is a high-conviction trend filter designed to solve a major problem with standard indicators: Noise. By combining a smoothed Volume Weighted Average Price (MVWAP) with Kaufman’s Adaptive Moving Average (KAMA), this indicator creates a "Value Zone" that identifies the true structural trend while ignoring choppy price action.
Unlike brittle lines that break constantly, this cloud is "slow" by design—making it exceptionally powerful for spotting genuine trend reversals and filtering out fakeouts.
How It Works
This script uses a unique "Double Smoothing" architecture:
The Anchor (MVWAP): We take the standard VWAP and smooth it with a 30-period EMA. This represents the "Fair Value" baseline where volume has supported price over time.
The Filter (KAMA): We apply Kaufman's Adaptive Moving Average to the already smoothed MVWAP. KAMA is unique because it flattens out during low-volatility (choppy) periods and speeds up during high-momentum trends.
The Cloud:
Green/Teal Cloud: Bullish Structure (MVWAP > KAMA)
Purple Cloud: Bearish Structure (MVWAP < KAMA)
🔥 The "Reversal Slingshot" Strategy
Backtests reveal a powerful behavior during major trend changes, particularly after long bear markets:
The Resistance Phase: During a long-term downtrend, price will repeatedly rally into the Purple Cloud and get rejected. The flattened KAMA line acts as a "concrete ceiling," keeping the bearish trend intact.
The Breakout & Flip: When price finally breaks above the cloud with conviction, and the cloud flips Green, it signals a structural regime change.
The "Slingshot" Retest: Often, immediately after this flip, price will drop back into the top of the cloud. This is the "Slingshot" moment. The old resistance becomes new, hardened support.
The Rally: From this support bounce, stocks often launch into a sustained, multi-month bull run. This setup has been observed repeatedly at the bottom of major corrections.
How to Use This Indicator
1. Dynamic Support & Resistance
The KAMA Wall: When price retraces into the cloud, the KAMA line often flattens out, acting as a hard "floor" or "wall." A break of this wall usually signals a genuine trend change, not just a stop hunt.
2. Trend Confirmation (Regime Filter)
Bullish Regime: If price is holding above the cloud, only look for Long setups.
Bearish Regime: If price is holding below the cloud, only look for Short setups.
No-Trade Zone: If price is stuck inside the cloud, the market is traversing fair value. Stand aside until a clear winner emerges.
3. Multi-Timeframe Versatility
While designed for trend confirmation on higher timeframes (4H, Daily), this indicator adapts beautifully to lower timeframes (5m, 15m) for intraday scalping.
On Lower Timeframes: The cloud reacts much faster, acting as a dynamic "VWAP Band" that helps intraday traders stay on the right side of momentum during the session.
Settings
Moving VWAP Period (30): The lookback period for the base VWAP smoothing.
KAMA Settings (10, 10, 30): Controls the sensitivity of the adaptive filter.
Cloud Transparency: Adjust to keep your chart clean.
Alerts Included
Price Cross Over/Under MVWAP
Price Cross Over/Under KAMA
Cloud Flip (Bullish/Bearish Trend Change)
Tip for Traders
This is not a signal entry indicator. It is a Trend Conviction tool. Use it to filter your entries from faster indicators (like RSI or MACD). If your fast indicator signals "Buy" but the cloud is Purple, the probability is low. Wait for the Cloud Flip

Simple VWAP + BandsSimple VWAP + Bands
A clean and customizable VWAP (Volume Weighted Average Price) indicator with standard deviation bands and RTH (Regular Trading Hours) session support.
Features:
- VWAP Line: Volume-weighted average price calculation
- Three Standard Deviation Bands: Configurable bands at 1σ, 2σ, and 3σ levels (above and below VWAP)
- RTH Session Support: Option to calculate VWAP only during regular trading hours
- Customizable Session Times: Configure your own trading session hours and timezone
- Clean Visualization: Line breaks between sessions prevent messy connections across non-trading periods
- Toggle Bands: Show/hide individual standard deviation bands as needed
Use Cases:
- Identify overbought/oversold conditions relative to volume-weighted price
- Track price deviation from VWAP during trading sessions
- Support and resistance levels based on standard deviations
- Mean reversion trading strategies

Kalman Based VWAP [EdgeTerminal]Kalman VWAP is a different take on volume-weighted average price (VWAP) indicator where we enhance the results with Kalman filtering and dynamic wave visualization for a more smooth and improved trend identification and volatility analysis.
A little bit about Kalman Filter:
Kalman filtering (also known as linear quadratic estimation) is an algorithm that uses a series of measurements observed over time, including statistical noise and other inaccuracies, to produce estimates of unknown variables that tend to be more accurate than those based on a single measurement, by estimating a joint probability distribution over the variables for each time-step. The filter is constructed as a mean squared error minimiser, but an alternative derivation of the filter is also provided showing how the filter relates to maximum likelihood statistics
This indicator combines:
Volume-Weighted Average Price (VWAP) for institutional price levels
Kalman filtering for noise reduction and trend smoothing
Dynamic wave visualization for volatility zones
This creates a robust indicator that helps traders identify trends, support/resistance zones, and potential reversal points with high precision.
What makes this even more special is the fact that we use open price as a data source instead of usual close price. This allows you to tune the indicator more accurately when back testing it and generally get results that are closer to real time market data.
The math:
In case if you're interested in the math of this indicator, the indicator employs a state-space Kalman filter model:
State Equation: x_t = x_{t-1} + w_t
Measurement Equation: z_t = x_t + v_t
x_t is the filtered VWAP state
w_t is process noise ~ N(0, Q)
v_t is measurement noise ~ N(0, R)
z_t is the traditional VWAP measurement
The Kalman filter recursively updates through:
Prediction: x̂_t|t-1 = x̂_{t-1}
Update: x̂_t = x̂_t|t-1 + K_t(z_t - x̂_t|t-1)
Where K_t is the Kalman gain, optimally balancing between prediction and measurement.
Input Parameters
Measurement Noise: Controls signal smoothing (0.0001 to 1.0)
Process Noise: Adjusts trend responsiveness (0.0001 to 1.0)
Wave Size: Multiplier for volatility bands (0.1 to 5.0)
Trend Lookback: Period for trend determination (1 to 100)
Bull/Bear Colors: Customizable color schemes
Application:
I recommend using this along other indicators. This is best used for assets that don't have a close time, such as BTC but can be used with anything as long as the data is there.
With default settings, this works better for swing trades but you can adjust it for day trading as well, by adjusting the lookback and also process noise.

VWAP SpiderThe VWAP Spider indicator enhances the conventional Volume Weighted Average Price (VWAP) analysis by anchoring it to the first candle and incorporating an extensive series of standard deviation (SD) lines, extending up to +8 SDs with additional half-step increments. This configuration provides a more suitable set of lines for identifying support and resistance, distinguishing it from existing VWAP and SD indicators. Its design, featuring color gradients for fills and distinct labels for each line, aims to improve the utility and user experience.
Optimal Timeframes:
It is recommended for use on weekly or monthly resolutions to ensure all price and volume history is included.
Distinctive Features:
The indicator includes a more extensive array of SD lines than typically found in VWAP indicators, enhancing the depth of market analysis.
The visual presentation is optimized with color gradients and clear labeling, facilitating ease of use and integration into trading strategies.
Practical Use of the VWAP Spider:
SD Lines as Support and Resistance : Observe the interactions between the price and the SD lines closely. These can serve as dynamic support and resistance indicators, influencing trading decisions.
Analyzing Historical Price Action : Investigate how the price has historically interacted with the SD lines. Identify which lines have frequently acted as support and resistance in the past, as they will often continue to be revisited.
Strategic Application : Leverage insights from the interactions between price and SD lines to fine-tune entry and exit points. For example, a rebound from an SD line may suggest a strong entry point, while breaching an SD line could indicate a potential exit.
This indicator is freely available and open-source on TradingView for all. It is designed to help traders enhance their market analysis and strategic decision-making.

VWAP Oscillator (Normalised)Thanks:
Thanks to upslidedown for his VWAP Oscillator that served as the inspiration for this normalised version.
Core Aspects:
The script calculates the VWAP by considering both volume and price data, offering a comprehensive view of market activity.
Uses an adaptive normalization function to balance the data, ensuring that the VWAP reflects current market conditions accurately.
The oscillator includes customizable settings such as VWAP source, lookback period, and buffer percentage.
Provides a clear visual representation of market trends.
Usage Summary:
Detect divergences between price and oscillator for potential trend reversals.
Assess market momentum with oscillator’s position relative to the zero line.
Identify overbought and oversold conditions to anticipate market corrections.
Use volume-confirmed signals for enhanced reliability in trend strength assessments.

VWAP angle TrendThe VWAP Angle Trend is an indicator built with the aim of providing valuable insights into the reversal points of the #VWAP using Angle
This is achieved by calculating the angle between the current VWAP and its previous value over a customizable lookback period and normalizing it with ATR
By analyzing the angle, we can gain an understanding of the strength and direction of the VWAP, which can help them identify potential trend reversals or continuations.
After observing the market over a lengthy period, I have come to realize that as the angle increases above 65 or decreases under -65 , it confirms a higher likelihood of a trend reversal.
the indicator highlights these zones where a trend reversal is more likely to occur.
The indicator can help you to assess the strength and direction of VWAP, enabling you to make more informed trading decisions.
By identifying periods of strong momentum or potential exhaustion, you can seek opportunities for entering or exiting positions, and potentially capitalize on trend movements in the market.

NSDT Horizontal VWAPThis script plots VWAP as a horizontal line starting at the most recent candle and extending backwards for a period of 10 to make it easier to see. (default is 10 but can be changed to fit your needs)
You may only want to see where VWAP is currently and not need to see the entire day. Helps keep the chart clean.
Colors and line settings can all be modified.
You can show the original VWAP plot as well for reference.
What Is the Volume-Weighted Average Price (VWAP)?
The volume-weighted average price (VWAP) is a technical analysis indicator used on intraday charts that resets at the start of every new trading session.
It's a trading benchmark that represents the average price a security has traded at throughout the day, based on both volume and price.
VWAP is important because it provides traders with pricing insight into both the trend and value of a security.
Multi Range VWAP PivotsMulti Range VWAP Pivots turned out to be one of my most accurate pivot indicators to date!
Multi Range VWAP Pivots works by recognizing the high and low of the timeframe selected (D, W, M, 6M, and 12M) and plotting range high to VWAP averages and range low to VWAP averages.
After further examination of each completed range, I came to the conclusion that due to the nature of averages, high and low respectively would need to be completed within the current range, for the averages to actually display pivots correctly. This means that if all averages appear to be "pivoting" correctly after or during a break lower of higher, then we can only assume the most recent break higher or lower could be exhaustion and price will be reverted to the mean (VWAP). OR, this could be the most accurate hindsight indicator on the planet.
*DISCLAIMER*: This indicator repaints. DO NOT backtest or set alerts with this indicator.

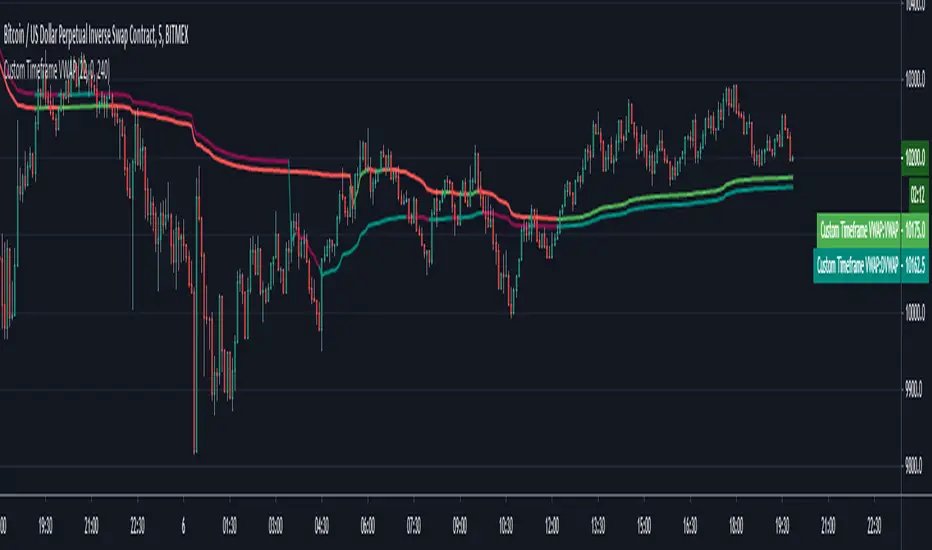
Custom Timeframe VWAPThis script calculates the daily VWAP from any specified starting point intraday. Also colors the VWAP based on whether price is above or below it.
Standard vwap starts at day open 0 GMT, however there are some exchanges for eg. Deribit that have seen they use a different time period to begin VWAP calculations. This is useful in such cases.
You need to specify the hours & minutes of the VWAP that want to use. VWAP will be hidden on any timeframe higher than specified "Highest Visible Timeframe".
Also a big thanks to u/mortdiggiddy as he helped with this script.