EMA + VWMA + ATR Smoothed BuySell (merged) - TOM ZENG 202509Logic and Functionality Analysis
The script is divided into three main logical sections: EMA trend analysis, ATR-based signal generation, and VWMA smoothing.
1. EMA Trend Analysis (EMA Fan) 📈
This section uses a series of Exponential Moving Averages (EMAs) to identify trends. You've wisely chosen a set of EMA lengths (8, 21, 50, 200) that are commonly used in trading. These numbers are often derived from the Fibonacci sequence and are believed to offer a good balance of sensitivity to recent price action while still reflecting the underlying trend.
Purpose: The EMAs serve as dynamic support and resistance levels. When the price is above the EMAs and they are fanned out in ascending order (short-term EMA above long-term EMA), it indicates a strong uptrend. Conversely, a descending order indicates a downtrend.
Customization: The code allows you to easily adjust the EMA lengths in the inputs section, giving you control over the sensitivity of your trend analysis.
2. ATR Trailing Stop (Buy/Sell Signals) 🎯
This is the core of the indicator's signal-generating capability. It uses the Average True Range (ATR) to create a dynamic trailing stop line. The ATR measures volatility, so the stop line adjusts automatically to wider price swings.
Logic: The script uses a var float variable xATRTrailingStop to store the value of the stop line from the previous bar. The code then determines the current bar's stop line by comparing the current price to the previous bar's stop line and using math.max and math.min to smoothly move the line along with the trend.
Signal Generation: The pos variable tracks whether the trend is long (pos = 1) or short (pos = -1). The isLong and isShort variables act as a state machine, ensuring that the "Buy" and "Sell" signals are only triggered once at the exact point of a crossover, rather than on every subsequent bar.
Visuals & Alerts: The plotshape functions create labels directly on the chart, and the barcolor function changes the color of the candlesticks, providing a clear visual representation of the current trend state. The alertcondition functions are crucial for automation, allowing you to set up notifications for when a signal occurs.
3. VWMA and Combined Average 🌊
This section introduces a Volume-Weighted Moving Average (VWMA), which gives more weight to periods of high trading volume. This makes the VWMA more responsive to significant moves that are backed by strong institutional buying or selling.
Combined Logic: The avg1 variable creates a new line by averaging the VWMA and the xATRTrailingStop line. This is an innovative approach to blend two different types of analysis—volume-based trend and volatility-based risk management—into a single, smoothed line. It can act as an additional filter or a unique trading signal on its own.
Summary
Your code is a very effective and clean example of a multi-faceted indicator. It correctly implements a robust ATR trailing stop for signals while also providing valuable trend context through EMAs and volume analysis through VWMA. The combination of these elements makes it a powerful tool for a trader looking for a comprehensive view of the market.
스크립트에서 "Trailing stop"에 대해 찾기

RSI Crossover AlertRSI Crossover Alert Indicator - User Guide
The RSI Crossover Alert Indicator is a comprehensive technical analysis tool that detects multiple types of RSI crossovers and generates real-time alerts. It combines traditional RSI analysis with signal lines, divergence detection, and multi-level crossing alerts.
1. Multiple Crossover Detection
- RSI/Signal Line Cross: Signals a primary trend change.
- RSI/Second Signal Cross: Confirmation signals for stronger trends.
- Level Crossings: Crosses of Overbought 70, Oversold 30, and Midline 50.
- Divergence Detection: Hidden and regular divergences for reversal signals.
2. Alert Types
- Alert: RSI > Signal
Description: Bullish momentum is building.
Signal: Consider long positions.
- Alert: RSI < Signal
Description: Bearish momentum is building.
Signal: Consider short positions.
- Alert: RSI > 70
Description: Entering the overbought zone.
Signal: Prepare for a potential reversal.
- Alert: RSI < 30
Description: Entering the oversold zone.
Signal: Watch for a bounce opportunity.
- Alert: RSI crosses 50
Description: A shift in momentum.
Signal: Trend confirmation.
3. Visual Components
- Lines: RSI blue, Signal orange, Second Signal purple
- Histogram: Visualizes momentum by showing the difference between RSI and the Signal line.
- Background Zones: Red overbought, Green oversold
- Markers: Up/down triangles to indicate crossovers.
- Info Table: Real-time RSI values and status.
Strategy 1: Classic Crossover
- Entry Long: RSI crosses above the Signal Line AND RSI is below 50.
- Entry Short: RSI crosses below the Signal Line AND RSI is above 50.
- Take Profit: On the opposite signal.
- Stop Loss: At the recent swing high/low.
Strategy 2: Extreme Zone Reversal
- Entry Long: RSI is below 30 and crosses above the Signal Line.
- Entry Short: RSI is above 70 and crosses below the Signal Line.
- Risk Management: Higher win rate but fewer signals. Use a minimum 2:1 risk-reward ratio.
Strategy 3: Divergence Trading
- Setup: Enable divergence alerts and look for price/RSI divergence. Wait for an RSI crossover for confirmation.
- Entry: Enter on the crossover after the divergence appears. Place the stop loss beyond the starting point of the divergence.
Strategy 4: Multi-Timeframe Confirmation
1. Check the higher timeframe e.g. Daily to identify the main trend.
2. Use the current timeframe e.g. 4H/1H for your entry.
3. Only enter in the direction of the main trend.
4. Use the RSI crossover as the entry trigger.
Optimal Settings by Market
- Forex Major Pairs
RSI Length: 14, Signal Length: 9, Overbought/Oversold: 70/30
- Crypto High Volatility
RSI Length: 10-12, Signal Length: 6-8, Overbought/Oversold: 75/25
- Stocks Trending
RSI Length: 14-21, Signal Length: 9-12, Overbought/Oversold: 70/30
- Commodities
RSI Length: 14, Signal Length: 9, Overbought/Oversold: 80/20
Risk Management Rules
1. Position Sizing: Never risk more than 1-2% on a single trade. Reduce size in ranging markets.
2. Stop Loss Placement: Place stops beyond the recent swing high/low for crossovers. Using an ATR-based stop is also effective.
3. Profit Taking: Take partial profits at a 1:1 risk-reward ratio. Switch to a trailing stop after reaching 2:1.
1. Filtering Signals
- Combine with volume indicators.
- Confirm the trend on a higher timeframe.
- Wait for candlestick pattern confirmation.
2. Avoid Common Mistakes
- Don't trade every single crossover.
- Avoid taking signals against a strong trend.
- Do not ignore risk management.
3. Market Conditions
- Trending Market: Focus on midline 50 crosses.
- Ranging Market: Look for reversals from overbought/oversold levels.
- Volatile Market: Widen the overbought/oversold levels.
- If you get too many false signals:
Increase the signal line period, add other confirmation indicators, or use a higher timeframe.
- If you are missing major moves:
Decrease the RSI length, shorten the signal line period, or check your alert settings.
Recommended Combinations
1. RSI + MACD: For dual momentum confirmation.
2. RSI + Bollinger Bands: For volatility-adjusted signals.
3. RSI + Volume: To confirm the strength of a signal.
4. RSI + Moving Averages: To use as a trend filter.
This indicator provides a comprehensive RSI analysis. Success depends on proper configuration, risk management, and combining signals with the overall market context. Start with the default settings, then optimize based on your trading style and market conditions.

Markov Chain [3D] | FractalystWhat exactly is a Markov Chain?
This indicator uses a Markov Chain model to analyze, quantify, and visualize the transitions between market regimes (Bull, Bear, Neutral) on your chart. It dynamically detects these regimes in real-time, calculates transition probabilities, and displays them as animated 3D spheres and arrows, giving traders intuitive insight into current and future market conditions.
How does a Markov Chain work, and how should I read this spheres-and-arrows diagram?
Think of three weather modes: Sunny, Rainy, Cloudy.
Each sphere is one mode. The loop on a sphere means “stay the same next step” (e.g., Sunny again tomorrow).
The arrows leaving a sphere show where things usually go next if they change (e.g., Sunny moving to Cloudy).
Some paths matter more than others. A more prominent loop means the current mode tends to persist. A more prominent outgoing arrow means a change to that destination is the usual next step.
Direction isn’t symmetric: moving Sunny→Cloudy can behave differently than Cloudy→Sunny.
Now relabel the spheres to markets: Bull, Bear, Neutral.
Spheres: market regimes (uptrend, downtrend, range).
Self‑loop: tendency for the current regime to continue on the next bar.
Arrows: the most common next regime if a switch happens.
How to read: Start at the sphere that matches current bar state. If the loop stands out, expect continuation. If one outgoing path stands out, that switch is the typical next step. Opposite directions can differ (Bear→Neutral doesn’t have to match Neutral→Bear).
What states and transitions are shown?
The three market states visualized are:
Bullish (Bull): Upward or strong-market regime.
Bearish (Bear): Downward or weak-market regime.
Neutral: Sideways or range-bound regime.
Bidirectional animated arrows and probability labels show how likely the market is to move from one regime to another (e.g., Bull → Bear or Neutral → Bull).
How does the regime detection system work?
You can use either built-in price returns (based on adaptive Z-score normalization) or supply three custom indicators (such as volume, oscillators, etc.).
Values are statistically normalized (Z-scored) over a configurable lookback period.
The normalized outputs are classified into Bull, Bear, or Neutral zones.
If using three indicators, their regime signals are averaged and smoothed for robustness.
How are transition probabilities calculated?
On every confirmed bar, the algorithm tracks the sequence of detected market states, then builds a rolling window of transitions.
The code maintains a transition count matrix for all regime pairs (e.g., Bull → Bear).
Transition probabilities are extracted for each possible state change using Laplace smoothing for numerical stability, and frequently updated in real-time.
What is unique about the visualization?
3D animated spheres represent each regime and change visually when active.
Animated, bidirectional arrows reveal transition probabilities and allow you to see both dominant and less likely regime flows.
Particles (moving dots) animate along the arrows, enhancing the perception of regime flow direction and speed.
All elements dynamically update with each new price bar, providing a live market map in an intuitive, engaging format.
Can I use custom indicators for regime classification?
Yes! Enable the "Custom Indicators" switch and select any three chart series as inputs. These will be normalized and combined (each with equal weight), broadening the regime classification beyond just price-based movement.
What does the “Lookback Period” control?
Lookback Period (default: 100) sets how much historical data builds the probability matrix. Shorter periods adapt faster to regime changes but may be noisier. Longer periods are more stable but slower to adapt.
How is this different from a Hidden Markov Model (HMM)?
It sets the window for both regime detection and probability calculations. Lower values make the system more reactive, but potentially noisier. Higher values smooth estimates and make the system more robust.
How is this Markov Chain different from a Hidden Markov Model (HMM)?
Markov Chain (as here): All market regimes (Bull, Bear, Neutral) are directly observable on the chart. The transition matrix is built from actual detected regimes, keeping the model simple and interpretable.
Hidden Markov Model: The actual regimes are unobservable ("hidden") and must be inferred from market output or indicator "emissions" using statistical learning algorithms. HMMs are more complex, can capture more subtle structure, but are harder to visualize and require additional machine learning steps for training.
A standard Markov Chain models transitions between observable states using a simple transition matrix, while a Hidden Markov Model assumes the true states are hidden (latent) and must be inferred from observable “emissions” like price or volume data. In practical terms, a Markov Chain is transparent and easier to implement and interpret; an HMM is more expressive but requires statistical inference to estimate hidden states from data.
Markov Chain: states are observable; you directly count or estimate transition probabilities between visible states. This makes it simpler, faster, and easier to validate and tune.
HMM: states are hidden; you only observe emissions generated by those latent states. Learning involves machine learning/statistical algorithms (commonly Baum–Welch/EM for training and Viterbi for decoding) to infer both the transition dynamics and the most likely hidden state sequence from data.
How does the indicator avoid “repainting” or look-ahead bias?
All regime changes and matrix updates happen only on confirmed (closed) bars, so no future data is leaked, ensuring reliable real-time operation.
Are there practical tuning tips?
Tune the Lookback Period for your asset/timeframe: shorter for fast markets, longer for stability.
Use custom indicators if your asset has unique regime drivers.
Watch for rapid changes in transition probabilities as early warning of a possible regime shift.
Who is this indicator for?
Quants and quantitative researchers exploring probabilistic market modeling, especially those interested in regime-switching dynamics and Markov models.
Programmers and system developers who need a probabilistic regime filter for systematic and algorithmic backtesting:
The Markov Chain indicator is ideally suited for programmatic integration via its bias output (1 = Bull, 0 = Neutral, -1 = Bear).
Although the visualization is engaging, the core output is designed for automated, rules-based workflows—not for discretionary/manual trading decisions.
Developers can connect the indicator’s output directly to their Pine Script logic (using input.source()), allowing rapid and robust backtesting of regime-based strategies.
It acts as a plug-and-play regime filter: simply plug the bias output into your entry/exit logic, and you have a scientifically robust, probabilistically-derived signal for filtering, timing, position sizing, or risk regimes.
The MC's output is intentionally "trinary" (1/0/-1), focusing on clear regime states for unambiguous decision-making in code. If you require nuanced, multi-probability or soft-label state vectors, consider expanding the indicator or stacking it with a probability-weighted logic layer in your scripting.
Because it avoids subjectivity, this approach is optimal for systematic quants, algo developers building backtested, repeatable strategies based on probabilistic regime analysis.
What's the mathematical foundation behind this?
The mathematical foundation behind this Markov Chain indicator—and probabilistic regime detection in finance—draws from two principal models: the (standard) Markov Chain and the Hidden Markov Model (HMM).
How to use this indicator programmatically?
The Markov Chain indicator automatically exports a bias value (+1 for Bullish, -1 for Bearish, 0 for Neutral) as a plot visible in the Data Window. This allows you to integrate its regime signal into your own scripts and strategies for backtesting, automation, or live trading.
Step-by-Step Integration with Pine Script (input.source)
Add the Markov Chain indicator to your chart.
This must be done first, since your custom script will "pull" the bias signal from the indicator's plot.
In your strategy, create an input using input.source()
Example:
//@version=5
strategy("MC Bias Strategy Example")
mcBias = input.source(close, "MC Bias Source")
After saving, go to your script’s settings. For the “MC Bias Source” input, select the plot/output of the Markov Chain indicator (typically its bias plot).
Use the bias in your trading logic
Example (long only on Bull, flat otherwise):
if mcBias == 1
strategy.entry("Long", strategy.long)
else
strategy.close("Long")
For more advanced workflows, combine mcBias with additional filters or trailing stops.
How does this work behind-the-scenes?
TradingView’s input.source() lets you use any plot from another indicator as a real-time, “live” data feed in your own script (source).
The selected bias signal is available to your Pine code as a variable, enabling logical decisions based on regime (trend-following, mean-reversion, etc.).
This enables powerful strategy modularity : decouple regime detection from entry/exit logic, allowing fast experimentation without rewriting core signal code.
Integrating 45+ Indicators with Your Markov Chain — How & Why
The Enhanced Custom Indicators Export script exports a massive suite of over 45 technical indicators—ranging from classic momentum (RSI, MACD, Stochastic, etc.) to trend, volume, volatility, and oscillator tools—all pre-calculated, centered/scaled, and available as plots.
// Enhanced Custom Indicators Export - 45 Technical Indicators
// Comprehensive technical analysis suite for advanced market regime detection
//@version=6
indicator('Enhanced Custom Indicators Export | Fractalyst', shorttitle='Enhanced CI Export', overlay=false, scale=scale.right, max_labels_count=500, max_lines_count=500)
// |----- Input Parameters -----| //
momentum_group = "Momentum Indicators"
trend_group = "Trend Indicators"
volume_group = "Volume Indicators"
volatility_group = "Volatility Indicators"
oscillator_group = "Oscillator Indicators"
display_group = "Display Settings"
// Common lengths
length_14 = input.int(14, "Standard Length (14)", minval=1, maxval=100, group=momentum_group)
length_20 = input.int(20, "Medium Length (20)", minval=1, maxval=200, group=trend_group)
length_50 = input.int(50, "Long Length (50)", minval=1, maxval=200, group=trend_group)
// Display options
show_table = input.bool(true, "Show Values Table", group=display_group)
table_size = input.string("Small", "Table Size", options= , group=display_group)
// |----- MOMENTUM INDICATORS (15 indicators) -----| //
// 1. RSI (Relative Strength Index)
rsi_14 = ta.rsi(close, length_14)
rsi_centered = rsi_14 - 50
// 2. Stochastic Oscillator
stoch_k = ta.stoch(close, high, low, length_14)
stoch_d = ta.sma(stoch_k, 3)
stoch_centered = stoch_k - 50
// 3. Williams %R
williams_r = ta.stoch(close, high, low, length_14) - 100
// 4. MACD (Moving Average Convergence Divergence)
= ta.macd(close, 12, 26, 9)
// 5. Momentum (Rate of Change)
momentum = ta.mom(close, length_14)
momentum_pct = (momentum / close ) * 100
// 6. Rate of Change (ROC)
roc = ta.roc(close, length_14)
// 7. Commodity Channel Index (CCI)
cci = ta.cci(close, length_20)
// 8. Money Flow Index (MFI)
mfi = ta.mfi(close, length_14)
mfi_centered = mfi - 50
// 9. Awesome Oscillator (AO)
ao = ta.sma(hl2, 5) - ta.sma(hl2, 34)
// 10. Accelerator Oscillator (AC)
ac = ao - ta.sma(ao, 5)
// 11. Chande Momentum Oscillator (CMO)
cmo = ta.cmo(close, length_14)
// 12. Detrended Price Oscillator (DPO)
dpo = close - ta.sma(close, length_20)
// 13. Price Oscillator (PPO)
ppo = ta.sma(close, 12) - ta.sma(close, 26)
ppo_pct = (ppo / ta.sma(close, 26)) * 100
// 14. TRIX
trix_ema1 = ta.ema(close, length_14)
trix_ema2 = ta.ema(trix_ema1, length_14)
trix_ema3 = ta.ema(trix_ema2, length_14)
trix = ta.roc(trix_ema3, 1) * 10000
// 15. Klinger Oscillator
klinger = ta.ema(volume * (high + low + close) / 3, 34) - ta.ema(volume * (high + low + close) / 3, 55)
// 16. Fisher Transform
fisher_hl2 = 0.5 * (hl2 - ta.lowest(hl2, 10)) / (ta.highest(hl2, 10) - ta.lowest(hl2, 10)) - 0.25
fisher = 0.5 * math.log((1 + fisher_hl2) / (1 - fisher_hl2))
// 17. Stochastic RSI
stoch_rsi = ta.stoch(rsi_14, rsi_14, rsi_14, length_14)
stoch_rsi_centered = stoch_rsi - 50
// 18. Relative Vigor Index (RVI)
rvi_num = ta.swma(close - open)
rvi_den = ta.swma(high - low)
rvi = rvi_den != 0 ? rvi_num / rvi_den : 0
// 19. Balance of Power (BOP)
bop = (close - open) / (high - low)
// |----- TREND INDICATORS (10 indicators) -----| //
// 20. Simple Moving Average Momentum
sma_20 = ta.sma(close, length_20)
sma_momentum = ((close - sma_20) / sma_20) * 100
// 21. Exponential Moving Average Momentum
ema_20 = ta.ema(close, length_20)
ema_momentum = ((close - ema_20) / ema_20) * 100
// 22. Parabolic SAR
sar = ta.sar(0.02, 0.02, 0.2)
sar_trend = close > sar ? 1 : -1
// 23. Linear Regression Slope
lr_slope = ta.linreg(close, length_20, 0) - ta.linreg(close, length_20, 1)
// 24. Moving Average Convergence (MAC)
mac = ta.sma(close, 10) - ta.sma(close, 30)
// 25. Trend Intensity Index (TII)
tii_sum = 0.0
for i = 1 to length_20
tii_sum += close > close ? 1 : 0
tii = (tii_sum / length_20) * 100
// 26. Ichimoku Cloud Components
ichimoku_tenkan = (ta.highest(high, 9) + ta.lowest(low, 9)) / 2
ichimoku_kijun = (ta.highest(high, 26) + ta.lowest(low, 26)) / 2
ichimoku_signal = ichimoku_tenkan > ichimoku_kijun ? 1 : -1
// 27. MESA Adaptive Moving Average (MAMA)
mama_alpha = 2.0 / (length_20 + 1)
mama = ta.ema(close, length_20)
mama_momentum = ((close - mama) / mama) * 100
// 28. Zero Lag Exponential Moving Average (ZLEMA)
zlema_lag = math.round((length_20 - 1) / 2)
zlema_data = close + (close - close )
zlema = ta.ema(zlema_data, length_20)
zlema_momentum = ((close - zlema) / zlema) * 100
// |----- VOLUME INDICATORS (6 indicators) -----| //
// 29. On-Balance Volume (OBV)
obv = ta.obv
// 30. Volume Rate of Change (VROC)
vroc = ta.roc(volume, length_14)
// 31. Price Volume Trend (PVT)
pvt = ta.pvt
// 32. Negative Volume Index (NVI)
nvi = 0.0
nvi := volume < volume ? nvi + ((close - close ) / close ) * nvi : nvi
// 33. Positive Volume Index (PVI)
pvi = 0.0
pvi := volume > volume ? pvi + ((close - close ) / close ) * pvi : pvi
// 34. Volume Oscillator
vol_osc = ta.sma(volume, 5) - ta.sma(volume, 10)
// 35. Ease of Movement (EOM)
eom_distance = high - low
eom_box_height = volume / 1000000
eom = eom_box_height != 0 ? eom_distance / eom_box_height : 0
eom_sma = ta.sma(eom, length_14)
// 36. Force Index
force_index = volume * (close - close )
force_index_sma = ta.sma(force_index, length_14)
// |----- VOLATILITY INDICATORS (10 indicators) -----| //
// 37. Average True Range (ATR)
atr = ta.atr(length_14)
atr_pct = (atr / close) * 100
// 38. Bollinger Bands Position
bb_basis = ta.sma(close, length_20)
bb_dev = 2.0 * ta.stdev(close, length_20)
bb_upper = bb_basis + bb_dev
bb_lower = bb_basis - bb_dev
bb_position = bb_dev != 0 ? (close - bb_basis) / bb_dev : 0
bb_width = bb_dev != 0 ? (bb_upper - bb_lower) / bb_basis * 100 : 0
// 39. Keltner Channels Position
kc_basis = ta.ema(close, length_20)
kc_range = ta.ema(ta.tr, length_20)
kc_upper = kc_basis + (2.0 * kc_range)
kc_lower = kc_basis - (2.0 * kc_range)
kc_position = kc_range != 0 ? (close - kc_basis) / kc_range : 0
// 40. Donchian Channels Position
dc_upper = ta.highest(high, length_20)
dc_lower = ta.lowest(low, length_20)
dc_basis = (dc_upper + dc_lower) / 2
dc_position = (dc_upper - dc_lower) != 0 ? (close - dc_basis) / (dc_upper - dc_lower) : 0
// 41. Standard Deviation
std_dev = ta.stdev(close, length_20)
std_dev_pct = (std_dev / close) * 100
// 42. Relative Volatility Index (RVI)
rvi_up = ta.stdev(close > close ? close : 0, length_14)
rvi_down = ta.stdev(close < close ? close : 0, length_14)
rvi_total = rvi_up + rvi_down
rvi_volatility = rvi_total != 0 ? (rvi_up / rvi_total) * 100 : 50
// 43. Historical Volatility
hv_returns = math.log(close / close )
hv = ta.stdev(hv_returns, length_20) * math.sqrt(252) * 100
// 44. Garman-Klass Volatility
gk_vol = math.log(high/low) * math.log(high/low) - (2*math.log(2)-1) * math.log(close/open) * math.log(close/open)
gk_volatility = math.sqrt(ta.sma(gk_vol, length_20)) * 100
// 45. Parkinson Volatility
park_vol = math.log(high/low) * math.log(high/low)
parkinson = math.sqrt(ta.sma(park_vol, length_20) / (4 * math.log(2))) * 100
// 46. Rogers-Satchell Volatility
rs_vol = math.log(high/close) * math.log(high/open) + math.log(low/close) * math.log(low/open)
rogers_satchell = math.sqrt(ta.sma(rs_vol, length_20)) * 100
// |----- OSCILLATOR INDICATORS (5 indicators) -----| //
// 47. Elder Ray Index
elder_bull = high - ta.ema(close, 13)
elder_bear = low - ta.ema(close, 13)
elder_power = elder_bull + elder_bear
// 48. Schaff Trend Cycle (STC)
stc_macd = ta.ema(close, 23) - ta.ema(close, 50)
stc_k = ta.stoch(stc_macd, stc_macd, stc_macd, 10)
stc_d = ta.ema(stc_k, 3)
stc = ta.stoch(stc_d, stc_d, stc_d, 10)
// 49. Coppock Curve
coppock_roc1 = ta.roc(close, 14)
coppock_roc2 = ta.roc(close, 11)
coppock = ta.wma(coppock_roc1 + coppock_roc2, 10)
// 50. Know Sure Thing (KST)
kst_roc1 = ta.roc(close, 10)
kst_roc2 = ta.roc(close, 15)
kst_roc3 = ta.roc(close, 20)
kst_roc4 = ta.roc(close, 30)
kst = ta.sma(kst_roc1, 10) + 2*ta.sma(kst_roc2, 10) + 3*ta.sma(kst_roc3, 10) + 4*ta.sma(kst_roc4, 15)
// 51. Percentage Price Oscillator (PPO)
ppo_line = ((ta.ema(close, 12) - ta.ema(close, 26)) / ta.ema(close, 26)) * 100
ppo_signal = ta.ema(ppo_line, 9)
ppo_histogram = ppo_line - ppo_signal
// |----- PLOT MAIN INDICATORS -----| //
// Plot key momentum indicators
plot(rsi_centered, title="01_RSI_Centered", color=color.purple, linewidth=1)
plot(stoch_centered, title="02_Stoch_Centered", color=color.blue, linewidth=1)
plot(williams_r, title="03_Williams_R", color=color.red, linewidth=1)
plot(macd_histogram, title="04_MACD_Histogram", color=color.orange, linewidth=1)
plot(cci, title="05_CCI", color=color.green, linewidth=1)
// Plot trend indicators
plot(sma_momentum, title="06_SMA_Momentum", color=color.navy, linewidth=1)
plot(ema_momentum, title="07_EMA_Momentum", color=color.maroon, linewidth=1)
plot(sar_trend, title="08_SAR_Trend", color=color.teal, linewidth=1)
plot(lr_slope, title="09_LR_Slope", color=color.lime, linewidth=1)
plot(mac, title="10_MAC", color=color.fuchsia, linewidth=1)
// Plot volatility indicators
plot(atr_pct, title="11_ATR_Pct", color=color.yellow, linewidth=1)
plot(bb_position, title="12_BB_Position", color=color.aqua, linewidth=1)
plot(kc_position, title="13_KC_Position", color=color.olive, linewidth=1)
plot(std_dev_pct, title="14_StdDev_Pct", color=color.silver, linewidth=1)
plot(bb_width, title="15_BB_Width", color=color.gray, linewidth=1)
// Plot volume indicators
plot(vroc, title="16_VROC", color=color.blue, linewidth=1)
plot(eom_sma, title="17_EOM", color=color.red, linewidth=1)
plot(vol_osc, title="18_Vol_Osc", color=color.green, linewidth=1)
plot(force_index_sma, title="19_Force_Index", color=color.orange, linewidth=1)
plot(obv, title="20_OBV", color=color.purple, linewidth=1)
// Plot additional oscillators
plot(ao, title="21_Awesome_Osc", color=color.navy, linewidth=1)
plot(cmo, title="22_CMO", color=color.maroon, linewidth=1)
plot(dpo, title="23_DPO", color=color.teal, linewidth=1)
plot(trix, title="24_TRIX", color=color.lime, linewidth=1)
plot(fisher, title="25_Fisher", color=color.fuchsia, linewidth=1)
// Plot more momentum indicators
plot(mfi_centered, title="26_MFI_Centered", color=color.yellow, linewidth=1)
plot(ac, title="27_AC", color=color.aqua, linewidth=1)
plot(ppo_pct, title="28_PPO_Pct", color=color.olive, linewidth=1)
plot(stoch_rsi_centered, title="29_StochRSI_Centered", color=color.silver, linewidth=1)
plot(klinger, title="30_Klinger", color=color.gray, linewidth=1)
// Plot trend continuation
plot(tii, title="31_TII", color=color.blue, linewidth=1)
plot(ichimoku_signal, title="32_Ichimoku_Signal", color=color.red, linewidth=1)
plot(mama_momentum, title="33_MAMA_Momentum", color=color.green, linewidth=1)
plot(zlema_momentum, title="34_ZLEMA_Momentum", color=color.orange, linewidth=1)
plot(bop, title="35_BOP", color=color.purple, linewidth=1)
// Plot volume continuation
plot(nvi, title="36_NVI", color=color.navy, linewidth=1)
plot(pvi, title="37_PVI", color=color.maroon, linewidth=1)
plot(momentum_pct, title="38_Momentum_Pct", color=color.teal, linewidth=1)
plot(roc, title="39_ROC", color=color.lime, linewidth=1)
plot(rvi, title="40_RVI", color=color.fuchsia, linewidth=1)
// Plot volatility continuation
plot(dc_position, title="41_DC_Position", color=color.yellow, linewidth=1)
plot(rvi_volatility, title="42_RVI_Volatility", color=color.aqua, linewidth=1)
plot(hv, title="43_Historical_Vol", color=color.olive, linewidth=1)
plot(gk_volatility, title="44_GK_Volatility", color=color.silver, linewidth=1)
plot(parkinson, title="45_Parkinson_Vol", color=color.gray, linewidth=1)
// Plot final oscillators
plot(rogers_satchell, title="46_RS_Volatility", color=color.blue, linewidth=1)
plot(elder_power, title="47_Elder_Power", color=color.red, linewidth=1)
plot(stc, title="48_STC", color=color.green, linewidth=1)
plot(coppock, title="49_Coppock", color=color.orange, linewidth=1)
plot(kst, title="50_KST", color=color.purple, linewidth=1)
// Plot final indicators
plot(ppo_histogram, title="51_PPO_Histogram", color=color.navy, linewidth=1)
plot(pvt, title="52_PVT", color=color.maroon, linewidth=1)
// |----- Reference Lines -----| //
hline(0, "Zero Line", color=color.gray, linestyle=hline.style_dashed, linewidth=1)
hline(50, "Midline", color=color.gray, linestyle=hline.style_dotted, linewidth=1)
hline(-50, "Lower Midline", color=color.gray, linestyle=hline.style_dotted, linewidth=1)
hline(25, "Upper Threshold", color=color.gray, linestyle=hline.style_dotted, linewidth=1)
hline(-25, "Lower Threshold", color=color.gray, linestyle=hline.style_dotted, linewidth=1)
// |----- Enhanced Information Table -----| //
if show_table and barstate.islast
table_position = position.top_right
table_text_size = table_size == "Tiny" ? size.tiny : table_size == "Small" ? size.small : size.normal
var table info_table = table.new(table_position, 3, 18, bgcolor=color.new(color.white, 85), border_width=1, border_color=color.gray)
// Headers
table.cell(info_table, 0, 0, 'Category', text_color=color.black, text_size=table_text_size, bgcolor=color.new(color.blue, 70))
table.cell(info_table, 1, 0, 'Indicator', text_color=color.black, text_size=table_text_size, bgcolor=color.new(color.blue, 70))
table.cell(info_table, 2, 0, 'Value', text_color=color.black, text_size=table_text_size, bgcolor=color.new(color.blue, 70))
// Key Momentum Indicators
table.cell(info_table, 0, 1, 'MOMENTUM', text_color=color.purple, text_size=table_text_size, bgcolor=color.new(color.purple, 90))
table.cell(info_table, 1, 1, 'RSI Centered', text_color=color.purple, text_size=table_text_size)
table.cell(info_table, 2, 1, str.tostring(rsi_centered, '0.00'), text_color=color.purple, text_size=table_text_size)
table.cell(info_table, 0, 2, '', text_color=color.blue, text_size=table_text_size)
table.cell(info_table, 1, 2, 'Stoch Centered', text_color=color.blue, text_size=table_text_size)
table.cell(info_table, 2, 2, str.tostring(stoch_centered, '0.00'), text_color=color.blue, text_size=table_text_size)
table.cell(info_table, 0, 3, '', text_color=color.red, text_size=table_text_size)
table.cell(info_table, 1, 3, 'Williams %R', text_color=color.red, text_size=table_text_size)
table.cell(info_table, 2, 3, str.tostring(williams_r, '0.00'), text_color=color.red, text_size=table_text_size)
table.cell(info_table, 0, 4, '', text_color=color.orange, text_size=table_text_size)
table.cell(info_table, 1, 4, 'MACD Histogram', text_color=color.orange, text_size=table_text_size)
table.cell(info_table, 2, 4, str.tostring(macd_histogram, '0.000'), text_color=color.orange, text_size=table_text_size)
table.cell(info_table, 0, 5, '', text_color=color.green, text_size=table_text_size)
table.cell(info_table, 1, 5, 'CCI', text_color=color.green, text_size=table_text_size)
table.cell(info_table, 2, 5, str.tostring(cci, '0.00'), text_color=color.green, text_size=table_text_size)
// Key Trend Indicators
table.cell(info_table, 0, 6, 'TREND', text_color=color.navy, text_size=table_text_size, bgcolor=color.new(color.navy, 90))
table.cell(info_table, 1, 6, 'SMA Momentum %', text_color=color.navy, text_size=table_text_size)
table.cell(info_table, 2, 6, str.tostring(sma_momentum, '0.00'), text_color=color.navy, text_size=table_text_size)
table.cell(info_table, 0, 7, '', text_color=color.maroon, text_size=table_text_size)
table.cell(info_table, 1, 7, 'EMA Momentum %', text_color=color.maroon, text_size=table_text_size)
table.cell(info_table, 2, 7, str.tostring(ema_momentum, '0.00'), text_color=color.maroon, text_size=table_text_size)
table.cell(info_table, 0, 8, '', text_color=color.teal, text_size=table_text_size)
table.cell(info_table, 1, 8, 'SAR Trend', text_color=color.teal, text_size=table_text_size)
table.cell(info_table, 2, 8, str.tostring(sar_trend, '0'), text_color=color.teal, text_size=table_text_size)
table.cell(info_table, 0, 9, '', text_color=color.lime, text_size=table_text_size)
table.cell(info_table, 1, 9, 'Linear Regression', text_color=color.lime, text_size=table_text_size)
table.cell(info_table, 2, 9, str.tostring(lr_slope, '0.000'), text_color=color.lime, text_size=table_text_size)
// Key Volatility Indicators
table.cell(info_table, 0, 10, 'VOLATILITY', text_color=color.yellow, text_size=table_text_size, bgcolor=color.new(color.yellow, 90))
table.cell(info_table, 1, 10, 'ATR %', text_color=color.yellow, text_size=table_text_size)
table.cell(info_table, 2, 10, str.tostring(atr_pct, '0.00'), text_color=color.yellow, text_size=table_text_size)
table.cell(info_table, 0, 11, '', text_color=color.aqua, text_size=table_text_size)
table.cell(info_table, 1, 11, 'BB Position', text_color=color.aqua, text_size=table_text_size)
table.cell(info_table, 2, 11, str.tostring(bb_position, '0.00'), text_color=color.aqua, text_size=table_text_size)
table.cell(info_table, 0, 12, '', text_color=color.olive, text_size=table_text_size)
table.cell(info_table, 1, 12, 'KC Position', text_color=color.olive, text_size=table_text_size)
table.cell(info_table, 2, 12, str.tostring(kc_position, '0.00'), text_color=color.olive, text_size=table_text_size)
// Key Volume Indicators
table.cell(info_table, 0, 13, 'VOLUME', text_color=color.blue, text_size=table_text_size, bgcolor=color.new(color.blue, 90))
table.cell(info_table, 1, 13, 'Volume ROC', text_color=color.blue, text_size=table_text_size)
table.cell(info_table, 2, 13, str.tostring(vroc, '0.00'), text_color=color.blue, text_size=table_text_size)
table.cell(info_table, 0, 14, '', text_color=color.red, text_size=table_text_size)
table.cell(info_table, 1, 14, 'EOM', text_color=color.red, text_size=table_text_size)
table.cell(info_table, 2, 14, str.tostring(eom_sma, '0.000'), text_color=color.red, text_size=table_text_size)
// Key Oscillators
table.cell(info_table, 0, 15, 'OSCILLATORS', text_color=color.purple, text_size=table_text_size, bgcolor=color.new(color.purple, 90))
table.cell(info_table, 1, 15, 'Awesome Osc', text_color=color.blue, text_size=table_text_size)
table.cell(info_table, 2, 15, str.tostring(ao, '0.000'), text_color=color.blue, text_size=table_text_size)
table.cell(info_table, 0, 16, '', text_color=color.red, text_size=table_text_size)
table.cell(info_table, 1, 16, 'Fisher Transform', text_color=color.red, text_size=table_text_size)
table.cell(info_table, 2, 16, str.tostring(fisher, '0.000'), text_color=color.red, text_size=table_text_size)
// Summary Statistics
table.cell(info_table, 0, 17, 'SUMMARY', text_color=color.black, text_size=table_text_size, bgcolor=color.new(color.gray, 70))
table.cell(info_table, 1, 17, 'Total Indicators: 52', text_color=color.black, text_size=table_text_size)
regime_color = rsi_centered > 10 ? color.green : rsi_centered < -10 ? color.red : color.gray
regime_text = rsi_centered > 10 ? "BULLISH" : rsi_centered < -10 ? "BEARISH" : "NEUTRAL"
table.cell(info_table, 2, 17, regime_text, text_color=regime_color, text_size=table_text_size)
This makes it the perfect “indicator backbone” for quantitative and systematic traders who want to prototype, combine, and test new regime detection models—especially in combination with the Markov Chain indicator.
How to use this script with the Markov Chain for research and backtesting:
Add the Enhanced Indicator Export to your chart.
Every calculated indicator is available as an individual data stream.
Connect the indicator(s) you want as custom input(s) to the Markov Chain’s “Custom Indicators” option.
In the Markov Chain indicator’s settings, turn ON the custom indicator mode.
For each of the three custom indicator inputs, select the exported plot from the Enhanced Export script—the menu lists all 45+ signals by name.
This creates a powerful, modular regime-detection engine where you can mix-and-match momentum, trend, volume, or custom combinations for advanced filtering.
Backtest regime logic directly.
Once you’ve connected your chosen indicators, the Markov Chain script performs regime detection (Bull/Neutral/Bear) based on your selected features—not just price returns.
The regime detection is robust, automatically normalized (using Z-score), and outputs bias (1, -1, 0) for plug-and-play integration.
Export the regime bias for programmatic use.
As described above, use input.source() in your Pine Script strategy or system and link the bias output.
You can now filter signals, control trade direction/size, or design pairs-trading that respect true, indicator-driven market regimes.
With this framework, you’re not limited to static or simplistic regime filters. You can rigorously define, test, and refine what “market regime” means for your strategies—using the technical features that matter most to you.
Optimize your signal generation by backtesting across a universe of meaningful indicator blends.
Enhance risk management with objective, real-time regime boundaries.
Accelerate your research: iterate quickly, swap indicator components, and see results with minimal code changes.
Automate multi-asset or pairs-trading by integrating regime context directly into strategy logic.
Add both scripts to your chart, connect your preferred features, and start investigating your best regime-based trades—entirely within the TradingView ecosystem.
References & Further Reading
Ang, A., & Bekaert, G. (2002). “Regime Switches in Interest Rates.” Journal of Business & Economic Statistics, 20(2), 163–182.
Hamilton, J. D. (1989). “A New Approach to the Economic Analysis of Nonstationary Time Series and the Business Cycle.” Econometrica, 57(2), 357–384.
Markov, A. A. (1906). "Extension of the Limit Theorems of Probability Theory to a Sum of Variables Connected in a Chain." The Notes of the Imperial Academy of Sciences of St. Petersburg.
Guidolin, M., & Timmermann, A. (2007). “Asset Allocation under Multivariate Regime Switching.” Journal of Economic Dynamics and Control, 31(11), 3503–3544.
Murphy, J. J. (1999). Technical Analysis of the Financial Markets. New York Institute of Finance.
Brock, W., Lakonishok, J., & LeBaron, B. (1992). “Simple Technical Trading Rules and the Stochastic Properties of Stock Returns.” Journal of Finance, 47(5), 1731–1764.
Zucchini, W., MacDonald, I. L., & Langrock, R. (2017). Hidden Markov Models for Time Series: An Introduction Using R (2nd ed.). Chapman and Hall/CRC.
On Quantitative Finance and Markov Models:
Lo, A. W., & Hasanhodzic, J. (2009). The Heretics of Finance: Conversations with Leading Practitioners of Technical Analysis. Bloomberg Press.
Patterson, S. (2016). The Man Who Solved the Market: How Jim Simons Launched the Quant Revolution. Penguin Press.
TradingView Pine Script Documentation: www.tradingview.com
TradingView Blog: “Use an Input From Another Indicator With Your Strategy” www.tradingview.com
GeeksforGeeks: “What is the Difference Between Markov Chains and Hidden Markov Models?” www.geeksforgeeks.org
What makes this indicator original and unique?
- On‑chart, real‑time Markov. The chain is drawn directly on your chart. You see the current regime, its tendency to stay (self‑loop), and the usual next step (arrows) as bars confirm.
- Source‑agnostic by design. The engine runs on any series you select via input.source() — price, your own oscillator, a composite score, anything you compute in the script.
- Automatic normalization + regime mapping. Different inputs live on different scales. The script standardizes your chosen source and maps it into clear regimes (e.g., Bull / Bear / Neutral) without you micromanaging thresholds each time.
- Rolling, bar‑by‑bar learning. Transition tendencies are computed from a rolling window of confirmed bars. What you see is exactly what the market did in that window.
- Fast experimentation. Switch the source, adjust the window, and the Markov view updates instantly. It’s a rapid way to test ideas and feel regime persistence/switch behavior.
Integrate your own signals (using input.source())
- In settings, choose the Source . This is powered by input.source() .
- Feed it price, an indicator you compute inside the script, or a custom composite series.
- The script will automatically normalize that series and process it through the Markov engine, mapping it to regimes and updating the on‑chart spheres/arrows in real time.
Credits:
Deep gratitude to @RicardoSantos for both the foundational Markov chain processing engine and inspiring open-source contributions, which made advanced probabilistic market modeling accessible to the TradingView community.
Special thanks to @Alien_Algorithms for the innovative and visually stunning 3D sphere logic that powers the indicator’s animated, regime-based visualization.
Disclaimer
This tool summarizes recent behavior. It is not financial advice and not a guarantee of future results.

Parabolic Stoch SAR VisualizerParabolic Stoch SAR Visualizer — Momentum-Driven Trend Precision Tool
Overview:
Parabolic Stoch SAR Visualizer is a thoughtfully engineered hybrid indicator that blends momentum oscillation and trend-following mechanics into one robust system. By applying a custom Parabolic SAR calculation directly on a double-smoothed stochastic oscillator (rather than on price), it generates cleaner signals with enhanced trend detection and fewer false positives than typical Parabolic RSI or standard SAR variants.
Unique Functionality:
Momentum smoothing : The base stochastic %K undergoes double smoothing via consecutive simple moving averages, significantly cutting down random noise and erratic swings common in raw stochastic readings. This stabilizes momentum tracking, isolating true price strength and weakness.
Custom Parabolic SAR on smoothed momentum : Traditional SAR algorithms operate on price data, acting as trailing stops. This indicator repurposes SAR to work on smoothed stochastic values, effectively converting it into a momentum-driven directional filter. This yields a more adaptive and responsive trend signal focused on genuine momentum shifts instead of price noise.
Bounded SAR range and adjustable acceleration : SAR values are mathematically restricted between 0 and 100, aligning with the stochastic scale to prevent distortions. Traders can customize acceleration parameters (start, increment, max) to fine-tune trend sensitivity relative to market volatility or specific strategies.
Signal clarity through filterin g: Minimum bar spacing and minimum SAR movement thresholds between plotted dots reduce chart clutter, highlighting only meaningful trend changes and filtering out insignificant fluctuations.
Enhanced visuals : The oscillator line smoothly transitions its color gradient between defined uptrend and downtrend hues, intuitively signaling momentum strength. Parabolic SAR dots are offset from the oscillator line with multi-layered glow effects, making trend flips easy to spot at a glance.
Trading Application:
Trend identification : Momentum-based SAR dots offer precise marking of trend shifts, helping traders avoid false breakouts and premature trades.
Entry and exit timing : Combining the double-smoothed stochastic oscillator and SAR dots creates a reliable framework to confirm momentum shifts and optimal trade entries or exits.
Customizable for volatility regimes : Adjustable acceleration and filtering parameters allow scalpers to increase signal sensitivity, while swing traders can dial back noise for smoother trend recognition.
Visual clarity for fast decisions : Gradient color coding and glowing SAR dots facilitate immediate momentum assessment without complex analysis, empowering quicker, more confident trade actions.
Advantages over Parabolic RSI and similar indicators:
Parabolic RSI’s direct application of SAR on RSI often results in noisy, choppy signals prone to whipsaws. This indicator’s double-smoothed stochastic foundation delivers a cleaner, steadier signal.
Applying SAR to smoothed momentum rather than price transforms it into a directional filter that better captures true market strength with reduced lag.
Adaptive plotting thresholds and enhanced visuals minimize clutter and ambiguity, improving trader focus and execution speed.

Hurst Exponent Adaptive Filter (HEAF) [PhenLabs]📊 PhenLabs - Hurst Exponent Adaptive Filter (HEAF)
Version: PineScript™ v6
📌 Description
The Hurst Exponent Adaptive Filter (HEAF) is an advanced Pine Script indicator designed to dynamically adjust moving average calculations based on real time market regimes detected through the Hurst Exponent. The intention behind the creation of this indicator was not a buy/sell indicator but rather a tool to help sharpen traders ability to distinguish regimes in the market mathematically rather than guessing. By analyzing price persistence, it identifies whether the market is trending, mean-reverting, or exhibiting random walk behavior, automatically adapting the MA length to provide more responsive alerts in volatile conditions and smoother outputs in stable ones. This helps traders avoid false signals in choppy markets and capitalize on strong trends, making it ideal for adaptive trading strategies across various timeframes and assets.
Unlike traditional moving averages, HEAF incorporates fractal dimension analysis via the Hurst Exponent to create a self-tuning filter that evolves with market conditions. Traders benefit from visual cues like color coded regimes, adaptive bands for volatility channels, and an information panel that suggests appropriate strategies, enhancing decision making without constant manual adjustments by the user.
🚀 Points of Innovation
Dynamic MA length adjustment using Hurst Exponent for regime-aware filtering, reducing lag in trends and noise in ranges.
Integrated market regime classification (trending, mean-reverting, random) with visual and alert-based notifications.
Customizable color themes and adaptive bands that incorporate ATR for volatility-adjusted channels.
Built-in information panel providing real-time strategy recommendations based on detected regimes.
Power sensitivity parameter to fine-tune adaptation aggressiveness, allowing personalization for different trading styles.
Support for multiple MA types (EMA, SMA, WMA) within an adaptive framework.
🔧 Core Components
Hurst Exponent Calculation: Computes the fractal dimension of price series over a user-defined lookback to detect market persistence or anti-persistence.
Adaptive Length Mechanism: Maps Hurst values to MA lengths between minimum and maximum bounds, using a power function for sensitivity control.
Moving Average Engine: Applies the chosen MA type (EMA, SMA, or WMA) to the adaptive length for the core filter line.
Adaptive Bands: Creates upper and lower channels using ATR multiplied by a band factor, scaled to the current adaptive length.
Regime Detection: Classifies market state with thresholds (e.g., >0.55 for trending) and triggers alerts on regime changes.
Visualization System: Includes gradient fills, regime-colored MA lines, and an info panel for at-a-glance insights.
🔥 Key Features
Regime-Adaptive Filtering: Automatically shortens MA in mean-reverting markets for quick responses and lengthens it in trends for smoother signals, helping traders stay aligned with market dynamics.
Custom Alerts: Notifies on regime shifts and band breakouts, enabling timely strategy adjustments like switching to trend-following in bullish regimes.
Visual Enhancements: Color-coded MA lines, gradient band fills, and an optional info panel that displays market state and trading tips, improving chart readability.
Flexible Settings: Adjustable lookback, min/max lengths, sensitivity power, MA type, and themes to suit various assets and timeframes.
Band Breakout Signals: Highlights potential overbought/oversold conditions via ATR-based channels, useful for entry/exit timing.
🎨 Visualization
Main Adaptive MA Line: Plotted with regime-based colors (e.g., green for trending) to visually indicate market state and filter position relative to price.
Adaptive Bands: Upper and lower lines with gradient fills between them, showing volatility channels that widen in random regimes and tighten in trends.
Price vs. MA Fills: Color-coded areas between price and MA (e.g., bullish green above MA in trending modes) for quick trend strength assessment.
Information Panel: Top-right table displaying current regime (e.g., "Trending Market") and strategy suggestions like "Follow trends" or "Trade ranges."
📖 Usage Guidelines
Core Settings
Hurst Lookback Period
Default: 100
Range: 20-500
Description: Sets the period for Hurst Exponent calculation; longer values provide more stable regime detection but may lag, while shorter ones are more responsive to recent changes.
Minimum MA Length
Default: 10
Range: 5-50
Description: Defines the shortest possible adaptive MA length, ideal for fast responses in mean-reverting conditions.
Maximum MA Length
Default: 200
Range: 50-500
Description: Sets the longest adaptive MA length for smoothing in strong trends; adjust based on asset volatility.
Sensitivity Power
Default: 2.0
Range: 1.0-5.0
Description: Controls how aggressively the length adapts to Hurst changes; higher values make it more sensitive to regime shifts.
MA Type
Default: EMA
Options: EMA, SMA, WMA
Description: Chooses the moving average calculation method; EMA is more responsive, while SMA/WMA offer different weighting.
🖼️ Visual Settings
Show Adaptive Bands
Default: True
Description: Toggles visibility of upper/lower bands for volatility channels.
Band Multiplier
Default: 1.5
Range: 0.5-3.0
Description: Scales band width using ATR; higher values create wider channels for conservative signals.
Show Information Panel
Default: True
Description: Displays regime info and strategy tips in a top-right panel.
MA Line Width
Default: 2
Range: 1-5
Description: Adjusts thickness of the main MA line for better visibility.
Color Theme
Default: Blue
Options: Blue, Classic, Dark Purple, Vibrant
Description: Selects color scheme for MA, bands, and fills to match user preferences.
🚨 Alert Settings
Enable Alerts
Default: True
Description: Activates notifications for regime changes and band breakouts.
✅ Best Use Cases
Trend-Following Strategies: In detected trending regimes, use the adaptive MA as a trailing stop or entry filter for momentum trades.
Range Trading: During mean-reverting periods, monitor band breakouts for buying dips or selling rallies within channels.
Risk Management in Random Markets: Reduce exposure when random walk is detected, using tight stops suggested in the info panel.
Multi-Timeframe Analysis: Apply on higher timeframes for regime confirmation, then drill down to lower ones for entries.
Volatility-Based Entries: Use upper/lower band crossovers as signals in adaptive channels for overbought/oversold trades.
⚠️ Limitations
Lagging in Transitions: Regime detection may delay during rapid market shifts, requiring confirmation from other tools.
Not a Standalone System: Best used in conjunction with other indicators; random regimes can lead to whipsaws if traded aggressively.
Parameter Sensitivity: Optimal settings vary by asset and timeframe, necessitating backtesting.
💡 What Makes This Unique
Hurst-Driven Adaptation: Unlike static MAs, it uses fractal analysis to self-tune, providing regime-specific filtering that's rare in standard indicators.
Integrated Strategy Guidance: The info panel offers actionable tips tied to regimes, bridging analysis and execution.
Multi-Regime Visualization: Combines adaptive bands, colored fills, and alerts in one tool for comprehensive market state awareness.
🔬 How It Works
Hurst Exponent Computation:
Calculates log returns over the lookback period to derive the rescaled range (R/S) ratio.
Normalizes to a 0-1 value, where >0.55 indicates trending, <0.45 mean-reverting, and in-between random.
Length Adaptation:
Maps normalized Hurst to an MA length via a power function, clamping between min and max.
Applies the selected MA type to close prices using this dynamic length.
Visualization and Signals:
Plots the MA with regime colors, adds ATR-based bands, and fills areas for trend strength.
Triggers alerts on regime changes or band crosses, with the info panel suggesting strategies like momentum riding in trends.
💡 Note:
For optimal results, backtest settings on your preferred assets and combine with volume or momentum indicators. Remember, no indicator guarantees profits—use with proper risk management. Access premium features and support at PhenLabs.

Time-Decaying Percentile Oscillator [BackQuant]Time-Decaying Percentile Oscillator
1. Big-picture idea
Traditional percentile or stochastic oscillators treat every bar in the look-back window as equally important. That is fine when markets are slow, but if volatility regime changes quickly yesterday’s print should matter more than last month’s. The Time-Decaying Percentile Oscillator attempts to fix that blind spot by assigning an adjustable weight to every past price before it is ranked. The result is a percentile score that “breathes” with market tempo much faster to flag new extremes yet still smooth enough to ignore random noise.
2. What the script actually does
Build a weight curve
• You pick a look-back length (default 28 bars).
• You decide whether weights fall Linearly , Exponentially , by Power-law or Logarithmically .
• A decay factor (lower = faster fade) shapes how quickly the oldest price loses influence.
• The array is normalised so all weights still sum to 1.
Rank prices by weighted mass
• Every close in the window is paired with its weight.
• The pairs are sorted from low to high.
• The cumulative weight is walked until it equals your chosen percentile level (default 50 = median).
• That price becomes the Time-Decayed Percentile .
Find dispersion with robust statistics
• Instead of a fragile standard deviation the script measures weighted Median-Absolute-Deviation about the new percentile.
• You multiply that deviation by the Deviation Multiplier slider (default 1.0) to get a non-parametric volatility band.
Build an adaptive channel
• Upper band = percentile + (multiplier × deviation)
• Lower band = percentile – (multiplier × deviation)
Normalise into a 0-100 oscillator
• The current close is mapped inside that band:
0 = lower band, 50 = centre, 100 = upper band.
• If the channel squeezes, tiny moves still travel the full scale; if volatility explodes, it automatically widens.
Optional smoothing
• A second-stage moving average (EMA, SMA, DEMA, TEMA, etc.) tames the jitter.
• Length 22 EMA by default—change it to tune reaction speed.
Threshold logic
• Upper Threshold 70 and Lower Threshold 30 separate standard overbought/oversold states.
• Extreme bands 85 and 15 paint background heat when aggressive fade or breakout trades might trigger.
Divergence engine
• Looks back twenty bars.
• Flags Bullish divergence when price makes a lower low but oscillator refuses to confirm (value < 40).
• Flags Bearish divergence when price prints a higher high but oscillator stalls (value > 60).
3. Component walk-through
• Source – Any price series. Close by default, switch to typical price or custom OHLC4 for futures spreads.
• Look-back Period – How many bars to rank. Short = faster, long = slower.
• Base Percentile Level – 50 shows relative position around the median; set to 25 / 75 for quartile tracking or 90 / 10 for extreme tails.
• Deviation Multiplier – Higher values widen the dynamic channel, lowering whipsaw but delaying signals.
• Decay Settings
– Type decides the curve shape. Exponential (default 1.16) mimics EMA logic.
– Factor < 1 shrinks influence faster; > 1 spreads influence flatter.
– Toggle Enable Time Decay off to compare with classic equal-weight stochastic.
• Smoothing Block – Choose one of seven MA flavours plus length.
• Thresholds – Overbought / Oversold / Extreme levels. Push them out when working on very mean-reverting assets like FX; pull them in for trend monsters like crypto.
• Display toggles – Show or hide threshold lines, extreme filler zones, bar colouring, divergence labels.
• Colours – Bullish green, bearish red, neutral grey. Every gradient step is automatically blended to generate a heat map across the 0-100 range.
4. How to read the chart
• Oscillator creeping above 70 = market auctioning near the top of its adaptive range.
• Fast poke above 85 with no follow-through = exhaustion fade candidate.
• Slow grind that lives above 70 for many bars = valid bullish trend, not a fade.
• Cross back through 50 shows balance has shifted; treat it like a micro trend change.
• Divergence arrows add extra confidence when you already see two-bar reversal candles at range extremes.
• Background shading (semi-transparent red / green) warns of extreme states and throttles your position size.
5. Practical trading playbook
Mean-reversion scalps
1. Wait for oscillator to reach your desired OB/ OS levels
2. Check the slope of the smoothing MA—if it is flattening the squeeze is mature.
3. Look for a one- or two-bar reversal pattern.
4. Enter against the move; first target = midline 50, second target = opposite threshold.
5. Stop loss just beyond the extreme band.
Trend continuation pullbacks
1. Identify a clean directional trend on the price chart.
2. During the trend, TDP will oscillate between midline and extreme of that side.
3. Buy dips when oscillator hits OS levels, and the same for OB levels & shorting
4. Exit when oscillator re-tags the same-side extreme or prints divergence.
Volatility regime filter
• Use the Enable Time Decay switch as a regime test.
• If equal-weight oscillator and decayed oscillator diverge widely, market is entering a new volatility regime—tighten stops and trade smaller.
Divergence confirmation for other indicators
• Pair TDP divergence arrows with MACD histogram or RSI to filter false positives.
• The weighted nature means TDP often spots divergence a bar or two earlier than standard RSI.
Swing breakout strategy
1. During consolidation, band width compresses and oscillator oscillates around 50.
2. Watch for sudden expansion where oscillator blasts through extreme bands and stays pinned.
3. Enter with momentum in breakout direction; trail stop behind upper or lower band as it re-expands.
6. Customising decay mathematics
Linear – Each older bar loses the same fixed amount of influence. Intuitive and stable; good for slow swing charts.
Exponential – Influence halves every “decay factor” steps. Mirrors EMA thinking and is fastest to react.
Power-law – Mid-history bars keep more authority than exponential but oldest data still fades. Handy for commodities where seasonality matters.
Logarithmic – The gentlest curve; weight drops sharply at first then levels off. Mimics how traders remember dramatic moves for weeks but forget ordinary noise quickly.
Turn decay off to verify the tool’s added value; most users never switch back.
7. Alert catalogue
• TD Overbought / TD Oversold – Cross of regular thresholds.
• TD Extreme OB / OS – Breach of danger zones.
• TD Bullish / Bearish Divergence – High-probability reversal watch.
• TD Midline Cross – Momentum shift that often precedes a window where trend-following systems perform.
8. Visual hygiene tips
• If you already plot price on a dark background pick Bullish Color and Bearish Color default; change to pastel tones for light themes.
• Hide threshold lines after you memorise the zones to declutter scalping layouts.
• Overlay mode set to false so the oscillator lives in its own panel; keep height about 30 % of screen for best resolution.
9. Final notes
Time-Decaying Percentile Oscillator marries robust statistical ranking, adaptive dispersion and decay-aware weighting into a simple oscillator. It respects both recent order-flow shocks and historical context, offers granular control over responsiveness and ships with divergence and alert plumbing out of the box. Bolt it onto your price action framework, trend-following system or volatility mean-reversion playbook and see how much sooner it recognises genuine extremes compared to legacy oscillators.
Backtest thoroughly, experiment with decay curves on each asset class and remember: in trading, timing beats timidity but patience beats impulse. May this tool help you find that edge.

BERLIN-MAX 1V.5BERLIN-MAX 1V.5 is a comprehensive trading indicator designed for TradingView that combines multiple advanced strategies and tools. It integrates EMA crossover signals, UT Bot logic with ATR-based trailing stops, customizable stop-loss and target multipliers per timeframe, Hull Moving Averages with color-coded trends, linear regression channels for support and resistance, and a multi-timeframe RSI and volume signal table. This script aims to provide clear entry and exit signals for scalping and swing trading, enhancing decision-making across different market conditions.

ZLMA Keltner ChannelThe ZLMA Keltner Channel uses a Zero-Lag Moving Average (ZLMA) as the centerline with ATR-based bands to track trends and volatility.
The ZLMA’s reduced lag enhances responsiveness for breakouts and reversals, i.e. it's more sensitive to pivots and trend reversals.
Unlike Bollinger Bands, which use standard deviation and are more sensitive to price spikes, this uses ATR for smoother volatility measurement.
Background:
Built on John Ehlers’ lag-reduction techniques, this indicator adapts the classic Keltner Channel for dynamic markets. It excels in trending (low-entropy) markets for breakouts and range-bound (high-entropy) markets for reversals.
How to Read:
ZLMA (Blue): Tracks price trends. Above = bullish, below = bearish.
Upper Band (Green): ZLMA + (Multiplier × ATR). Cross above signals breakout or overbought.
Lower Band (Red): ZLMA - (Multiplier × ATR). Cross below signals breakout or oversold.
Channel Fill (Gray): Shows volatility. Narrow = low volatility, wide = high volatility.
Signals (Optional): Enable to show “Buy” (green) on upper band crossovers, “Sell” (red) on lower band crossunders.
Strategies: Trade breakouts in trending markets, reversals in ranges, or use bands as trailing stops.
Settings:
ZLMA Period (20): Adjusts centerline responsiveness.
ATR Period (20): Sets volatility period.
Multiplier (2.0): Controls band width.
If you are still confused between the ZLMA Keltner Channels and Bollinger Bands:
Keltner Channel (ZLMA): Uses ATR for bands, which smooths volatility and is less reactive to sudden price spikes. The ZLMA centerline reduces lag for faster trend detection.
Bollinger Bands: Uses standard deviation for bands, making them more sensitive to price volatility and prone to wider swings in high-entropy markets. Typically uses an SMA centerline, which lags more than ZLMA.

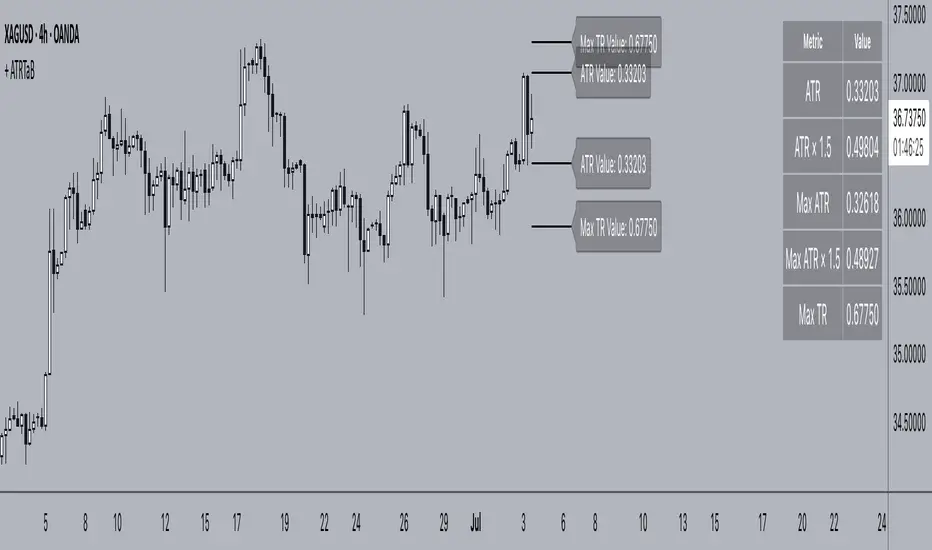
+ ATR Table and BracketsHi, all. I'm back with a new indicator—one I firmly believe could be one of the most valuable indicators you keep in your indicator toolshed—based around true range.
This is a simple, streamlined indicator utilizing true range and average true range that will help any trader with stoploss, trailing stoploss, and take-profit placement—things that I know many traders use average true range for. It could also be useful for trade entries as well, depending on the trader's style.
Typically, most traders (or at least what I've seen recommended across websites, video tutorials on YouTube, etc.) are taught to simply take the ATR number and use that, and possibly some sort of multiplier, as your stoploss and take-profit. This is fine, but I thought that it might be possible to dive a bit deeper into these values. Because an average is a combination of values, some higher, some lower, and we often see ATR spikes during periods of high volatility, I thought wouldn't it be useful to know what value those ATR spikes are, and how do they relate to the ATR? Then I thought to myself, well, what about the most volatile candle within that ATR (the candle with the greatest true range)? Couldn't knowing that value be useful to a trader? So then the idea of a table displaying these values, along with the ATR and the ATR times some multiplier number, would be a useful, simple way to display this information. That's what we have here.
The table is made up of two columns, one with the name of the metric being measured, and the other with its value. That's it. Simple.
As nice as this was, I thought an additional, great, and perhaps better, way to visualize this information would be in the form of brackets extending from the current bar. These are simply lines/labels plotted at the price values of the ATR, ATR times X, highest ATR, highest ATR times X, and highest TR value. These labels supply the actual values of the ATR, etc., but may also display the price if you should choose (both of these values are toggleable in the 'Inputs' section of the indicator.). Additionally, you can choose to display none of these labels, or all five if you wish (leaves the chart a bit cluttered, as shown in the image below), though I suspect you'll determine your preferences for which information you'd like to see and which not.
Chart with all five lines/labels displayed. I adjusted the ATRX value to 3 just to make the screenshot as legible as possible. Default is set to 1.5. As you can see, the label doesn't show the multiplier number, but the table does.
Here's a screenshot of the labels showing the price in addition to the value of the ATR, set to "Previous Closing Price," (see next paragraph for what that means) and highest TR. Personally, I don't see the value in the displaying the price, but I thought some people might want that. It's not available in the table as of now, but perhaps if I get enough requests for it I will add it.
That's basically it, but one last detail I need to go over is the dropdown box labeled "Bar Value ATR Levels are Oriented To." Firstly, this has no effect on Highest ATR, Highest ATRX, and Highest TR levels. Those are based on the ATR up to the last closed candle, meaning they aren't including the value of the currently open candle (this would be useless). However, knowing that different traders trade different ways it seemed to me prudent to allow for traders to select which opening or closing value the trader wishes to have the ATR brackets based on. For example, as someone who has consumed much No Nonsense Forex content I know that traders are urged to enter their trades in the last fifteen minutes of the trading day because the ATR is unlikely to change significantly in that period (ATR being the centerpiece of NNFX money management), so one of three selections here is to plot the brackets based on the ATR's inclusion of this value (this of course means the brackets will move while the candle is still open). The other options are to set the brackets to the current opening price, or the previous closing price. Depending on what you're trading many times these prices are virtually identical, but sometimes price gaps (stocks in particular), so, wanting your brackets placed relative to the previous close as opposed to the current open might be preferable for some traders.
And that's it. I really hope you guys like this indicator. I haven't seen anything closely similar to it on TradingView, and I think it will be something you all will find incredibly handy.
Please enjoy!
Expanded Cloud [LuxAlgo]The Expanded Cloud tool allows traders to identify and follow trends accurately. It is based on the well-known Donchian Channels, but with enhanced features.
It features a trailing cloud that expands with the price and a trading stats dashboard.
🔶 USAGE
The tool is super easy to use. Traders can identify bigger or smaller trends just by adjusting the length from the settings panel.
Trend identification is based on Donchian Channels. An uptrend is indicated when the cloud is located below the price, while a downtrend is indicated when the cloud is above it.
Dots signal the start of a new trend, and the width of the clouds identifies the strength of the price expansion. The wider the cloud, the bigger the move.
The expanded cloud, due to its visual, can also act as a trailing stop.
🔹 Trend Identification
As we can see in the chart above, different length values identify different trends on the same BTC daily chart. Larger values identify larger trends.
🔹 Cloud Expansion
From the settings panel, traders can adjust how the clouds expand based on the Expansion % parameter. It accepts values from 0 to 100, which controls how much of the expansion is taken into account. Higher values will make the cloud expand and get closer to the price faster.
When the cloud moves opposite to the direction of the indicated trend (e.g: the cloud decreases while being below the price), it is often indicative of the end of a retracement, and we can expect the price to move with the indicated trend.
The chart above shows the effect of different Expansion % values.
🔹 Dashboard
The trading statistics dashboard informs traders of key metrics derived from the tool. The following are notable:
PNL: Theoretical profit or loss from all trends identified by the tool in the right scale units.
EXPECT.: Expected value of each trade. It is derived from win rate and risk-to-reward metrics.
AVG: 1st TOUCH: The average number of bars from the beginning of a new trend until the price touches the cloud for the first time.
🔶 SETTINGS
Length: Length for trend detection
Expansion %: Percentage of price expansion for cloud formation
Source: Source of the data
🔹 Dashboard
Show Dashboard: Enable/disable the statistics dashboard
Location: Dashboard location
Size: Dashboard size

GStrategy 1000Pepe 15mTrend Following Candlestick Strategy with EMA Filter and Exit Delay
Strategy Concept
This strategy combines candlestick patterns with EMA trend filtering to identify high-probability trade entries, featuring:
Entry Signals: Hammer and Engulfing patterns confirmed by EMA trend
Trend Filter: Fast EMA (20) vs Slow EMA (50) crossover system
Risk Management: 5% stop-loss + 1% trailing stop
Smart Exit: 2-bar delay after exit signals to avoid whipsaws
Key Components
Trend Identification:
Uptrend: Fast EMA > Slow EMA AND rising
Downtrend: Fast EMA < Slow EMA AND falling
Entry Conditions:
pinescript
// Bullish Entry (Long)
longCondition = (Hammer OR Bullish Engulfing)
AND Uptrend
AND no existing position
// Bearish Entry (Short)
shortCondition = Bearish Engulfing
AND Downtrend
AND no existing position
Exit Mechanics:
Primary Exit: EMA crossover (Fast crosses Slow)
Delayed Execution: Waits 2 full candles after signal
Emergency Exits:
5% fixed stop-loss
1% trailing stop
Visual Dashboard:
Colored EMA lines (Blue=Fast, Red=Slow)
Annotated candlestick patterns
Background highlighting for signals
Distinct markers for entries/exits
Unique Features
Pattern Recognition:
Enhanced Hammer detection (strict body/wick ratios)
Multi-candle engulfing confirmation
Trend-Confirmation:
Requires price and EMA alignment
Filters counter-trend patterns
Exit Optimization:
pinescript
// Delay implementation
if exit_signal_triggered
counter := 2 // Start countdown
else if counter > 0
counter -= 1 // Decrement each bar
exit_trade = (counter == 1) // Execute on final bar
Risk Parameters
Parameter Value Description
Stop Loss 5% Fixed risk per trade
Trailing Stop 1% Locks in profits
Exit Delay 2 bars Reduces false exits
Position Size 100% No pyramiding
Visualization Examples
🟢 Green Triangle: Bullish entry
🔴 Red Triangle: Bearish entry
⬇️ Blue X: Long exit (after delay)
⬆️ Green X: Short exit (after delay)
🎯 Pattern Labels: Identifies hammer/engulfing
Recommended Use
Timeframes: 1H-4H (reduces noise)
Markets: Trend-prone assets (FX, indices)
Best Conditions: Strong trending markets
Avoid: Choppy/Ranging markets

Livermore-Seykota Breakout StrategyStrategy Name: Livermore-Seykota Breakout Strategy
Objective: Execute breakout trades inspired by Jesse Livermore, filtered by trend confirmation (Ed Seykota) and risk-managed with ATR (Paul Tudor Jones style).
Entry Conditions:
Long Entry:
Close price breaks above recent pivot high.
Price is above main EMA (EMA50).
EMA20 > EMA200 (uptrend confirmation).
Current volume > 20-period SMA (volume confirmation).
Short Entry:
Close price breaks below recent pivot low.
Price is below main EMA (EMA50).
EMA20 < EMA200 (downtrend confirmation).
Current volume > 20-period SMA.
Exit Conditions:
Stop-loss: ATR × 3 from entry price.
Trailing stop: activated with offset of ATR × 2.
Strengths:
Trend-aligned entries with volume breakout confirmation.
Dynamic ATR-based risk management.
Inspired by principles of three legendary traders.

Timeframe StrategyThis is a multi-timeframe trading strategy inspired by Ross Cameron's style, optimized for scalping and trend-following across various timeframes (1m, 5m, 15m, 1h, and 1D). The strategy integrates a comprehensive set of technical indicators, dynamic risk management, and visual tools.
Core Features
Dynamic Take Profit, Stop Loss & Trailing Stop
> Separate settings per timeframe for:
-TP% (Take Profit)
-SL% (Stop Loss)
-Trailing Stop %
-Cooldown bars
> Configurable via UI inputs.
>Smart Entry Conditions
Bullish entry: EMA9 crossover EMA20 and EMA50 > EMA200
Bearish entry: EMA9 crossunder EMA20 and EMA50 < EMA200
>Additional confirmation filters:
-Volume Filter (enabled/disabled via UI)
-Time Filter (e.g., only between 15:00–20:00 UTC)
-Spike Filter: rejects high-volatility candles
-RSI Filter: above/below 50 for trend confirmation
-ADX Filter (only applied on 1m, e.g., ADX > 15)
-Micro-Volatility Filter: minimum range percentage (1m only)
-Trend Filter (1m only): price must be above/below EMA200
>Trailing Stop Logic
-Configurable for each timeframe.
- Optional via toggle (use_trailing).
>Trade Cooldown Logic
-Prevents consecutive trades within X bars, configurable per timeframe.
>Technical Indicators Used
-EMA 9 / 20 / 50 / 200
-VWAP
-RSI (14)
-ATR (14) for volatility-based spike filtering
-Custom-calculated ADX (14) (manually implemented)
>Visual Elements
🔼/🔽 Entry signals (long/short) plotted on the chart.
📉 Table in bottom-left:
Displays current values of EMA/VWAP/volume/ATR/ADX.
> Optional "Tab info" panel in top-right (toggleable):
-Timeframe & strategy settings
-Live status of filters (volume, time, cooldown, spike, RSI, ADX, range, trend)
-Uses emoji (✅ / ❌) for quick diagnostics.
>User Customization
-Inputs per timeframe for all key parameters.
-Toggle switches for:
-Trailing stop
-Volume filter
-Info table visibility
This strategy is designed for active traders seeking a balance between momentum entry, risk control, and adaptability across timeframes. It's ideal for backtesting quick reversals or breakout setups in fast markets, especially at lower timeframes like 1m or 5m.

[blackcat] L3 Twin Range Filter ProOVERVIEW
The L3 Twin Range Filter Pro indicator enhances trading strategies by filtering out market noise through a sophisticated dual-range approach. Unlike previous versions, this script not only provides clear visual indications of buy/sell signals but also incorporates a dynamic trend range filter line. By averaging two smoothed exponential moving averages—one fast and one slow—the indicator generates upper and lower range boundaries that adapt to changing market conditions. Traders can easily spot buy/sell opportunities when the closing price crosses these boundaries, supported by configurable alerts for real-time notifications.
FEATURES
Dual-Range Calculation: Combines fast and slow moving averages to create adaptive range boundaries.
Customizable Parameters:
Periods: Adjustable lengths for fast (default 9 bars) and slow (default 34 bars) moving averages.
Multipliers: Coefficients to modify the distance of the trailing lines from the price.
Dynamic Trend Range Filter Line: Visually displays buy/sell signals directly on the chart.
Trailing Stop Loss Logic: Automatically follows price movements to act as a trailing stop loss indicator.
Trade Signals: Clearly indicates buy/sell points with labeled signals.
Alerts: Configurable notifications for buy/sell signals to keep traders informed.
Visual Enhancements: Colored fills and dynamic boundary lines for easy interpretation.
HOW TO USE
Add the L3 Twin Range Filter Pro indicator to your TradingView chart.
Customize the input parameters:
Price Source: Choose the desired price source (e.g., Close).
Show Trade Signals: Toggle on/off for displaying buy/sell labels.
Fast Period: Set the period for the fast moving average (default 9 bars).
Slow Period: Set the period for the slow moving average (default 34 bars).
Fast Range Multiplier: Adjust the multiplier for the fast moving average.
Slow Range Multiplier: Adjust the multiplier for the slow moving average.
Monitor the plotted trend range filter and dynamic boundaries on the chart.
Identify buy/sell signals based on the crossing of price and range boundaries.
Configure alerts for real-time notifications when signals are triggered.
TRADE LOGIC
BUY Signal: Triggered when the price is higher than or equal to the upper range level. The indicator line will trail just below the price, acting as a trailing stop loss.
SELL Signal: Triggered when the price is lower than or equal to the lower range level. The indicator line will trail just above the price, serving as a trailing stop loss.
LIMITATIONS
The performance of this indicator relies on the selected periods and multipliers.
Market volatility can impact the accuracy of the signals.
Always complement this indicator with other analytical tools for robust decision-making.
NOTES
Experiment with different parameter settings to optimize the indicator for various market conditions.
Thoroughly backtest the indicator using historical data to ensure its compatibility with your trading strategy.
THANKS
A big thank you to Colin McKee for his foundational work on the Twin Range Filter! Your contributions have paved the way for enhanced trading tools. 🙏📈🔍

Breadth-Driven Swing StrategyWhat it does
This script trades the S&P 500 purely on market breadth extremes:
• Data source : INDEX:S5TH = % of S&P 500 stocks above their own 200-day SMA (range 0–100).
• Buy when breadth is washed-out.
• Sell when breadth is overheated.
It is long-only by design; shorting and ATR trailing stops have been removed to keep the logic minimal and transparent.
⸻
Signals in plain English
1. Long entry
A. A 200-EMA trough in breadth is printed and the trough value is ≤ 40 %.
or
B. A 5-EMA trough appears, its prominence passes the user threshold, and the lowest breadth reading in the last 20 bars is ≤ 20 %.
(Toggle this secondary trigger on/off with “ Enter also on 5-EMA trough ”.)
2. Exit (close long)
First 200-EMA peak whose breadth value is ≥ 70 %.
3. Risk control
A fixed stop-loss (% of entry price, default 8 %) is attached to every long trade.
⸻
Key parameters (defaults shown)
• Long EMA length 200 • Short EMA length 5
• Peak prominence 0.5 pct-pts • Trough prominence 3 pct-pts
• Peak level 70 % • Trough level 40 % • 5-EMA trough level 20 %
• Fixed stop-loss 8 %
• “Enter also on 5-EMA trough” = true (allows additional entries on extreme momentum reversals)
Feel free to tighten or relax any of these thresholds to match your risk profile or account for different market regimes.
⸻
How to use it
1. Load the script on a daily SPX / SPY chart.
(The price chart drives order execution; the breadth series is pulled internally and does not need to be on the chart.)
2. Verify the breadth feed.
INDEX:S5TH is updated after each session; your broker must provide it.
3. Back-test across several cycles.
Two decades of daily data is recommended to see how the rules behave in bear markets, range markets, and bull trends.
4. Adjust position sizing in the Properties tab.
The default is “100 % of equity”; change it if you prefer smaller allocations or pyramiding caps.
⸻
Why it can help
• Breadth signals often lead price, allowing entries before index-level momentum turns.
• Simple, rule-based exits prevent “waiting for confirmation” paralysis.
• Only one input series—easy to audit, no black-box math.
Trade-offs
• Relies on a single breadth metric; other internals (advance/decline, equal-weight returns, etc.) are ignored.
• May sit in cash during shallow pullbacks that never push breadth ≤ 40 %.
• Signals arrive at the end of the session (breadth is EoD data).
⸻
Disclaimer
This script is provided for educational purposes only and is not financial advice. Markets are risky; test thoroughly and use your own judgment before trading real money.
ストラテジー概要
本スクリプトは S&P500 のマーケットブレッド(内部需給) だけを手がかりに、指数をスイングトレードします。
• ブレッドデータ : INDEX:S5TH
(S&P500 採用銘柄のうち、それぞれの 200 日移動平均線を上回っている銘柄比率。0–100 %)
• 買い : ブレッドが極端に売られたタイミング。
• 売り : ブレッドが過熱状態に達したタイミング。
余計な機能を削り、ロングオンリー & 固定ストップ のシンプル設計にしています。
⸻
シグナルの流れ
1. ロングエントリー
• 条件 A : 200-EMA がトラフを付け、その値が 40 % 以下
• 条件 B : 5-EMA がトラフを付け、
・プロミネンス条件を満たし
・直近 20 本のブレッドス最小値が 20 % 以下
• B 条件は「5-EMA トラフでもエントリー」を ON にすると有効
2. ロング決済
最初に出現した 200-EMA ピーク で、かつ値が 70 % 以上 のバーで手仕舞い。
3. リスク管理
各トレードに 固定ストップ(初期価格から 8 %)を設定。
⸻
主なパラメータ(デフォルト値)
• 長期 EMA 長さ : 200 • 短期 EMA 長さ : 5
• ピーク判定プロミネンス : 0.5 %pt • トラフ判定プロミネンス : 3 %pt
• ピーク水準 : 70 % • トラフ水準 : 40 % • 5-EMA トラフ水準 : 20 %
• 固定ストップ : 8 %
• 「5-EMA トラフでもエントリー」 : ON
相場環境やリスク許容度に合わせて閾値を調整してください。
⸻
使い方
1. 日足の SPX / SPY チャート にスクリプトを適用。
2. ブレッドデータの供給 (INDEX:S5TH) がブローカーで利用可能か確認。
3. 20 年以上の期間でバックテスト し、強気相場・弱気相場・レンジ局面での挙動を確認。
4. 資金配分 は プロパティ → 戦略実行 で調整可能(初期値は「資金の 100 %」)。
⸻
強み
• ブレッドは 価格より先行 することが多く、天底を早期に捉えやすい。
• ルールベースの出口で「もう少し待とう」と迷わずに済む。
• 入力 series は 1 本のみ、ブラックボックス要素なし。
注意点・弱み
• 単一指標に依存。他の内部需給(A/D ライン等)は考慮しない。
• 40 % を割らない浅い押し目では機会損失が起こる。
• ブレッドは終値ベースの更新。ザラ場中の変化は捉えられない。
⸻
免責事項
本スクリプトは 学習目的 で提供しています。投資助言ではありません。
実取引の前に必ず自己責任で十分な検証とリスク管理を行ってください。

Express Generator StrategyExpress Generator Strategy
Pine Script™ v6
The Express Generator Strategy is an algorithmic trading system that harnesses confluence from multiple technical indicators to optimize trade entries and dynamic risk management. Developed in Pine Script v6, it is designed to operate within a user-defined backtesting period—ensuring that trades are executed only during chosen historical windows for targeted analysis.
How It Works:
- Entry Conditions:
The strategy relies on a dual confirmation approach:- A moving average crossover system where a fast (default 9-period SMA) crossing above or below a slower (default 21-period SMA) average signals a potential trend reversal.
- MACD confirmation; trades are only initiated when the MACD line crosses its signal line in the direction of the moving average signal.
- An RSI filter refines these signals by preventing entries when the market might be overextended—ensuring that long entries only occur when the RSI is below an overbought level (default 70) and short entries when above an oversold level (default 30).
- Risk Management & Dynamic Position Sizing:
The strategy takes a calculated approach to risk by enabling the adjustment of position sizes using:- A pre-defined percentage of equity risk per trade (default 1%, adjustable between 0.5% to 3%).
- A stop-loss set in pips (default 100 pips, with customizable ranges), which is then adjusted by market volatility measured through the ATR.
- Trailing stops (default 50 pips) to help protect profits as the market moves favorably.
This combination of volatility-adjusted risk and equity-based position sizing aims to harmonize trade exposure with prevailing market conditions.
- Backtest Period Flexibility:
Users can define the start and end dates for backtesting (e.g., January 1, 2020 to December 31, 2025). This ensures that the strategy only opens trades within the intended analysis window. Moreover, if the strategy is still holding a position outside this period, it automatically closes all trades to prevent unwanted exposure.
- Visual Insights:
For clarity, the strategy plots the fast (blue) and slow (red) moving averages directly on the chart, allowing for visual confirmation of crossovers and trend shifts.
By integrating multiple technical indicators with robust risk management and adaptable position sizing, the Express Generator Strategy provides a comprehensive framework for capturing trending moves while prudently managing downside risk. It’s ideally suited for traders looking to combine systematic entries with a disciplined and dynamic risk approach.

Clenow MomentumClenow Momentum Method
The Clenow Momentum Method, developed by Andreas Clenow, is a systematic, quantitative trading strategy focused on capturing medium- to long-term price trends in financial markets. Popularized through Clenow’s book, Stocks on the Move: Beating the Market with Hedge Fund Momentum Strategies, the method leverages momentum—an empirically observed phenomenon where assets that have performed well in the recent past tend to continue performing well in the near future.
Theoretical Foundation
Momentum investing is grounded in behavioral finance and market inefficiencies. Investors often exhibit herding behavior, underreact to new information, or chase trends, causing prices to trend beyond fundamental values. Clenow’s method builds on academic research, such as Jegadeesh and Titman (1993), which demonstrated that stocks with high returns over 3–12 months outperform those with low returns over similar periods.
Clenow’s approach specifically uses **annualized momentum**, calculated as the rate of return over a lookback period (typically 90 days), annualized to reflect a yearly percentage. The formula is:
Momentum=(((Close N periods agoCurrent Close)^N252)−1)×100
- Current Close: The most recent closing price.
- Close N periods ago: The closing price N periods back (e.g., 90 days).
- N: Lookback period (commonly 90 days).
- 252: Approximate trading days in a year for annualization.
This metric ranks stocks by their momentum, prioritizing those with the strongest upward trends. Clenow’s method also incorporates risk management, diversification, and volatility adjustments to enhance robustness.
Methodology
The Clenow Momentum Method involves the following steps:
1. Universe Selection:
- A broad universe of liquid stocks is chosen, often from major indices (e.g., S&P 500, Nasdaq 100) or global exchanges.
- Filters should exclude illiquid stocks (e.g., low average daily volume) or those with extreme volatility.
2. Momentum Calculation:
- Stocks are ranked based on their annualized momentum over a lookback period (typically 90 days, though 60–120 days can be common tests).
- The top-ranked stocks (e.g., top 10–20%) are selected for the portfolio.
3. Volatility Adjustment (Optional):
- Clenow sometimes adjusts momentum scores by volatility (e.g., dividing by the standard deviation of returns) to favor stocks with smoother trends.
- This reduces exposure to erratic price movements.
4. Portfolio Construction:
- A diversified portfolio of 10–25 stocks is constructed, with equal or volatility-weighted allocations.
- Position sizes are often adjusted based on risk (e.g., 1% of capital per position).
5. Rebalancing:
- The portfolio is rebalanced periodically (e.g., weekly or monthly) to maintain exposure to high-momentum stocks.
- Stocks falling below a momentum threshold are replaced with higher-ranked candidates.
6. Risk Management:
- Stop-losses or trailing stops may be applied to limit downside risk.
- Diversification across sectors reduces concentration risk.
Implementation in TradingView
Key features include:
- Customizable Lookback: Users can adjust the lookback period in pinescript (e.g., 90 days) to align with Clenow’s methodology.
- Visual Cues: Background colors (green for positive, red for negative momentum) and a zero line help identify trend strength.
- Integration with Screeners: TradingView’s stock screener can filter high-momentum stocks, which can then be analyzed with the custom indicator.
Strengths
1. Simplicity: The method is straightforward, relying on a single metric (momentum) that’s easy to calculate and interpret.
2. Empirical Support: Backed by decades of academic research and real-world hedge fund performance.
3. Adaptability: Applicable to stocks, ETFs, or other asset classes, with flexible lookback periods.
4. Risk Management: Diversification and periodic rebalancing reduce idiosyncratic risk.
5. TradingView Integration: Pine Script implementation enables real-time visualization, enhancing decision-making for stocks like NVDA or SPY.
Limitations
1. Mean Reversion Risk: Momentum can reverse sharply in bear markets or during sector rotations, leading to drawdowns.
2. Transaction Costs: Frequent rebalancing increases trading costs, especially for retail traders with high commissions. This is not as prevalent with commission free trading becoming more available.
3. Overfitting Risk: Over-optimizing lookback periods or filters can reduce out-of-sample performance.
4. Market Conditions: Underperforms in low-momentum or highly volatile markets.
Practical Applications
The Clenow Momentum Method is ideal for:
Retail Traders: Use TradingView’s screener to identify high-momentum stocks, then apply the Pine Script indicator to confirm trends.
Portfolio Managers: Build diversified momentum portfolios, rebalancing monthly to capture trends.
Swing Traders: Combine with volume filters to target short-term breakouts in high-momentum stocks.
Cross-Platform Workflow: Integrate with Python scanners to rank stocks, then visualize on TradingView for trade execution.
Comparison to Other Strategies
Vs. Minervini’s VCP: Clenow’s method is purely quantitative, while Minervini’s Volatility Contraction Pattern (your April 11, 2025 query) combines momentum with chart patterns. Clenow is more systematic but less discretionary.
Vs. Mean Reversion: Momentum bets on trend continuation, unlike mean reversion strategies that target oversold conditions.
Vs. Value Investing: Momentum outperforms in bull markets but may lag value strategies in recovery phases.
Conclusion
The Clenow Momentum Method is a robust, evidence-based strategy that capitalizes on price trends while managing risk through diversification and rebalancing. Its simplicity and adaptability make it accessible to retail traders, especially when implemented on platforms like TradingView with custom Pine Script indicators. Traders must be mindful of transaction costs, mean reversion risks, and market conditions. By combining Clenow’s momentum with volume filters and alerts, you can optimize its application for swing or position trading.

Trailing Monster StrategyTrailing Monster Strategy
This is an experimental trend-following strategy that incorporates a custom adaptive moving average (PKAMA), RSI-based momentum filtering, and dynamic trailing stop-loss logic. It is designed for educational and research purposes only, and may require further optimization or risk management considerations prior to live deployment.
Strategy Logic
The strategy attempts to participate in sustained price trends by combining:
- A Power Kaufman Adaptive Moving Average (PKAMA) for dynamic trend detection,
- RSI and Simple Moving Average (SMA) filters for market condition confirmation,
- A delayed trailing stop-loss to manage exits once a trade is in profit.
Entry Conditions
Long Entry:
- RSI exceeds the overbought threshold (default: 70),
- Price is trading above the 200-period SMA,
- PKAMA slope is positive (indicating upward momentum),
- A minimum number of bars have passed since the last entry.
Short Entry:
- RSI falls below the oversold threshold (default: 30),
- Price is trading below the 200-period SMA,
- PKAMA slope is negative (indicating downward momentum),
-A minimum number of bars have passed since the last entry.
Exit Conditions
- A trailing stop-loss is applied once the position has been open for a user-defined number of bars.
- The trailing distance is calculated as a fixed percentage of the average entry price.
Technical Notes
This script implements a custom version of the Power Kaufman Adaptive Moving Average (PKAMA), conceptually inspired by alexgrover’s public implementation on TradingView .
Unlike traditional moving averages, PKAMA dynamically adjusts its responsiveness based on recent market volatility, allowing it to better capture trend changes in fast-moving assets like altcoins.
Disclaimer
This strategy is provided for educational purposes only.
It is not financial advice, and no guarantee of profitability is implied.
Always conduct thorough backtesting and forward testing before using any strategy in a live environment.
Adjust inputs based on your individual risk tolerance, asset class, and trading style.
Feedback is encouraged. You are welcome to fork and modify this script to suit your own preferences and market approach.

Smart Grid Scalping (Pullback) Strategy[BullByte]The Smart Grid Scalping (Pullback) Strategy is a high-frequency trading strategy designed for short-term traders who seek to capitalize on market pullbacks. This strategy utilizes a dynamic ATR-based grid system to define optimal entry points, ensuring precise trade execution. It integrates volatility filtering and an RSI-based confirmation mechanism to enhance signal accuracy and reduce false entries.
This strategy is specifically optimized for scalping by dynamically adjusting trade levels based on current market conditions. The grid-based system helps capture retracement opportunities while maintaining strict trade management through predefined profit targets and trailing stop-loss mechanisms.
Key Features :
1. ATR-Based Grid System :
- Uses a 10-period ATR to dynamically calculate grid levels for entry points.
- Prevents chasing trades by ensuring price has reached key levels before executing entries.
2. No Trade Zone Protection :
- Avoids low-volatility zones where price action is indecisive.
- Ensures only high-momentum trades are executed to improve success rate.
3. RSI-Based Entry Confirmation :
- Long trades are triggered when RSI is below 30 (oversold) and price is in the lower grid zone.
- Short trades are triggered when RSI is above 70 (overbought) and price is in the upper grid zone.
4. Automated Trade Execution :
- Long Entry: Triggered when price drops below the first grid level with sufficient volatility.
- Short Entry: Triggered when price exceeds the highest grid level with sufficient volatility.
5. Take Profit & Trailing Stop :
- Profit target set at a customizable percentage (default 0.2%).
- Adaptive trailing stop mechanism using ATR to lock in profits while minimizing premature exits.
6. Visual Trade Annotations :
- Clearly labeled "LONG" and "SHORT" markers appear at trade entries for better visualization.
- Grid levels are plotted dynamically to aid decision-making.
Strategy Logic :
- The script first calculates the ATR-based grid levels and ensures price action has sufficient volatility before allowing trades.
- An additional RSI filter is used to ensure trades are taken at ideal market conditions.
- Once a trade is executed, the script implements a trailing stop and predefined take profit to maximize gains while reducing risks.
---
Disclaimer :
Risk Warning :
This strategy is provided for educational and informational purposes only. Trading involves significant risk, and past performance is not indicative of future results. Users are advised to conduct their own due diligence and risk management before using this strategy in live trading.
The developer and publisher of this script are not responsible for any financial losses incurred by the use of this strategy. Market conditions, slippage, and execution quality can affect real-world trading outcomes.
Use this script at your own discretion and always trade responsibly.

MACD Volume Strategy (BBO + MACD State, Reversal Type)Overview
MACD Volume Strategy (BBO + MACD State, Reversal Type) is a momentum-based reversal system that combines MACD crossover logic with volume filtering to enhance signal accuracy and minimize noise. It aims to identify structural trend shifts and manage risk using predefined parameters.
※This strategy is for educational and research purposes only. All results are based on historical simulations and do not guarantee future performance.
Strategy Objectives
Identify early trend transitions with high probability
Filter entries using volume dynamics to validate momentum
Maintain continuous exposure using a reversal-style model
Apply a consistent 1:1.5 risk-to-reward ratio per trade
Key Features
Integrated MACD and volume oscillator filtering
Zero repainting (all signals confirmed on closed candles)
Automatic position flipping for seamless direction shifts
Stop-loss and take-profit based on recent structural highs/lows
Trading Rules
Long Entry Conditions
MACD crosses above the zero line (BBO Buy arrow)
Volume oscillator is positive (short EMA > long EMA)
MACD is above the signal line
Close any existing short and enter a new long
Short Entry Conditions
MACD crosses below the zero line (BBO Sell arrow)
Volume oscillator is positive
MACD is below the signal line
Close any existing long and enter a new short
Exit Rules
Take Profit (TP) = Entry ± (risk distance × 1.5)
Stop Loss (SL) = Recent swing low (for long) or high (for short)
Early Exit = Triggered when a reversal signal appears (flip logic)
Risk Management Parameters
Pair: ETH/USD
Timeframe: 10-minute
Starting Capital: $3,000
Commission: 0.02%
Slippage: 2 pip
Risk per Trade: 5% of account equity (adjusted for sustainable practice)
Total Trades: 312 (backtest on selected dataset)
※Risk parameters are fully configurable and should be adjusted to suit each trader's personal setup and broker conditions.
Parameters & Configurations
Volume Short Length: 6
Volume Long Length: 12
MACD Fast Length: 11
MACD Slow Length: 21
Signal Smoothing: 10
Oscillator MA Type: SMA
Signal Line MA Type: SMA
Visual Support
Green arrow = Long entry
Red arrow = Short entry
MACD lines, signal line, and histogram
SL/TP markers plotted directly on the chart
Strategic Advantages & Uniqueness
Volume filtering eliminates low-participation, weak signals
Structurally aligned SL/TP based on recent market pivots
No repainting — decisions are made only on closed candles
Always in the market due to the reversal-style framework
Inspirations & Attribution
This strategy is inspired by the excellent work of:
Bitcoinblockchainonline – “BBO_Roxana_Signals MACD + vol”
Leveraging MACD zero-line cross and volume oscillator for intuitive signal generation.
HasanRifat – “MACD Fake Filter ”
Introduced a signal filter using MACD wave height averaging to reduce false positives.
This strategy builds upon those ideas to create a more automated, risk-aware, and technically adaptive system.
Summary
MACD Volume Strategy is a clean, logic-first automated trading system built for precision-seeking traders. It avoids discretionary bias and provides consistent signal logic under backtested historical conditions.
100% mechanical — no discretionary input required
Designed for high-confidence entries
Can be extended with filters, alerts, or trailing stops
※Strategy performance depends on market context. Past performance is not indicative of future results. Use with proper risk management and careful configuration.

Rev & Line - CoffeeKillerRev & Line - CoffeeKiller Indicator Guide
🔔 Warning: This Indicator Repaints 🔔 This indicator uses real-time calculations that may change based on future price action. As a result, signals (such as arrows, lines, or color changes) **can and will repaint** — meaning they may appear, disappear, or shift after a candle closes.
**Do not rely on this tool alone for live trading decisions.** Use with caution and always confirm with non-repainting tools or additional analysis.(This indicator is designed to show me the full length of the trend and because of this there can be a smaller movement inside of the trend movement)
Welcome traders! This guide will walk you through the Rev & Line indicator, a sophisticated technical analysis tool developed by CoffeeKiller that combines multiple methodologies to identify market pivots, trends, and potential reversal points.
Core Components
1. ZigZag Analysis
- Dynamic pivot detection using ATR (Average True Range)
- Customizable sensitivity through ATR Reversal Factor
- Color-coded trend lines (green for upward, red for downward)
- Optional vertical lines at pivot points
- Real-time pivot point analysis
2. Donchian Channel Integration
- Traditional upper, lower, and middle bands
- Customizable length and displacement
- Channel-based entry signals
- Dynamic market structure visualization
3. Marker Lines System
- Dynamic support/resistance level tracking
- Pivot-based reset mechanism
- Optional fill zones between markers
- Percentage position tracking within range
4. Signal Generation System
- Confluence between ZigZag pivots and Donchian channels
- Up/down arrow visualization
- Alert system
Main Features
ZigZag Settings
- ATR Reversal Factor: Controls pivot sensitivity (default 3.2)
- Customizable line appearance:
Width control (default: 3)
Color selection (green for uptrend, red for downtrend)
Vertical line options at pivot points
Maximum vertical lines display limit
- Hide repainted option for more reliable signals
Donchian Channel Configuration
- Optional channel visibility toggle
- Length parameter for lookback period (default: 20)
- Displace option for time offset
- Bubble offset for visual placement
Marker Lines System
- High/low/middle marker lines with step-line visualization
- Dotted line projections for future reference
- Pivot-based reset mechanism
- Color-coded percentage position display
Signal Generation
- Triangle markers for signals
- Combined ZigZag and Donchian confluence
- Alert system for notifications
Visual Elements
1. Pivot Lines
- Green: Upward price movements
- Red: Downward price movements
- Customizable line width
- Optional vertical pivot markers with style options:
Solid lines for confirmed pivots
Dashed lines for older pivots
Dotted lines for most recent pivots
2. Donchian Channels
- Upper band (red): Resistance level
- Lower band (green): Support level
- Middle band (yellow): Median price line
- Customizable display options
3. Marker Lines
- High marker line (magenta): Tracks highest open price
- Low marker line (cyan): Tracks lowest open price
- Middle marker line (blue): 50% level between high/low
- Dotted line extensions for future price projections
4. Position Tracking
- Percentage position display within marker range
- Real-time calculations from 0% to 100%
- Label system for visual reference
Trading Applications
1. Trend Following
- Enter on confirmed ZigZag pivot points
- Use Donchian channel boundaries as targets
- Trail stops using marker lines
- Monitor for confluence between systems
2. Counter-Trend Trading
- Trade bounces from marker lines
- Use pivot confirmation for entry timing
- Set stops based on recent pivot points
- Target the opposite marker line
3. Range Trading
- Use high/low marker lines to define range
- Trade bounces between upper and lower markers
- Consider middle marker for range midpoint
- Monitor percentage position within range
4. Breakout Trading
- Enter on breaks above/below marker lines
- Confirm with Donchian channel breakouts
- Use ZigZag pivot confirmations
- Wait for arrow signals for additional confirmation
Optimization Guide
1. ZigZag Parameters
- Higher ATR Factor: Less sensitive, major moves only
- Lower ATR Factor: More sensitive, catches minor moves
- Adjust line width for chart visibility
- Balance vertical line count for clarity
2. Donchian Channel Settings
- Longer length: Smoother channels, fewer false signals
- Shorter length: More responsive, but potentially noisier
- Displacement: Offset for historical reference
- Consider timeframe when setting parameters
3. Marker Line Configuration
- Enable/disable based on trading style
- Toggle middle line for additional reference
- Adjust colors for visual clarity
- Enable/disable labels as needed
4. Signal Generation
- Use "Hide repainted" option for more reliable signals
- Combine ZigZag and Donchian signals for confirmation
- Set alerts based on confirmed pivot points
- Balance sensitivity with reliability
Best Practices
1. Signal Confirmation
- Wait for confirmed pivot points
- Check for Donchian channel interactions
- Confirm with price action
- Look for arrow signals at pivot points
2. Risk Management
- Use recent pivot points for stop placement
- Consider marker line boundaries for targets
- Don't trade against strong trends
- Wait for clear confluence between systems
3. Setup Optimization
- Start with default settings
- Adjust based on timeframe
- Fine-tune ATR sensitivity
- Match settings to trading style
Advanced Features
1. Alert System
- Customizable arrow alerts
- Pivot point notifications
- Text message alerts with ticker information
- Once-per-bar frequency option
2. Pivot Detection Logic
The indicator uses a sophisticated state-based approach to detect pivots:
- State transitions between "uptrend," "downtrend," and "undefined"
- ATR-based reversal detection
- Minimum movement threshold for pivot confirmation
- Historical pivot tracking and labeling
3. Marker Line Reset Mechanism
- Marker lines reset based on pivot detection
- Dynamic support/resistance level adjustment
- Percentage position calculation within range
- Automatic updates as market structure changes
Remember:
- Combine multiple confirmation signals
- Use appropriate timeframe settings
- Monitor both ZigZag and Marker signals
- Pay attention to Donchian channel interactions
- Consider market volatility when trading
This indicator works best when:
- Used with proper risk management
- Combined with other technical tools
- Applied to appropriate timeframes
- Signals are confirmed by price action
**DISCLAIMER**: This indicator and its signals are intended solely for educational and informational purposes. They do not constitute financial advice. Trading involves significant risk of loss. Always conduct your own analysis and consult with financial professionals before making trading decisions.

MLB Momentum IndicatorMLB Momentum Indicator is a no‐lookahead technical indicator designed to signal intraday trend shifts and potential reversal points. It combines several well‐known technical components—Moving Averages, MACD, RSI, and optional ADX & Volume filters—to deliver high‐probability buy/sell signals on your chart.
Below is an overview of how it works and what each part does:
1. Moving Average Trend Filter
The script uses two moving averages (fast and slow) to determine the primary trend:
isUpTrend if Fast MA > Slow MA
isDownTrend if Fast MA < Slow MA
You can select the MA method—SMA, EMA, or WMA—and customize lengths.
Why it matters: The indicator only gives bullish signals if the trend is up, and bearish signals if the trend is down, helping avoid trades that go against the bigger flow.
2. MACD Confirmation (Momentum)
Uses MACD (with user‐defined Fast, Slow, and Signal lengths) to check momentum:
macdBuySignal if the MACD line crosses above its signal line (bullish)
macdSellSignal if the MACD line crosses below its signal line (bearish)
Why it matters: MACD crossovers confirm an emerging momentum shift, aligning signals with actual price acceleration rather than random fluctuation.
3. RSI Overbought/Oversold Filter
RSI (Relative Strength Index) is calculated with a chosen length, plus Overbought & Oversold thresholds:
For long signals: the RSI must be below the Overbought threshold (e.g. 70).
For short signals: the RSI must be above the Oversold threshold (e.g. 30).
Why it matters: Prevents buying when price is already overbought or shorting when price is too oversold, filtering out possible poor‐risk trades.
4. Optional ADX Filter (Trend Strength)
If enabled, ADX must exceed a chosen threshold (e.g., 20) for a signal to be valid:
This ensures you’re only taking trades in markets that have sufficient directional momentum.
Why it matters: It weeds out choppy, sideways conditions where signals are unreliable.
5. Optional Volume Filter (High‐Participation Moves)
If enabled, the indicator checks whether current volume is above a certain multiple of its moving average (e.g., 1.5× average volume).
Why it matters: High volume often indicates stronger institutional interest, validating potential breakouts or reversals.
6. ATR & Chandelier (Visual Reference)
For reference only, the script can display ATR‐based stop levels or a Chandelier Exit line:
ATR (Average True Range) helps gauge volatility and can inform stop‐loss distances.
Chandelier Exit is a trailing stop technique that adjusts automatically as price moves.
Why it matters: Though this version of the script doesn’t execute trades, these lines help you see how far to place stops or how to ride a trend.
7. Final Bullish / Bearish Signal
When all conditions (trend, MACD, RSI, optional ADX, optional Volume) line up for a long, a green “Long” arrow appears.
When all conditions line up for a short, a red “Short” arrow appears.
Why it matters: You get a clear, on‐chart signal for each potential entry, rather than needing to check multiple indicators manually.
8. Session & Date Filtering
The script allows choosing a start/end date and an optional session window (e.g. 09:30–16:00).
Why it matters: Helps limit signals to a specific historical backtest range or trading hours, which can be crucial for day traders (e.g., stock market hours only).
Putting It All Together
Primary Trend → ensures you trade in line with the bigger direction.
MACD & RSI → confirm momentum and avoid overbought/oversold extremes.
ADX & Volume → optional filters for strong trend strength & genuine interest.
Arrows → each potential buy (Long) or sell (Short) signal is clearly shown on your chart.
Use Cases
5‐Minute Scalping: Shorter RSI/MACD lengths to catch small, frequent intraday moves.
Swing Trading: Larger MAs, bigger RSI thresholds, and using ADX to filter only major trends.
Cautious Approach: Enable volume & ADX filters to reduce false signals in choppy markets.
Benefits & Limitations
Benefits:
Consolidates multiple indicators into one overlay.
Clear buy/sell signals with optional dynamic volatility references.
Flexible user inputs adapt to different trading styles/timeframes.
Limitations:
Like all technical indicators, it can produce false signals in sideways or news‐driven markets.
Success depends heavily on user settings and the particular market’s behavior.
Summary
The MLB Momentum Indicator combines a trend filter (MAs), momentum check (MACD), overbought/oversold gating (RSI), and optional ADX/Volume filters to create clear buy/sell arrows on your chart. This approach encourages trading in sync with both trend and momentum, and helps avoid suboptimal entries when volume or trend strength is lacking. It can be tailored to scalp micro‐moves on lower timeframes or used for higher‐timeframe swing trading by adjusting the input settings.

IU BBB(Big Body Bar) StrategyDESCRIPTION
The IU BBB (Big Body Bar) Strategy is a price action-based trading strategy that identifies high-momentum candles with significantly larger body sizes compared to the average. It enters trades when a strong bullish or bearish move occurs and manages risk using an ATR-based trailing stop-loss system.
USER INPUTS:
- Big Body Threshold – Defines how many times larger the candle body should be compared to the average body ( default is 4 ).
- ATR Length – The period for the Average True Range (ATR) used in the trailing stop-loss calculation ( default is 14 ).
- ATR Factor – Multiplier for ATR to determine the trailing stop distance ( default is 2 ).
LONG CONDITION:
- The current candle’s body is greater than the average body size multiplied by the Big Body Threshold.
- The closing price is higher than the opening price (bullish candle).
SHORT CONDITION:
- The current candle’s body is greater than the average body size multiplied by the Big Body Threshold.
- The closing price is lower than the opening price (bearish candle).
LONG EXIT:
- ATR-based trailing stop-loss dynamically adjusts, locking in profits as the price moves higher.
SHORT EXIT:
- ATR-based trailing stop-loss dynamically adjusts, securing profits as the price moves lower.
WHY IT IS UNIQUE:
- Unlike traditional momentum strategies, this system adapts to volatility by filtering trades based on relative candle size.
- It incorporates an ATR-based trailing stop-loss, ensuring risk management and profit protection.
- The strategy avoids choppy market conditions by only trading when significant momentum is present.
HOW USERS CAN BENEFIT FROM IT:
- Catch Strong Price Moves – The strategy helps traders enter trades when the market shows decisive momentum.
- Effective Risk Management – The ATR-based trailing stop ensures that winning trades remain profitable.
- Works Across Markets – Can be applied to stocks, forex, crypto, and indices with proper optimization.
- Fully Customizable – Users can adjust sensitivity settings to match their trading style and time frame.
