Trend-based Price Action StrategyThis is a strategy script that combines trend-based price action analysis with the Relative Strength Index (RSI) and Exponential Moving Averages (EMA) as trend filters. Here's a summary of the key components and logic:
Price Action Candlestick Patterns:
Bullish patterns: Engulfing candle and Morning Star.
Bearish patterns: Engulfing candle and Evening Star.
RSI Integration:
RSI is used to identify overbought and oversold conditions.
EMA Trend Filter:
Three EMAs with different periods: Fast , Medium and Slow.
Long trend condition occur when the fast EMA is above the medium and the medium is above the slow EMA.
Short trend condition occur when the slow EMA is above the medium and the medium is above the fast EMA.
Long entry conditions: RSI is oversold, RSI is decreasing, bullish candlestick pattern, and EMA trend filter conditions are met.
Short entry conditions: RSI is overbought, RSI is decreasing, bearish candlestick pattern, and EMA trend filter conditions are met.
Exit conditions:
Take profit or stop loss is reached.
Plotting:
Signals are plotted on the chart when entry conditions are met.
EMAs are plotted when the EMA trend filter is enabled.
This script aims to capture potential trend reversal points based on a combination of candlestick patterns, RSI, and EMA trend analysis.
Traders can use this script as a starting point for further customization or as a reference for developing their own trading strategies. It's important to note that past performance is not indicative of future results, and thorough testing and validation are recommended before deploying any trading strategy.
스크립트에서 "Relative Strength Index (RSI)"에 대해 찾기

Multi Time Frame RSI PanelDescription:
The "Multi Time Frame RSI Panel" indicator is a powerful tool designed to help traders analyze the Relative Strength Index (RSI) across multiple timeframes simultaneously. While the core logic of this indicator is proprietary, this description aims to provide traders with an understanding of its functionality and utility.
Key Features:
Multi-Timeframe Analysis: This indicator displays RSI values for different timeframes, including 1 minute (1m), 5 minutes (5m), 15 minutes (15m), 30 minutes (30m), 1 hour (1h), 2 hours (2h), 4 hours (4h), and 1 day (1d). Traders can choose which timeframes to display on their chart based on their trading strategy.
Customizable Thresholds: Users can set upper and lower RSI thresholds for each timeframe, allowing for the identification of overbought and oversold conditions. The indicator highlights RSI values that breach these thresholds in green (for overbought) or red (for oversold), providing visual cues for potential trading opportunities.
How to Use:
1. Add the "Multi Time Frame RSI Panel" indicator to your TradingView chart.
2. Configure the settings by selecting the timeframes you want to monitor and setting your preferred RSI thresholds.
3. Monitor the RSI values for each selected timeframe in the panel located at the top right corner of your chart.
4. Look for potential trading signals based on RSI conditions, such as overbought or oversold levels, across different timeframes.

RSI Momentum TrendThe "RSI Momentum Trend" indicator is a valuable tool for traders seeking to identify momentum trends.
By utilizing the Relative Strength Index (RSI) and customizable momentum thresholds, this indicator helps traders spot potential bullish and bearish signals.
you can adjust input parameters such as the RSI period, positive and negative momentum thresholds, and visual settings to align with their trading strategies.
The indicator calculates the RSI and evaluates two momentum conditions: positive and negative.
The positive condition considers the previous RSI value, current RSI value, and positive change in the 5-period exponential moving average (EMA) of the closing price.
The negative condition looks at the current RSI value and negative change in the 5-period EMA.
Once a momentum condition is met, the indicator visually represents the signal on the chart.
The "RSI Momentum Trend" indicator provides you with a quick and effective way to identify momentum trends using RSI calculations.
By incorporating visual cues and customizable parameters, it assists traders in making informed decisions about potential market movements.

Trailing Stop with RSI - Momentum-Based StrategyTrailing Stop with RSI - Momentum-Based Strategy
Description:
The Trailing Stop with RSI strategy combines momentum analysis and trailing stop functionality to help traders identify potential entry and exit points in their trading decisions. This strategy is suitable for various markets and timeframes.
Key Features:
Momentum Analysis: The strategy incorporates momentum indicators to identify potential buying and selling opportunities based on momentum shifts in the price.
Trailing Stop Functionality: The strategy utilizes a trailing stop to protect profits and dynamically adjust the stop loss level as the trade moves in the desired direction.
RSI Confirmation: The Relative Strength Index (RSI) is included to provide additional confirmation for trade entries by considering overbought and oversold conditions.
How to Use:
Entry Conditions: Long positions are triggered when positive momentum is detected, and the RSI confirms an oversold condition. Short positions are triggered when negative momentum is detected, and the RSI confirms an overbought condition.
Trailing Stop Activation: Once a position is opened, the trailing stop is activated when the specified profit level (as a percentage) is reached.
Trailing Stop Level: The trailing stop maintains a stop loss level at a specified distance (as a percentage) from the highest profit achieved since opening the position.
Exit Conditions: The trailing stop will trigger an exit and close all positions when the trailing stop level is breached.
Markets and Conditions:
This strategy can be applied to various markets, including stocks, forex, cryptocurrencies, and commodities. It can be used in trending and ranging market conditions, making it versatile for different market environments.
Important Considerations:
Adjust Parameters: Traders can modify the length of the momentum and RSI indicators to suit their preferred timeframe and trading style.
Risk Management: It is recommended to consider appropriate position sizing, risk-to-reward ratios, and overall risk management practices when using this strategy.
Backtesting and Optimization: Traders are encouraged to backtest the strategy on historical data and optimize the parameters to find the best settings for their chosen market and timeframe.
By incorporating momentum analysis, trailing stop functionality, and RSI confirmation, this strategy aims to provide traders with a systematic approach to capturing profitable trades while managing risk effectively.

RSI of Zero Lag MA (ValueRay)The RSI of a Zero Lag Moving Average a powerful tool for for reliable exit signals.
The Relative Strength Index (RSI) is a widely recognized momentum oscillator that measures the speed and change of price movements. It provides valuable insights into overbought and oversold conditions, enabling traders to identify potential reversal points and take advantage of market inefficiencies.
The RSI of a Zero Lag Indicator takes this concept a step further by incorporating the Zero Lag Moving Average. The Zero Lag Moving Average is a cutting-edge indicator that minimizes lag and provides a smoother representation of price action, allowing for quicker and more precise responses to market movements.
By combining the RSI with the Zero Lag Moving Average, this indicator offers traders a superior exit strategy. When the RSI reaches extreme levels of overbought or oversold conditions, it indicates a potential reversal in the market. The Zero Lag Moving Average further enhances this signal by reducing delays and providing timely exit points.
Moreover, the RSI of a Zero Lag Indicator is not limited to mean reversion strategies. While it excels in identifying mean reversion opportunities, it can also be used in conjunction with other trading approaches. Traders can take advantage of its objective signals to exit trades profitably, regardless of their chosen strategy.
With its ability to accurately pinpoint overbought and oversold conditions, the RSI of a Zero Lag Indicator offers traders a competitive edge in the market. By providing timely exit signals and minimizing lag, it helps traders optimize their trading decisions and increase their chances of success.

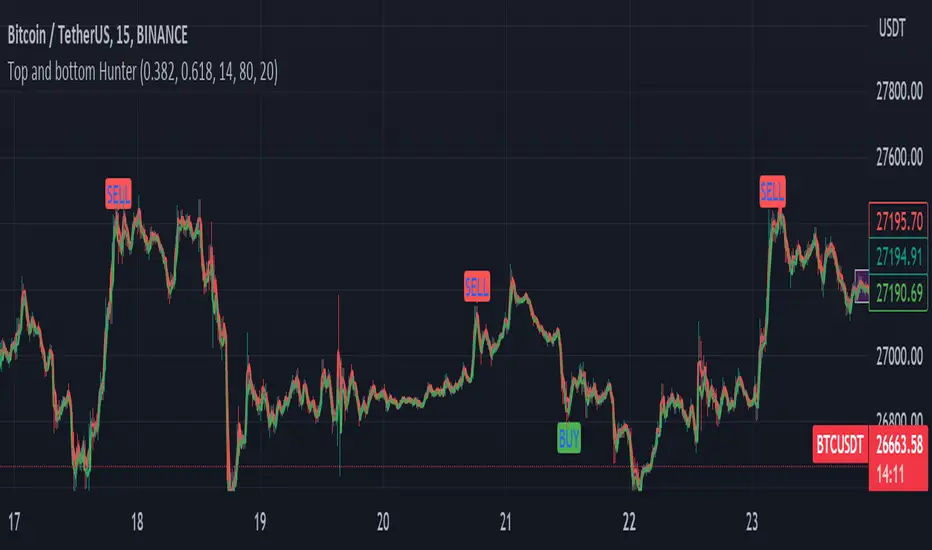
Fib top and bottom Hunter - No Repaint "Top and bottom Hunter" indicator combines two popular technical analysis tools, Fibonacci retracement levels and the Relative Strength Index (RSI), to identify potential trading opportunities in the market.
Fibonacci retracement levels are based on the Fibonacci sequence, a mathematical series where each number is the sum of the two preceding ones. In trading, Fibonacci retracement levels are used to identify potential support and resistance levels based on the recent price action. The indicator uses two Fibonacci levels, fib_0 and fib_1, which are typically set to 0.382 and 0.618, respectively. These levels represent common retracement ratios.
To calculate the Fibonacci levels, the indicator considers the highest and lowest prices within a specified range, typically the highest and lowest of the last two bars. It calculates the fib_range, which is the difference between the highest and lowest prices. Then, fib_level_0 and fib_level_1 are determined by subtracting the Fibonacci ratios from the highest price.
The RSI is a momentum oscillator that measures the speed and change of price movements. It helps identify overbought and oversold conditions in the market. The RSI parameters used in this indicator are rsi_length (length of the RSI calculation), rsi_overbought (upper threshold indicating overbought conditions), and rsi_oversold (lower threshold indicating oversold conditions). The RSI value is calculated based on the closing prices.
The indicator generates buy and sell signals based on specific conditions:
Buy Condition: A buy signal is triggered when the RSI crosses above the oversold level (rsi_oversold) and the closing price is higher than fib_level_1. This indicates a potential reversal or bounce from the Fibonacci support level.
Sell Condition: A sell signal is triggered when the RSI crosses below the overbought level (rsi_overbought) and the closing price is lower than fib_level_0. This suggests a potential reversal or pullback from the Fibonacci resistance level.
In summary, this indicator combines the power of Fibonacci retracement levels and the RSI to identify potential trading opportunities. It helps traders find confluence between the Fibonacci support or resistance levels and the RSI readings, indicating potential trend reversals or bounces. Traders can use this information to make informed decisions about entering or exiting positions in the market.
Feel free to change the settings for what works best for you and use this with other confluences. I personally use RSI overbought and oversold values as 80 and 20
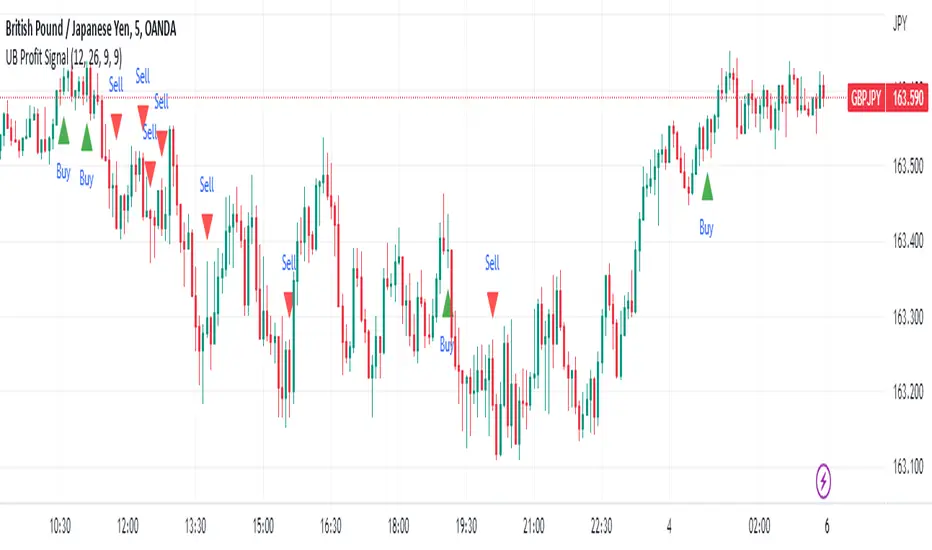
UB Profit Signal IndicatorThe UB Profit Signal indicator is a technical analysis tool designed to identify potential buy and sell signals in the market. The indicator is based on four technical indicators - Moving Average Convergence Divergence (MACD), Relative Strength Index (RSI), Bollinger Bands (BB), and volume moving average.
The script starts by defining input variables such as MACD Fast Length, MACD Slow Length, MACD Signal Length, RSI Length, etc. These variables are used to customize the indicator based on the user's preference.
The MACD is calculated using the ta.macd function, which returns three variables: the MACD Line, Signal Line, and Histogram. The MACD line is calculated as the difference between two exponential moving averages of the price. The signal line is a moving average of the MACD line. The histogram shows the difference between the MACD line and the signal line.
The RSI is calculated using the ta.rsi function, which calculates the RSI value based on the number of periods specified in the RSI Length input variable. The RSI is a momentum oscillator that measures the speed and change of price movements.
The Bollinger Bands are calculated using the ta.sma and ta.stdev functions. The Simple Moving Average (SMA) is calculated using the close price over 21 periods, while the Standard Deviation is calculated using the close price over the same 21 periods. The upper and lower bands are then calculated based on the SMA and Standard Deviation.
Finally, the buy and sell signals are generated based on specific conditions that combine the MACD, RSI, and BB values. For example, a buy signal is generated when the RSI value is greater than 30, the volume is greater than the volume moving average, the close price is greater than the 9-period SMA, and the close price is between the upper and lower BBs. Similarly, a sell signal is generated when the RSI value is less than 40, the volume is greater than the volume moving average, the close price is less than the 9-period SMA, and the close price is between the upper and lower BBs.
The buy and sell signals are plotted on the chart using the plotshape function, which creates triangular shapes above and below the bars to indicate the signals. Green triangles indicate a buy signal, while red triangles indicate a sell signal. Overall, the UB Profit Signal indicator can be useful for traders looking to identify potential buy and sell signals in the market and take advantage of price movements.
RSI Dashboard Monitor [Skiploss]RSI Dashboard Monitor is indicator for scanner Relative Strength Index ( RSI ) for 4 symbols and 10 Timeframe, detached from the main chart.
You can choose to display all 4 symbols or just 1 symbol, also can choose resolution (TF). Still, these 10 timeframes should be enough to use. Default is set to 14 but you can modify it from settings.
How it work??
RSI >= 75 : Fill color maximum overbought
RSI >= 65 : Fill color medium overbought
RSI >= 55 : Fill color minimum overbought
RSI >= 45 : Fill color minimum overbought
RSI >= 35 : Fill color medium overbought
RSI >= 25 : Fill color maximum overbought
** Values level and color style can modify it from settings

Simple RSI and SMA Long and Short (by Coinrule)The relative strength index ( RSI ) is a momentum indicator used in technical analysis . RSI measures the speed and magnitude of a security's recent price changes to evaluate overvalued or undervalued conditions in the price of that security. The RSI is displayed as an oscillator (a line graph) on a scale of zero to 100. The RSI can do more than point to overbought and oversold securities. It can also indicate securities that may be primed for a trend reversal or corrective pullback in price. It can signal when to buy and sell. Traditionally, an RSI reading of 70 or above indicates an overbought situation. A reading of 30 or below indicates an oversold condition.
A simple moving average ( SMA ) calculates the average of a selected range of prices, usually closing prices, by the number of periods in that range.
The Strategy enters and closes the trade when the following conditions are met:
LONG
SMA100 is greater than SMA150
RSI is greater than 50
SHORT
SMA100 is less than SMA150
RSI is less than 50
When a long position is opened, it remains open until the conditions for a short are met at which point the long position is closed and the short position is opened. Then, when the conditions for the long position are met, the short will be closed and a long will be opened.
This strategy is back tested from 1 January 2022 to simulate how the strategy would work in a bear market. The strategy provides good returns.
The strategy assumes each order is using 30% of the available coins to make the results more realistic and to simulate you only ran this strategy on 30% of your holdings. A trading fee of 0.1% is also taken into account and is aligned to the base fee applied on Binance.

Catching the Bottom (by Coinrule)This script utilises the RSI and EMA indicators to enter and close the trade.
The relative strength index (RSI) is a momentum indicator used in technical analysis. RSI measures the speed and magnitude of a security's recent price changes to evaluate overvalued or undervalued conditions in the price of that security. The RSI is displayed as an oscillator (a line graph) on a scale of zero to 100. The RSI can do more than point to overbought and oversold securities. It can also indicate securities that may be primed for a trend reversal or corrective pullback in price. It can signal when to buy and sell. Traditionally, an RSI reading of 70 or above indicates an overbought situation. A reading of 30 or below indicates an oversold condition.
An exponential moving average (EMA) is a type of moving average (MA) that places a greater weight and significance on the most recent data points. The exponential moving average is also referred to as the exponentially weighted moving average. An exponentially weighted moving average reacts more significantly to recent price changes than a simple moving average simple moving average (SMA), which applies an equal weight to all observations in the period.
The strategy enters and exits the trade based on the following conditions.
ENTRY
RSI has a decrease of 3.
RSI <40.
EMA100 has crossed above the EMA50.
EXIT
RSI is greater than 65.
EMA9 has crossed above EMA50.
This strategy is back tested from 1 April 2022 to simulate how the strategy would work in a bear market and provides good returns.
Pairs that produce very strong results include ETH on the 5m timeframe, BNB on 5m timeframe, XRP on the 45m timeframe, MATIC on the 30m timeframe and MATIC on the 2H timeframe.
The strategy assumes each order is using 30% of the available coins to make the results more realistic and to simulate you only ran this strategy on 30% of your holdings. A trading fee of 0.1% is also taken into account and is aligned to the base fee applied on Binance.

smoothed_rsi
Description:
A well-known and vastly used momentum indicator, a Relative Strength Index (RSI) by J. Welles Wilder Jr., aims to evaluate the current price to its oversold/overbought area while giving an overview of bearish/bullish momentum. In this indicator, simply adding the super-smoother function (John F. Ehlers) was applied to the RSI line to create a more smoothed line and reduce its noise.
RSI:
RSI = 100 - 100/(1+RS)
RS = AvgUp/AvgDown
super_smoother(rsi)
Notes:
RSI > 70 indicates overbought
RSI < 30 indicates oversold
direction of the RSI line
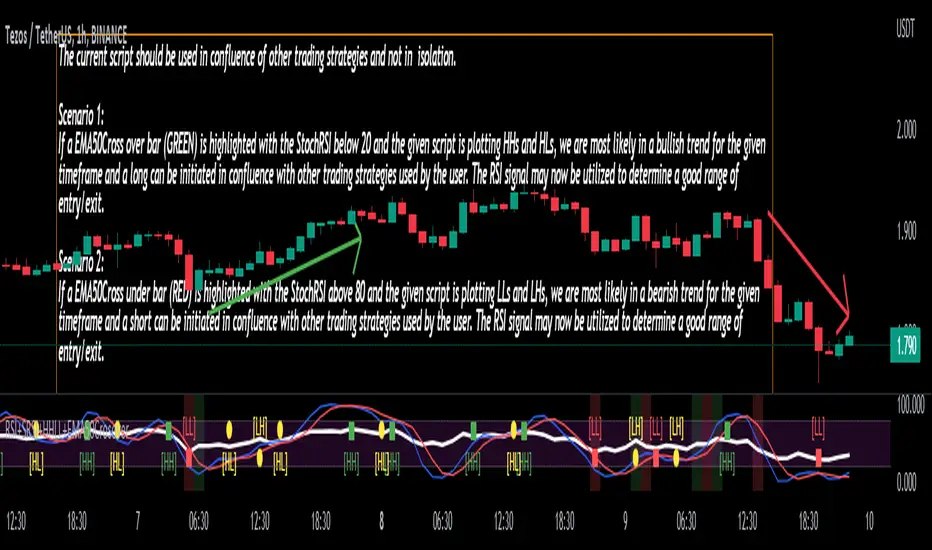
Stoch/RSI with EMA50 Cross & HHLLA hybrid but simple indicator that plots 4 strategies in one pane .
1) RSI Indicator
2) Stoch RSI
3) EMA50 Cross (To determine direction in current timeframe)
4) Higher Highs & Lower Lows to analyze the trend and break of trend
The relative strength index (RSI) is a momentum indicator used in technical analysis. It is displayed as an oscillator (a line graph) on a scale of zero to 100. When the RSI indicator crosses 30 on the RSI chart, it is a bullish sign and when it crosses 70, it is a bearish sign.
The Stochastic RSI (StochRSI) is also a momentum indicator used in technical analysis. It is displayed as an oscillator (a line graph) on a scale of zero to 100. When the StochRSI indicator crosses 20 on the RSI chart, it is a bullish sign and when it crosses 80, it is a bearish sign.
The EMA50Cross denotes two cases in the script:
a) A crossover of CMP on the EMA50 is highlighted by a green bar signals a possible bullish trend
b) A crossunder of CMP on the EMA50 is highlighted by a red bar signals a possible bearish trend
The HHLL is denoted by mneumonics HH, HL,LH, LL. A combination of HHs and HLs denotes a uptrend while the combination of LLs and LHs denoted a downtrend
The current script should be used in confluence of other trading strategies and not in isolation.
Scenario 1:
If a EMA50Cross over bar (GREEN) is highlighted with the StochRSI below 20 and the given script is plotting HHs and HLs, we are most likely in a bullish trend for the given timeframe and a long can be initiated in confluence with other trading strategies used by the user. The RSI signal may now be utilized to determine a good range of entry/exit.
Scenario 2:
If a EMA50Cross under bar (RED) is highlighted with the StochRSI above 80 and the given script is plotting LLs and LHs, we are most likely in a bearish trend for the given timeframe and a short can be initiated in confluence with other trading strategies used by the user. The RSI signal may now be utilized to determine a good range of entry/exit.
Disclaimer:
The current script should be used in confluence with other trading strategies and not in isolation. The scripts works best on 4H and 1D Timeframes and should be used with caution on lower timeframes.
This indicator is not intended to give exact entry or exit points for a trade but to provide a general idea of the trend & determine a good range for entering or exiting the trade. Please DYOR
Credit & References:
This script uses the default technical analysis reference library provided by PineScript (denoted as ta)
Variety RSI w/ Dynamic Zones [Loxx]Variety RSI w/ Dynamic Zones is an indicator with 7 different RSI types with Dynamic Zones. This indicator has signal crossing options for signal, middle, and all Dynamic Zone levels.
What is RSI?
The relative strength index ( RSI ) is a momentum indicator used in technical analysis . RSI measures the speed and magnitude of a security's recent price changes to evaluate overvalued or undervalued conditions in the price of that security.
The RSI is displayed as an oscillator (a line graph) on a scale of zero to 100. The indicator was developed by J. Welles Wilder Jr. and introduced in his seminal 1978 book, New Concepts in Technical Trading Systems.
The RSI can do more than point to overbought and oversold securities. It can also indicate securities that may be primed for a trend reversal or corrective pullback in price. It can signal when to buy and sell. Traditionally, an RSI reading of 70 or above indicates an overbought situation. A reading of 30 or below indicates an oversold condition.
What are Dynamic Zones?
As explained in "Stocks & Commodities V15:7 (306-310): Dynamic Zones by Leo Zamansky, Ph .D., and David Stendahl"
Most indicators use a fixed zone for buy and sell signals. Here’ s a concept based on zones that are responsive to past levels of the indicator.
One approach to active investing employs the use of oscillators to exploit tradable market trends. This investing style follows a very simple form of logic: Enter the market only when an oscillator has moved far above or below traditional trading lev- els. However, these oscillator- driven systems lack the ability to evolve with the market because they use fixed buy and sell zones. Traders typically use one set of buy and sell zones for a bull market and substantially different zones for a bear market. And therein lies the problem.
Once traders begin introducing their market opinions into trading equations, by changing the zones, they negate the system’s mechanical nature. The objective is to have a system automatically define its own buy and sell zones and thereby profitably trade in any market — bull or bear. Dynamic zones offer a solution to the problem of fixed buy and sell zones for any oscillator-driven system.
An indicator’s extreme levels can be quantified using statistical methods. These extreme levels are calculated for a certain period and serve as the buy and sell zones for a trading system. The repetition of this statistical process for every value of the indicator creates values that become the dynamic zones. The zones are calculated in such a way that the probability of the indicator value rising above, or falling below, the dynamic zones is equal to a given probability input set by the trader.
To better understand dynamic zones, let's first describe them mathematically and then explain their use. The dynamic zones definition:
Find V such that:
For dynamic zone buy: P{X <= V}=P1
For dynamic zone sell: P{X >= V}=P2
where P1 and P2 are the probabilities set by the trader, X is the value of the indicator for the selected period and V represents the value of the dynamic zone.
The probability input P1 and P2 can be adjusted by the trader to encompass as much or as little data as the trader would like. The smaller the probability, the fewer data values above and below the dynamic zones. This translates into a wider range between the buy and sell zones. If a 10% probability is used for P1 and P2, only those data values that make up the top 10% and bottom 10% for an indicator are used in the construction of the zones. Of the values, 80% will fall between the two extreme levels. Because dynamic zone levels are penetrated so infrequently, when this happens, traders know that the market has truly moved into overbought or oversold territory.
Calculating the Dynamic Zones
The algorithm for the dynamic zones is a series of steps. First, decide the value of the lookback period t. Next, decide the value of the probability Pbuy for buy zone and value of the probability Psell for the sell zone.
For i=1, to the last lookback period, build the distribution f(x) of the price during the lookback period i. Then find the value Vi1 such that the probability of the price less than or equal to Vi1 during the lookback period i is equal to Pbuy. Find the value Vi2 such that the probability of the price greater or equal to Vi2 during the lookback period i is equal to Psell. The sequence of Vi1 for all periods gives the buy zone. The sequence of Vi2 for all periods gives the sell zone.
In the algorithm description, we have: Build the distribution f(x) of the price during the lookback period i. The distribution here is empirical namely, how many times a given value of x appeared during the lookback period. The problem is to find such x that the probability of a price being greater or equal to x will be equal to a probability selected by the user. Probability is the area under the distribution curve. The task is to find such value of x that the area under the distribution curve to the right of x will be equal to the probability selected by the user. That x is the dynamic zone.
Included
RSI source pre-smoothing options
Bar coloring
4 types of signal crossing options
Alerts
Loxx's Expanded Source Types
Loxx's RSI Variety RSI types

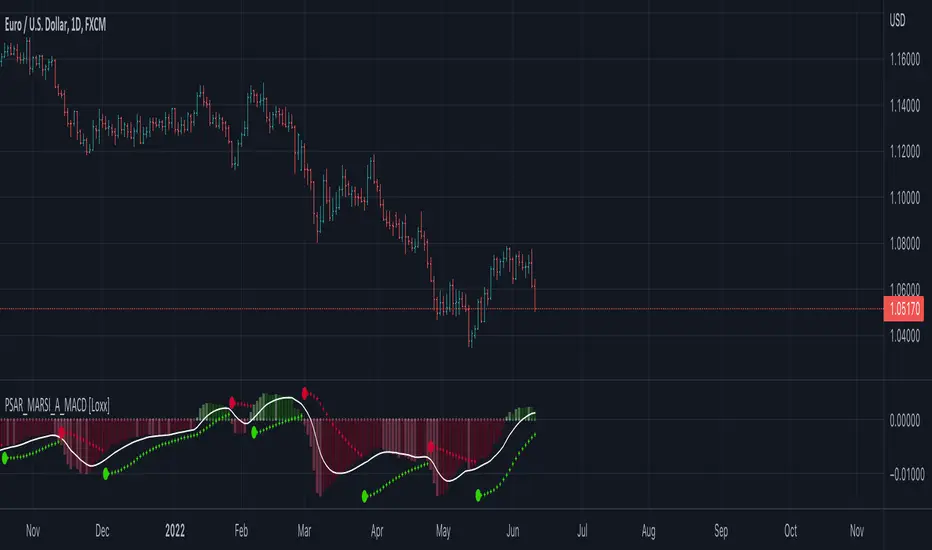
Parabolic SAR MARSI, Adaptive MACD [Loxx]Parabolic SAR MARSI, Adaptive MACD is a trend following indicator that combines MACD, Parabolic SAR, and RSI into a signal indicator.
What is Parabolic SAR?
The parabolic stop and reverse, more commonly known as the "Parabolic SAR," or "PSAR" is a trend-following indicator developed by J. Welles Wilder. It is displayed as a single parabolic line (or dots) underneath the price bars in an uptrend, and above the price bars in a downtrend.
What is MACD?
Moving average convergence divergence (MACD) is a trend-following momentum indicator that shows the relationship between two moving averages of a security’s price. The MACD is calculated by subtracting the 26-period exponential moving average (EMA) from the 12-period EMA.
What is RSI?
The relative strength index (RSI) is a momentum indicator used in technical analysis that measures the magnitude of recent price changes to evaluate overbought or oversold conditions in the price of a stock or other asset. The RSI is displayed as an oscillator (a line graph that moves between two extremes) and can have a reading from 0 to 100. The indicator was originally developed by J. Welles Wilder Jr. and introduced in his seminal 1978 book, “New Concepts in Technical Trading Systems.”
How to combine PSAR, MACD, and RSI into one:
1. Create a new type of moving average called MARSI. MARSI is like a typical moving average but it flexes to RSI sensitivities
2. Calculate MACD for the MARSI of High/Low values
3. Calculate the midpoint MACD between the High/Low MACDs created in step 2
4. Create a final MACD by calculating the MARSI for the midpoint MACD created in step 3
5. Finally, Inject these values into a customized Parabolic SAR function
Results:
-A unique spin on three different indicators that identifies trends of both RSI, MACD, and price of the underlying asset
-Entry, exit, and reversal points in price, RSI, and MACD
-A MACD that adapts to RSI
What's Included?
-Customization of all variables
-A variety of moving averages to smooth the signal line
-Customizable colors
-Alerts for MACD zero-line and signal crosses, and PSAR trend direction changes
Things to know:
-The histogram in this indicator is NOT the normal histogram found in the classic MACD indicator. The histogram here is a histogram of MACD itself. The classic histogram has questionable utility but the histogram in this indicator is very important and useful
-Parabolic SAR is calculated on the MARSI of High/Low values
Future releases:
-Divergences
-Regular, continuation, and exit signals
Happy trading!
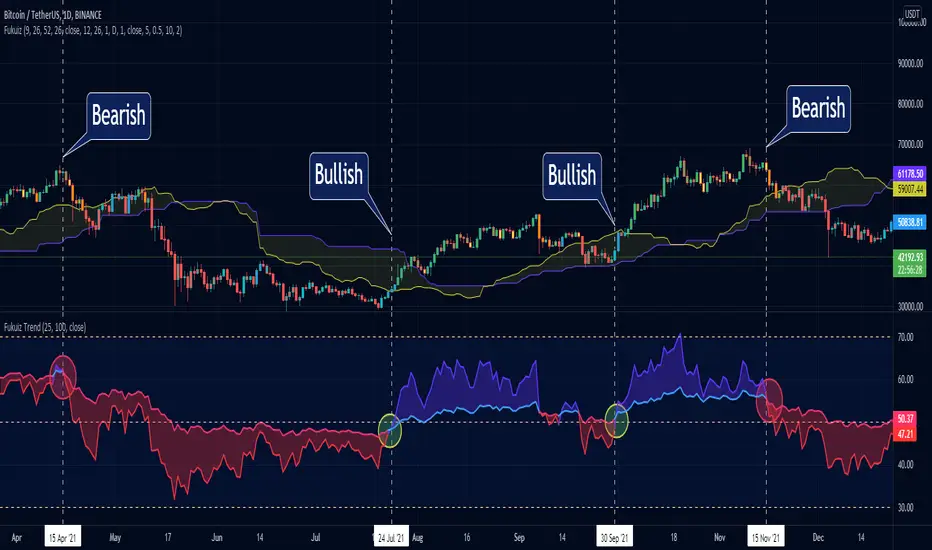
Fukuiz TrendThis indicator base on RSI of 2 different periond.
#A brief introduction to RSI #
The relative strength index (RSI) is a momentum indicator used in technical analysis that measures the magnitude of recent price changes to evaluate overbought or oversold conditions in the price of a stock or other asset. The RSI is displayed as an oscillator (a line graph that moves between two extremes) and can have a reading from 0 to 100. The indicator was originally developed by J. Welles Wilder Jr. and introduced in his seminal 1978 book, “New Concepts in Technical Trading Systems.”
Traditional interpretation and usage of the RSI are that values of 70 or above indicate that a security is becoming overbought or overvalued and may be primed for a trend reversal or corrective pullback in price. An RSI reading of 30 or below indicates an oversold or undervalued condition.
#In this indicator#
I see that you can use 2 RSI with different periond to suggest Bullish trend and Bearish trend.
#Conditions between short and long RSI crossing#
Crossover = Bullish trend (blue zone)
Crossunder = Bearish trend (red zone)
RSI Trend Indicator [paRSI]The Relative Strength Index ( RSI ) is a measurement used by traders to assess the price momentum. It is scaled from 0 to 100. when RSI reads below 30, it is usually interpreted as oversold and when RSI is above 70 it is usually interpreted as overbought. However, it is usually not profitable to trade based on overbought and oversold signal.
RSI Trend Indicator or as I like to call it "paRSI" ("Parsa (my name) + RSI") shows that when RSI is above a specific number (default value = 60) it indicates bullish trend and when RSI is below a specific number (default value = 40 ) it indicates bearish trend. Lastly when RSI is below the 2 specified numbers it indicates a neutral trend.
I don't recommend trading based on this single indicator. If you're a trend trader this might be useful tool in addition to your own strategy
Usage:
If the created pattern has worked previously on the chart, you could enter on the first stages of the green or red section (depending on the market's trend).
It is not recommended to trade in any direction when there is no color
*THIS IS A TREND FOLLOWING STRATEGY AND DOES NOT WORK ON ALL MARKETS*

L1 Composite RSI-William%R IndicatorLevel: 1
Background
The Relative Strength Index (RSI) developed by J. Welles Wilder is a pulse oscillator that measures the speed and change in price movements. The RSI hovers between zero and 100. Traditionally, the RSI is considered overbought when it is above 70 and oversold when it is below 30. Signals can be generated by looking for divergences and error fluctuations. RSI can also be used to identify the general trend.
Williams% R, also known as the Williams Percent Range, is a type of momentum indicator that moves between 0 and -100 and measures overbought and oversold levels. The Williams% R can be used to find entry and exit points in the market. The indicator is very similar to the stochastic oscillator and is used in the same way.
Function
L1 Composite RSI-William%R Indicator combines both RSI and William%R indicator to indicate long and short entries.
Key Signal
rsi1 --> rsi in white
wr1 --> William%R in yellow
bull --> long entry in lime
Pros and Cons
Pros:
1. resonance of RSI and William%R will provide better long and short entry signal
2. use 'bull' to indicate a long entry zone
Cons:
1. It is sensitive to fluctuations
2. More independent long and short entries should be considered
Remarks
Composite RSI+William%R
Readme
In real life, I am a prolific inventor. I have successfully applied for more than 60 international and regional patents in the past 12 years. But in the past two years or so, I have tried to transfer my creativity to the development of trading strategies. Tradingview is the ideal platform for me. I am selecting and contributing some of the hundreds of scripts to publish in Tradingview community. Welcome everyone to interact with me to discuss these interesting pine scripts.
The scripts posted are categorized into 5 levels according to my efforts or manhours put into these works.
Level 1 : interesting script snippets or distinctive improvement from classic indicators or strategy. Level 1 scripts can usually appear in more complex indicators as a function module or element.
Level 2 : composite indicator/strategy. By selecting or combining several independent or dependent functions or sub indicators in proper way, the composite script exhibits a resonance phenomenon which can filter out noise or fake trading signal to enhance trading confidence level.
Level 3 : comprehensive indicator/strategy. They are simple trading systems based on my strategies. They are commonly containing several or all of entry signal, close signal, stop loss, take profit, re-entry, risk management, and position sizing techniques. Even some interesting fundamental and mass psychological aspects are incorporated.
Level 4 : script snippets or functions that do not disclose source code. Interesting element that can reveal market laws and work as raw material for indicators and strategies. If you find Level 1~2 scripts are helpful, Level 4 is a private version that took me far more efforts to develop.
Level 5 : indicator/strategy that do not disclose source code. private version of Level 3 script with my accumulated script processing skills or a large number of custom functions. I had a private function library built in past two years. Level 5 scripts use many of them to achieve private trading strategy.

SCOTTGO - RSI Divergence IndicatorRSI Divergence Indicator
This indicator combines the Relative Strength Index (RSI) with an automatic divergence detection system.
It is designed to help traders spot potential trend changes by:
Color-Coded RSI: The main RSI line dynamically changes color (e.g., green/red) above and below a user-defined threshold (default 50) to highlight strong or weak momentum instantly.
Divergence Signals: It automatically identifies and plots four types of RSI divergences (Regular Bullish, Hidden Bullish, Regular Bearish, and Hidden Bearish) between the price and the oscillator.
Custom Alerts: Includes alerts for all divergence types so you can be notified when a new signal is found.
This tool helps visualize momentum shifts and potential reversals in the market.

RSI Percentage - Current Candle Only - BHAFANTA FX
**Title:** RSI Percentage - Current Candle Only - BHAFANTA FX
**Description:**
This indicator displays the **Relative Strength Index (RSI)** as a percentage for the **current candle only**, giving traders an immediate view of market momentum. Perfect for short-term analysis and quick decision-making, it avoids clutter by showing only the most relevant RSI value.
**Key Features:**
* Shows **RSI percentage of the current candle** only
* Display is **clean and readable**, positioned above the current candle
* Adjustable RSI length and source for flexibility
* Designed for traders who want **fast, actionable insight** without visual clutter
**Use Case:**
* Ideal for **scalpers and intraday traders** who want to gauge overbought or oversold conditions quickly.
* Can be combined with other indicators like EMA, MACD, or trend filters for more robust strategies.
**Developer:** BHAFANTA FX

RSI مع 5 متوسطات و5 مستوياتRSI with 5 Moving Averages and 5 Levels
This indicator combines the Relative Strength Index (RSI) with five customizable moving averages and five horizontal levels to help identify momentum, overbought/oversold zones, and trend strength.
• RSI: Measures the speed and change of price movements.
• Levels (10, 20, 50, 80, 90):
• 10 & 20 → Oversold zones (potential buy areas)
• 80 & 90 → Overbought zones (potential sell areas)
• 50 → Neutral midpoint (trend balance line)
• Moving Averages (5, 8, 13, 21, 200):
Smooth the RSI line to reveal short- and long-term momentum trends.
You can choose the type (SMA, EMA, WMA), color, and line thickness.
Optional alert signals can be triggered when the RSI crosses specific levels (e.g., above 80 or below 20).

Fibo RSIThis is a customized Relative Strength Index (RSI) indicator designed to replicate TradingView’s default RSI while adding additional reference levels for deeper market analysis.
🔹 Features:
RSI length set to 8 by default (user adjustable).
Calculates RSI using the standard ta.rsi() function.
Plots the RSI line in a clean, separate panel.
Adds 7 key levels for analysis: 0, 20, 30, 50, 70, 80, 100.
Levels are drawn as thin, solid straight lines for a cleaner look (instead of default dashed).
🔹 Use cases:
Identify momentum shifts with enhanced precision.
Use intermediate levels (20, 30, 50, 70, 80) as potential support/resistance zones.
Ideal for traders who want a Fibonacci-like structure in RSI analysis.

RSI 20/80 Arrows + AlertsRSI 20/80 Arrows + Alerts
This indicator is a modified Relative Strength Index (RSI) tool designed to help traders spot potential overbought and oversold conditions using customizable threshold levels (default 80 for overbought, 20 for oversold).
Features:
Custom RSI Levels – Default to 80/20 instead of the standard 70/30, but fully adjustable by the user.
Visual Signals –
Blue Arrow Up appears below the bar when RSI crosses up from below the oversold level (potential buy zone).
Red Arrow Down appears above the bar when RSI crosses down from above the overbought level (potential sell zone).
Alerts Built In – Receive notifications when either signal occurs, with the option to confirm signals only on bar close for reduced noise.
Guide Levels – Optionally display overbought/oversold reference lines on the chart for quick visual reference.
Overlay Mode – Signals are plotted directly on the price chart, so you don’t need to switch between chart windows.
Use Case:
Ideal for traders who want quick, visual confirmation of potential turning points based on RSI, especially in strategies where more extreme levels (like 20/80) help filter out weaker signals. Works well across all markets and timeframes.

Big Mover Catcher BTC 4h🧠 Big Mover Catcher (BTC 4H Strategy) — Educational Tool
⚠️ Disclaimer: I am not a financial advisor. This script is for educational and testing purposes only. Cryptocurrency trading is highly volatile and involves significant risk. You can lose all of your invested capital.
📌 Overview
The Big Mover Catcher strategy is a work-in-progress trading system designed for Bitcoin (BTC) on the 4-hour chart. It aims to identify strong breakout moves by combining multiple technical indicators and conditions, allowing for high customization and filter-based confirmations.
This script is part of a personal project to learn Pine Script and backtesting on TradingView. It is currently in the testing and research phase.
🎯 Strategy Objective
Catch large, high-momentum breakout moves in the BTC market using:
Bollinger Band breakouts for entry signals
Momentum, volatility, and trend filters for trade confirmation
🧰 Features & Filters
The script provides a flexible set of filters that can be turned ON/OFF and adjusted directly from the settings panel:
✅ Entry Conditions
Price must break above or below Bollinger Bands
All selected filters must align before entry
🧪 Available Filters:
Relative Strength Index (RSI) with EMA/SMA smoothing
Average Directional Index (ADX) with EMA/SMA smoothing
Average True Range (ATR) with EMA/SMA smoothing
MACD Signal above or below zero
EMA 350 trend filter
ATR / ADX / RSI Threshold toggles for added control
🔥 Additional Feature:
Force Take Profit: Optionally closes the trade immediately if a candle closes with more than a defined % movement (default: 5%). This can help lock in quick profits during high volatility moves.
⚙️ Customizable Inputs
You can configure:
Stop loss percentage
All indicator lengths
Smoothing types (EMA/SMA)
Threshold activation toggles
Individual filter ON/OFF switches
This makes the strategy highly adaptable for educational exploration and optimization.
📊 Best Used For
Learning Pine Script and strategy structure
Testing filter combinations for BTC on the 4H timeframe
Understanding how different indicators interact in live markets
⚠️ Note: ❌ Short trades are currently disabled by default, as short-side logic is still under development.
❗ Final Reminder
This script is not financial advice. It is an educational tool. Use it to learn and explore trading logic. Trading cryptocurrencies carries high risk — only invest what you can afford to lose.
