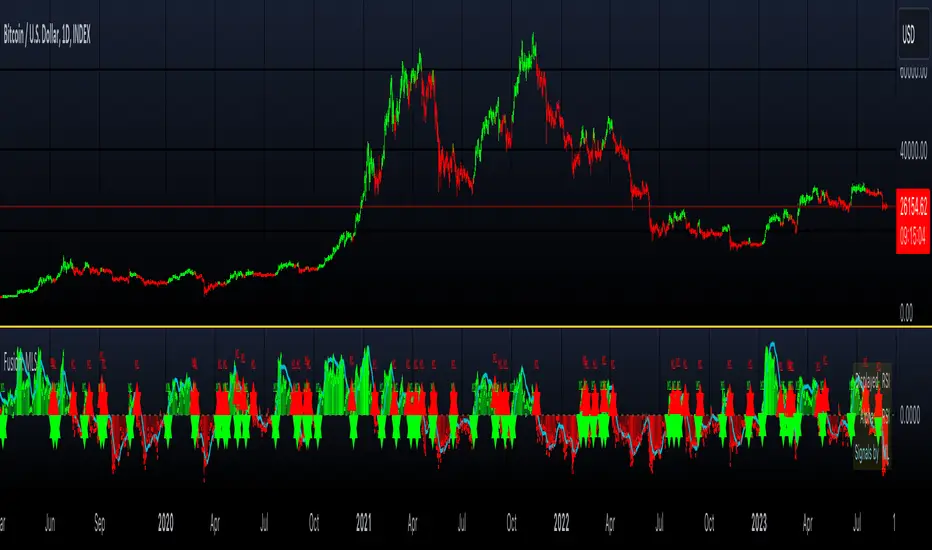
Fusion: Machine Learning SuiteThe Fusion: Machine Learning Suite combines multiple technical analysis dimensions and harnesses the predictive power of machine learning, seamlessly integrating a diverse array of classic and novel indicators to deliver precision, adaptability, and innovation.
Features and Capabilities
Multidimensional Analysis: Fusion: MLS integrates various technical analysis dimensions to offer a more comprehensive perspective.
Machine Learning Integration: Utilizing ML algorithms, Fusion: MLS offers adaptability to market changes.
Custom Indicators: Including dimensions like "Moon Lander", "Cap Line" and "Z-Pack" the indicator expands the scope of traditional technical analysis methods.
Tailored Customization: With customization options, Fusion: MLS allows traders to configure the tool to suit their specific strategies and market focus.
In the following sections, we'll explore the features and settings of Fusion: MLS in detail, providing insights into how it can be utilized.
Major Features and Settings
The indicator consists of several core components and settings, each designed to provide specific functionalities and insights. Here's an in-depth look:
Machine Learning Component
Distance Classifier: A Strategic Approach to Market Analysis
In the world of trading and investment, the ability to classify and predict price movements is paramount. Machine learning offers powerful tools for this purpose.
The Fusion: MLS indicator among others incorporates an Approximate Nearest Neighbors (ANN)* algorithm, a machine learning classification technique, and allows the selection of various distance functions .
This flexibility sets Fusion: MLS apart from existing solutions. The available distance functions include:
Euclidean: Standard distance metric, commonly used as a default.
Chebyshev: Also known as maximum value distance.
Manhattan: Sum of absolute differences.
Minkowski: Generalized metric that includes Euclidean and Manhattan as special cases.
Mahalanobis: Measures distance between points in a correlated space.
Lorentzian: Known for its robustness to outliers and noise.
*For a deeper understanding of the Approximate Nearest Neighbors (ANN) algorithm, traders are encouraged to refer to the relevant articles that can be found in the public domain.
Alternative scoring system
Fusion: MLS also includes a custom scoring alternative based on directional price action.
"Combined: Directional" and "Alpha: Directional" scoring types represent our own directional change algorithm, simple yet effective in displaying trend direction changes early on. They are visualized by color changes when scoring becomes below or above zero.
Changes in scoring quickly reflect shifts in buyer and seller sentiment.
Traders may choose signals by Color Change in the indicator settings to get alerts when scoring color shifts, not waiting until the histogram crosses the zero level.
Application in Trading
Machine learning classification has become an integral part of modern trading, offering innovative ways to analyze and interpret financial data.
Many algorithmic trading systems leverage ML classification to automate trading decisions. By continuously learning from real-time data, these systems can adapt to changing market conditions and execute trades with increased efficiency and accuracy.
ML classification allows for the development of tailored trading strategies as traders can select specific algorithms, dimensions, and filters that align with their trading style, goals, and the particular market they are operating.
We have integrated ML classification with traditional trading tools, such as moving averages and technical indicators. This fusion creates a more robust analysis framework, combining the strengths of classical techniques with the adaptability of machine learning.
Whether used independently or in conjunction with other tools, ML classification represents a significant advancement in trading technology, opening new avenues for exploration, innovation, and success in the financial world.
ML: Weighting System
The Fusion: MLS indicator introduces a unique weighting system that allows traders to customize the influence of various technical indicators in the machine learning process. This feature is not only innovative but also provides a level of control and adaptability that sets it apart from other indicators.
Customizable Weights
The weighting system allows users to assign specific weights to different indicators such as Moon Lander, RSI, MACD, Money Flow, Bollinger Bands, Cap Line, Z-Pack, Squeeze Momentum*, and MA Crossover. These weights can be adjusted manually, providing the ability to emphasize or de-emphasize specific indicators based on the trader's strategy or market conditions.
*Note, we determined via testing that the popular "Squeeze" indicator can actually be well replicated by simply using inputs of 15 & 199 in the bedrock indicator - MACD ; while we employed the standard "Squeeze" formula (developed by J. Carter ) in Fusion: MLS, traders are hereby made aware of our research findings regarding such.
The weighting system's importance lies in its ability to provide a more nuanced and personalized analysis. By adjusting the weights of different indicators a trader focusing on momentum strategies might assign higher weights to the Squeeze Momentum and MA Crossover indicators, while a trader looking for volatility might emphasize RSI and Bollinger Bands.
The ability to customize weights adds a layer of complexity and adaptability that is rare in standard machine-learning indicators.
Custom Indicators: Moon Lander
The "Moon Lander" is not just a catchy name; it's a robust feature inspired by principles from aerospace engineering and offers a unique perspective on trading analysis. Here's a conceptual overview:
Fast EMA and Kalman Matrix
"Moon Lander" incorporates both a Fast Exponential Moving Average (EMA) and a Kalman Matrix in its design. These two elements are combined to create a histogram, providing a specific approach to data analysis.
The Kalman Matrix, or Kalman Filter, is a mathematical concept used for estimating variables that can be measured indirectly and contain noise or uncertainty. It's a standard tool in machine learning and control systems, known for its ability to provide optimal estimates based on observed data.
Kalman Filter: A Navigational Tool
The Kalman filter, an essential part of "Moon Lander," is a mathematical concept known for its applications in navigation and control systems used by NASA in the apollo program :
Guidance in Uncertainty: Just as the Kalman filter helped guide complex aerospace missions through uncertain paths, it assists traders in navigating the often unpredictable financial markets.
Filtering Noise: In trading, the Kalman filter serves to filter out market noise, allowing traders to focus on the underlying trends.
Predictive Capabilities: Its ability to predict future states makes it a valuable tool for forecasting market movements and trend directions.
Custom Indicators: Cap Line and Z-Pack
Fusion: MLS integrates our additional proprietary custom indicators that have been published on TradingView earlier:
Cap Line: Delve into the specific functionalities and applications of our proprietary "Cap Line" indicator in the published description on TradingView.
Z-Pack: Explore the analytical perspectives, focused on the z-score methodology, and custom "Z-Pack" indicator by reviewing the published description on TradingView.
Buy/Sell Signal Generation Algorithms
Fusion: MLS offers various options for generating buy/sell signals, tailored to different trading strategies and perspectives:
Fusion: Allows traders to select any number of dimensions to receive buy/sell signals from, offering customized signal generation.
ML: Utilizes the machine learning ANN distance for signal generation.
Color Change: Generates signals by selected scoring type color change.
Displayed Dimension, Alpha Dimension: Generate signals based on specific selected dimensions.
These algorithms provide flexibility in determining buy/sell signals, catering to different trading styles and market conditions.
Filters
Filters are used to refine and selectively include or exclude signals based on specific criteria. Rather than generating signals, these filters act as gatekeepers, ensuring that only the signals meeting certain conditions are considered. Here's an overview of the filters used:
Dynamic State Predictor (DSP)
The DSP employs the Kalman Matrix to evaluate existing signals by comparing the fast and slow-moving averages, both processed through the Kalman Matrix. Based on the relationship between these averages, the DSP may exclude specific signals, depending on whether they align with upward or downward trends.
Average Directional Index (ADX)
The ADX filter evaluates the strength of existing trends and filters out signals that do not meet the specified ADX threshold and length, focusing on significant market movements.
Feature Engineering: RSI
Applies a filter to the existing signals, clearing out those that do not meet the criteria for RSI overbought or oversold threshold condition.
Feature Engineering: MACD
Assesses existing signals to identify changes in the strength, direction, momentum, and duration of a trend, filtering out those that do not align with MACD trend direction.
The Visual Component
The machine learning component is an internal component. However, the indicator also offers an equally important and useful visual component. It is a graphical representation of the multiple technical analysis dimensions, that can be combined in various ways (where the name "Fusion" comes from), allowing traders to visualize the underlying data and its analysis.
Displayed Dimension: Visualization and Normalization
The Fusion: MLS indicator offers a "Displayed Dimension" feature that visualizes various dimensions as a histogram. These dimensions may include RSI, MAs, BBs, MACD, etc.
RSI Dimension on the image + ML signals
Normalization: Each dimension is normalized. If any dimension has extreme values, a Fisher transformation is applied to bring them within a reasonable range.
Combined Dimension: When selecting the "Combined" option , the normalized values of the selected dimensions are combined using techniques such as standardization, normalization, or winsorization. This flexibility enables tailored visualization and analysis.
Alpha Dimension: Enhancing Analysis
The "Alpha Dimension" feature allows traders to select an additional dimension alongside the Displayed Dimension. This facilitates a combined analysis, enhancing the depth of insights.
Theme Selection
Fusion: MLS offers various themes such as "Sailfish", "Iceberg", "Moon", "Perl", "Candy" and "Monochrome" Traders can select a theme that resonates with their preference, enhancing visual appeal. There is also a "Custom" theme available that allows the user to choose the colors of the theme.
Customizing Fusion: MLS for Various Markets and Strategies
Fusion: MLS is designed with customization in mind. Traders can tailor the indicator to suit various markets and trading strategies. Selecting specific dimensions allows it to align with individual trading goals.
Selecting Dimensions: Choose the dimensions that resonate with your trading approach, whether focusing on trend-following, momentum, or other strategies.
Adjusting Parameters: Fine-tune the parameters of each dimension, including custom ones like "Moon Lander," to suit specific market conditions.
Theme Customization: Select a theme that aligns with your visual preferences, enhancing your chart's readability and appeal.
Utilizing Research: Leverage the underlying algorithms and research, such as machine learning classification by ANN and the Kalman filter, to deepen your understanding and application of Fusion: MLS.
Alerts
The indicator includes an alerting system that notifies traders when new buy or sell signals are detected.
Disclaimer
The information provided herein is intended for informational purposes only and should not be construed as investment advice, endorsement, nor a recommendation to buy or sell any financial instruments. Fusion: MLS is a technical analysis tool, and like all tools, it should be used with caution and in conjunction with other forms of analysis.
Traders and investors are encouraged to consult with a licensed financial professional and conduct their own research before making any trading or investment decisions. Past performance of the Fusion: MLS indicator or any trading strategy does not guarantee future results, and all trading involves risk. Users of Fusion: MLS should understand the underlying algorithms and assumptions and consider their individual risk tolerance and investment goals when using this tool.
스크립트에서 "RSI MACD"에 대해 찾기
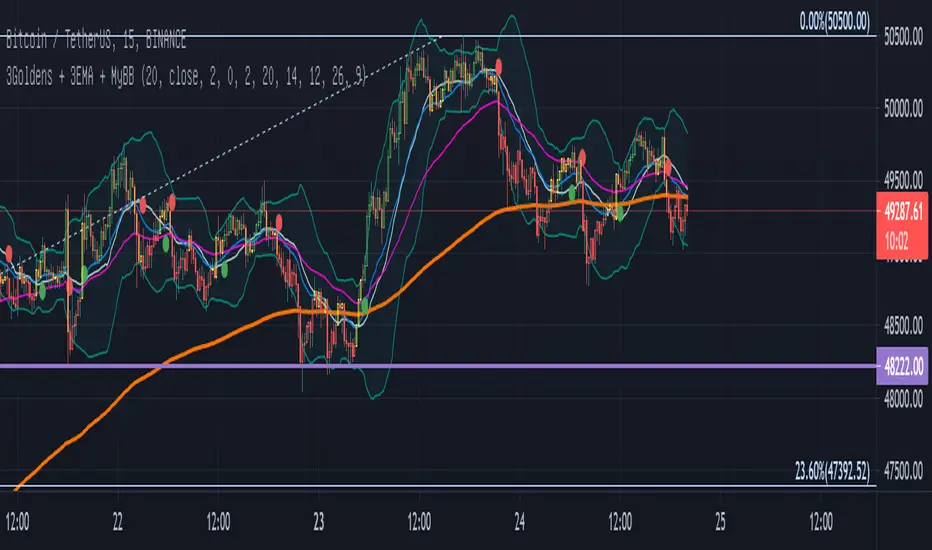
Three Golden By Moonalert =========================
English
=========================
Three Golden By Moonalert
(Green Bar) BUY = All three conditions are agree uptrend.
1 candlestick is on the middle line of Bollinger Bands
2 RSI is more than 50
3 MACD cross up Zero Line
(Red Bar) SELL = All three conditions are agree downtrend
1 candlestick is under the middle line of Bollinger Bands
2 RSI is less than 50
3 MACD cross down Zero Line
(Yello Bar) Wait and see = some candition are agree uptrend or downtrend
Basic logic is
Green = Buy
Red = Sell
Yello = wait and see
Working Good for TF Daily.
=========================
THAI
=========================
เขียว = ซื้อ ( Bollinger bands , Rsi , Macd บอกขึ้นทั้งหมด )
เเดง = ขาย ( Bollinger bands , Rsi , Macd บอกลงทั้งหมด )
เหลือง = นั่งนิ่งๆ ( Bollinger bands , Rsi , Macd บอกขั้นหรือลงบางตัว )
สามารถปรับMACD ระหว่าง
Cross Signal กับ Cross Zeroได้ เเนะนำอย่างหลัง
สามารถปรับ EMA 20 50 200 เปิดปิดได้ที่ตั้งค่า
MACRS {Lite}This is the open-source stripped down version of the full-featured RSI-MACD indicator (MACRS), with the ADO and the option to filter out weekend price action removed.
The main oscillator is the RSI modulated by the MACD (default). The RSI mode can be disabled to revert to a normal MACD oscillator for the main oscillator.
When the main oscillator (thicker line) is > 0, it is green; and if it is < 0, it is red.
The MACD can be re-scaled and whenever its value > 100, a background fill between the oscillator and the zeroline appear to indicates overbought condition; and < -100 indicates oversold condition. The user can tweak the scaling factor to optimize this for a given chart and timeframe.
A (thick transparent light blue) volume oscillator is also provided. An increase in volume trend provides confirmation of (or solidifies) the movements in the main oscillator over that period. A falling volume oscillator trend raises doubts on the main oscillator trend, and hints of the possibility of a counter-trend (also look at the secondary ADO oscillator for clues).
The novel aspects and principles of this indicator and this source code are the property of © cybernetwork.
This indicator and script is free for the TV community to use.

Swing Trading Indicator: RSI + EMA + MACD + BB Signals**Swing Trading Indicator: Multi-Indicator Confluence Signals**
This indicator identifies high-probability swing trading setups using RSI pullbacks, EMA trend filter, MACD momentum confirmation, and Bollinger Bands for volatility-based entries. Perfect for daily/4H charts on stocks like TSLA or SPY.
**Key Features:**
- **Long Signal (Green ↑ Arrow)**: Uptrend (above 200 EMA) + RSI crosses above oversold (default 30) + MACD bullish crossover + Price at/near BB lower band + Optional squeeze filter.
- **Short Signal (Red ↓ Arrow)**: Mirror for downtrends.
- **Real-Time Dashboard**: Top-right table shows condition status (✓/✗) and "LONG/SHORT READY" alerts.
- **Customizable**: Adjust RSI levels, BB multiplier, enable/disable shorts/squeeze/arrows.
- **Alerts**: Built-in for entry notifications.
**How to Use:**
1. Add to chart (daily timeframe recommended).
2. Watch for arrows + "READY" in dashboard.
3. Manual entry: Risk 1% per trade, target 1:2 reward (e.g., trail stops).
**Backtest Note**: Based on similar setups, ~55-65% win rate in trending markets (test yourself). Not financial advice—trading involves risk. Fork and improve!
#swingtrading #RSI #MACD #BollingerBands #PineScript

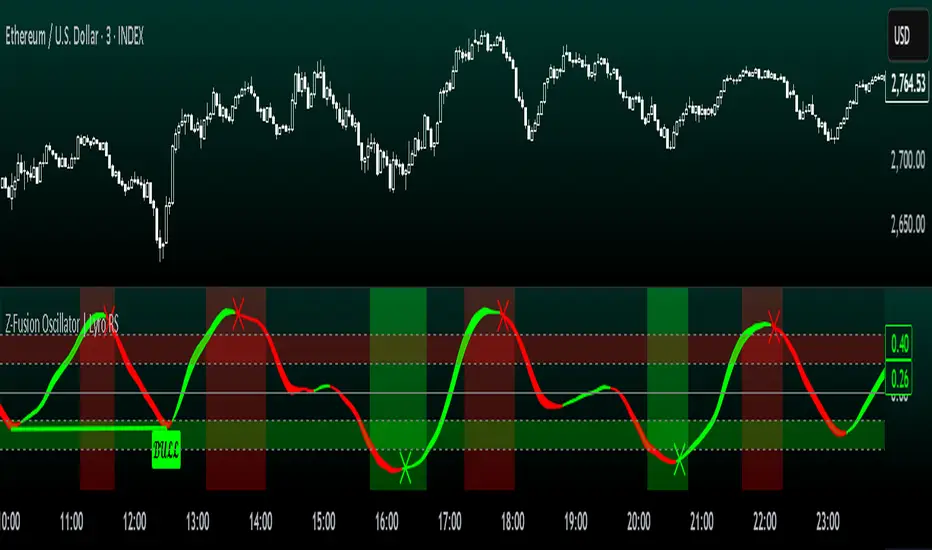
Z-Fusion Oscillator | Lyro RSThe Z-Fusion Oscillator converts five momentum indicators into Z-scores and blends them into one normalized signal that adapts across markets.
By combining normalization, smoothing, and divergence detection, users can easily identify when momentum is accelerating, weakening, reversing, or entering extreme zones
🔶 USAGE
The Z-Fusion Oscillator is designed to give traders a unified reading of market momentum—removing the noise of comparing tools that normally run on different scales.
By transforming RSI, MACD histogram, Stochastic, Momentum, and Rate of Change into Z-scores, this tool standardizes all inputs, making trend strength and shifts easier to interpret.
A dual-line system (fast Z-fusion line + slower baseline) highlights turning points, while overbought/oversold bands and “X-marks” help traders spot exhaustion and potential reversals.
🔹 Unified Momentum Structure
The indicator’s core strength comes from combining five Z-scored signals into one average.
Which makes momentum behavior more consistent across assets, reduces false extremes, and highlights true shifts in trend conviction.
🔹 Divergence Detection
The tool includes fully integrated divergence detection:
Regular Bullish Divergence: Price makes a lower low while Z-Fusion forms a higher low.
Regular Bearish Divergence: Price makes a higher high while Z-Fusion forms a lower high
Bullish and bearish divergences are marked directly on the oscillator with labels and colored pivot connections, making hidden momentum shifts obvious.
🔹 Visual Extremes
Two sets of upper and lower Z-score thresholds help identify:
Extreme overbought surges
Extreme oversold drops
Reversal zones
Potential exhaustion conditions
Background coloring reinforces when the oscillator moves beyond major levels, helping traders quickly assess momentum pressure.
🔹 Detecting Momentum Anomalies
Z-scores allow the oscillator to highlight when market momentum behaves abnormally relative to its own recent history.
For example:
The oscillator reaching +1 or –1 after an extended trend may indicate a climax.
A sharp Z-score reversal within an extreme zone can signal a trend exhaustion or a corrective move.
Divergences often appear earlier due to normalization smoothing out indicator noise.
This makes the Z-Fusion Oscillator particularly useful for spotting subtle shifts in trend direction that traditional indicators may miss.
🔶 DETAILS
🔹 Composite Z-Score Framework
Each momentum tool is smoothed, normalized, and transformed:
RSI → EMA-smoothed, Z-scored
MACD histogram → Z-scored
Stochastic → EMA + SMA smoothing, then Z-scored
Momentum → EMA-smoothed, Z-scored
Rate of Change → EMA-smoothed, Z-scored
These are averaged into one composite Z-score to provide a consistent reading across assets and market conditions.
🔹 Fusion Trend Lines
Two lines serve as the core signal:
Fast Line (savg) – reacts quicker to trend changes
Slow Line (savg2) – acts as a baseline filter
Crossovers between these lines highlight momentum shifts, while their color reflects trend bias.
🔹 Overbought/Oversold Zones
Two upper and two lower Z-score thresholds define “zones”:
Upper zones highlight overheated momentum or potential bearish reversals
Lower zones highlight depressed momentum or potential bullish reversals
Filled regions and background colors help visually confirm extreme conditions.
🔹 Pivot-Based Divergence Engine
The script includes filtered pivot detection with customizable look-backs and range limits to ensure divergences are meaningful, not noise-driven.
🔶 SETTINGS
🔹 Indicator Settings
Source — Price series used for all calculations.
Z-Score Length — Lookback period for Z-score normalization.
Z-Score MA Length — Smoothing length for the fusion signal lines.
Overbought/Oversold Levels — Four customizable threshold lines.
Color Palette — Choose from preset themes or define custom colors.
🔹 RSI
Length — RSI calculation period.
EMA Smoothing Length — Smooths RSI before Z-score conversion.
🔹 MACD
Fast Length — Fast EMA length.
Slow Length — Slow EMA length.
Signal Line Length — MACD signal smoothing.
🔹 Stochastic
%K Length — Main stochastic length.
EMA Smoothing — Smooths %K for stability.
%D Length — Smoothing for the signal line.
🔹 Momentum
Length — Momentum lookback.
EMA Smoothing — Smooths momentum before Z-scoring.
🔹 Rate of Change
Length — ROC lookback.
EMA Smoothing — Smooths ROC values.
🔹 Divergence
Enable/Disable Divergence Detection — Toggle divergence engine.
Pivot Left/Right Lookback — Defines pivot detection sensitivity.
Detection Range Limits — Controls allowable range for divergence.
Bull/Bear Colors & Styling — Customize divergence visualization.
🔶 SUMMARY
The Z-Fusion Oscillator combines multiple momentum signatures into a single normalized signal, enabling traders to:
Identify reversals early
Detect momentum exhaustion
Spot bullish and bearish divergences
Track overbought/oversold conditions
Visualize trend strength with clarity
Whether you're a swing trader, intraday analyst, or trend-reversal hunter, the Z-Fusion Oscillator provides a powerful and adaptive way to read momentum.
Multi-Confluence Signal System📊 OPTIMIZED MULTI-CONFLUENCE SIGNAL SYSTEM
A professional-grade trading indicator that combines multiple technical analysis methods to generate high-probability buy and sell signals. Designed for daily timeframe Bitcoin/crypto trading with optimized parameters based on real market backtesting.
🎯 KEY FEATURES:
- Multi-Confluence Scoring (8 components) - Each signal shows strength rating
- Smart Top & Bottom Detection - Catches reversals using price action patterns
- Ichimoku Cloud Integration - Dynamic support/resistance visualization
- Dual EMA System (20/50) - Clear trend identification
- RSI + MACD + Volume Confirmation - Multi-indicator validation
- Signal Alternation - Only shows directional changes (no repeated signals)
- Minimal Bar Spacing - Prevents signal clustering and overtrading
✅ OPTIMIZED FOR:
- Catching parabolic tops with rejection wicks
- Identifying capitulation bottoms in downtrends
- Avoiding false signals during consolidation
- 4-8 quality signals per 4-month period on daily charts
- Works in both trending and volatile markets
🔧 TECHNICAL COMPONENTS:
- EMA 20/50 trend system
- RSI (14) with adjusted overbought/oversold levels (68/32)
- MACD for momentum confirmation
- Ichimoku Cloud for trend context
- Volume analysis (1.3x threshold)
- Candlestick pattern recognition (engulfing, hammers, shooting stars)
- Capitulation detection for extreme moves
- Price extension filters (±5-10% from EMAs)
⚠️ BEST PRACTICES:
- Optimized for Daily timeframe
- Combine with your own risk management
- Higher scores = higher probability trades
- Wait for signal confirmation on candle close
- Use in conjunction with key support/resistance levels
💡 SIGNAL LOGIC:
BUY signals trigger on: Capitulation candles, extreme oversold + reversal patterns, MACD turnarounds in downtrends, or high confluence scores with bullish patterns
SELL signals trigger on: Rejection wicks at tops, bearish engulfings with overbought RSI, parabolic extensions, MACD reversals, or high confluence scores with bearish patterns
📈 Created through iterative backtesting and optimization on Bitcoin price action from 2024-2025.
⭐ Free to use • Leave feedback • Happy trading!

Trend & Strength Detector TSDTrend Strength Detector (TSD)
*Objective Trend Quality Measurement for Educational Market Analysis*
Note: This mathematical framework is a proprietary quantitative model developed by Ario Pinelab, inspired by classical EMA, ADX, RSI and MACD principles, yet not documented in any public technical or academic publication.
## 🎯 Purpose & Design Philosophy
The ** Trend Strength Detector- TSD ** is an educational research tool that provides **quantitative measurement of trend quality** through two independent scoring systems (0-100 scale). It answers the analytical question: *"How strong and aligned is the current market trend environment?"*
This indicator is designed with a **modular, complementary approach** to work alongside various analysis methodologies, particularly pattern-based recognition systems.
## 🔗 Complementary Research Framework
### Designed to Work With Pattern Detection Systems
This indicator provides **environmental context measurement** that complements qualitative pattern recognition tools. It works particularly well alongside systems like:
- **RMBS Smart Detector - Multi-Factor Momentum System**
- Traditional chart pattern analyzers
- Any momentum-based pattern identification tools
🔍 **To find RMBS Smart Detector:**
- Search in TradingView Indicators Library: `" RMBS Smart Detector - Multi-Factor Momentum System"`
- Look for: *Multi-Factor Momentum System*
- By author: ` `
### Why This Complementary Approach?
**Trend Quality Measurement** (TSD - this tool) provides:
- ✅ Structural trend alignment (0-100 score)
- ✅ Momentum intensity levels (0-100 score)
- ✅ Environment classification (Strong/Moderate/Weak)
- 📌 **Answers:** *"HOW STRONG is the underlying trend environment?"*
### Educational Research Value
When used together in a research context, these tools enable systematic study of questions like:
- How do reversal patterns behave when Strength Score is above 70 vs below 30?
- Do continuation patterns in weakening environments (declining scores) show different characteristics?
- What is the correlation between high Alignment Scores and pattern "success rates"?
- Can environment classification help identify genuine trend initiation vs false starts?
⚠️ **Important Note:** Both tools are **independent and work standalone**. TSD provides value whether used alone or with other analysis methods. The relationship with RMBS (or any pattern tool) is **complementary for research purposes**, not dependent.
---
###Mathematical Foundation
##TSA Formula: scoring method developed by Ario
-Trend Model (0 – 100)
TAS = EMA Alignment (0–40) + Price Position (0–30) + Trend Consistency (0–30)
EMA Alignment checks EMA_fast vs EMA_slow vs EMA_trend structure.
Price Position evaluates if Close is above/below all EMAs.
Consistency = 3 × max(bullish,bearish bars within 10 candles).
-Strength Model (0 – 100)
Strength = ADX (0–50) + EMA Slope (0–25) + RSI (0–15) + MACD (0–10)
ADX measures trend energy; Slope shows EMA momentum %;
RSI assesses zone positioning; MACD confirms directional agreement.
Note: This formula represents a proprietary quantitative model by Ario_Pinelab, inspired by classical technical concepts but not published in any external reference.________________________________________
📊 Environment Classification
Based on Total Strength Score:
🟢 Strong Environment: Score ≥ 60
→ Well-defined momentum, clear directional bias
🟡 Moderate Environment: 40 ≤ Score < 60
→ Mixed signals, transitional conditions
🔴 Weak Environment: Score < 40
→ Ranging, choppy, low conviction movement
Color Coding:
• Green background: Strong (≥60)
• Yellow background: Moderate (40-59)
• Red background: Weak (<40)
________________________________________
📈 Visual Components
Main Chart Display
Score Labels (Top-Right Corner):
┌─────────────────────────────────┐
│ 📊 Alignment: 75 | Strength: 82 │
│ Environment: Strong 🟢 │
└─────────────────────────────────┘
Color-Coded Background:
• Environment strength visually indicated via background color
• Helps quick identification of market regime
• Customizable transparency (default: 90%)
Reference Lines:
• Dotted line at 60: Strong/Moderate threshold
• Dotted line at 40: Moderate/Weak threshold
• Mid-line at 50: Neutral reference
________________________________________
🔧 Customization Settings
Input Parameters
The best setting is the default mode.
🚫 Important Disclaimers & Limitations
What This Indicator IS:
✅ Educational measurement tool for trend quality research
✅ Quantitative assessment of current market environment
✅ Complementary analysis tool for pattern-based systems
✅ Historical data analyzer for systematic study
✅ Multi-factor scoring system based on technical calculations
What This Indicator IS NOT:
❌ NOT a trading system or signal generator
❌ NOT financial advice or trade recommendations
❌ NOT predictive of future price movements
❌ NOT a guarantee of pattern success/failure
❌ NOT a substitute for comprehensive risk management
________________________________________
Known Limitations
1. Lagging Nature:
⚠️ All components (EMA, ADX, RSI, MACD) are calculated
from historical price data
→ Scores reflect CURRENT and RECENT conditions
→ Cannot predict sudden reversals or black swan events
→ Trend measurements lag actual price turning points
2. Whipsaw Risk:
⚠️ In choppy/ranging markets, scores may fluctuate rapidly
→ Moderate zone (40-60) can see frequent transitions
→ Low timeframes more susceptible to noise
→ Consider higher timeframes for stable measurements
3. Component Conflicts:
⚠️ Individual components may disagree
→ Example: Strong ADX but weak RSI alignment
→ Scores average these conflicts (may hide nuance)
→ Check individual components for deeper insight
4. Not Predictive:
⚠️ High scores do NOT guarantee continuation
⚠️ Low scores do NOT guarantee reversal
→ Measurement ≠ Prediction
→ Use for CONTEXT, not SIGNALS
→ Combine with comprehensive analysis
________________________________________
Risk Acknowledgments
Market Risk:
• All trading involves substantial risk of loss
• Past performance (even systematic studies) does not guarantee future results
• No indicator, system, or methodology can eliminate market risk
Measurement Limitations:
• Scores are mathematical calculations, not market predictions
• Environmental classification is descriptive, not prescriptive
• Strong measurements can deteriorate rapidly without warning
Educational Purpose:
• This tool is designed for LEARNING about market structure
• Not designed, tested, or validated as a standalone trading system
• Any trading decisions are user’s sole responsibility
No Warranty:
• Indicator provided “as-is” for educational purposes
• No guarantee of accuracy, reliability, or profitability
• Users must verify calculations and apply critical thinking
Open Source
Full Pine Script code available for educational study and modification. Feedback and improvement suggestions welcome.
“All logic is presented for research and educational visualization.”
---

Order Blocks Zones with Signals█ OVERVIEW
“Order Blocks Zones with Signals” is a technical analysis tool that automatically identifies Order Blocks (OB) and optionally Fair Value Gaps (FVG) on the chart.
The script visualizes these zones as colored rectangles, offering full customization of style, transparency, and signal display.
It also generates entry and exit signals (Break & Exit) that can serve as confirmations in strategies based on price action and market structure.
Thanks to flexible candle size filters and rich visual options, the indicator maintains chart clarity and readability.
█ CONCEPTS
Order Blocks (OB) are key zones on the chart where significant price movements previously occurred — areas where large market participants (institutions, so-called smart money) initiated or closed positions.
An OB is the last candle that followed the prior trend before the market reversed (e.g., for a Bullish OB: the last bearish candle before a pivot low and a strong upward impulse).
The script detects these levels using local price pivots, analyzing candle direction to filter out less significant movements.
FVG (Fair Value Gaps) represent areas of imbalance between buyers and sellers — price gaps formed by a sharp impulse where full trading did not occur due to one-sided order dominance (e.g., excess buy or sell orders).
Why combine OB and FVG in one indicator?
Combining OB and FVG analysis is essential because these phenomena often occur sequentially in the institutional market cycle:
1. Order Block — institutions enter the market in the OB zone, absorbing orders and building positions.
2. Strong impulse — after smart money entry, a rapid price move creates an FVG (imbalance gap).
3. Retest — price naturally returns to these zones (OB or FVG), drawn by unfilled orders and the search for equilibrium.
Such areas strongly attract price, as they represent not only historical institutional levels but also open “holes” in the order book. Retests of OB and FVG are ideal entry opportunities with high reaction probability (rebound or breakout). The indicator combines these two interconnected elements, enabling comprehensive market structure analysis in a single tool.
Order Blocks are labeled as:
Bullish OB – demand zones, often accumulation areas before an upmove.
Bearish OB – supply zones, signaling potential impulse end or correction start.
█ FEATURES
Order Block Detection (OB Detection):
- Automatic identification of demand and supply zones based on pivots.
- OB is the last candle aligned with the prior trend, just before the market reversal — precisely identified through candle sequence analysis around the pivot.
- OB zones appear with a delay equal to Pivot Length (default 10 bars).
- Break signals trigger when a candle’s body (close) fully pierces the zone, causing the zone to disappear immediately (e.g., close < low of Bullish OB → Break Down and zone deletion).
- Minimum size filtering via OB Size Multiplier.
- Option to create OB without wicks (Include Wicks in OB): when disabled, OB zones are based solely on candle bodies (open/close), ignoring wicks (high/low).
Fair Value Gap Detection (FVG Detection):
- Optional, with enable/disable capability.
- FVG are detected without delay — immediately upon gap occurrence.
- Size filtering via Candle Size Period and FVG Size Multiplier.
Customizable Styling:
- Separate colors and border styles (Solid / Dashed / Dotted) for each zone type.
- Adjustable transparency and border thickness.
- Unified color for box, border, and signal of the same type.
Breakout and Exit Signals:
- Break Up – triggered when a candle’s close breaks above a Bearish OB, causing the zone to disappear.
- Break Down – triggered when a candle’s close breaks below a Bullish OB, causing the zone to disappear.
- Exit Up / Exit Down – temporary exit from the zone without full breakout (price leaves the zone but doesn’t close beyond it). Signal type selection: Break, Exit, or Both.
- Alerts: built-in alerts for all signal types — triggered automatically on candle close confirming breakout or exit from OB.
█ HOW TO USE
Adding to chart: import the code into Pine Editor and run the script on TradingView.
Settings configuration:
- Pivot Length: controls swing detection sensitivity and OB display delay (default 10).
- Include Wicks in OB: enabled (default) – OB includes wicks; disabled – OB uses bodies only.
- Size Filter: adjust Candle Size Period and OB/FVG Size Multiplier to filter out small zones.
- Colors & Styles: set colors, styles, and transparency for each zone type.
- Signal Type: choose which signals to display (Break, Exit, or Both).
Signal interpretation:
- OB Break Up: price closes above Bearish OB → zone disappears → potential bullish continuation.
- OB Break Down: price closes below Bullish OB → zone disappears → potential bearish continuation.
- Exit Signals: price leaves the zone temporarily without breakout — often signals impending reversal or pullback.
Tips:
- Use OB signals alongside other indicators like RSI, MACD, SMI, or trend filters.
- Order Blocks from higher timeframes (e.g., 4H, 1D) carry greater significance and reaction strength.
- Remember: FVG are detected immediately, OB with delay — a complementary approach!
█ APPLICATIONS
- Smart Money Concepts (SMC): use OB zones as dynamic support and resistance levels. In an uptrend, look for buy opportunities in bullish OBs, which price often retests before further gains. Combining with RSI, MACD, or Fibonacci levels enhances zone significance, confirming institutional demand.
- Breakout Trading: trade based on OB breakout signals. A buy signal after breaking a bearish OB may indicate a strong upward impulse, especially if supported by rising MACD or RSI above 50. Similarly for sell signals after Break Down.
- Reversal Zones: Exit signals may indicate the end of a move or correction. Safest to use in alignment with higher-timeframe trend and confirmed by another indicator (e.g., RSI divergence, Fibonacci levels).
- Confluence Analysis: combine OB and FVG for deeper market structure and equilibrium insight. When an Order Block overlaps or borders an FVG, we get confluence of two institutional phenomena — OB (smart money entry) + FVG (imbalance) — making these areas particularly strong price magnets, increasing retest and reaction probability.
█ NOTES
- FVG can be fully disabled for a cleaner chart view.
- In consolidation periods, signals may appear more frequently — always confirm with additional trend filters.
- Works on all markets and timeframes (crypto, forex, indices, stocks).

DAX Zonen Ergänzungen (Pro Signale + EMAs mit Filter RSI MACD)📊 DAX Zones Enhancements (Pro Signals + EMA with RSI & MACD Filter)
Description:
This indicator enhances DAX trading analysis by combining dynamic support/resistance zones with professional-level signal filters. It automatically detects potential buy and sell zones and confirms them using EMA trends, RSI conditions, and MACD momentum.
Key features:
🔹 Visual display of DAX high- and low-price zones
🔹 EMA-based trend confirmation
🔹 RSI and MACD filters to reduce false signals
🔹 Customizable alerts when price interacts with key zones
🔹 Works on multiple timeframes
Ideal for traders who want a clean, rule-based approach to identifying high-probability entries and exits on the DAX index.

NOVA Breakout Signals v2.2 (TF M30)A clean, rules-based breakout signal tool for 30-minute charts.
It detects Dow swing breakouts and filters them with RSI, MACD and Volume so you only see the higher-quality entries. The script does not place trades and does not calculate SL/TP – it only prints clear LONG/SHORT labels at the entry price.
⸻
How it works
1. Timeframe enforcement – Signals are generated only on M30. On other timeframes the script shows a notice and stays silent.
2. Breakout engine (Dow swings) – The last confirmed swing high/low (pivots) is tracked.
• Breakout Up: bar closes above the last swing high by a small buffer.
• Breakout Down: bar closes below the last swing low by a small buffer.
3. Quality filters (all must be true):
• RSI (default length 30):
• Long: RSI > threshold and rising.
• Short: RSI < threshold and falling.
• MACD (12/26/9):
• Long: histogram > 0 and line > signal.
• Short: histogram < 0 and line < signal.
• Volume: current volume > SMA(volume, 20) × multiplier.
4. Debounce / anti-spam
• Cooldown of 4 hours (8 M30 bars) after any signal.
• Minimum price distance from the previous signal to avoid clustered labels.
Signals appear once the bar closes (barstate.isconfirmed). No swing lines are drawn to keep the chart clean; only entry labels are shown.
⸻
Inputs (key)
• RSI length & thresholds for Long/Short confirmation.
• MACD uses 12/26/9 (fixed).
• Volume multiplier (relative to SMA 20).
• Breakout buffer %, Cooldown hours, Min distance %.
• Show labels (on/off).
⸻
Usage tips
• Start with gold/major FX/indices on M30; use “Once per bar close” if you attach alerts.
• Increase the breakout buffer and volume multiplier in choppy markets.
• Tighten RSI thresholds (e.g., 55/45) if you want fewer but stronger signals.
⸻
Notes & limitations
• Pivots confirm after a few bars by definition; signals themselves are printed only on confirmed bar close and do not repaint once shown.
• This is a signal indicator, not investment advice. Always manage risk.

NOVA Breakout Strategy v2.1 (TF M30)A clean, rules-based breakout signal tool for 30-minute charts.
It detects Dow swing breakouts and filters them with RSI, MACD and Volume so you only see the higher-quality entries. The script does not place trades and does not calculate SL/TP – it only prints clear LONG/SHORT labels at the entry price.
⸻
How it works
1. Timeframe enforcement – Signals are generated only on M30. On other timeframes the script shows a notice and stays silent.
2. Breakout engine (Dow swings) – The last confirmed swing high/low (pivots) is tracked.
• Breakout Up: bar closes above the last swing high by a small buffer.
• Breakout Down: bar closes below the last swing low by a small buffer.
3. Quality filters (all must be true):
• RSI (default length 30):
• Long: RSI > threshold and rising.
• Short: RSI < threshold and falling.
• MACD (12/26/9):
• Long: histogram > 0 and line > signal.
• Short: histogram < 0 and line < signal.
• Volume: current volume > SMA(volume, 20) × multiplier.
4. Debounce / anti-spam
• Cooldown of 4 hours (8 M30 bars) after any signal.
• Minimum price distance from the previous signal to avoid clustered labels.
5. Optional trend filter – Require EMA34 > EMA89 for Longs (and the opposite for Shorts).
Signals appear once the bar closes (barstate.isconfirmed). No swing lines are drawn to keep the chart clean; only entry labels are shown.
⸻
Inputs (key)
• RSI length & thresholds for Long/Short confirmation.
• MACD uses 12/26/9 (fixed).
• Volume multiplier (relative to SMA 20).
• Breakout buffer %, Cooldown hours, Min distance %.
• Enable EMA 34/89 trend filter (on/off).
• Show labels (on/off).
⸻
Usage tips
• Start with gold/major FX/indices on M30; use “Once per bar close” if you attach alerts.
• Increase the breakout buffer and volume multiplier in choppy markets.
• Tighten RSI thresholds (e.g., 55/45) if you want fewer but stronger signals.
⸻
Notes & limitations
• Pivots confirm after a few bars by definition; signals themselves are printed only on confirmed bar close and do not repaint once shown.
• This is a signal indicator, not investment advice. Always manage risk.

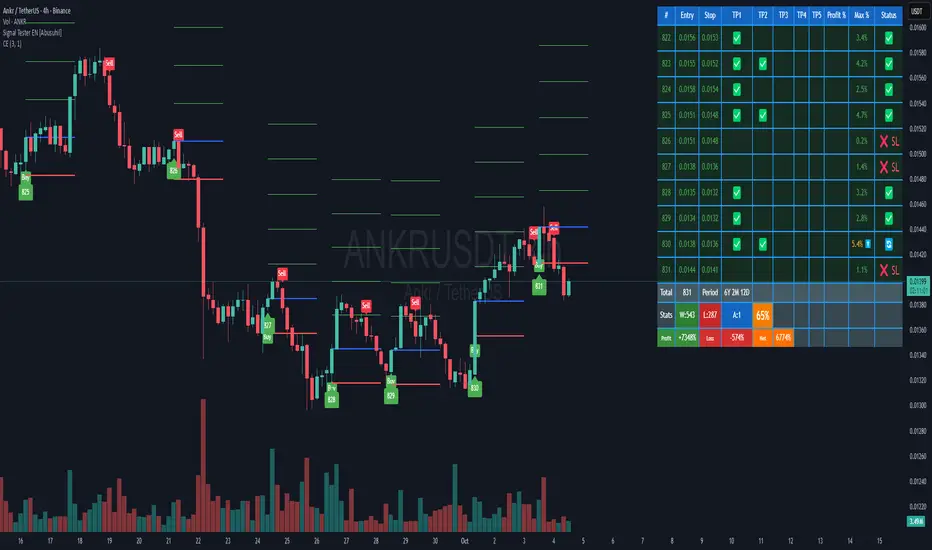
Signal Tester EN [Abusuhil]Signal Tester - Complete Description
Overview
Signal Tester is a comprehensive trading tool designed to backtest and analyze external trading signals with advanced risk management capabilities. The indicator provides seven different calculation methods for stop-loss and take-profit levels, along with detailed performance statistics and real-time tracking of active trades.
Important Disclaimer: This indicator is a tool for analysis and education purposes only. Past performance does not guarantee future results. Trading involves substantial risk of loss and is not suitable for all investors. Always conduct your own research and consider seeking advice from a qualified financial advisor before making trading decisions.
Key Features
7 Calculation Methods for customizable risk management
External Signal Integration via any oscillator or indicator
Real-time Trade Tracking with visual entry/exit points
Comprehensive Statistics Table showing win rate, profit/loss, and active trades
Date Filtering for focused backtesting periods
Custom Alerts for new buy signals
Multi-Target System with up to 5 take-profit levels
How to Use
Step 1: Connect External Signal
The indicator requires an external signal source to generate buy signals.
Add your preferred indicator to the chart (RSI, MACD, Stochastic, custom indicator, etc.)
In Signal Tester settings, locate "External Indicator" input
Click the input and select your indicator's plot line
Buy signals are generated when the external source crosses above zero
Example: If using RSI, connect the RSI line. A buy signal triggers when RSI crosses above the zero reference (if plotted as oscillator).
Step 2: Choose Your Calculation Method
Select one of seven methods under "Calculation Method":
1. Percentage %
The simplest method using fixed percentage values.
Settings:
Stop Loss %: Distance from entry to stop-loss (default: 2%)
Target 1-5 %: Distance from entry to each take-profit level
Example: Entry at $100
Stop Loss (2%): $98
Target 1 (2%): $102
Target 2 (4%): $104
Best For: Beginners, markets with consistent volatility
2. ATR Multiplier
Uses Average True Range for dynamic levels based on market volatility.
Settings:
ATR Period: Calculation period (default: 14)
Stop Multiplier: ATR multiplier for stop-loss (default: 1.5)
Target Multipliers: ATR multipliers for each take-profit
Example: Entry at $100, ATR = $2
Stop Loss (1.5x ATR): $100 - $3 = $97
Target 1 (2x ATR): $100 + $4 = $104
Best For: Volatile markets, adapting to changing conditions
3. Risk:Reward Ratio
Calculates targets based on risk-to-reward ratios.
Settings:
Stop Loss %: Initial risk percentage
Target Ratios: R:R ratio for each target (1:1.5, 1:2, 1:3, etc.)
Example: Entry at $100, Stop at $98 (2% risk = $2)
Target 1 (1:1.5): $100 + ($2 × 1.5) = $103
Target 2 (1:2): $100 + ($2 × 2) = $104
Target 3 (1:3): $100 + ($2 × 3) = $106
Best For: Traders focused on risk management and position sizing
4. Swing High/Low
Places stop-loss at recent swing low with targets as multiples of the risk.
Settings:
Swing Lookback Candles: Number of bars to find swing low (default: 5)
Stop Safety Distance %: Buffer below swing low
Target Multipliers: Risk multiples for each target
Example: Entry at $105, Swing Low at $100
Stop Loss: $100 - 0.1% = $99.90 (risk = $5.10)
Target 1 (1.5x): $105 + ($5.10 × 1.5) = $112.65
Best For: Swing traders, respecting market structure
5. Partial Take Profit
Sells portions of the position at each target level, moving stop to entry after first target.
Settings:
Stop Loss %: Initial stop distance
Target 1-5 %: Price levels for partial exits
Sell % at TP1-4: Percentage of position to close at each level
Example: 100% position, 50% sell at each target
TP1 hit: Sell 50%, remaining 50%, stop moves to entry
TP2 hit: Sell 25% (50% of remaining), remaining 25%
TP3 hit: Sell 12.5%, remaining 12.5%
Best For: Conservative traders, locking in profits gradually
6. Trailing Stop
Similar to Partial Take Profit but trails the stop-loss to each achieved target.
Settings:
Stop Loss %: Initial stop distance
Target 1-5 %: Price levels for trailing stops
Sell % at TP1-4: Percentage to close at each level
Example:
TP1 ($102) hit: Sell 50%, stop trails to $102
TP2 ($104) hit: Sell 25%, stop trails to $104
Price retraces to $104: Exit with locked profits
Best For: Trend followers, maximizing profit in strong moves
7. Smart Exit
Advanced method that moves stop to entry after first target, then exits based on technical conditions.
Settings:
Stop Loss %: Initial stop distance
First Target %: When hit, stop moves to breakeven
Exit Method: Choose from 8 exit strategies
Exit Methods:
Close < EMA 21: Exits when price closes below 21-period EMA
Close < MA 20: Exits when price closes below 20-period Moving Average
Supertrend Flip: Exits when Supertrend indicator flips bearish
ATR Trailing Stop: Dynamic trailing stop based on ATR
MACD Crossover: Exits on MACD bearish crossover
RSI < 50: Exits when RSI drops below specified level
Parabolic SAR Flip: Exits when SAR flips above price
Bollinger Bands: Exits when price closes below middle or lower band
Best For: Advanced traders, letting winners run with protection
Date Filtering
Control which trades are included in backtesting.
Filter Types:
Specific Date: Only trades after selected date
Number of Weeks: Last X weeks (default: 12)
Number of Months: Last X months (default: 3)
How to Enable:
Check "Enable Date Filter"
Select filter type
Set the date or number of weeks/months
Use Case: Test strategy performance in recent market conditions or specific periods
Understanding the Statistics Table
The table displays the last 10 trades plus comprehensive statistics:
Trade Columns:
#: Trade number
Entry: Entry price
Stop: Current stop-loss level
TP1-TP5: Checkmarks (✅) when targets are hit
Profit %: Realized profit for the trade
Max %: Maximum unrealized profit reached (⬆️ indicates active trade)
Status:
🔄 Active trade
✅ Closed winner
❌ SL - Stopped out
Summary Row:
Total: Number of trades executed
Period: Duration of trading period (Years, Months, Days)
Statistics Row:
W: Number of winning trades
L: Number of losing trades
A: Number of active (open) trades
Win Rate %: (Wins / Total Trades) × 100
Performance Row:
Profit: Total profit from all winning trades
Loss: Total loss from all losing trades
Net: Net profit/loss (Profit - Loss)
Visual Elements
When a buy signal triggers, the indicator draws:
Blue Line: Entry price
Red Line: Stop-loss level
Green Lines: Take-profit levels (up to 5)
Green Label: Trade number below the entry bar
Green Triangle: Buy signal marker
Alerts
The indicator includes customizable alerts for new buy signals.
Setting Up Alerts:
Click the "⏰" icon in TradingView
Select "Signal Tester "
Choose condition: "Buy"
Configure notification preferences (popup, email, webhook)
Click "Create"
Alert Message Format:
🚀 New Buy Signal!
Price:
Trade #:
Best Practices
Backtest First: Test each calculation method on historical data before live trading
Match Timeframe: Use the indicator on the timeframe you plan to trade
Combine with Analysis: Use alongside support/resistance, trend analysis, and other tools
Risk Management: Never risk more than 1-2% of capital per trade
Review Statistics: Regularly check win rate and profit/loss metrics
Adjust Settings: Optimize parameters based on the asset's volatility and your risk tolerance
Limitations
Requires external signal source (does not generate signals independently)
Backtesting assumes perfect entry/exit execution (real trading includes slippage)
Past performance does not guarantee future results
Should be used as one component of a complete trading strategy
Version Information
Version: 1.0
Pine Script Version: v5
Type: Overlay Indicator
Author: Abusuhil
Support and Updates
This indicator is provided as-is for educational and analytical purposes. Users are responsible for their own trading decisions and should thoroughly test any strategy before implementing it with real capital.
Risk Warning: Trading financial instruments carries a high level of risk and may not be suitable for all investors. The high degree of leverage can work against you as well as for you. Before deciding to trade, you should carefully consider your investment objectives, level of experience, and risk appetite. Only trade with money you can afford to lose.
Beta SignalsThe Beta Buy/Sell Signal Indicator provides visual cues for potential trade setups by combining multiple technical conditions, including RSI, MACD, SMA, volume filters, and price action. It highlights buy and sell signals when these conditions align, helping traders observe potential short-term opportunities across various market conditions.
Key Features:
Buy/Sell Signals – Signals appear as markers on your chart indicating potential entry points.
RSI Bounce Alerts – Identifies RSI crossing key thresholds (35 for bullish, 65 for bearish) in combination with other technical conditions.
SMA & MACD Filters – Confirms trade setups using trend (SMA) and momentum (MACD) indicators.
Volume & Price Action Filters – Optional volume filter and price movement checks ensure signals are only shown under specific market conditions.
Higher Timeframe RSI Filter – Optional filter for confirming trend strength from a higher timeframe.
Configurable Inputs – Users can adjust RSI length, MACD parameters, SMA period, and other filters to match their preferred trading style.
Usage:
Suitable for short-term trading or as a confirmation tool alongside other strategies.
Signals are designed for observation and strategy testing; they do not guarantee results.
Alerts can be set up for buy and sell bounce signals to assist in monitoring potential setups in real-time.
Precision AI Trading ProPrecision AI Trading Pro — TradingView Indicator
EN / 中文雙語說明(No promo, high-level logic, originality stated)
What it does |用途
EN
Trend-aligned entries on 5m/15m (and higher) using multi-layer confirmations. It emphasizes confirmation over prediction, then derives adaptive TP/SL from volatility and recent structure.
中文
在 5/15 分鐘(與更高時框)進行趨勢對齊進場,重確認、不猜轉折;並依波動與近期結構自適應計算 TP/SL。
Why it’s original & useful |原創性與價值
EN
This script implements a custom 11-filter confluence engine and a volatility-aware exit model. Filters are designed to complement each other: HTF context narrows bias, LTF structure checks timing, momentum/volume validate strength, and regime gates avoid chop. Exits use ATR- and swing-based distances with caps to keep results realistic.
中文
本腳本自研 11 重共振濾網 與 隨波動調整的出場模型:HTF 提供方向偏好,LTF 結構掌握時點;動能/量能驗證有效性;型態/趨勢強度門檻過濾震盪;出場以 ATR 與擺動區間計算距離並設上限,使績效更貼近實際。
How it works (high-level) |高層級運作
EN
HTF alignment: EMA(3/8/21) + RSI/MACD on a higher timeframe (confirmed bars only) sets directional bias.
LTF structure: Requires local EMA(3/8/21) alignment, Structure Breakout (recent swing ± ATR buffer), and optional Pullback to EMA8/21.
Regime checks: ADX gate and EMA band width filter out low-trend conditions; Volume confirms pressure.
Risk layer: Peak Guard (overheat/new-high/surge) blocks extended entries.
Trendline/EMA200: Optionally require EMA200 or TL breakout with ATR tolerance.
Exits: SL = max(ATR×k, swing buffer, % floor); TP = min(R×SL, ATR/% caps).
No look-ahead: HTF uses confirmed bars; pivots only annotate context, not used as entry triggers.
中文
HTF 共振:高階時框 EMA(3/8/21)+RSI/MACD(僅採用確認棒)決定方向偏好。
LTF 結構:要求本階 EMA(3/8/21) 一致、結構突破(近期高低點 ± ATR 緩衝),並可選 回踩 EMA8/21。
市況門檻:ADX 閘 與 EMA 帶寬 排除低趨勢環境;量能 驗證推進力。
風險層:Peak Guard(過熱/創高/急漲)避免追價。
趨勢線/EMA200:可選擇要求 EMA200 或趨勢線突破(含 ATR 容忍帶)。
出場:SL = max(ATR×k, 擺動緩衝, % 下限);TP = min(R×SL, ATR/% 上限)。
避免前視:HTF 僅用確認棒;樞紐點僅作標註,不作入場條件。
Filters (11) |濾網(11 項)
HTF Trend / Bright Zone (RSI) / LTF EMA(3/8/21) / MACD / Volume / ADX Gate / Structure Breakout / Pullback to EMA / EMA Band Width / Peak Guard / Trendline or EMA200 Confirmation
(高階趨勢/RSI 亮區/本階 EMA 結構/MACD/量能/ADX 閘/結構突破/回踩 EMA/EMA 窄帶/高位防護/趨勢線或 EMA200 確認)
User can define required passes (default 7).|可自訂需通過的濾網數(預設 7)。
Features |功能
Multi-market presets (Crypto / Gold / US Futures / Forex)|多市場預設
Adaptive TP/SL with labels (dynamic R:R)|自適應 TP/SL(含標註)
Risk-based star rating (0★–5★)|風險星級評分
Signal modes: Conservative / Balanced / Aggressive|訊號模式:保守/平衡/積極
Peak Guard toggle|高位防護可切換
How to use |使用方式
Pick market preset; start with 5m/15m.
Set required filters (default 7) and enable HTF confirmed bars.
Tune TP/SL and risk per symbol/timeframe; use star rating as visual guidance.
In choppy markets, raise ADX min and EMA-band threshold; in trend, relax them slightly.
選擇市場預設(建議 5/15 分鐘起)。
設定需通過的濾網數(預設 7),並啟用 HTF 確認棒。
依商品/時框微調 TP/SL 與風險;以星級作視覺參考。
震盪市提高 ADX 與帶寬門檻;趨勢市可適度放寬。
Notes |注意
Backtest behavior depends on bar resolution and fill rules; intrabar path may differ from live fills.
Educational use only; not financial advice.
No ads/links/contacts.
Changelog |版本紀錄(示例,請用「Update」維護)
2025-09-05: Reversal v2.1 scoring & 2-step confirmation; TL rejection/OB-touch trigger (optional); EMA8 recapture via close; Peak Guard integrated; BTC/ETH/SOL presets refined; alerts expanded; label params cleaned.
2025-08-28: Fixed decimal bug; tuned presets for four markets; kept auto RR/SL logic.
RSI+VOL——Binary(One bar)Overview
This indicator integrates Stochastic RSI, MACD trend alignment, ADX trend strength, and multi-dimensional volume analysis to provide intelligent signal guidance and market activity monitoring. It is suitable for short-term, swing, and event-driven trading, offering clear visualization of trend direction, market strength, and volume anomalies.
Core Features
1️⃣ Stochastic RSI Signals
Automatically identifies overbought and oversold conditions to generate buy and sell reference signals.
Signals are filtered with candle closing direction to reduce counter-trend entries.
2️⃣ MACD Trend Alignment
Signals trigger only when MACD trend direction aligns with Stochastic RSI, improving accuracy.
Real-time trend alignment reduces noise from ranging markets.
3️⃣ ADX Trend Strength Filter
Signals trigger only when ADX indicates a significant trend, filtering out low-strength movements.
Helps capture primary market directions.
4️⃣ Multi-Dimensional Volume Analysis
Differentiates bullish and bearish volume to identify breakout signals.
Relative volume (RVOL) ensures signals occur during periods of active trading.
Background highlights abnormal spikes and extreme volume, clearly reflecting market activity.
5️⃣ Signal Visualization and Alerts
Buy and sell labels with corresponding RSI values are displayed on the chart.
Built-in alert conditions support TradingView notifications and strategy integration.
Indicator Value
Multi-dimensional alignment: combines trend, momentum, and market activity for comprehensive assessment.
High-precision signal reference: filters noise and provides clear entry indications.
Market activity monitoring: highlights extreme volume to reflect market participation.
Broad applicability: suitable for short-term, swing, and event-driven trading across various markets.
Chimera [theUltimator5]In myth, the chimera is an “impossible” hybrid—lion, goat, and serpent fused into one—striking to look at and formidable in presence. The word has come to mean a beautiful, improbable union of parts that shouldn’t work together, yet do.
Chimera is a dual-mode market context tool that blends a multi-input oscillator with classic ADX/DI trend strength, plus optional multi-timeframe “gap-line” tracking. Use it to visualize regime (trend vs. range), momentum swings around an adaptive midline, and higher timeframe (HTF) reference levels that auto-terminate on touch/cross.
Modes
1) Oscillator view
A smoothed composite of five common inputs—RSI, MACD (oscillator), Bollinger position, Stochastic, and an ATR/DI-weighted bias. Each is normalized to a comparable 0–100 style scale, averaged, and plotted as a candle-style oscillator (short vs. long smoothing, wickless for clarity). A dynamic midline with standard-deviation bands frames neutral → bearish/bullish zones. Colors ramp from neutral to your chosen Oversold/Overbought endpoints; consolidation can override to white.
Here is a description of the (5) signals used to calculate the sentiment oscillator:
RSI (14): Measures recent momentum by comparing average gains vs. losses. High = strength after advances; low = weakness after declines. (Z-score normalized to 0–100.)
MACD oscillator (12/26/9): Uses the difference between MACD and its signal (histogram) to gauge momentum shifts. Positive = bullish tilt; negative = bearish. (Z-score normalized.)
Bollinger Bands position (20, 2): Locates price within the bands (0–100 from lower → upper). Near upper suggests strength/expansion; near lower suggests weakness/contraction. (Then normalized.)
Stochastic (14, 3, 3): Shows where the close sits within the recent high-low range, smoothed via %D. Higher values = closes near highs; lower = near lows. (Scaled 0–100.)
ATR/DI composite (14): Volatility-weighted directional bias: (+DI − −DI) amplified by ATR as a % of price and its relative average. Positive = bullish pressure with volatility; negative = bearish. (Rank/scale normalized.)
All five are normalized and averaged into one composite, then smoothed (short/long) and compared to an adaptive midline with bands.
2) ADX view
Shows ADX, +DI, –DI with user-defined High Threshold. Transparency and color shift with regime. When ADX is strong, a directional “fire/ice” gradient fills the area between ADX and the high threshold, biased toward the dominant DI; when ADX is weak, a soft white fade highlights low-trend conditions.
HTF gap-line tracking (optional; both modes)
Detects “gap-like” reference levels after weak-trend consolidation flips into a sudden DI jump.
Anchors a line at the event bar’s open and auto-terminates upon first touch/cross (tick-size tolerance).
Auto-selects up to three higher timeframes suited to your chart resolution and prints non-overlapping lines with labels like 1H / 4H / 1D. Lower-priority duplicates are suppressed to reduce clutter.
Confirmation / repaint notes
Signals and lines finalize on bar close of the relevant timeframe.
HTF elements update only on the HTF bar close. During a forming bar they may appear transiently.
Line removal finalizes after the bar that produced the touch/cross closes.
Visual cues & effects
Oscillator candles: Open/High = long smoothing; Low/Close = short smoothing (no wicks).
Adaptive bands: Midline ± StdDev Multiplier × stdev of the blended series.
Consolidation tint: Optional white backdrop/candles when the consolidation condition is true (balance + low ADX).
Breakout VFX (optional): With strong DI/ADX and Bollinger breaks, renders a subtle “fire” flare above upper-band thrusts or “ice” shelf below lower-band thrusts.
Inputs (high-level)
Visual Style: Oscillator or ADX.
General (Oscillator): Lookback Period, Short/Long Smoothing, Standard Deviation Multiplier.
Color (Oscillator): Oversold/Overbought colors for gradient endpoints.
Plot (Oscillator): Show Candles, Show Slow MA Line, Show Individual Component (RSI/MACD/BB/Stoch/ATR).
Table (Oscillator): Show Information Table & position (compact dashboard of component values + status).
ADX / Gaps / VFX (both modes): ADX High Threshold, Highlight Backgrounds, Show Gap Labels, Visual Overlay Effects, and color choices for current-TF & HTF lines.
HTF selection: Automatic ladder (3 tiers) based on your chart timeframe.
Alerts (built-in)
Buy Signal – Primary: Oscillator exits oversold.
Sell Signal – Primary: Oscillator exits overbought.
Gap Fill Line Created (Any TF)
Gap Fill Line Terminated (Any TF)
ADX Crossed ABOVE/BELOW Low Threshold
ADX Crossed ABOVE/BELOW High Threshold
Consolidation Started
Alerts evaluate on the close of the relevant timeframe.
How to read it (quick guide)
Pick your lens: Oscillator for blended momentum around an adaptive midline; ADX for trend strength and DI skew.
Watch extremes & mean re-entries (Oscillator): Approaches to the top/bottom band show persistent momentum; returns toward the midline show normalization.
Check regime (ADX): Below Low = low-trend; above High = strong trend, with “fire/ice” bias toward +DI/–DI.
Track gap lines: Fresh labels mark new reference levels; lines auto-remove on first interaction. HTF lines add context but finalize only on HTF close.
The uniqueness from this indicator comes from multiple areas:
1. A unique multi-timeframe algorithm detects gap fill zones and plots them on the chart.
2. Visual effects for both visual modes were hand crafted to provide a visually stunning and intuitive interface.
3. The algorithm to determine sentiment uses a unique blend of weight and sensitivity adjustment to create a plot with elastic upper and lower bounds based off historical volatility and price action.

Table Logic ExtractorTable Logic Extractor v2.0
Advanced multi-timeframe analysis with intelligent trade recommendations!
Overview:
This sophisticated indicator provides comprehensive market analysis through multiple technical indicators and timeframes. It combines EMA analysis, RSI momentum, MACD signals, Bollinger Bands, volume analysis, divergence detection, and intelligent trade recommendations with support/resistance distance calculations and trading style detection.
Key Features:
✅ Multi-Indicator Analysis - EMA, RSI, MACD, Bollinger Bands, Volume, ATR
✅ Multi-Timeframe Analysis - M1, M5, M15, M30 trend comparison
✅ Divergence Detection - Bullish and bearish divergence with strength calculation
✅ Support/Resistance Analysis - Distance calculations with Fibonacci levels
✅ Trading Style Detection - Trend, Range, Breakout, Scalping identification
✅ Intelligent Trade Signals - Style-based trade recommendations with confidence levels
✅ Risk Management - Stop Loss and Take Profit calculations
✅ Comprehensive Table - Real-time analysis with 14 different metrics
How It Works:
The indicator uses advanced analysis:
• Multi-Timeframe - M1, M5, M15, M30 trend analysis
• Style Detection - Automatic trading style identification
• S/R Analysis - Fibonacci-based support/resistance levels
• Weighted Scoring - EMA (2.0), RSI (1.5), MACD (1.5), BB (1.0), Volume (1.0)
• Intelligent Signals - Style-based trade recommendations
Trading Style Detection:
• TREND TRADING - Strong trend + aligned timeframes (Green)
• RANGE TRADING - Low volatility + sideways movement (Yellow)
• BREAKOUT TRADING - High volume + near levels (Orange)
• SCALPING - High volatility + quick moves (Red)
Information Table (14 Metrics):
Real-time display showing:
• ATR volatility with signal (HIGH/MED/LOW/NORMAL VOL)
• Divergence status with strength percentage
• S/R Distance with Fibonacci levels
• Stop Loss (2.0:1 ratio) and Take Profit 1 (1.5:1 ratio)
• Multi-Timeframe analysis (M1, M5, M15, M30)
• Scalping signals with confidence levels
• Current trend with strength percentage
• Intelligent trade recommendations
Trade Recommendations:
• TREND BUY/SELL - All timeframes aligned (High confidence)
• SHORT-TERM BUY/SELL - M5 signal only (Medium confidence)
• SCALPING BUY/SELL - M5 vs higher timeframes (Low confidence)
• WAIT - No clear signal (No confidence)
Support/Resistance Analysis:
• Fibonacci Levels: 23.6%, 38.2%, 50% retracements
• Distance Categories: Very Near (Red), Near (Orange), Medium (Yellow), Far (Green)
• ATR-based distance measurement
• Real-time proximity alerts
Scalping Detection:
Specialized signals based on:
• High volatility (ATR ratio > 1.5)
• Quick price moves (fast momentum)
• Volume confirmation (high volume spikes)
• RSI extremes (oversold/overbought)
Settings:
• EMA - Fast (9), Slow (21), Trend (50)
• RSI - Length (14), Overbought (70), Oversold (30)
• MACD - Fast (12), Slow (26), Signal (9)
• Bollinger Bands - Length (20), Multiplier (2.0)
• ATR - Length (14) for volatility measurement
• Volume Threshold - 1.5x average volume
• Divergence - Lookback (3), Threshold (0.5)
Best Practices:
🎯 Adapt strategy to detected trading style
📊 Use multi-timeframe analysis for confirmation
⚡ Monitor S/R distances for entry timing
🛡️ Always use calculated Stop Loss levels
🔍 Watch for divergence signals
📈 Follow intelligent trade recommendations
Pro Tips:
• Table provides all essential information in one place
• Trading style detection helps adapt your strategy
• S/R distance shows proximity to key levels
• Confidence levels indicate signal reliability
• Multi-timeframe alignment increases success rate
• Scalping signals work best in high volatility
Alerts:
• Trend Change Alert - "Trend changed across timeframes"
• Divergence Alert - "Divergence detected"
• Scalping Alert - "Scalping opportunity"
• Trade Signal Alert - "Trade recommendation available"
Version 2.0 Improvements:
• Advanced multi-timeframe analysis (M1, M5, M15, M30)
• Intelligent trading style detection
• Comprehensive support/resistance analysis
• Professional trade recommendations with confidence levels
• Scalping detection with specialized signals
• Risk management with calculated SL/TP levels
• 14-metric comprehensive information table
Created with ❤️ for the trading community
This indicator is free to use for both commercial and non-commercial purposes.

Complexity v3.2Complex Trend Analyzer v6.1 v3.2
Advanced multi-indicator trend analysis with dynamic timeframe adaptation!
Overview:
This sophisticated indicator combines multiple technical analysis tools for comprehensive trend analysis. It features EMA crossovers, RSI momentum, MACD signals, Bollinger Bands, volume analysis, divergence detection, and multi-timeframe analysis with dynamic parameter adaptation based on market volatility.
Key Features:
✅ Multi-Indicator Analysis - EMA, RSI, MACD, Bollinger Bands, Volume, ATR
✅ Divergence Detection - Bullish and bearish divergence with strength calculation
✅ Dynamic Timeframe Adaptation - Parameters adjust automatically based on timeframe
✅ Trend Tracking - Complete trend lifecycle with BUY/SELL/END signals
✅ Multi-Timeframe Analysis - M5, M15, M30 trend comparison
✅ Risk Management - Volatility filtering and warning system
✅ Visual Clarity - Clean labels, trend lines, and information table
How It Works:
The indicator uses a weighted scoring system:
• EMA (2.0) - Primary trend direction
• RSI (1.5) - Momentum confirmation
• MACD (1.5) - Trend momentum
• Bollinger Bands (1.0) - Volatility context
• Volume (1.0) - Volume confirmation
• Price Action (0.5 each) - Higher highs/lows
Signal Logic:
• BUY - Weighted score > threshold + filters passed
• SELL - Weighted score > threshold + filters passed
• END - Trend reversal conditions met
Visual Elements:
• 🟢 BUY - Green label with trend tracking
• 🔴 SELL - Red label with trend tracking
• ⚫ END - Gray label marking trend end
• × BUY - Green crosses for bullish divergence
• × SELL - Red crosses for bearish divergence
• ⚠️ - Warning signals for trend reversals
Information Table:
Real-time display showing:
• ATR volatility with signal (HIGH/MED/LOW/NORMAL VOL)
• Divergence status with strength percentage
• BUY/SELL signal count and overall signal
• Multi-Timeframe analysis (M5, M15, M30)
• Current trend with strength percentage
• Detailed trend strength analysis
Dynamic Adaptation:
Parameters automatically adjust based on timeframe:
• M1 - Fastest reaction (1.5-7.5 bars)
• M3 - Quick response (2-10 bars)
• M5 - Standard setting (3-15 bars)
• M15 - Slower, more reliable (4-20 bars)
Settings:
• EMA - Fast (9), Slow (21), Trend (50)
• RSI - Length (14), Overbought (70), Oversold (30)
• MACD - Fast (12), Slow (26), Signal (9)
• Bollinger Bands - Length (20), Multiplier (2.0)
• ATR - Length (14) for volatility measurement
• Volume Threshold - 1.5x average volume
Best Practices:
🎯 Works best in trending markets
📊 Use as overlay on main chart
⚡ Combine with price action analysis
🛡️ Always use proper risk management
🔍 Watch for divergence signals
⚠️ Pay attention to warning signals
Pro Tips:
• Green background = Strong uptrend, Red background = Strong downtrend
• Orange background = Risk zone (high volatility/RSI extremes)
• × marks indicate divergence opportunities
• ⚠️ warnings signal potential trend reversals
• Use multi-timeframe analysis for confirmation
• Monitor the information table for comprehensive market view
Alerts:
• BUY Alert - "BUY signal detected"
• SELL Alert - "SELL signal detected"
• Divergence Alert - "Divergence detected"
• Warning Alert - "Trend warning"
Version 3.2 Improvements:
• Enhanced multi-indicator analysis
• Improved divergence detection with strength calculation
• Advanced dynamic timeframe adaptation
• Comprehensive risk management system
• Professional visual presentation
• Weighted scoring system for better accuracy
Created with ❤️ for the trading community
This indicator is free to use for both commercial and non-commercial purposes.

3CRGANG - Histogram (Basic)This indicator provides traders with a unified view of momentum by combining multiple classic oscillators into a single histogram. By aggregating momentum signals into one visual output, it simplifies trend analysis, helping traders identify momentum shifts without managing multiple indicators separately.
What It Does
The 3CRGANG - Histogram (Basic) calculates a momentum-based histogram using a user-selected oscillator (e.g., RSI, MACD, MFI, RVI, Stochastic, Stochastic RSI, or TMASlope). The histogram is plotted with color-coded bars to indicate bullish, bearish, or neutral momentum, alongside predefined alert levels and a trend status table for quick reference.
Why It’s Useful
This script addresses the challenge of monitoring multiple momentum indicators by consolidating them into a single histogram. Each oscillator measures momentum differently (e.g., RSI tracks price strength, MACD focuses on moving average convergence, MFI incorporates volume), but the script normalizes these signals into a unified output. This reduces chart clutter and provides a clear, actionable signal for identifying trend direction, making it easier for traders to focus on key momentum shifts across various market conditions.
How It Works
The script follows these steps to generate the histogram:
Oscillator Selection: Traders choose one oscillator to base the histogram on. For example: RSI measures the speed and change of price movements, MACD tracks the relationship between two exponential moving averages, and MFI combines price and volume to measure buying/selling pressure. The choice of oscillator affects the histogram’s sensitivity to price movements.
Fast Oscillator Calculation: A fast-moving oscillator is computed using the selected method over a user-defined period (default: 8 bars). For instance, RSI calculates the relative strength of price gains versus losses, while MACD computes the difference between short and long EMAs. The result is normalized to a range centered around zero.
Histogram Plotting: The oscillator’s output is adjusted by a modification factor (default: 1) for sensitivity tuning and plotted as a histogram. Positive values indicate bullish momentum, negative values indicate bearish momentum, and values near zero suggest a lack of clear trend.
Color Coding: Bars are colored based on momentum and price direction: green for bullish momentum (price moving upward, histogram value typically positive), red for bearish momentum (price moving downward, histogram value typically negative), and grey for neutral momentum (ranging conditions or unclear trend).
Alert Levels: Predefined buy and sell levels are plotted as dotted lines to mark significant momentum thresholds. For most oscillators, levels are set at 20 (buy) and -20 (sell), representing overbought/oversold conditions based on historical performance. For TMASlope, levels are adjusted to 0.04 and -0.04, as it measures the slope of a triangular moving average relative to the average true range (ATR).
Trend Table: A table in the top-right corner displays the current timeframe’s trend status ("Buy Only," "Sell Only," or "Ranging") based on the histogram value, price direction, and alert levels, along with the histogram’s numerical value.
Underlying Concepts
The script is built on the concept of momentum aggregation, aiming to capture short-term price dynamics while filtering noise. By using a fast-moving oscillator, it emphasizes recent price action, and the histogram format provides a visual summary of momentum strength. The alert levels are derived from typical overbought/oversold thresholds for each oscillator, adjusted to ensure consistency across different methods. The trend table adds a layer of interpretation, helping traders quickly assess whether the momentum aligns with the broader trend.
Use Case
Trending Markets: In a bullish trend, green bars above the buy alert level (e.g., 20) indicate strong upward momentum, suggesting potential long entries. In a bearish trend, red bars below the sell alert level (e.g., -20) suggest short opportunities.
Ranging Markets: Grey bars or values between alert levels indicate a lack of clear momentum, prompting caution or scalping strategies.
Confirmation Tool: Use the histogram to confirm price action signals, such as breakouts or reversals, by ensuring momentum aligns with the direction of the move. For example, a breakout with green bars above the buy level may signal a stronger trend.
Settings
Choose Type: Select the oscillator to use (default: RSI - CLASSIC).
Source: Choose between Close or HL2 price data (default: Close).
Histogram Length: Set the period for oscillator calculation (options: 5, 8, 13; default: 8).
Modification Factor: Adjust the sensitivity of the histogram (default: 1).
Notes
The script supports classic oscillators only and operates on the current timeframe.
If volume data is unavailable for your ticker, MFI calculations may not work; select another oscillator to continue plotting.
Disclaimer
This indicator is a tool for analyzing market trends and does not guarantee trading success. Trading involves risk, and past performance is not indicative of future results. Always use proper risk management.

Bayesian TrendEnglish Description (primary)
1. Overview
This script implements a Naive Bayesian classifier to estimate the probability of an upcoming bullish, bearish, or neutral move. It combines multiple indicators—RSI, MACD histogram, EMA price difference in ATR units, ATR level vs. its average, and Volume vs. its average—to calculate likelihoods for each market direction. Each indicator is “binned” (categorized into discrete zones) and assigned conditional probabilities for bullish/bearish/neutral scenarios. The script then normalizes these probabilities and paints bars in green if bullish is most likely, red if bearish is most likely, or blue if neutral is most likely. A small table is also displayed in the top-right corner of the chart, showing real-time probabilities.
2. How it works
Indicator Calculations: The script calculates RSI, MACD (line and histogram), EMA, ATR, and Volume metrics.
Binning: Each metric is converted into a discrete category (e.g., low, medium, high). For example, RSI < 30 is binned as “low,” while RSI > 70 is binned as “high.”
Conditional Probabilities: User-defined tables specify the conditional probabilities of each bin under three hypotheses (Up, Down, Neutral).
Naive Bayesian Formula: The script multiplies the relevant conditional probabilities, normalizes them, and derives the final probabilities (Up, Down, or Neutral).
Visualization:
Bar Colors: Bars are green when the Up probability exceeds 50%, red for Down, and blue otherwise.
Table: Displays numeric probabilities of Up, Down, and Neutral in percentage terms.
3. How to use it
Add the script to your chart.
Observe the colored bars:
Green suggests a higher probability for bullish movement.
Red suggests a higher probability for bearish movement.
Blue indicates a higher probability of sideways or uncertain conditions.
Check the table in the top-right corner to see exact probabilities (Up/Down/Neutral).
Use the input settings to adjust thresholds (RSI, MACD, Volume, etc.), define alert conditions (e.g., when Up probability crosses 50%), and decide whether to trigger alerts on bar close or in real-time.
4. Originality and usefulness
Originality: This script uniquely applies a Naive Bayesian approach to a blend of classic and volume-based indicators. It demonstrates how different indicator “zones” can be combined to produce probabilistic insights.
Usefulness: Traders can interpret the probability breakdown to gauge the script’s bias. Unlike single indicators, this approach synthesizes several signals, potentially offering a more holistic perspective on market conditions.
5. Limitations
The conditional probabilities are manually assigned and may not reflect actual market behavior across all instruments or timeframes.
Results depend on the user’s choice of thresholds and indicator settings.
Like any indicator, past performance does not guarantee future results. Always confirm signals with additional analysis.
6. Disclaimer
This script is intended for educational and informational purposes only. It does not constitute financial advice. Trading involves significant risk, and you should make decisions based on your own analysis. Neither the script’s author nor TradingView is liable for any financial losses.
Русское описание (Russian translation, optional)
Этот индикатор реализует наивный Байесовский классификатор для оценки вероятности предстоящего роста (Up), падения (Down) или бокового движения (Neutral). Он комбинирует несколько индикаторов—RSI, гистограмму MACD, разницу цены и EMA в единицах ATR, уровень ATR относительно своего среднего значения и объём относительно своего среднего—чтобы вычислить вероятности для каждого направления рынка. Каждый индикатор делится на «зоны» (low, mid, high), которым приписаны условные вероятности для бычьего/медвежьего/нейтрального исхода. Скрипт нормирует эти вероятности и раскрашивает бары в зелёный, красный или синий цвет в зависимости от того, какая вероятность выше. Также в правом верхнем углу отображается таблица с текущими значениями вероятностей.

Confluence StrategyOverview of Confluence Strategy
The Confluence Strategy in trading refers to the combination of multiple technical indicators, support/resistance levels, and chart patterns to identify high-probability trading opportunities. The idea is that when several indicators agree on a price movement, the likelihood of that movement being successful increases.
Key Components
Technical Indicators:
Moving Averages (MA): Commonly used to determine the trend direction. Look for crossovers (e.g., the 50-day MA crossing above the 200-day MA).
Relative Strength Index (RSI): Helps identify overbought or oversold conditions. A reading above 70 may indicate overbought conditions, while below 30 suggests oversold.
MACD (Moving Average Convergence Divergence): Useful for spotting changes in momentum. Look for MACD crossovers and divergence from price.
Support and Resistance Levels:
Identify key levels where price has historically reversed. These can be drawn from previous highs/lows, Fibonacci retracement levels, or psychological price levels.
Chart Patterns:
Patterns like head and shoulders, double tops/bottoms, or flags can indicate potential reversals or continuations in price.
Strategy Implementation
Set Up Your Chart:
Add the desired indicators (e.g., MA, RSI, MACD) to your TradingView chart.
Mark significant support and resistance levels.
Identify Confluence Points:
Look for situations where multiple indicators align. For instance, if the price is near a support level, the RSI is below 30, and the MACD shows bullish divergence, this may signal a buying opportunity.
Entry and Exit Points:
Entry: Place a trade when your confluence conditions are met. Use limit orders for better prices.
Exit: Set profit targets based on resistance levels or use trailing stops. Consider the risk-reward ratio to ensure your trades are favorable.
Risk Management:
Always implement stop-loss orders to protect against unexpected market moves. Position size should reflect your risk tolerance.
Example of a Confluence Trade
Setup:
Price approaches a strong support level.
RSI shows oversold conditions (below 30).
The 50-day MA is about to cross above the 200-day MA (bullish crossover).
Action:
Enter a long position as the conditions align.
Set a stop loss just below the support level and a take profit at the next resistance level.
Conclusion
The Confluence Strategy can significantly enhance trading accuracy by ensuring that multiple indicators support a trade decision. Traders on TradingView can customize their indicators and charts to fit their personal trading styles, making it a flexible approach to technical analysis.

Swiss Knife [MERT]Introduction
The Swiss Knife indicator is a comprehensive trading tool designed to provide a multi-dimensional analysis of the market. By integrating a wide array of technical indicators across multiple timeframes, it offers traders a holistic view of market sentiment, momentum, and potential reversal points. This indicator is particularly useful for traders looking to combine trend analysis, momentum indicators, volume data, and price action into a single, easy-to-read format.
---
Key Features
Multi-Timeframe Analysis : Evaluates indicators on Daily , 4-Hour , 1-Hour , and 15-Minute timeframes.
Comprehensive Indicator Suite : Incorporates MACD , Awesome Oscillator (AO) , Parabolic SAR , SuperTrend , DPO , RSI , Stochastic Oscillator , Bollinger Bands , Ichimoku Cloud , Chande Momentum Oscillator (CMO) , Donchian Channels , ADX , volume-based momentum indicators, Fractals , and divergence detection.
Market Sentiment Scoring : Aggregates signals from multiple indicators to provide an overall sentiment score.
Visual Aids : Displays EMA lines, trendlines, divergence signals, and a sentiment table directly on the chart.
Super Trend Reversal Signals : Identifies potential market reversal points by assessing the momentum of automated trading bots.
---
Explanation of Each Indicator
Moving Average Convergence Divergence (MACD)
- Purpose : Measures the relationship between two moving averages of price.
- Interpretation : A positive histogram suggests bullish momentum; a negative histogram indicates bearish momentum.
Awesome Oscillator (AO)
- Purpose : Gauges market momentum by comparing recent market movements to historic ones.
- Interpretation : Above zero indicates bullish momentum; below zero indicates bearish momentum.
Parabolic SAR (SAR)
- Purpose : Identifies potential reversal points in price direction.
- Interpretation : Dots below price suggest an uptrend; dots above price suggest a downtrend.
SuperTrend
- Purpose : Determines the prevailing market trend.
- Interpretation : Provides buy or sell signals based on price movements relative to the SuperTrend line.
Detrended Price Oscillator (DPO)
- Purpose : Removes trend from price to identify cycles.
- Interpretation : Values above zero suggest price is above the moving average; values below zero indicate it is below.
Relative Strength Index (RSI)
- Purpose : Measures the speed and change of price movements.
- Interpretation : Values above 50 indicate bullish momentum; values below 50 indicate bearish momentum.
Stochastic Oscillator
- Purpose : Compares a particular closing price to a range of its prices over a certain period.
- Interpretation : Values above 50 indicate bullish conditions; values below 50 indicate bearish conditions.
Bollinger Bands (BB)
- Purpose : Measures market volatility and provides relative price levels.
- Interpretation : Price above the middle band suggests bullishness; below the middle band suggests bearishness.
Ichimoku Cloud
- Purpose : Provides support and resistance levels, trend direction, and momentum.
- Interpretation : Bullish signals when price is above the cloud; bearish signals when price is below the cloud.
Chande Momentum Oscillator (CMO)
- Purpose : Measures momentum on both up and down days.
- Interpretation : Values above 50 indicate strong upward momentum; values below -50 indicate strong downward momentum.
Donchian Channels
- Purpose : Identifies volatility and potential breakouts.
- Interpretation : Price above the upper band suggests bullish breakout; below the lower band suggests bearish breakout.
Average Directional Index (ADX)
- Purpose : Measures the strength of a trend.
- Interpretation : DI+ above DI- indicates bullish trend; DI- above DI+ indicates bearish trend.
Volume Momentum Indicators (VolMom, CumVolMom, POCMom)
- Purpose : Analyze volume to assess buying and selling pressure.
- Interpretation : Positive values suggest bullish volume momentum; negative values indicate bearish volume momentum.
Fractals
- Purpose : Identify potential reversal points in the market.
- Interpretation : Up fractals may indicate a future downtrend; down fractals may indicate a future uptrend.
Divergence Detection
- Purpose : Identifies divergences between price and various indicators (RSI, MACD, Stochastic, OBV, MFI, A/D Line).
- Interpretation : Bullish divergences suggest potential upward reversal; bearish divergences suggest potential downward reversal.
- Note : This functionality utilizes the library from Divergence Indicator .
---
Coloring Scheme
Background Color
- Purpose : Reflects the overall market sentiment by combining sentiment scores from all indicators across different timeframes.
- Interpretation :
- Green Shades : Indicate bullish market sentiment.
- Red Shades : Indicate bearish market sentiment.
- Intensity : The strength of the color corresponds to the strength of the sentiment score.
Sentiment Table
- Purpose : Displays the status of each indicator across different timeframes.
- Interpretation :
- Green Cell : The indicator suggests a bullish signal.
- Red Cell : The indicator suggests a bearish signal.
- Percentage Score : Indicates the overall bullish or bearish sentiment on that timeframe.
Exponential Moving Averages (EMAs)
- Purpose : Provide dynamic support and resistance levels.
- Colors :
- EMA 10 : Lime
- EMA 20 : Yellow
- EMA 50 : Orange
- EMA 100 : Red
- EMA 200 : Purple
Trendlines
- Purpose : Visual representation of support and resistance levels based on pivot points.
- Interpretation :
- Upward Trendlines : Colored green , indicating support levels.
- Downward Trendlines : Colored red , indicating resistance levels.
- Note : Trendlines are drawn using the library from Simple Trendlines .
---
Utility of Market Sentiment
The indicator aggregates signals from multiple technical indicators across various timeframes to compute an overall market sentiment score . This comprehensive approach helps traders understand the prevailing market conditions by:
Confirming Trends : Multiple indicators pointing in the same direction can confirm the strength of a trend.
Identifying Reversals : Divergences and fractals can signal potential turning points.
Timeframe Alignment : Aligning signals across different timeframes can enhance the probability of successful trades.
---
Divergences
Divergence occurs when the price of an asset moves in the opposite direction of a technical indicator, suggesting a potential reversal.
- Bullish Divergence : Price makes a lower low, but the indicator makes a higher low.
- Bearish Divergence : Price makes a higher high, but the indicator makes a lower high.
The indicator detects divergences for:
RSI
MACD
Stochastic Oscillator
On-Balance Volume (OBV)
Money Flow Index (MFI)
Accumulation/Distribution Line (A/D Line)
By identifying these divergences, traders can spot early signs of trend reversals and adjust their strategies accordingly.
---
Trendlines
Trendlines are essential tools for identifying support and resistance levels. The indicator automatically draws trendlines based on pivot points:
- Upward Trendlines (Support) : Connect higher lows, indicating an uptrend.
- Downward Trendlines (Resistance) : Connect lower highs, indicating a downtrend.
These trendlines help traders visualize the trend direction and potential breakout or reversal points.
---
Super Trend Reversals (ST Reversal)
The core idea behind the Super Trend Reversals indicator is to assess the momentum of automated trading bots (often referred to as 'Supertrend bots') that enter the market during critical turning points. Specifically, the indicator is tuned to identify when the market is nearing bottoms or peaks, just before it shifts direction based on the triggered Supertrend signals. This approach helps traders:
Engage Early : Enter the market as reversal momentum builds up.
Optimize Entries and Exits : Enter under favorable conditions and exit before momentum wanes.
By capturing these reversal points, traders can enhance their trading performance.
---
Conclusion
The Swiss Knife indicator serves as a versatile tool that combines multiple technical analysis methods into a single, comprehensive indicator. By assessing various aspects of the market—including trend direction, momentum, volume, and price action—it provides traders with valuable insights to make informed trading decisions.
---
Citations
- Divergence Detection Library : Divergence Indicator by DevLucem
- Trendline Drawing Library : Simple Trendlines by HoanGhetti
---
Note : This indicator is intended for informational purposes and should be used in conjunction with other analysis techniques. Always perform due diligence before making trading decisions.
---

OneThingToRuleThemAll [v1.4]This script was created because I wanted to be able to display a contextual chart of commonly used indicators for scalping and swing traders, with the ability to control the visual representation on the charts as their cross-overs, cross-unders, or changes of state happen in real time. Additionally, I wanted the ability to control how or when they are displayed. While looking through other community projects, I found they lacked the ability to full customize the output controls and values used for these indicators.
The script leverages standard RSI/MACD/VWAP/MVWAP/EMA calculations to help a trader visually make more informed decisions on entering or exiting a trade, depending on their understanding on what the indicators represent. Paired with a table directly on the chart, it allows a trader to quickly reference values to make more informed decisions without having to look away from the price action or look through multiple indicator outputs.
The main functionality of the indicator is controlled within the settings directly on the chart. There a user can enable the visual representations, or disable, and configure how they are displayed on the charts by altering their values or style types.
Users have the ability to enable/disable visual representations of:
The indicator chart
RSI Cross-over and RSI Reversals
MACD Uptrends and Downtrends
VWAP Cross-overs and Cross-unders
VWAP Line
MVWAP Cross-overs and Cross-unders
MVWAP Line
EMA Cross-overs and Cross-unders
EMA Line
Some traders like to use these visual indications as thresholds to enter or exit trades. Its best to find out which ones work the best with the security you are trying to trade. Personally, I use the table as a reference in conjunction with the RSI chart indicators to help me decide a logical trailing stop if I am scalping. Some users might like the track EMA200 crossovers, and have visual representations on the chart for when that happens. However, users may use the other indicators in other methods, and this script provides the ability to be able to configure those both visually and by value.
The pine script code is open source and itself is fairly straightforward, it is mostly written to provide the ultimate level of control the the user of the various indicators. Please reach out to me directly if you would like a further understanding of the code and an explanation on anything that may be unclear.
Enjoy :)
-dead1.
