Chaikin Volatility StrategyChaikin's Volatility indicator compares the spread between a security's
high and low prices. It quantifies volatility as a widening of the range
between the high and the low price.
You can use in the xPrice1 and xPrice2 any series: Open, High, Low, Close, HL2,
HLC3, OHLC4 and ect...
스크립트에서 "OHLC"에 대해 찾기

Chaikin Volatility Chaikin's Volatility indicator compares the spread between a security's
high and low prices. It quantifies volatility as a widening of the range
between the high and the low price.
You can use in the xPrice1 and xPrice2 any series: Open, High, Low, Close, HL2,
HLC3, OHLC4 and ect...

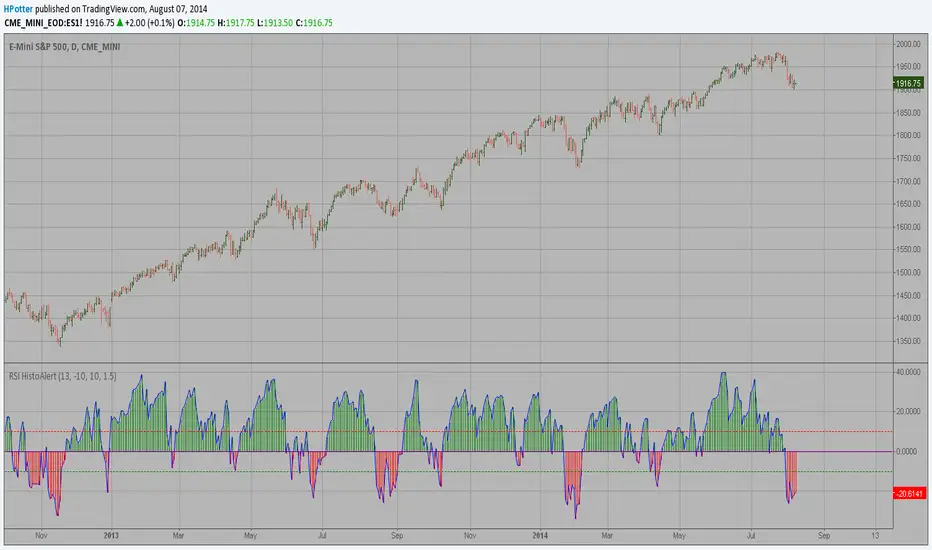
RSI HistoAlert StrategyThis is simple indicator modified RSI Strategy
You can use in the xPrice any series: Open, High, Low, Close, HL2, HLC3, OHLC4 and ect...

RSI HistoAlertThis is simple indicator modified RSI
You can use in the xPrice any series: Open, High, Low, Close, HL2, HLC3, OHLC4 and ect...
FX Sniper: T3-CCI Copy Strategy This simple indicator gives you a lot of useful information - when to enter, when to exit
and how to reduce risks by entering a trade on a double confirmed signal.
You can use in the xPrice any series: Open, High, Low, Close, HL2, HLC3, OHLC4 and ect...
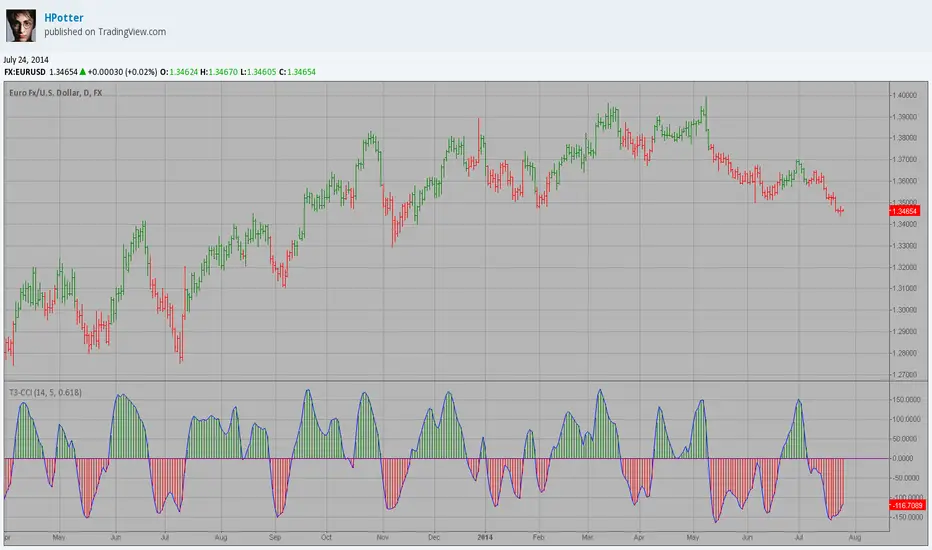
FX Sniper: T3-CCIThis simple indicator gives you a lot of useful information - when to enter, when to exit
and how to reduce risks by entering a trade on a double confirmed signal.
You can use in the xPrice any series: Open, High, Low, Close, HL2, HLC3, OHLC4 and ect...

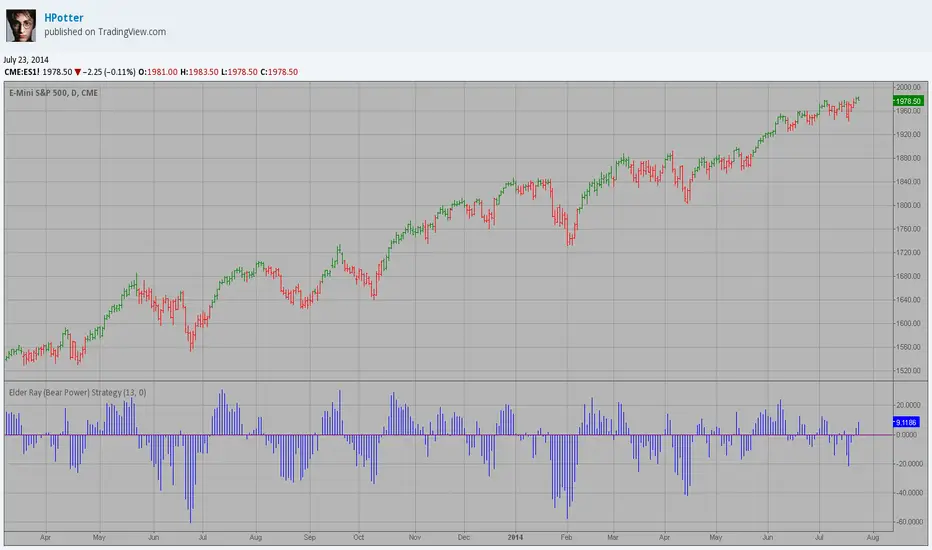
Elder Ray (Bear Power) Strategy Developed by Dr Alexander Elder, the Elder-ray indicator measures buying
and selling pressure in the market. The Elder-ray is often used as part
of the Triple Screen trading system but may also be used on its own.
Dr Elder uses a 13-day exponential moving average (EMA) to indicate the
market consensus of value. Bear Power measures the ability of sellers to
drive prices below the consensus of value. Bear Power reflects the ability
of sellers to drive prices below the average consensus of value.
Bull Power is calculated by subtracting the 13-day EMA from the day's High.
Bear power subtracts the 13-day EMA from the day's Low.
You can use in the xPrice any series: Open, High, Low, Close, HL2, HLC3, OHLC4 and ect...
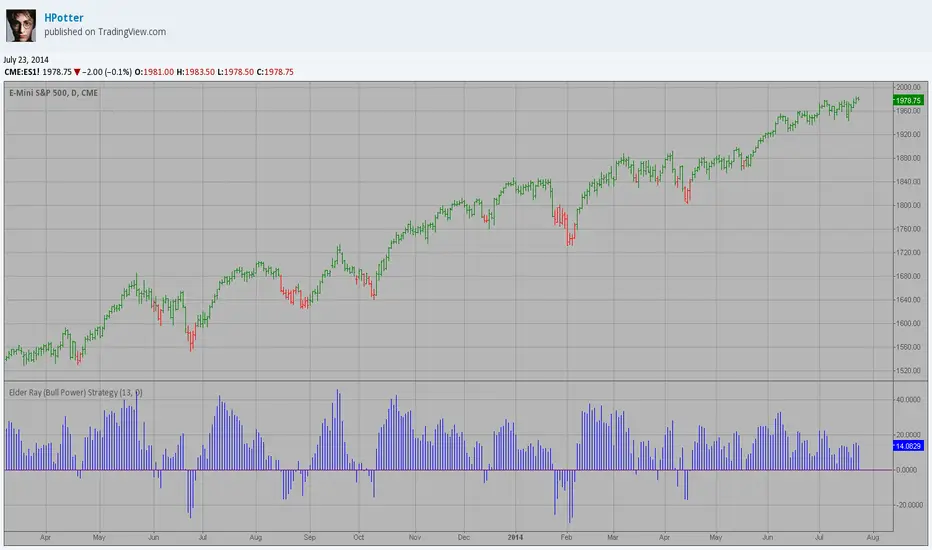
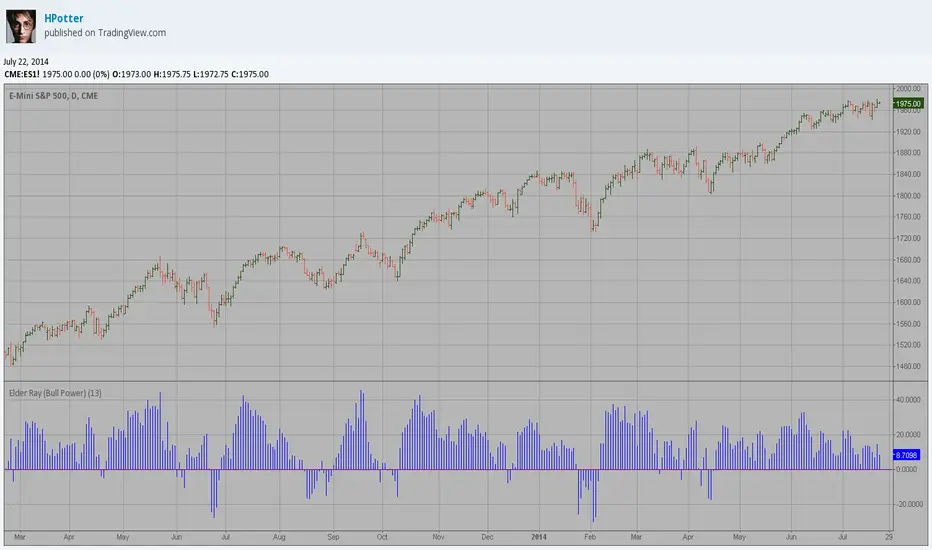
Elder Ray (Bull Power) Strategy Developed by Dr Alexander Elder, the Elder-ray indicator measures buying
and selling pressure in the market. The Elder-ray is often used as part
of the Triple Screen trading system but may also be used on its own.
Dr Elder uses a 13-day exponential moving average (EMA) to indicate the
market consensus of value. Bull Power measures the ability of buyers to
drive prices above the consensus of value. Bear Power reflects the ability
of sellers to drive prices below the average consensus of value.
Bull Power is calculated by subtracting the 13-day EMA from the day's High.
Bear power subtracts the 13-day EMA from the day's Low.
You can use in the xPrice any series: Open, High, Low, Close, HL2, HLC3, OHLC4 and ect...
Elder Ray (Bear Power) Developed by Dr Alexander Elder, the Elder-ray indicator measures buying
and selling pressure in the market. The Elder-ray is often used as part
of the Triple Screen trading system but may also be used on its own.
Dr Elder uses a 13-day exponential moving average (EMA) to indicate the
market consensus of value. Bear Power measures the ability of sellers to
drive prices below the consensus of value. Bear Power reflects the ability
of sellers to drive prices below the average consensus of value.
Bull Power is calculated by subtracting the 13-day EMA from the day's High.
Bear power subtracts the 13-day EMA from the day's Low.
You can use in the xPrice any series: Open, High, Low, Close, HL2, HLC3, OHLC4 and ect...

Elder Ray (Bull Power) Developed by Dr Alexander Elder, the Elder-ray indicator measures buying
and selling pressure in the market. The Elder-ray is often used as part
of the Triple Screen trading system but may also be used on its own.
Dr Elder uses a 13-day exponential moving average (EMA) to indicate the
market consensus of value. Bull Power measures the ability of buyers to
drive prices above the consensus of value. Bear Power reflects the ability
of sellers to drive prices below the average consensus of value.
Bull Power is calculated by subtracting the 13-day EMA from the day's High.
Bear power subtracts the 13-day EMA from the day's Low.
You can use in the xPrice any series: Open, High, Low, Close, HL2, HLC3, OHLC4 and ect...
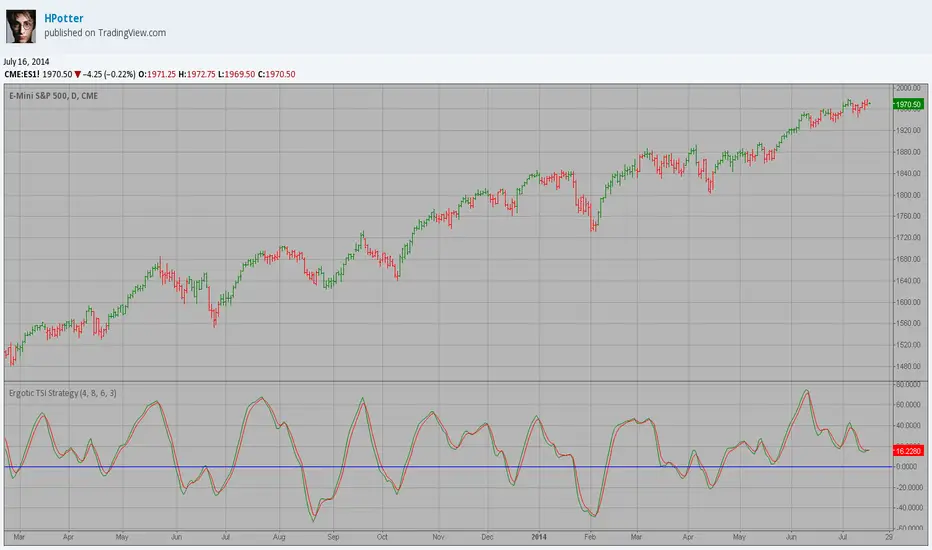
Ergotic TSI Strategy r - Length of first EMA smoothing of 1 day momentum
s - Length of second EMA smoothing of 1 day smoothing
u- Length of third EMA smoothing of 1 day momentum
Length of EMA signal line
This is one of the techniques described by William Blau in his book "Momentum,
Direction and Divergence" (1995). If you like to learn more, we advise you to
read this book. His book focuses on three key aspects of trading: momentum,
direction and divergence. Blau, who was an electrical engineer before becoming
a trader, thoroughly examines the relationship between price and momentum in
step-by-step examples. From this grounding, he then looks at the deficiencies
in other oscillators and introduces some innovative techniques, including a
fresh twist on Stochastics. On directional issues, he analyzes the intricacies
of ADX and offers a unique approach to help define trending and non-trending periods.
You can use in the xPrice any series: Open, High, Low, Close, HL2, HLC3, OHLC4 and ect...
Ergotic TSI r - Length of first EMA smoothing of 1 day momentum
s - Length of second EMA smoothing of 1 day smoothing
u- Length of third EMA smoothing of 1 day momentum
Length of EMA signal line
This is one of the techniques described by William Blau in his book "Momentum,
Direction and Divergence" (1995). If you like to learn more, we advise you to
read this book. His book focuses on three key aspects of trading: momentum,
direction and divergence. Blau, who was an electrical engineer before becoming
a trader, thoroughly examines the relationship between price and momentum in
step-by-step examples. From this grounding, he then looks at the deficiencies
in other oscillators and introduces some innovative techniques, including a
fresh twist on Stochastics. On directional issues, he analyzes the intricacies
of ADX and offers a unique approach to help define trending and non-trending periods.
You can use in the xPrice any series: Open, High, Low, Close, HL2, HLC3, OHLC4 and ect...

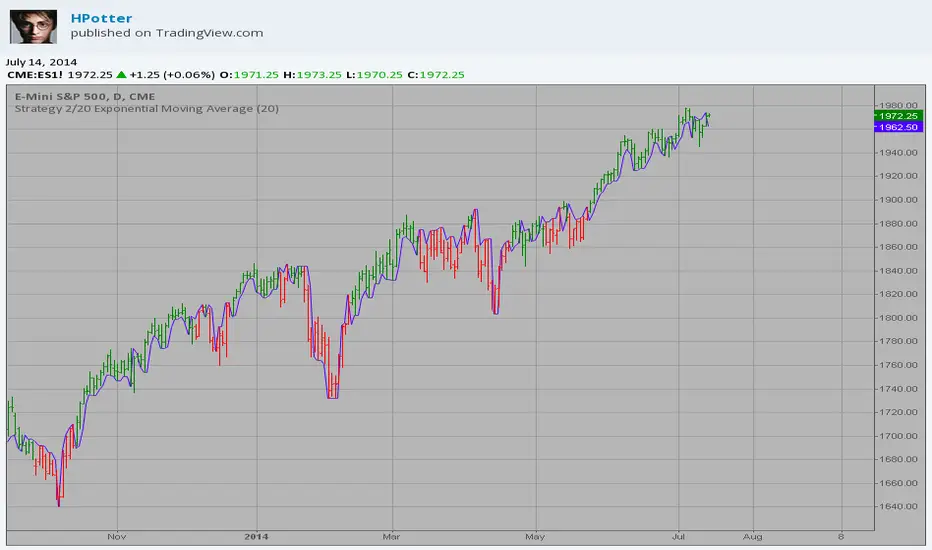
Strategy 2/20 Exponential Moving Average Strategy.
This indicator plots 2/20 exponential moving average. For the Mov
Avg X 2/20 Indicator, the EMA bar will be painted when the Alert criteria is met.
You can use in the xPrice any series: Open, High, Low, Close, HL2, HLC3, OHLC4 and ect...
2/20 Exponential Moving Average This indicator plots 2/20 exponential moving average. For the Mov
Avg X 2/20 Indicator, the EMA bar will be painted when the Alert criteria is met.
You can use in the xPrice any series: Open, High, Low, Close, HL2, HLC3, OHLC4 and ect...

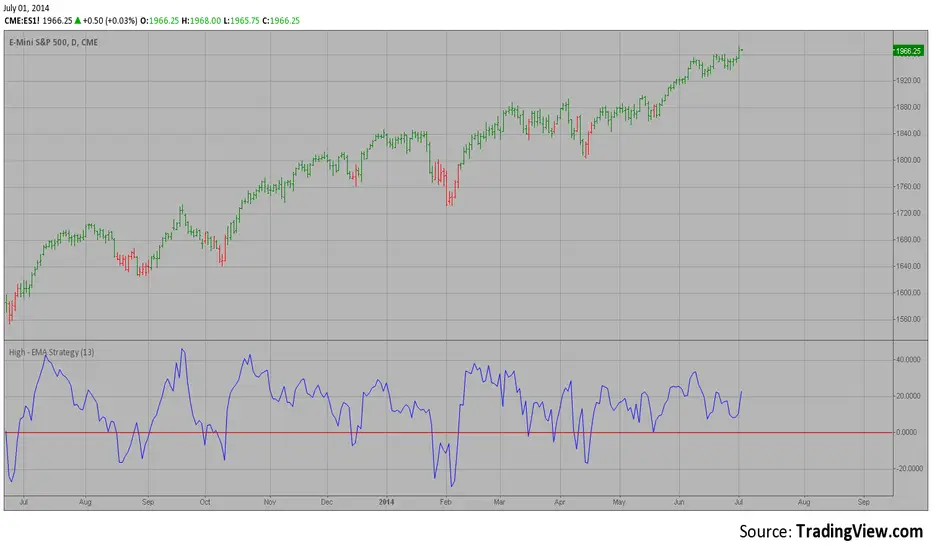
High - EMA Strategy This indicator plots the difference between the High (of the previous period)
and an exponential moving average (13 period) of the Close (of the previous period).
You can use in the xPrice any series: Open, High, Low, Close, HL2, HLC3, OHLC4 and ect...
It buy if indicator above 0 and sell if below.
High - EMA This indicator plots the difference between the High (of the previous period)
and an exponential moving average (13 period) of the Close (of the previous period).
You can use in the xPrice any series: Open, High, Low, Close, HL2, HLC3, OHLC4 and ect...

HTF Fractal Boxes by TAAKOWhat This Indicator Does
This indicator displays higher timeframe (HTF) candlesticks as an overlay on your current chart, allowing you to see larger timeframe price action without switching charts.
Key Features:
Shows the last 3 completed HTF candles (configurable)
Displays a 4th candle with dashed lines showing the current forming HTF bar
Each candle includes full OHLC data: body (open/close) and wicks (high/low)
Candles are color-coded: green for bullish, red for bearish, blue for neutral
Positioned on the right side of your chart for easy reference
Automatically scales with your Y-axis price movements

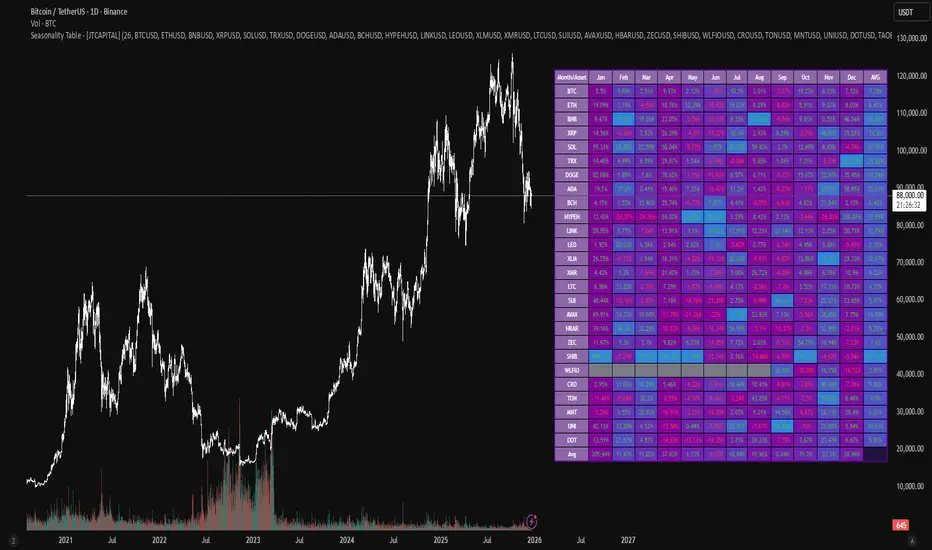
Seasonality Table - [JTCAPITAL]Seasonality Table - is a modified way to use monthly return aggregation across multiple assets to identify seasonal trends in cryptocurrencies and indices.
The indicator works by calculating in the following steps:
Asset Selection
The user defines a list of assets to include in the seasonality table. By default, the script allows up to 32 assets, including popular cryptocurrencies like BTC, ETH, BNB, XRP, and others. Each asset is identified by its symbol (e.g., "CRYPTO:BTCUSD").
Monthly Return Calculation
For each asset, the script requests monthly price data using request.security. Specifically, it retrieves the monthly open, close, and month number. The monthly return is calculated as:
Return = (Close - Open) / Open
This step provides a normalized measure of performance for each asset per month.
Data Aggregation
The script stores two key arrays for each asset and month combination:
sumReturns: The cumulative sum of monthly returns
countReturns: The number of months with valid data
This allows averaging returns later while handling months with missing data gracefully.
Table Construction
Rows representing months (January–December)
Columns representing each asset
An additional column showing the average return for all assets per month
A final row showing the yearly average return for each asset
Filling the Table
The table cells are filled as follows:
Monthly returns are averaged for each asset and displayed as a percentage.
Positive returns are colored green, negative returns red.
Missing data is displayed as a gray “—” placeholder.
Each row’s values are normalized for the color gradient to show relative performance.
Averages Computation
The script calculates two types of averages:
Monthly Average Across Assets : Sum of all asset returns for a month divided by the number of valid data points.
Yearly Average Per Asset : Sum of all monthly returns for an asset divided by the number of months with valid data.
These averages are displayed in the last column and last row respectively, with gradient coloring for visual comparison.
Buy and Sell Conditions
This indicator does not generate explicit buy or sell signals. Instead, it provides a visual heatmap of historical seasonality, allowing traders to:
Identify months where an asset historically outperforms (bullish bias)
Identify months with weak historical performance (bearish caution)
Compare seasonal patterns across multiple assets for portfolio allocation
Filters can be applied by adjusting the asset list, changing the color mapping, or focusing on specific months to highlight seasonal anomalies.
Features and Parameters
Number of assets: Set how many assets are included in the table (1–32).
Assets: Input symbols for the assets you want to analyze.
Low % Color: Defines the color for the lowest monthly returns in the gradient.
High % Color: Defines the color for the highest monthly returns in the gradient.
Cleaned asset names for concise display.
Gradient-based visualization for easier pattern recognition.
Monthly and yearly averages for comparative analysis.
Specifications
Monthly Return Calculation
Uses the formula (Close - Open) / Open for each asset per month. This standardizes performance across different price scales and ensures comparability between assets.
Arrays for Storage
sumReturns: Float array storing cumulative monthly returns.
countReturns: Integer array storing the number of valid data points per month.
These arrays allow efficient aggregation and average calculations without overwriting previous values.
Data Retrieval via Security Calls
Requests monthly OHLC data for each asset using request.security.
Ensures calculations reflect the correct timeframe and allow for historical comparison.
Color and Text Assignment
Green text for positive returns, red for negative returns.
Gray cells indicate missing data.
Gradient background shows relative magnitude within the month.
Seasonality Analysis
The table visually encodes which months historically produce stronger returns.
Useful for portfolio rotation, risk management, and identifying cyclical trends.
Scalability
Supports up to 32 assets.
Dynamically adapts to the number of assets and data availability.
Gradient scales automatically per row for consistent comparison.
Order Flow: Structural Sniper [Profile + Signals]Overview
This script is a comprehensive tool designed to bridge the gap between Market Structure and Order Flow analysis. It aims to eliminate the subjectivity of static support and resistance lines by focusing on dynamic liquidity and the behavior of aggressive versus passive market participants.
Unlike traditional indicators that plot static data, the Structural Delta Map dynamically anchors its analysis to the start of the current trend (Pivots), providing a clear "X-Ray" view of how volume was distributed during the current price swing.
How it Works
The indicator combines three distinct technical concepts into a single system:
1. Market Structure (Pivots):
It uses a pivot detection algorithm to identify significant Swing Highs and Swing Lows. This determines the market bias and anchors the analysis to the origin of the movement.
2. Anchored VWAP (Fair Price):
It automatically calculates the Volume Weighted Average Price (VWAP) starting from the last confirmed pivot. This yellow line acts as the "spine" of the trend, serving as dynamic institutional support/resistance.
3. Delta Profile & Heatmap:
A Volume Profile is plotted on the left side, anchored to the pivot.
Split Delta: Instead of a single color, bars are split into Green (Buying Volume) and Red (Selling Volume) based on price action estimation.
Heatmap Logic: The opacity of the bars adjusts automatically. Bright/Solid bars represent High Volume Nodes (HVN), while transparent bars represent Low Volume Nodes (LVN) or liquidity voids.
How to Use (Strategy)
The indicator provides both visual context and specific entry signals:
1. Visual Context:
Profile: Look for reactions at bright, wide bars (High Volume Nodes). These act as magnets or barriers.
Yellow Line (VWAP): In an uptrend, look for buy opportunities when price retraces to this line. In a downtrend, look for shorts on the retest.
2. Aggression Signals (Triangle "AGR"):
Type: Trend Continuation / Pullback.
Logic: Triggers when price retraces to the structural value zone (near VWAP), rejects it with higher-than-average volume, and closes in the direction of the trend.
3. Absorption Signals (Cross "ABS"):
Type: Reversal / Trap.
Logic:
Bullish Absorption: Price makes a new local low with high volume (selling pressure), but the candle closes bullish (leaving a long bottom wick). Passive buyers absorbed the aggression.
Bearish Absorption: Price makes a new local high with high volume, but closes bearish. Passive sellers absorbed the buying pressure.
Settings
Pivot Sensitivity: Adjusts how the script detects trend changes.
Profile Resolution: Controls the number of rows in the histogram.
Signal Filters: Enable/Disable signals and adjust the Volume Multiplier threshold.
Technical Disclaimer
This indicator estimates "Delta" (Buy vs. Sell volume) based on OHLC price action and bar volume, as Pine Script does not grant access to historical tick-by-tick data. While this approximation is highly effective for identifying aggression and absorption, it differs slightly from Level 2 footprint data found on platforms like Sierra Chart. Accuracy depends on the volume data provided by your exchange.

SMT Divergence [Kodexius]SMT Divergence is a correlation-based divergence detector built around the Smart Money Technique concept: when two normally correlated instruments should be making similar swing progress, but one prints a new extreme while the other fails to confirm it. This “disagreement” can be a valuable contextual signal around liquidity runs, distribution phases, and potential reversal or continuation points.
The script compares the chart symbol (primary) with a user-selected comparison symbol (for example BTC vs ETH, ES vs NQ, EUR/USD vs GBP/USD) and automatically scans both instruments for confirmed swing highs and swing lows using pivot logic. Once swings are established, it checks for classic SMT conditions:
Primary makes a new swing extreme while the comparison symbol forms a non-confirming swing .
To support a wider range of markets, the indicator includes an Inverse Correlation option for pairs that typically move opposite to each other (for example DXY vs EUR/USD). With this enabled, the divergence rules are logically flipped so that the script still detects “non-confirmation” in a way that is consistent with the pair’s relationship.
The indicator is designed to be readable and actionable. It can draw divergence labels directly on the main chart, connect the relevant swing points with lines, show a compact information table with the last signal and settings, and optionally render the comparison symbol as a mini candle chart in the indicator pane for quick visual validation.
🔹 Features
🔸 Two-Symbol SMT Analysis (Primary vs Compare)
Select any comparison symbol to evaluate correlation structure and divergence. The script fetches the comparison OHLC data using the current chart timeframe to keep both series aligned for analysis.
🔸 Inverse Correlation Mode
For inversely correlated pairs, enable “Inverse Correlation” so the script interprets confirmation appropriately (for example, a higher low on the comparison instrument might be expected to correspond to a lower low on the primary, depending on the relationship). This helps avoid false conclusions when the pair naturally moves opposite.
🔸 Pivot-Based Swing with Adjustable Sensitivity
Swings are detected using confirmed pivots (left bars and right bars). This provides cleaner structural swing points compared with raw candle-to-candle comparisons, and it lets you control sensitivity for different market conditions and timeframes. The script also limits stored swing history to keep performance stable.
🔸 Flexible Detection Mode: Time Matched or Independent Swings
You can choose how swings are paired across instruments:
Time Matched searches for a comparison swing that occurred at the same pivot time as the primary swing.
Independent Swings compares each symbol’s own last two swings without requiring an exact time match.
🔸 Range Control and Noise Filtering
To reduce weak or irrelevant signals:
“Max Bars Between Swings” ensures the two swings being compared are close enough in structure to be meaningful.
“Min Price Diff (%)” can require a minimum percentage change between the primary’s last two swing prices to confirm the move is significant.
🔸 Clear Visual Output with Tooltips
When a divergence is detected, the script can print a label (“SMT”) with bullish or bearish styling and a tooltip that includes the symbol pair and the primary swing price for quick context.
🔸 Divergence Lines for Context
Optional lines connect the relevant swing points, making it easier to see the exact structure that triggered the signal. One line can be drawn on the main chart and another in the indicator pane for the comparison series.
🔸 Info Table (At a Glance)
A compact table can display the active symbols, correlation mode, total divergences stored, and the most recent signal type.
🔸 Alerts Included
Built-in alert conditions are provided for bullish SMT, bearish SMT, and any SMT event so you can automate notifications without editing the code.
🔸 Optional Comparison Candle Panel
If enabled, the indicator can plot the comparison symbol as candles in the indicator pane. This is useful for confirming whether the divergence is happening around major levels, consolidations, or impulsive legs on the secondary instrument.
🔹 Calculations
This section summarizes the core logic used by the script.
1. Data Synchronization (Comparison Symbol)
The comparison instrument is requested on the chart’s current timeframe so swing calculations are performed consistently:
=
request.security(compareSymbolInput, timeframe.period, )
This ensures pivots and swing times are derived from the same bar cadence as the primary chart.
2. Swing Detection via Confirmed Pivots
Swings are detected using pivot logic with user-defined left and right bars:
primaryPivotHigh = ta.pivothigh(high, pivotLeftBars, pivotRightBars)
primaryPivotLow = ta.pivotlow(low, pivotLeftBars, pivotRightBars)
Because pivots are confirmed only after the “right bars” have closed, the script stores each swing using an offset so the swing’s bar index and time reflect where the pivot actually occurred, not where it was confirmed.
3. Swing Storage and Retrieval
Both symbols maintain arrays of SwingPoint objects. Each new swing is pushed into the array, and older swings are dropped once the array exceeds the configured maximum. This makes the divergence engine predictable and prevents uncontrolled memory growth.
The script then retrieves the last and previous swing highs and lows (per symbol) to evaluate structure.
4. Matching Logic (Time Matched vs Independent)
When “Time Matched” is selected, the script searches the comparison swing array for a pivot that occurred at the exact same timestamp as the primary swing. When “Independent Swings” is selected, it simply uses the comparison symbol’s last two swings of the same type.
5. Bullish SMT Condition (LL vs HL)
A bullish SMT event is defined as:
Primary forms a lower low (last low < previous low)
Comparison forms a higher low (last low > previous low)
If inverse correlation is enabled, the comparison condition flips to maintain logical confirmation rules
The two primary swings must be within the configured bar distance window
Optional minimum percentage difference must be satisfied
A simple anti duplication rule prevents repeated triggers on the same structure
These checks are implemented directly in the bullish detection block.
6. Bearish SMT Condition (HH vs LH)
A bearish SMT event is defined as:
Primary forms a higher high (last high > previous high)
Comparison forms a lower high (last high < previous high)
Inverse correlation flips the comparison rule
Range checks, minimum difference filtering, and duplicate protection apply similarly
These checks are implemented in the bearish detection block.
7. Percentage Difference Filter
The optional “Min Price Diff (%)” filter measures the relative distance between the last two primary swing prices. This prevents very small structural changes from being treated as valid SMT signals.
priceDiffPerc = math.abs(lastSwing.price - prevSwing.price) / prevSwing.price * 100.0
The divergence condition is only allowed to trigger if this value exceeds the user defined threshold.
priceOk = priceDiffPerc >= minPriceDiff
This filter is especially useful on higher timeframes or during low volatility conditions, where micro structure noise can otherwise produce misleading signals.
8. Visualization and Output
When a divergence is confirmed, the script:
Stores the event in a divergence array (limited by “Max Divergences to Display”)
Draws a directional SMT label with a tooltip (optional)
Draws connecting lines using time based coordinates for clean alignment (optional)
It also updates an information table on the last bar only, and exposes alertconditions for automation workflows.

Trend Pulse Channel StrategyOverview
Trend Pulse Channel Strategy is a long-only trend-following breakout strategy built around an adaptive multi-pole smoothing filter and a volatility-adjusted price channel.
The strategy is designed to participate in sustained directional moves by entering only when price confirms momentum strength beyond a dynamic upper boundary, while avoiding mean-reversion and low-quality consolidation phases.
This script is published as a strategy and includes realistic backtesting assumptions for position sizing, commissions, and slippage.
Core Concept
At the heart of the strategy is a multi-pole adaptive EMA-based filter, inspired by advanced digital signal smoothing techniques.
Using multiple poles allows the filter to reduce noise while preserving responsiveness to genuine trend changes.
To adapt the channel width to changing market conditions, the strategy applies the same filtering logic to True Range, producing a volatility-aware envelope rather than a static or fixed-percentage band.
This combination allows the strategy to:
Track directional bias using a smoothed central filter
Adjust channel width dynamically based on market volatility
Trigger entries only when price expansion confirms trend strength
Entry Logic
A long position is opened when:
Price crosses above the upper channel band
The signal occurs within the user-defined date range
This condition represents a volatility-confirmed breakout aligned with the prevailing directional filter.
Exit Logic
The long position is closed when:
Price crosses back below the upper band
This exit logic aims to stay in trending moves while exiting when upside momentum weakens.
The strategy does not open short positions by design.
Inputs and Defaults
The default inputs are selected to balance smoothness, responsiveness, and stability:
Source (HLC3): Reduces single-price noise by averaging high, low, and close
Period (144): Defines the primary smoothing horizon of the adaptive filter
Poles (4): Controls the smoothness vs. responsiveness trade-off
Range Multiplier (1.414): Scales the volatility envelope using filtered True Range
Reduced Lag (optional): Applies lag compensation to improve responsiveness
Fast Response (optional): Blends multi-pole and single-pole filters for quicker reaction at the cost of smoothness
All inputs are fully configurable and can be adjusted to suit different instruments and timeframes.
Risk Management & Position Sizing
The strategy uses:
Position size: 10% of equity per trade
No pyramiding
Long positions only
This sizing approach is intended to reflect sustainable risk exposure rather than aggressive capital deployment. Users may further adjust position size based on their own risk tolerance.
Backtesting Assumptions
The strategy is tested using :
Initial capital: 10,000
Commission: 0.1%
Slippage: 1 tick
Order fill model: Standard OHLC
These settings are chosen to provide more realistic performance estimates compared to idealized backtests.
This strategy is best suited for :
Trend-oriented markets
Higher timeframes where breakouts are more reliable
Users seeking systematic trend participation rather than frequent scalping
In sideways or range-bound market conditions, price may cross the channel boundaries frequently.
This can result in a higher number of entry and exit signals that do not develop into sustained trends.
For this reason, the strategy should be used with an understanding of basic technical analysis concepts, including market structure, trend identification, and consolidation behavior.
It is intended as a decision-support tool, not a standalone trading system.
Users—whether beginners or experienced traders—should avoid relying solely on this strategy and are encouraged to combine it with broader market context and additional analysis methods.
Disclaimer
This script is provided for educational and analytical purposes only. It does not constitute financial advice. Past performance does not guarantee future results.

GME Warrant Tracker [theUltimator5]The GME Warrant Tracker was designed to be used for GME warrants tracking. The theory behind this indicator is that warrants are priced similarly to options and generally follow the same Greeks. With that assumption, we can break down the price of the warrants by using known Greeks to estimate either the theoretical price, or even estimate Implied Volatility (IV).
The base settings for this indicator plot the calculated IV, the theoretical price (there are multiple methods of calculation which I will discuss later) and the current warrant price.
You can toggle on or off all of these plots to display only what you want to track.
For example, you can simply track the difference between the theoretical price and the current price to see if warrants are trading at a premium or a discount vs what the indicator calculates it to be.
Calculating implied volatility is extremely difficult and must be approximated.
The theoretical warrant price produced by this indicator depends primarily on the volatility input (σ) used in the Black–Scholes pricing model.
This script supports five distinct methods for approximating σ, each extracting different information from the market.
1) Close-to-Close Historical Volatility
Close-to-Close computes the standard deviation of daily close-to-close returns and uses a lookback window scaled to time-to-expiry. As the expiration approaches, the lookback window tightens, giving a more responsive volatility approximation relative to time-to-expiry.
This option produces conservative approximations for volatility, and may lag actual volatility intraday.
2) Parkinson High-Low Volatility
Parkinson High-Low volatility uses daily high and low prices to calculate intraday trading range for a more responsive estimation to volatility. It ignores opening and close gaps, so overnight volatility is not accounted for.
This option produces higher theoretical volatility during choppy price action and can over estimate actual volatility.
3) Garman–Klass Volatility
Garman–Klass volatility is a way to estimate how much price is fluctuating by using the open, high, low, and close for each period. Because it draws on multiple intraperiod price points (not just the range or close-to-close moves), it typically produces a tighter, more informative volatility estimate than simpler approaches. It’s often most helpful when gaps occur and when the open and close carry meaningful information about the session’s trading.
4)Yang–Zhang Volatility
The Yang–Zhang volatility estimator is designed to account for both opening jumps and price drift. It estimates volatility by combining overnight (close-to-open) variance, intraday (open-to-close) variance, and a weighted Rogers–Satchell component using OHLC data, often yielding a more robust measure than simpler close-to-close style estimators.
5) Option price
By default, the indicator uses the call option strike dated closest to the warrant expiration date. Since the Greeks for both the warrants and the
options are assumed to be equivalent with a minor difference in theta (time-to-expiry), the theoretical price of the warrants closely matches the trade price of the call strike chosen.
There is a table that can be enabled (off by default because it is large and fills entire screen on mobile) which shows all the configuration settings and Greeks.
You can also manually adjust the "dilution" factor for the warrants, which shifts the number of active warrants and moves the count into the shares outstanding for the underlying (GME). The reason for this is that as warrants get exercised, the total quantity of warrants in circulation decreases and the the total quantity of shares outstanding increases.
Since this indicator was built around the single warrant, ticker NYSE: GME/W, it is only meant to be used with NYSE:GME. Any other ticker will not work properly with this indicator.

Candle Pattern Library [1CG]Candle Pattern Library
A comprehensive and easy-to-use Pine Script™ library for detecting single, two, and three-candle patterns. This library provides detailed pattern analysis including size classification, direction validation, and specific pattern identification.
Quick Start
1. Import the Library
import OneCleverGuy/CandlePatternLibrary/1 as CPL
2. Analyze Candles
Use the main analysis functions to detect patterns. You can analyze the current forming candle or confirmed historical candles.
// 1. Analyze candles (Current , Previous , and the one before )
// Note: We use full variable names for clarity.
CandleData candleNewest = CPL.analyzeCandle(open, high, low, close, 250, 50, 10, 50, 85)
CandleData candleMiddle = CPL.analyzeCandle(open , high , low , close , 250, 50, 10, 50, 85)
CandleData candleOldest = CPL.analyzeCandle(open , high , low , close , 250, 50, 10, 50, 85)
// 2. Analyze multi-candle patterns
// Pass candles in chronological order: Oldest -> Newest
var twoCandleData = CPL.analyzeTwoCandlePattern(candleMiddle, candleNewest, 10, 85)
var threeCandleData = CPL.analyzeThreeCandlePattern(candleOldest, candleMiddle, candleNewest)
Enums Reference
These are the Enum Types exported by the library. When checking results, use the pattern Alias.EnumType.Value (e.g., CPL.CandlePattern.Hammer).
CandlePattern
Enum Type for single-candle formations.
Usage: CPL.CandlePattern.
Values:
Unknown : No specific pattern detected.
RegularBullish : A standard bullish candle.
RegularBearish : A standard bearish candle.
BullishMarubozu : Bullish candle with little to no wicks.
BearishMarubozu : Bearish candle with little to no wicks.
Hammer : Small body at the top of the range (bullish reversal).
ShootingStar : Small body at the bottom of the range (bearish reversal).
SpinningTop : Small body centered in the range.
Doji : Open and close are effectively equal.
LongLeggedDoji : Doji with long upper and lower wicks.
CrossDoji : Doji with the body in the upper section.
DragonflyDoji : Doji where open/close are at the high.
InvertedCrossDoji : Doji with the body in the lower section.
GravestoneDoji : Doji where open/close are at the low.
FourPriceDoji : Open, High, Low, and Close are all equal.
TwoCandlePattern
Enum Type for two-candle formations.
Usage: CPL.TwoCandlePattern.
Values:
None : No two-candle pattern detected.
BullishEngulfingWeak : Bullish candle engulfs the previous body (close does not engulf range).
BullishEngulfingStrong : Bullish candle completely engulfs the previous body close outside range.
BearishEngulfingWeak : Bearish candle engulfs the previous body.
BearishEngulfingStrong : Bearish candle completely engulfs the previous body.
InsideBar : The second candle is completely contained within the first.
TweezerTop : Two candles with matching highs (bearish reversal).
TweezerBottom : Two candles with matching lows (bullish reversal).
BullishRailRoad : Two opposite Marubozus (Down -> Up).
BearishRailRoad : Two opposite Marubozus (Up -> Down).
ThreeCandlePattern
Enum Type for three-candle formations.
Usage: CPL.ThreeCandlePattern.
Values:
None : No three-candle pattern detected.
ThreeWhiteSoldiers : Three consecutive bullish candles.
ThreeBlackCrows : Three consecutive bearish candles.
ThreeWhiteSoldiersWithBullishFVG : Three White Soldiers containing a Bullish FVG.
ThreeWhiteSoldiersWithBearishFVG : Three White Soldiers containing a Bearish FVG.
ThreeBlackCrowsWithBullishFVG : Three Black Crows containing a Bullish FVG.
ThreeBlackCrowsWithBearishFVG : Three Black Crows containing a Bearish FVG.
MorningStar : Bearish -> Small/Doji -> Bullish (Bullish Reversal).
EveningStar : Bullish -> Small/Doji -> Bearish (Bearish Reversal).
BullishAbandonedBaby : Morning Star with gaps between all candles.
BearishAbandonedBaby : Evening Star with gaps between all candles.
EngulfingSandwich : Bearish -> Bullish (Engulfing) -> Bearish (Inside).
BullishFairValueGap : A gap between Candle 1 High and Candle 3 Low.
BearishFairValueGap : A gap between Candle 1 Low and Candle 3 High.
CandleSize
Enum Type for candle size classification.
Usage: CPL.CandleSize.
Values:
Short
Normal
Long
CandleDirection
Enum Type for candle direction classification.
Usage: CPL.CandleDirection.
Values:
Bearish
Neutral
Bullish
Function Reference
Analysis Functions
analyzeCandle(_open, _high, _low, _close, _avgSize, _sizeThresholdPct, _equivTolerance, _bodyTolerance, _positionThreshold)
analyzeCandle - Analyzes a single candle's OHLC data to determine its size, direction, and single-candle pattern.
Parameters:
_open (float) : (float) - Candle open price.
_high (float) : (float) - Candle high price.
_low (float) : (float) - Candle low price.
_close (float) : (float) - Candle close price.
_avgSize (float) : (float) - Baseline size (wick range) to compare against.
_sizeThresholdPct (float) : (float) - % difference from average to be considered Long/Short (e.g., 50.0).
_equivTolerance (float) : (float) - Absolute price diff for Close to equal Open (Doji checks).
_bodyTolerance (float) : (float) - Absolute price diff for "Small Body" checks.
_positionThreshold (int) : (int) - Int (0-100) determining valid wick ratios for Hammers/Shooting Stars (e.g., 85).
Returns: (CandleData) - CandleData object containing CandlePattern, CandleSize, CandleDirection.
analyzeTwoCandlePattern(_candle1, _candle2, _equivTolerance, _positionThreshold)
analyzeTwoCandlePattern - Analyzes two consecutive candles to find pairs like Engulfing, Tweezers, or Inside Bars.
Parameters:
_candle1 (CandleData) : (CandleData) - The first (older) candle data (previous).
_candle2 (CandleData) : (CandleData) - The second (newer) candle data (current).
_equivTolerance (float) : (float) - Price tolerance for matching highs/lows (Tweezers).
_positionThreshold (int) : (int) - Threshold for wick validations.
Returns: (TwoCandleData) - TwoCandleData object containing TwoCandlePattern.
analyzeThreeCandlePattern(_candle1, _candle2, _candle3)
analyzeThreeCandlePattern - Analyzes three consecutive candles to find complex patterns like Morning Stars, Abandoned Babies, or Three White Soldiers.
Parameters:
_candle1 (CandleData) : (CandleData) - The first (oldest) candle data.
_candle2 (CandleData) : (CandleData) - The second (middle) candle data.
_candle3 (CandleData) : (CandleData) - The third (newest) candle data.
Returns: (ThreeCandleData) - ThreeCandleData object containing ThreeCandlePattern.
Naming Utilities
getPatternName(_pattern)
getPatternName - Returns the string name of a candle pattern.
Parameters:
_pattern (CandlePattern) : (CandlePattern) - The candle pattern enum value.
Returns: (string) - Human-readable pattern name (e.g., "Hammer").
getTwoCandlePatternName(_pattern)
getTwoCandlePatternName - Returns the string name of a two-candle pattern.
Parameters:
_pattern (TwoCandlePattern) : (TwoCandlePattern) - The two-candle pattern enum value.
Returns: (string) - Human-readable pattern name (e.g., "Bullish Engulfing").
getThreeCandlePatternName(_pattern)
getThreeCandlePatternName - Returns the string name of a three-candle pattern.
Parameters:
_pattern (ThreeCandlePattern) : (ThreeCandlePattern) - The three-candle pattern enum value.
Returns: (string) - Human-readable pattern name (e.g., "Morning Star").
getSizeName(_size)
getSizeName - Returns the string name of a candle size.
Parameters:
_size (CandleSize) : (CandleSize) - The candle size enum value.
Returns: (string) - Human-readable size name ("Short", "Normal", or "Long").
getDirectionName(_direction)
getDirectionName - Returns the string name of a candle direction.
Parameters:
_direction (CandleDirection) : (CandleDirection) - The candle direction enum value.
Returns: (string) - Human-readable direction name ("Bullish", "Bearish", or "Neutral").
