Weekly OHLC Plus 3 Weekly TF EMAsPlots weekly OHLC (with option to turn on monthly Open and Close) and 3 Weekly resolution EMAs (customizable).
This indicator is a combination of a few I've created/updated here on TV.
First part plots Weekly OHLC with an option to plot monthly open and close.
This indicator also plots on your chart 3 EMAs (customizable) from the Weekly timeframe (resolution).
The default settings (all EMAs)
200 - Orange
50 - Purple
20 - Black
There is no smoothing so the EMA line will appear jagged.
스크립트에서 "OHLC"에 대해 찾기

OHLC HistoryOHLC History is a Pine Script v6 overlay that snapshots up to 32 historical OHLC-derived levels from a selectable higher (or different) timeframe and projects them onto the active chart. It uses request.security to fetch the chosen source (Close/High/Low/Open), rounds each value to the instrument’s minimum tick, and stores them in an array. A “Max Number Lookback” input limits how many of those levels are rendered. For each retained level the script draws a horizontal line extended both ways, coloring it dynamically based on whether the level is above (customizable “above” color) or below (customizable “below” color) the current price, and places compact labels (01–32) with optional price text offset by a user-defined label distance. Prior bar artifacts (lines and labels) are explicitly deleted each update to keep the chart clean, while small white plot markers ensure the levels appear in the price scale and data window for quick reference.

Candle Color By OHLC ComparisonThis indicator is designed to help you recognize the price movements within a candle/bar more quickly and easily. Typically, candle coloring is based on the opening and closing prices, but in this indicator, I followed the OHLC values in reverse order: starting with closing, low, high, and then opening. Each of these is compared with the value in the previous candle. I assigned the least importance to the opening, hence did not include it in the color determination. To make the colors memorable, I used a rainbow-like color scale; with purple representing the highest value and maroon the lowest. You can also change the colors if you wish. Additionally, if you want to set alarms, I assigned values to the candles; the highest being 16 and the lowest 1. A thicker barchart provides a better visual representation.
For instance, consider the monthly chart of the NASDAQ 100. After a prolonged positive trend, when our indicator shows a negative maroon bar (representing a low value) for the first time, it could signal a change in the trend direction. In this scenario, the appearance of the maroon bar serves as a crucial alert for investors to review their current positions or prepare for a potential downtrend. This indicator provides users with a significant advantage in identifying such critical turning points and assists them in quickly adapting to market dynamics.

luckynickva OHLC
This Script Shows The OHLC Of The Higher Timeframe Candles In The Background Great For Not Losing Sight Of The Bigger Picture On The Lower Timeframe
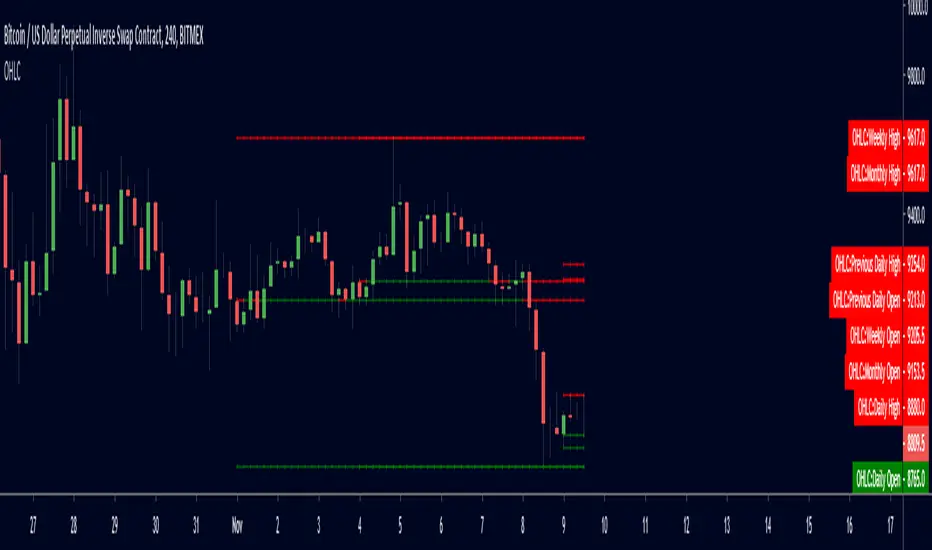
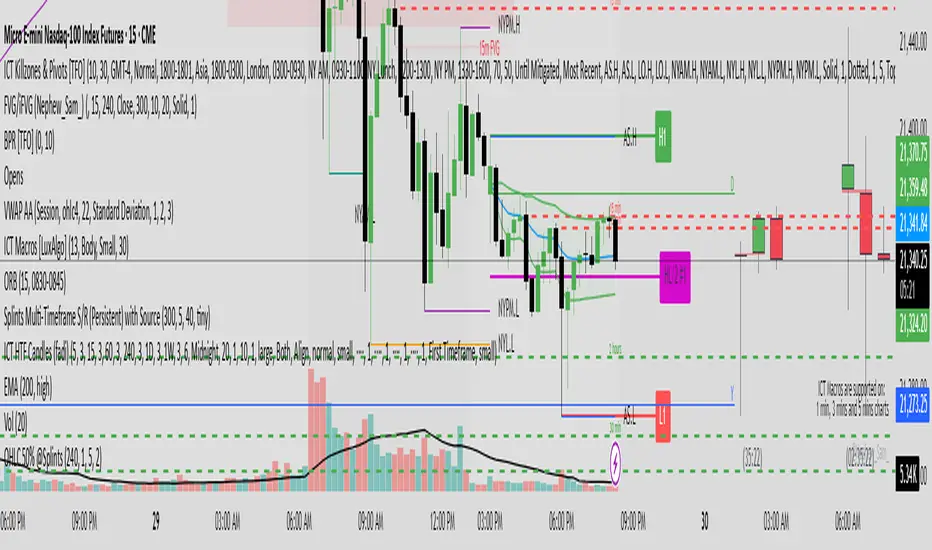
Previous OHLC (Nephew_Sam_)This indicator plots the OHLC of a previous HTF candle with an option to show the HTF candle too on the lower timeframe.
(uses latest pine script version 5)
Options:
1. Custom timeframe (requires a higher timeframe from current chart period)
2. Show or hide OC and/or LH lines of previous candle
3. Show or hide the candle at the beginning of the new period
Styles
1. You can style all lines and candle colors from this tab.

PivotBoss Pivots & Camarilla - H,D,W, M timeframe & OHLC LabelsThis is the new pivotboss pivots calculations and also has Camarilla Pivots . User can define which time frame pivots they want to see starting from Hourly, Daily, weekly and monthly. Added labels for each levels. So that user can calculate potential profit targets. This script also includes Hourly and Daily OHLC with labels. Added Developing mid point of the current day. The script can calculate midpoint as and when new highs and lows are made through out the day
Abbrevations used in this script
yHI - Yesterday's session High
dOP - Days open
yCL - yesterday's session Close
yLO - yesterday's session Low
MP -- Developing midpoint of the day
TC - Top channel
P - Pivot Point
BC - Bottom Channel
R1 - R4 -- Resistance levels
S1 - S4 -- Support Levels

Simple OHLCSimple OHLC containing daily, previous daily, weekly and monthly levels. Hides past levels to keep chart clean.
Colors levels red if current price is below level and green if current price is above level.
Previous OHLC LevelsQuick dirty code for personal use. Plots previous OHLC levels based on a selected time-frame on the chart.
Not bad if you want to see different time-frame levels.
Fill function can serve to highlight the daily range (high-low or open-close) on non-standard charts
Uses base code from JayRogers

Daily OHLC UpdatedThis plots the daily OHLC values as well as a few other options.
The base indicator plots and colors a daily open line. When line is green close is above open. When line is red close is below day open.
You can also turn on background highlighting.
Background will be green (default) If close is above day open
Background will be red (default) If close is below day open
There is also an option to turn on indicators on the bottom of your chart:
Arrow up will be green (default) If close is above day open
Arrow down will be red (default) If close is below day open
Next version will be adding alerts.

Weekly OHLC UpdatedWeekly OHLC first edit is to include a standard style.
From here we'll be adding a few moving averages and a few other things I find helpful in both in crypto and FOREX trading.


OHLCVRangeXThe OHLCVRange library provides modular range-building utilities for Pine Script v6 based on custom conditions like time, price, volatility, volume, and pattern detection. Each function updates a persistent range (OHLCVRange) passed in from the calling script, based on live streaming candles.
This library is designed to support dynamic windowing over incoming OHLCV bars, with all persistent state handled externally (in the indicator or strategy). The library merely acts as a filter and updater, appending or clearing candles according to custom logic.
📦
export type OHLCVRange
OHLCV.OHLCV candles // Sliding window of candles
The OHLCVRange is a simple container holding an array of OHLCV.OHLCV structures.
This structure should be declared in the indicator using var to ensure persistence across candles.
🧩 Range Updater Functions
Each function follows this pattern:
export updateXxxRange(OHLCVRange r, OHLCV.OHLCV current, ...)
r is the range to update.
current is the latest OHLCV candle (typically from your indicator).
Additional parameters control the behavior of the range filter.
🔁 Function List
1. Fixed Lookback Range
export updateFixedRange(OHLCVRange r, OHLCV.OHLCV current, int barsBack)
Keeps only the last barsBack candles.
Sliding window based purely on number of bars.
2. Session Time Range
export updateSessionRange(OHLCVRange r, OHLCV.OHLCV current, int minuteStart, int minuteEnd)
Keeps candles within the [minuteStart, minuteEnd) intraday session.
Clears the range once out of session bounds.
3. Price Zone Range
export updatePriceZoneRange(OHLCVRange r, OHLCV.OHLCV current, float minP, float maxP)
Retains candles within the vertical price zone .
Clears when a candle exits the zone.
4. Consolidation Range
export updateConsolidationRange(OHLCVRange r, OHLCV.OHLCV current, float thresh)
Stores candles as long as the candle range (high - low) is less than or equal to thresh.
Clears on volatility breakout.
5. Volume Spike Range
export updateVolumeSpikeRange(OHLCVRange r, OHLCV.OHLCV current, float avgVol, float mult, int surround)
Triggers a new range when a volume spike ≥ avgVol * mult occurs.
Adds candles around the spike (total surround * 2 + 1).
Can be used to zoom in around anomalies.
6. Engulfing Pattern Range
export updateEngulfingRange(OHLCVRange r, OHLCV.OHLCV current, int windowAround)
Detects bullish or bearish engulfing candles.
Stores 2 * windowAround + 1 candles centered around the pattern.
Clears if no valid engulfing pattern is found.
7. HTF-Aligned Range
export updateHTFAlignedRange(OHLCVRange r, OHLCV.OHLCV current, OHLCV.OHLCV prevHtf)
Used when aligning lower timeframe candles to higher timeframe bars.
Clears and restarts the range on HTF bar transition (compare prevHtf.bar_index with current).
Requires external management of HTF candle state.
💡 Usage Notes
All OHLCVRange instances should be declared as var in the indicator to preserve state:
var OHLCVRange sessionRange = OHLCVRange.new()
sessionRange := OHLCVRange.updateSessionRange(sessionRange, current, 540, 900)
All OHLCV data should come from the OHLCVData library (v15 or later):
import userId/OHLCVData/15 as OHLCV
OHLCV.OHLCV current = OHLCV.getCurrentChartOHLCV()
This library does not use var internally to enforce clean separation of logic and persistence.
📅 Planned Enhancements
Fib zone ranges: capture candles within custom Fibonacci levels.
Custom event ranges: combine multiple filters (e.g., pattern + volume spike).
Trend-based ranges: windowing based on moving average or trend breaks.

OHLC_yesterday_and_lastweekBy using this indicator, you can see these points.
1. Yesterday's OHLC + half price, today's limit price
2. Last week's OHLC + half price
3. 5 EMAs
Especially effective for foreign exchange, metals and indices.

ohlcLibrary "ohlc"
Library having OHLC and Indicator type and method implementations.
getOhlcArray(o, h, l, c, barindex, bartime, indicators)
get array of OHLC values when called on every bar
Parameters:
o (float) : Open price
h (float) : High Price
l (float) : Low Price
c (float) : Close Price
barindex (int) : bar_index of OHLC data
bartime (int) : time of OHLC cata
indicators (Indicator ) : array containing indicator
Returns: Array of OHLC objects
push(this, item, maxItems)
Push items to OHLC array with maxItems limit
Parameters:
this (OHLC )
item (OHLC) : OHLC Item to be pushed to the array
maxItems (int) : max Items the array can hold at a time
Returns: current object
push(this, item, maxItems)
Push items to Indicator array with maxItems limit
Parameters:
this (Indicator )
item (Indicator) : Indicator Item to be pushed to the array
maxItems (int) : max Items the array can hold at a time
Returns: current object
unshift(this, item, maxItems)
Unshift items to OHLC array with maxItems limit
Parameters:
this (OHLC )
item (OHLC) : OHLC Item to be unshifted to the array
maxItems (int) : max Items the array can hold at a time
Returns: current object
unshift(this, item, maxItems)
Unshift items to Indicator array with maxItems limit
Parameters:
this (Indicator )
item (Indicator) : Indicator Item to be unshifted to the array
maxItems (int) : max Items the array can hold at a time
Returns: current object
method getPoints(indicators)
get array of points based on array of indicator values
Namespace types: Indicator
Parameters:
indicators (Indicator ) : Array containing indicator objects
Returns: array of indicator points
method plot(indicator, xloc, line_color, line_style, line_width)
plots an array of Indicator using polyline
Namespace types: Indicator
Parameters:
indicator (Indicator ) : Array containing indicator objects
xloc (string) : can have values xloc.bar_index or xloc.bar_time. Used for drawing the line based on either bars or time.
line_color (color) : color in which the plots need to be printed on chart.
line_style (string) : line style line.style_solid, line.style_dotted, line.style_dashed, line.style_arrow_right, line.style_arrow_left, line.style_arrow_both
line_width (int) : width of the plot line
Returns: array of plot polyline
Indicator
Object containing Indicator name and value
Fields:
name (series string) : Indicator Name
value (chart.point) : Indicator Value as a chart point
OHLC
Object containing OHLC and indicator values
Fields:
o (series float) : Open price
h (series float) : High Price
l (series float) : Low Price
c (series float) : Close Price
barindex (series int) : bar_index of OHLC data
bartime (series int) : time of OHLC cata
indicators (Indicator ) : array containing indicator
OHLC - H.D.W.MThis indicatos plots Open and Close of the Curernt and Previous Day, Week or Month. It also shows the Highs and Lows of the Hourly, Daily, Weekly and Monthly Timeframes.

OHLC-RatioThis one is quite useful to quickly see candle length, full range compared to closing range and difference.

OHLC OLHC - Monthly, Weekly, Daily and HourlyThis indicator plots the previous day's (or any selected timeframe’s) Open, High, Low, and Close (OHLC) levels on the current chart. It helps traders analyze historical price levels to identify support and resistance zones.
Key Features:
Multi-Timeframe Support:
Users can select a timeframe (D, W, M, etc.) to fetch previous OHLC data.
The script requests OHLC values from the selected timeframe and overlays them on the current chart.
Customizable Display Options:
Users can choose to display only the last OHLC levels instead of all past session levels.
Users can extend the OHLC lines across the chart.
Background Highlighting:
The script fills the background only for the Previous Open and Previous Close levels, making them visually distinct.
Previous High and Low levels do not have background color.
This script is particularly useful for day traders and swing traders who rely on key price levels to make trading decisions. Let me know if you need further refinements!
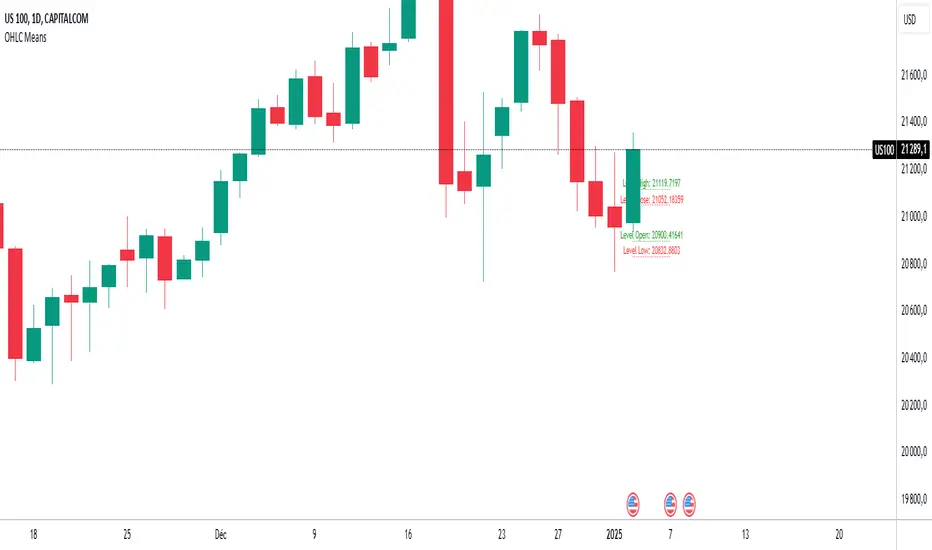
OHLC MeansNote: This indicator works only on daily timeframes.
The indicator calculates the OHLC averages for days corresponding to the day of the last displayed candlestick. For instance, if the last candlestick displayed is Monday, it calculates the OHLC average for all Mondays; if Tuesday, it does the same for all Tuesdays.
Customizable period: The indicator allows you to select the number of candlesticks to analyze, with a default value of 1000. This means it will consider the last 1000 candlesticks before the final displayed one. Assuming there are only five trading days per week, this corresponds to about 200 days. (not true for cryptos, you need to devide by 7)
Example scenario:
Today is Tuesday and we analyse NQ
By default, the indicator analyzes the last 1000 candlesticks (modifiable parameter).
Since there are five trading days in a week,
1000 ÷ 5 = 200
The indicator calculates the OHLC averages for the last 200 Tuesdays, corresponding to the past seven years. Of course it is not exactly 200 becauses the may be one tuesday where the market is closed (if christmas is on tuesday for instance)
Output:
Displays four daily averages as four lines with their levels as labels :
High and Low averages are displayed at the extremes.
Open and Close averages are displayed at the center.
Color coding:
Red indicates bearish movement.
Green indicates bullish movement.
Usage recommendations:
Best suited for assets with a significant historical dataset.
Only functional on daily timeframes.
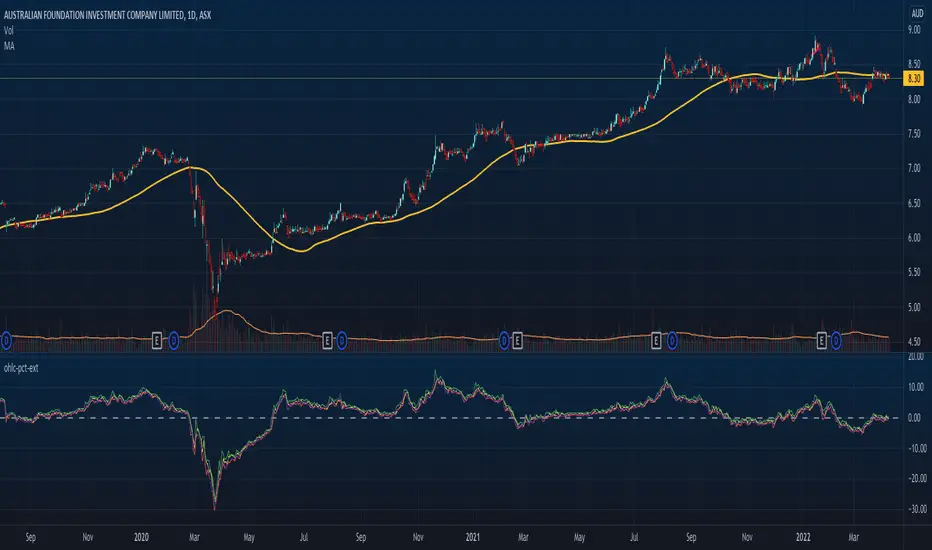
OHLC Percent ExtensionThis indicator visually shows OHLC moves in terms of percentages compared to an input reference series, e.g. this could be a moving average line, and then plotting how far OHLC values are from that reference at each time unit/bar.
A centre/zero-line is shown to indicate little to no extension when prices are hovering about there. This could a profit taking point, or an entry point, depending on the system at play.
You may also only be interested in Highs and Lows extension, for example, in which case simply hide the other lines from the indicator settings.
It may factor into trading systems considering both mean reversions, or trend breakouts/breakdowns.
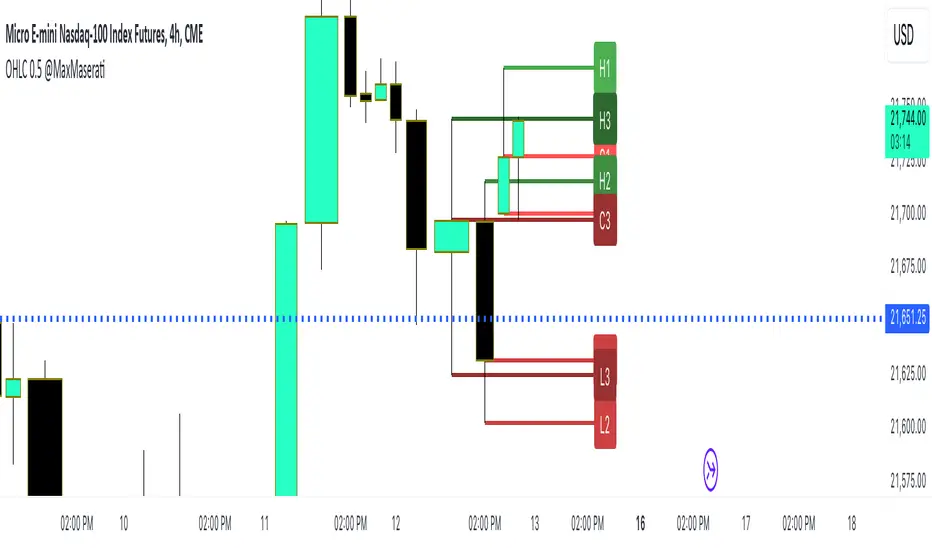
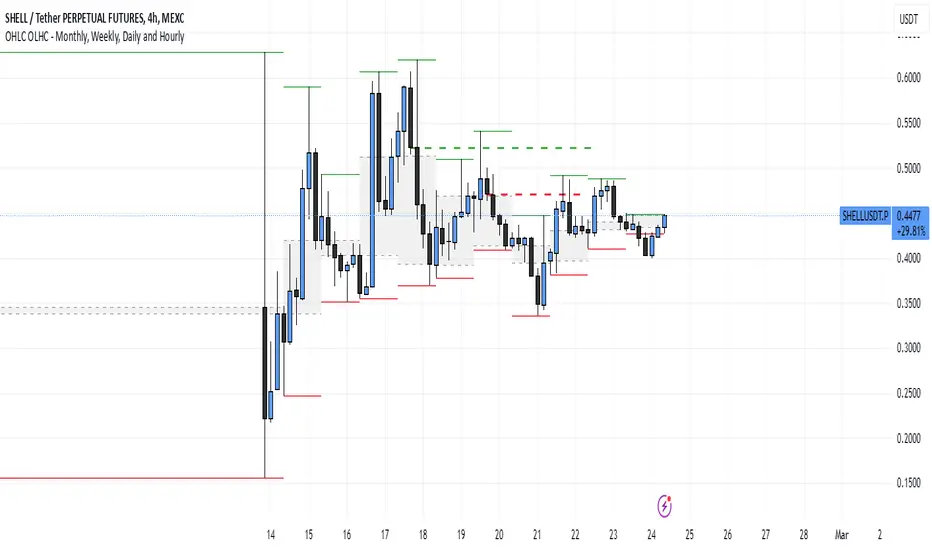
OHLC 0.5 @SplintsThis indicator provides a dynamic visualization of OHLC levels, allowing traders to analyze price action across multiple candles with enhanced clarity. It features customizable options for timeframe selection, candle count, and mid-level calculations (High/Low 50% and Open/Close 50%). The script utilizes gradient-based coloring for a clear distinction between levels and supports dynamic extension for better visibility.
Key Features:
Displays Open, High, Low, and Close levels with adjustable extension lengths
Supports mid-level calculations for enhanced trade decision-making
Gradient coloring for improved visual clarity across multiple candles
Configurable labels for quick reference to key price points
Efficient object management using arrays for optimized performance
Perfect for traders seeking structured insights into candle dynamics and session-based analysis.
OHLC BreakThis indicator shows the Support and Resistance zones in a different way with Boxes that extend to the right and show the candle that has broken a minimum number of High or Low
The user has the possibility to:
- Choose to show High or Low levels not yet broken
- Shows candles that have broken a total of high or Low that you pre-set
- Choose to show a Box on candles that have broken the minimum of the preset levels
- Choose to show the total of broken levels with a Label on the candle
The indicator should be used as OHLC shows in its concepts, it can also be implemented to your Support and Resistance strategies, it can be implemented to Sessions strategies as in the Example
Below I show various examples on how to set the indicator for show High or Low levels not yet broken
If something is not clear, comment below and I will reply as soon as possible.

OHLC Lines + 50% of the previous candleThis indicator automatically put a straight line on the High, Low, Close, and Open and calculates the Consequent Encroachment or the midline (50%) of the previous candle. The calculation for the midline can be based on either the High and Low or the Open and Close. The option to disable OHLC labels is available. The indicator displays the premium and discount areas of the previous candle, allowing for a strategy of buying on discount and selling on premium based on each candle stick.