Dskyz Options Flow Flux (OFF) - FuturesDskyz Options Flow Flux (OFF) - Futures
*This is a repost due to moderator intervention on use of ™ in my scripts. I'm in the process of getting this rectified. This was originally posted around mid-night CDT.
🧠 The Dskyz Options Flow Flux (OFF) - Futures indicator is a game changer for futures traders looking to tap into institutional activity with limited resources. Designed for TradingView this tool simulates options flow data (call/put volume and open interest) for futures contracts like MNQ MES NQ and ES giving u actionable insights through volume spike detection volatility adjustments and stunning visuals like aurora flux bands and round number levels. Whether u’re a beginner learning the ropes or a pro hunting for an edge this indicator delivers real time market sentiment and key price levels to boost ur trading game
Key Features
⚡ Simulated Options Flow: Breaks down call/put volume and open interest using market momentum and volatility
📈 Spike Detection: Spots big moves in volume and open interest with customizable thresholds
🧠 Volatility Filter: Adapts to market conditions using ATR for smarter spike detection
✨ Aurora Flux Bands: Glows with market sentiment showing u bullish or bearish vibes at a glance
🎯 Round Number Levels: Marks key psychological levels where big players might step in
📊 Interactive Dashboard: Real time metrics like sentiment score and volatility factor right on ur chart
🚨 Alerts: Get notified of bullish or bearish spikes so u never miss a move
How It Works
🧠 This indicator is built to make complex options flow analysis simple even with the constraints of Pine Script. Here’s the step by step:
Simulated Volume Data (Dynamic Split):
Pulls daily volume for ur chosen futures contract (MNQ1! MES1! NQ1! ES1!)
Splits it into call and put volume based on momentum (ta.mom) and volatility (ATR vs its 20 period average)
Estimates open interest (OI) for calls and puts (1.15x for calls 1.1x for puts)
Formula: callRatio = 0.5 + (momentum / close) * 10 + (volatility - 1) * 0.1 capped between 0.3 and 0.7
Why It Matters: Mimics how big players might split their trades giving u a peek into institutional sentiment
Spike Detection:
Compares current volume/OI to short term (lookbackShort) and long term (lookbackLong) averages
Flags spikes when volume/OI exceeds the average by ur set threshold (spikeThreshold for regular highConfidenceThreshold for strong)
Adjusts for volatility so u’re not fooled by choppy markets
Output: optionsSignal (2 for strong bullish -2 for strong bearish 1 for bullish -1 for bearish 0 for neutral)
Why It Matters: Pinpoints where big money might be stepping in
Volatility Filter:
Uses ATR (10 periods) and its 20 period average to calculate a volatility factor (volFactor = ATR / avgAtr)
Scales spike thresholds based on market conditions (volAdjustedThreshold = spikeThreshold * max(1 volFactor * volFilter))
Why It Matters: Keeps ur signals reliable whether the market is calm or wild
Sentiment Score:
Calculates a call/put ratio (callVolume / putVolume) and adjusts for volatility
Converts it to a 0 to 100 score (higher = bullish lower = bearish)
Formula: sentimentScore = min(max((volAdjustedSentiment - 1) * 50 0) 100)
Why It Matters: Gives u a quick read on market bias
Round Number Detection:
Finds the nearest round number (e.g. 100 for MNQ1! 50 for MES1!)
Checks for volume spikes (volume > 3 period SMA * spikeThreshold) and if price is close (within ATR * atrMultiplier)
Updates the top activity level every 15 minutes when significant activity is detected
Why It Matters: Highlights psychological levels where price often reacts
Visuals and Dashboard:
Combines aurora flux bands glow effects round number lines and a dashboard to make insights pop (see Visual Elements below)
Plots triangles for call/put spikes (green/red for strong lime/orange for regular)
Sets up alerts for key market moves
Why It Matters: Makes complex data easy to read at a glance
Inputs and Customization
⚙️ Beginners can tweak these settings to match their trading style while pros can dig deeper for precision:
Futures Symbol (symbol): Pick ur contract (MNQ1! MES1! NQ1! ES1!). Default: MNQ1!
Short Lookback (lookbackShort): Days for short term averages. Smaller = more sensitive. Range: 1+. Default: 5
Long Lookback (lookbackLong): Days for long term averages. Range: 5+. Default: 10
Spike Threshold (spikeThreshold): How big a spike needs to be (e.g. 1.1 = 10% above average). Range: 1.0+. Default: 1.1
High Confidence Threshold (highConfidenceThreshold): For strong spikes (e.g. 3.0 = 3x average). Range: 2.0+. Default: 3.0
Volatility Filter (volFilter): Adjusts for market volatility (e.g. 1.2 = 20% stricter in volatile markets). Range: 1.0+. Default: 1.2
Aurora Flux Transparency (glowOpacity): Controls band transparency (0 = solid 100 = invisible). Range: 0 to 100. Default: 65
Show Show OFF Dashboard (showDashboard): Toggles the dashboard with key metrics. Default: true
Show Nearest Round Number (showRoundNumbers): Displays round number levels. Default: true
ATR Multiplier for Proximity (atrMultiplier): How close price needs to be to a round number (e.g. 1.5 = within 1.5x ATR). Range: 0.5+. Default: 1.5
Functions and Logic
🧠 Here’s the techy stuff pros will love:
Simulated Volume Data : Splits daily volume into call/put volume and OI using momentum and volatility
Volatility Filter: Scales thresholds with volFactor = atr / avgAtr for adaptive detection
Spike Detection: Flags spikes and assigns optionsSignal (2, -2, 1, -1, 0) for sentiment
Sentiment Score: Converts call/put ratio into a 0-100 score for quick bias reads
Round Number Detection: Identifies key levels and significant activity for trading zones
Dashboard Display: Updates real time metrics like sentiment score and volatility factor
Visual Elements
✨ These visuals make data come alive:
Gradient Background: Green (bullish) red (bearish) or yellow (neutral/choppy) at 95% transparency to show trend
Aurora Flux Bands: Stepped bands (linewidth 3) around a 14 period EMA ± ATR * 1.8. Colors shift with sentiment (green red lime orange gray) with glow effects at 85% transparency
Round Number Visualization: Stepped lines (linewidth 2) at key levels (solid if active dashed if not) with labels (black background white text size.normal)
Visual Signals: Triangles above/below bars for spikes (size.small for strong size.tiny for regular)
Dashboard: Bottom left table (2 columns 10 rows) with a black background (29% transparency) gray border and metrics:
⚡ Round Number Activity: “Detected” or “None”
📈 Trend: “Bullish” “Bearish” or “Neutral” (colored green/red/gray)
🧠 ATR: Current 10 period ATR
📊 ATR Avg: 20 period SMA of ATR
📉 Volume Spike: “YES” (green) or “NO” (red)
📋 Call/Put Ratio: Current ratio
✨ Flux Signal: “Strong Bullish” “Strong Bearish” “Bullish” “Bearish” or “Neutral” (colored green/red/gray)
⚙️ Volatility Factor: Current volFactor
📈 Sentiment Score: 0-100 score
Usage and Strategy Recommendations
🎯 For Beginners: Use high confidence spikes (green/red triangles) for easy entries. Check the dashboard for a quick market read (sentiment score above 60 = bullish below 40 = bearish). Watch round number levels for support/resistance
💡 For Pros: Combine flux signals with round number activity for high probability setups. Adjust lookbackShort/lookbackLong for trending vs choppy markets. Use volFactor for position sizing (higher = smaller positions)
스크립트에서 "NQ"에 대해 찾기

Dskyz (DAFE) AI Adaptive Regime - Beginners VersionDskyz (DAFE) AI Adaptive Regime - Pro: Revolutionizing Trading for All
Introduction
In the fast-paced world of financial markets, traders need tools that can keep up with ever-changing conditions while remaining accessible. The Dskyz (DAFE) AI Adaptive Regime - Pro is a groundbreaking TradingView strategy that delivers advanced, AI-driven trading capabilities to everyday traders. Available on TradingView (TradingView Scripts), this Pine Script strategy combines sophisticated market analysis with user-friendly features, making it a standout choice for both novice and experienced traders.
Core Functionality
The strategy is built to adapt to different market regimes—trending, ranging, volatile, or quiet—using a robust set of technical indicators, including:
Moving Averages (MA): Fast and slow EMAs to detect trend direction.
Average True Range (ATR): For dynamic stop-loss and volatility assessment.
Relative Strength Index (RSI) and MACD: Multi-timeframe confirmation of momentum and trend.
Average Directional Index (ADX): To identify trending markets.
Bollinger Bands: For assessing volatility and range conditions.
Candlestick Patterns: Recognizes patterns like bullish engulfing, hammer, and double bottoms, confirmed by volume spikes.
It generates buy and sell signals based on a scoring system that weighs these indicators, ensuring trades align with the current market environment. The strategy also includes dynamic risk management with ATR-based stops and trailing stops, as well as performance tracking to optimize future trades.
What Sets It Apart
The Dskyz (DAFE) AI Adaptive Regime - Pro distinguishes itself from other TradingView strategies through several unique features, which we compare to common alternatives below:
| Feature | Dskyz (DAFE) | Typical TradingView Strategies|
|---------|-------------|------------------------------------------------------------|
| Regime Detection | Automatically identifies and adapts to **four** market regimes | Often static or limited to trend/range detection |
| Multi‑Timeframe Analysis | Uses higher‑timeframe RSI/MACD for confirmation | Rarely incorporates multi‑timeframe data |
| Pattern Recognition | Detects candlestick patterns **with volume confirmation** | Limited or no pattern recognition |
| Dynamic Risk Management | ATR‑based stops and trailing stops | Often uses fixed stops or basic risk rules |
| Performance Tracking | Adjusts thresholds based on past performance | Typically static parameters |
| Beginner‑Friendly Presets | Aggressive, Conservative, Optimized profiles | Requires manual parameter tuning |
| Visual Cues | Color‑coded backgrounds for regimes | Basic or no visual aids |
The Dskyz strategy’s ability to integrate regime detection, multi-timeframe analysis, and user-friendly presets makes it uniquely versatile and accessible, addressing the needs of everyday traders who want professional-grade tools without the complexity.
-Key Features and Benefits
[Why It’s Ideal for Everyday Traders
⚡The Dskyz (DAFE) AI Adaptive Regime - Pro democratizes advanced trading by offering professional-grade tools in an accessible package. Unlike many TradingView strategies that require deep technical knowledge or fail in changing market conditions, this strategy simplifies complex analysis while maintaining robustness. Its presets and visual aids make it easy for beginners to start, while its adaptive features and performance tracking appeal to advanced traders seeking an edge.
🔄Limitations and Considerations
Market Dependency: Performance varies by market and timeframe. Backtesting is essential to ensure compatibility with your trading style.
Learning Curve: While presets simplify use, understanding regimes and indicators enhances effectiveness.
No Guaranteed Profits: Like all strategies, success depends on market conditions and proper execution. The Reddit discussion highlights skepticism about TradingView strategies’ universal success (Reddit Discussion).
Instrument Specificity: Optimized for futures (e.g., ES, NQ) due to fixed tick values. Test on other instruments like stocks or forex to verify compatibility.
📌Conclusion
The Dskyz (DAFE) AI Adaptive Regime - Pro is a revolutionary TradingView strategy that empowers everyday traders with advanced, AI-driven tools. Its ability to adapt to market regimes, confirm signals across timeframes, and manage risk dynamically. sets it apart from typical strategies. By offering beginner-friendly presets and visual cues, it makes sophisticated trading accessible without sacrificing power. Whether you’re a novice looking to trade smarter or a pro seeking a competitive edge, this strategy is your ticket to mastering the markets. Add it to your chart, backtest it, and join the elite traders leveraging AI to dominate. Trade like a boss today! 🚀
Use it with discipline. Use it with clarity. Trade smarter.
**I will continue to release incredible strategies and indicators until I turn this into a brand or until someone offers me a contract.
-Dskyz

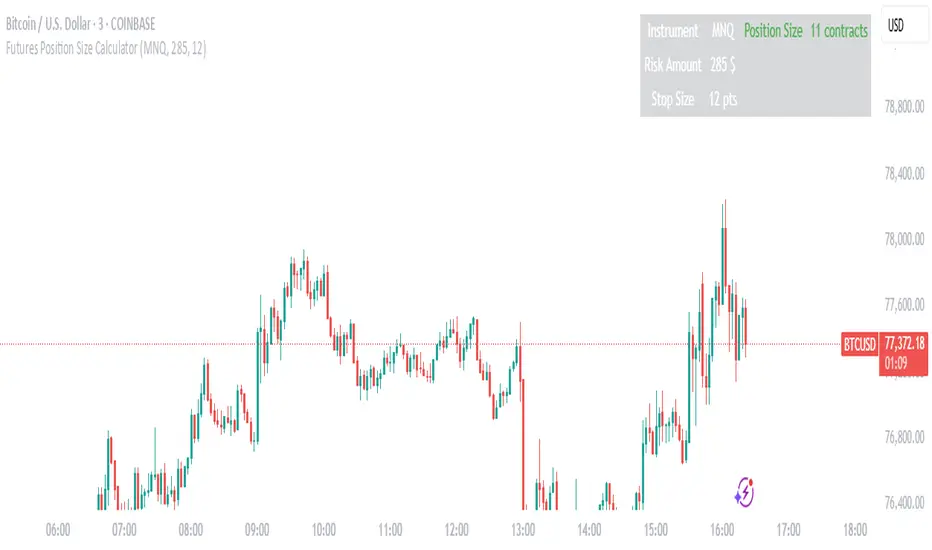
Futures Position Size CalculatorFutures Position Size Calculator by vmkhats
Streamline your futures trading risk management with this intuitive Pine Script utility designed for TradingView. Created by vmkhats, this tool automates position sizing calculations for popular futures contracts, ensuring precise risk control while eliminating manual errors.
Key Features:
Supports 15+ Instruments: Trade confidently with preconfigured settings for indices (ES, NQ, RTY), commodities (CL, GC), currencies (6E), and micro contracts (MES, MNQ, MCL).
Customizable Inputs: Set your risk amount (e.g., $1,000) and stop-loss size in points, tailored to your strategy.
Automatic Calculations: The script computes stop-loss size in ticks, risk per contract, and optimal position size using floor rounding to prevent over-leveraging.
Clear Visual Output: A table displays results (instrument, risk, stop size, contracts) with color-coded alerts for invalid configurations (e.g., zero position size).
Ideal for both novice and seasoned traders, this utility enforces disciplined risk management while saving time. Enhance your TradingView workspace with this essential tool and trade futures with confidence.
Created by vmkhats — ensuring traders stay precise, proactive, and risk-aware.
Keltner Channel StrategyOverview
The Keltner Channel Strategy is a powerful trend-following and mean-reversion system that leverages the Keltner Channels, EMA crossovers, and ATR-based stop-losses to optimize trade entries and exits. This strategy has proven to be highly effective, particularly when applied to Gold (XAUUSD) and other commodities with strong trend characteristics.
📈 How It Works
This strategy incorporates two trading approaches: 1️⃣ Keltner Channel Reversal Trades – Identifies overbought and oversold conditions when price touches the outer bands.
2️⃣ Trend Following Trades – Uses the 9 EMA & 21 EMA crossover, with confirmation from the 50 EMA, to enter trades in the direction of the trend.
🔍 Entry & Exit Criteria
📊 Keltner Channel Entries (Reversal Strategy)
✅ Long Entry: When the price crosses below the lower Keltner Band (potential reversal).
✅ Short Entry: When the price crosses above the upper Keltner Band (potential reversal).
⏳ Exit Conditions:
Long positions close when price crosses back above the mid-band (EMA-based).
Short positions close when price crosses back below the mid-band (EMA-based).
📈 Trend Following Entries (Momentum Strategy)
✅ Long Entry: When the 9 EMA crosses above the 21 EMA, and price is above the 50 EMA (bullish momentum).
✅ Short Entry: When the 9 EMA crosses below the 21 EMA, and price is below the 50 EMA (bearish momentum).
⏳ Exit Conditions:
Long positions close when the 9 EMA crosses back below the 21 EMA.
Short positions close when the 9 EMA crosses back above the 21 EMA.
📌 Risk Management & Profit Targeting
ATR-based Stop-Losses:
Long trades: Stop set at 1.5x ATR below entry price.
Short trades: Stop set at 1.5x ATR above entry price.
Take-Profit Levels:
Long trades: Profit target 2x ATR above entry price.
Short trades: Profit target 2x ATR below entry price.
🚀 Why Use This Strategy?
✅ Works exceptionally well on Gold (XAUUSD) due to high volatility.
✅ Combines reversal & trend strategies for improved adaptability.
✅ Uses ATR-based risk management for dynamic position sizing.
✅ Fully automated alerts for trade entries and exits.
🔔 Alerts
This script includes automated TradingView alerts for:
🔹 Keltner Band touches (Reversal signals).
🔹 EMA crossovers (Momentum trades).
🔹 Stop-loss & Take-profit activations.
📊 Ideal Markets & Timeframes
Best for: Gold (XAUUSD), NASDAQ (NQ), Crude Oil (CL), and trending assets.
Recommended Timeframes: 15m, 1H, 4H, Daily.
⚡️ How to Use
1️⃣ Add this script to your TradingView chart.
2️⃣ Select a 15m, 1H, or 4H timeframe for optimal results.
3️⃣ Enable alerts to receive trade notifications in real time.
4️⃣ Backtest and tweak ATR settings to fit your trading style.
🚀 Optimize your Gold trading with this Keltner Channel Strategy! Let me know how it performs for you. 💰📊

HTF Anchored FanSimilar to an Anchored VWAP, this lets you click a bar on an Daily, Weekly, or Monthly chart to add an "Anchored Fan" which displays lines at up to 6 levels above and below the chosen Anchor Point. Useful to measure the retracement during swing moves.
You can reposition the fan by either hovering over the anchor or by clicking the name of the study to "activate" it, and then dragging. You can also change the Anchor Point in Settings.
By default the anchor uses the bar Close, but you can change this manually in settings OR you can use the fancy "Auto high/low" mode which is handy if you are mainly dropping the fan on local swing highs and lows.
The default line measures were chosen for ES (Futures) but the study should be usable with nearly anything as long as you adjust the settings to something appropriate for the ticker. If you want to use this on NQ, for example, it would be reasonable to multiple each of these settings by 3.5 or so.
NOTE: If the fan is way off the left side of the chart it's generally easiest to use Settings to move it back to close to "now".

Intraday Anchored FanSimilar to an Anchored VWAP, this lets you click a bar on an Intraday chart to add an "Anchored Fan" which displays lines at up to 6 levels above and below the chosen Anchor Point. Useful to measure the retracement during swing moves.
You can reposition the fan by either hovering over the anchor or by clicking the name of the study to "activate" it, and then dragging. You can also change the Anchor Point in Settings.
By default the anchor uses the bar Close, but you can change this manually in settings OR you can use the fancy "Auto high/low" mode which is handy if you are mainly dropping the fan on local swing highs and lows.
The default line measures were chosen for ES (Futures) but the study should be usable with nearly anything as long as you adjust the settings to something appropriate for the ticker. If you want to use this on NQ, for example, it would be reasonable to multiple each of these settings by 3.5 or so.
NOTE: If the fan is off the left side of the chart, one way to see the Anchor handle again easily is to switch to a higher timeframe; for example if you are on the 5min maybe use the 15min or hourly to find the handle -- if it is WAY off the left side (for example if you let many days pass without advancing it) it's generally easiest to use Settings to move it back to "now".

ORB Sessions w/ MidlineORB Sessions with Midline – Customizable Opening Range Breakout Indicator
📌 Overview:
This indicator allows traders to visualize Opening Range Breakout (ORB) sessions with customizable high, low, and midline levels. It supports both predefined ORB sessions and user-defined custom sessions. The ORB levels update in real-time and are automatically hidden on higher timeframes.
🔹 Features:
✅ Predefined ORB Sessions – Toggle commonly used ORB periods to match your strategy.
✅ Custom ORB Sessions – Define up to three additional ORB sessions with custom start and end times.
✅ Live ORB Updates – ORB high, low, and midline update dynamically as bars close within the session.
✅ Customizable Colors & Labels – Set unique colors for high, midline, and low levels, and enable/disable price labels.
✅ Smart Timeframe Filtering – ORB lines automatically hide on higher timeframes when they exceed the ORB duration.
✅ Futures Market Adjustments – Automatically shifts ORB session times for NQ, ES, YM, RTY, and M2K to align with market hours.
🛠️ How to Use:
1️⃣ Enable ORB Sessions – Select which predefined sessions you want to track.
2️⃣ Customize Your Own ORBs – Define up to three custom ORB sessions with specific start and end times.
3️⃣ Adjust Visualization – Modify ORB colors and labels for better chart clarity.
4️⃣ Trade ORB Breakouts – Use these key levels to identify potential breakouts, reversals, and trend continuation setups.

ALN Sessions - for NQ2/24/25 - v1
This script does not calculate any stats.
It uses the sessions and stats from NQStats/ALNSessions
Option to draw boxes around the session times.
Options to adjust the table text/background colors/position.
The logic will determine how the Asia and London sessions interact.
Once the New York session starts (8am), it will then display the appropriate stats.
Script quirk...fyi. The script removes the stats table at 6PM.
That's just how it works. I used grok to assist with the code, and it got funky. It works, so I left it that way.
The appropriate stats table will then be displayed when the next New York session begins.
---
There is another table I used just for troubleshooting to show the values of the Asia/London session highs/lows. This can just be ignored.
3/3/25 - republished.

Casa_SessionsLibrary "Casa_Sessions"
Advanced trading session management library that enhances TradingView's default functionality:
Key Features:
- Accurate session detection for futures markets
- Custom session hour definitions
- Drop-in replacements for standard TradingView session functions
- Flexible session map customization
- Full control over trading windows and market hours
Perfect for traders who need precise session timing, especially when working
with futures markets or custom trading schedules.
SetSessionTimes(session_type_input, custom_session_times_input, syminfo_type, syminfo_root, syminfo_timezone)
Parameters:
session_type_input (simple string) : Input string for session selection:
- 'Custom': User-defined session times
- 'FX-Tokyo': Tokyo forex session
- 'FX-London': London forex session
- 'FX-New York': NY forex session
- 'Overnight Session (ON)': After-hours trading
- 'Day Session (RTH)': Regular trading hours
custom_session_times_input (simple string) : Session parameter for custom time windows
Only used when session_type_input is 'Custom'
syminfo_type (simple string)
syminfo_root (simple string)
syminfo_timezone (simple string)
Returns:
session_times: Trading hours for selected session
session_timezone: Market timezone (relevant for forex)
getSessionMap()
Get futures trading session hours map
Keys are formatted as 'symbol:session', examples:
- 'ES:market' - Regular trading hours (RTH)
- 'ES:overnight' - Extended trading hours (ETH)
- 'NQ:market' - NASDAQ futures RTH
- 'CL:overnight' - Crude Oil futures ETH
Returns: Map
Key: Symbol:session identifier
Value: Session hours in format "HH:MM-HH:MM"
getSessionString(session, symbol, sessionMap)
Returns a session string representing the session hours (and days) for the requested symbol (or the chart's symbol if the symbol value is not provided). If the session string is not found in the collection, it will return a blank string.
Parameters:
session (string) : A string representing the session hour being requested. One of: market (regular trading hours), overnight (extended/electronic trading hours), postmarket (after-hours), premarket
symbol (string) : The symbol to check. Optional. Defaults to chart symbol.
sessionMap (map) : The map of futures session hours. Optional. Uses default if not provided.
inSession(session, sessionMap, barsBack)
Returns true if the current symbol is currently in the session parameters defined by sessionString.
Parameters:
session (string) : A string representing the session hour being requested. One of: market (regular trading hours), overnight (extended/electronic trading hours), postmarket (after-hours), premarket
sessionMap (map) : The map of futures session hours. Optional. Uses default if not provided.
barsBack (int) : Private. Only used by futures to check islastbar. Optional. The default is 0.
ismarket(sessionMap)
Returns true if the current bar is a part of the regular trading hours (i.e. market hours), false otherwise. Works for futures (TradingView's methods do not).
Parameters:
sessionMap (map) : The map of futures session hours. Optional. Uses default if not provided.
Returns: bool
isfirstbar()
Returns true if the current bar is the first bar of the day's session, false otherwise. If extended session information is used, only returns true on the first bar of the pre-market bars. Works for futures (TradingView's methods do not).
Returns: bool
islastbar()
Returns true if the current bar is the last bar of the day's session, false otherwise. If extended session information is used, only returns true on the last bar of the post-market bars. Works for futures (TradingView's methods do not).
Returns: bool
ispremarket(sessionMap)
Returns true if the current bar is a part of the pre-market, false otherwise. On non-intraday charts always returns false. Works for futures (TradingView's methods do not).
Parameters:
sessionMap (map) : The map of futures session hours. Optional. Uses default if not provided.
Returns: bool
ispostmarket(sessionMap)
Returns true if the current bar is a part of the post-market, false otherwise. On non-intraday charts always returns false. Works for futures (TradingView's methods do not).
Parameters:
sessionMap (map) : The map of futures session hours. Optional. Uses default if not provided.
Returns: bool
isfirstbar_regular(sessionMap)
Returns true on the first regular session bar of the day, false otherwise. The result is the same whether extended session information is used or not. Works for futures (TradingView's methods do not).
Parameters:
sessionMap (map) : The map of futures session hours. Optional. Uses default if not provided.
Returns: bool
islastbar_regular(sessionMap)
Returns true on the last regular session bar of the day, false otherwise. The result is the same whether extended session information is used or not. Works for futures (TradingView's methods do not).
Parameters:
sessionMap (map) : The map of futures session hours. Optional. Uses default if not provided.
Returns: bool
isovernight(sessionMap)
Returns true if the current bar is a part of the pre-market or post-market, false otherwise. On non-intraday charts always returns false.
Parameters:
sessionMap (map) : The map of futures session hours. Optional. Uses default if not provided.
Returns: bool
getSessionHighAndLow(session, sessionMap)
Returns a tuple containing the high and low print during the specified session.
Parameters:
session (string) : The session for which to get the high & low prints. Defaults to market.
sessionMap (map) : The map of futures session hours. Optional. Uses default if not provided.
Returns: A tuple containing
getSessionHigh(session, sessionMap)
Convenience function to return the session high. Necessary if you want to call this function from within a request.security expression where you can't return a tuple.
Parameters:
session (string) : The session for which to get the high & low prints. Defaults to market.
sessionMap (map) : The map of futures session hours. Optional. Uses default if not provided.
Returns: The high of the session
getSessionLow(session, sessionMap)
Convenience function to return the session low. Necessary if you want to call this function from within a request.security expression where you can't return a tuple.
Parameters:
session (string) : The session for which to get the high & low prints. Defaults to market.
sessionMap (map) : The map of futures session hours. Optional. Uses default if not provided.
Returns: The low of the session

Static price-range projection by symbolThis indicator shows you a predefined range to the right of the last candle of your chart. This range is custom and can be changed for a handful of symbols that you can choose. This scale will help you determining if the market is providing a reasonable range before you enter a trade or if the market isn't actually moving as much as you might think. This is particularly useful if you are into scalping and have to consider commission or spread in your trades.
Since all symbols have different price ranges in which they move this indicator doesn't make sense to just have "a one size fits all" approach. That's why you can choose up to 6 symbols and set the range that you want to have shown for each when you pull it up on the chart. Using my default values that means for when the NQ (Nasdaq future) is on the chart you will see a range of 20 handles projected. When you change the the ES (S&P500 future) you will instead see 5 handles. While the number is different that is somewhat of an equal move in both symbols.
There also is an option to set a default price range for all other symbols that are not selected if it is needed. However the display of the scale on anything else than the 6 selected symbols can also be turned off.
There are options provided on how exactly you want to indicator to determine if the chart symbol matches one of the selected symbols.
You can enable it to make sure the exchange/broker is the exact same as selected.
It can check for only the symbol root to match the selection. Specifically for futures this means that while ES1! might be selected, anything ES (ES1!, ES2!, ESH2025, ESM2025, ESM2022, ...) will be a match to the selection)
On the painted scale it is possible to not just show this range extended into each direction once. Per default you will have 3 segments of it in each direction. This can be reduced to just 1 or increased.
If you chose a high number of segments or a large range make sure to use the "Scale price chart only" option on your chart scale to not have the symbols price candles squished together by the charts auto scaling.
And last but not least the indicator options provide some possibilities to change the appearance of the printed price range scale in case you disagree with my design.

MACD & Bollinger Bands Overbought OversoldMACD & Bollinger Bands Reversal Detector
This indicator combines the power of MACD divergence analysis with Bollinger Bands to help traders identify potential reversal points in the market.
Key Features:
MACD Calculation & Divergence:
The script calculates the standard MACD components (MACD line, Signal line, and Histogram) using configurable fast, slow, and signal lengths. It includes a simplified divergence detection mechanism that flags potential bearish divergence—when the price makes a new swing high but the MACD fails to confirm the move. This divergence can serve as an early warning that the bullish momentum is waning.
Bollinger Bands:
A 20-period simple moving average (SMA) is used as the basis, with upper and lower bands drawn at 2 standard deviations. These bands help visualize overbought and oversold conditions. For example, a close at or above the upper band suggests the market may be overextended (overbought), while a close at or below the lower band may indicate oversold conditions.
Visual Alerts:
The indicator plots the Bollinger Bands on the chart along with labels marking overbought and oversold conditions. Additionally, it marks potential bearish divergence with a downward triangle, providing a quick visual cue to traders.
Usage Suggestions:
Confluence with Other Signals:
Use the divergence signals and Bollinger Band conditions as filters. For example, even if another indicator suggests a long entry, you might avoid it if the price is overbought or if MACD divergence warns of weakening momentum.
Customization:
All key parameters, such as the MACD lengths, Bollinger Band period, and multiplier, are fully configurable. This flexibility allows you to adjust the indicator to suit different markets or trading styles.
Disclaimer:
This script is provided for educational purposes only. Always perform your own analysis and backtesting before trading with live capital.

Average Candle Size (Points)ATR but with the ability to add threshold lines (UP TO 3) that help gauge how volatile the market is. Also, note that the default threshold values are set up for NQ Futures so you will need to change your values to your specific needs.

Futures Engulfing Candle Size Strategy (Ticks, TP/SL)The Futures Candle Size Strategy is designed to identify and trade significant price movements in the futures market based on candle size. It is optimized for futures instruments like ES, NQ, or CL, where precise tick-level calculations are essential. The strategy includes a customizable take profit and stop loss in ticks and operates only within a specified time window (e.g., 7:00 AM to 9:15 AM CST).
Key Features:
Candle Size Threshold: Trades are triggered when the candle's high-to-low range exceeds the defined threshold in ticks.
Time Filter: Limits trades to the most active market hours, specifically between 7:00 AM and 9:15 AM CST.
Take Profit and Stop Loss: Customizable exit levels in ticks to manage risk and lock in profits.
Long and Short Trades: Automatically places buy or sell orders based on the candle's direction (bullish or bearish).
Alerts: Sends alerts whenever a trade is triggered, helping you stay informed in real-time.
How It Works:
The strategy calculates the size of each candle in ticks and compares it to the user-defined threshold.
If the candle size meets or exceeds the threshold within the specified time range, it triggers a long or short trade.
The trade automatically exits when the price hits the take profit or stop loss levels.

measure last swing [keypoems]MEASURE LAST SWING
Version: v0.0.7
An indicator for measuring market swings and calculating position sizing based on pivot points and risk parameters. Helps traders visualize price swings and automatically compute position sizes based on their desired risk amount.
FEATURES:
• Identifies and tracks last pivot point in price action
• Displays visual measurements of price swing
• Calculates position sizes based on risk parameters
• Supports major futures contracts with automatic multiplier detection
HOW IT WORKS:
The indicator detects pivot highs and lows using your specified pivot strength, then draws measurement lines and calculates position sizes based on your risk parameters. It automatically cleans up old drawings when new pivot points are identified.
INPUT PARAMETERS:
General Settings:
• Risk Amount - Amount you want to risk per trade
• Pivot Strength - Bars required on either side to confirm a pivot
• Offset - Number of bars to offset the vertical line
Visual Settings:
• Horizontal and Vertical Lines - Customizable colors, widths (1-4), and styles
• Labels - Adjustable text color and size
CONTRACT MULTIPLIERS:
Automatically detects and applies the correct multiplier:
• ES (E-mini S&P 500): 50.0
• MES (Micro E-mini S&P 500): 5.0
• NQ (E-mini Nasdaq): 20.0
• MNQ (Micro E-mini Nasdaq): 2.0
• YM (E-mini Dow): 5.0
• MYM (Micro E-mini Dow): 0.5
• Other symbols: 1.0 (default)
DISPLAY ELEMENTS:
1. Horizontal line showing the level of the last pivot point
2. Vertical line measuring the distance to current price
3. Distance label showing point distance
4. Risk/Position label showing risk amount and calculated position size
POSITION SIZING:
Position Size = Floor(Risk Amount / (Distance in Points × Contract Multiplier))
IDEAL FOR:
• Measuring price swings for technical analysis
• Position sizing based on risk management rules
• Identifying potential entry and exit points
• Visual analysis of market structure
• Risk management automation

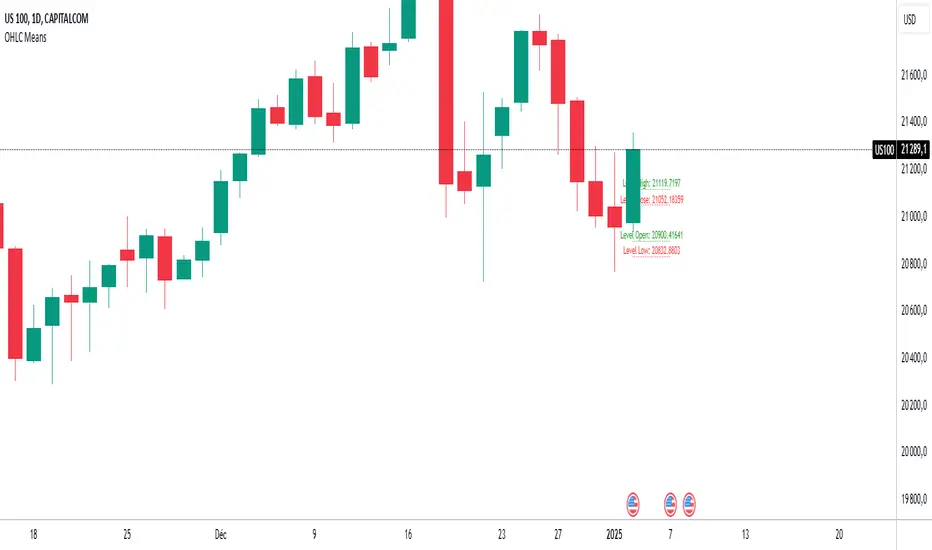
OHLC MeansNote: This indicator works only on daily timeframes.
The indicator calculates the OHLC averages for days corresponding to the day of the last displayed candlestick. For instance, if the last candlestick displayed is Monday, it calculates the OHLC average for all Mondays; if Tuesday, it does the same for all Tuesdays.
Customizable period: The indicator allows you to select the number of candlesticks to analyze, with a default value of 1000. This means it will consider the last 1000 candlesticks before the final displayed one. Assuming there are only five trading days per week, this corresponds to about 200 days. (not true for cryptos, you need to devide by 7)
Example scenario:
Today is Tuesday and we analyse NQ
By default, the indicator analyzes the last 1000 candlesticks (modifiable parameter).
Since there are five trading days in a week,
1000 ÷ 5 = 200
The indicator calculates the OHLC averages for the last 200 Tuesdays, corresponding to the past seven years. Of course it is not exactly 200 becauses the may be one tuesday where the market is closed (if christmas is on tuesday for instance)
Output:
Displays four daily averages as four lines with their levels as labels :
High and Low averages are displayed at the extremes.
Open and Close averages are displayed at the center.
Color coding:
Red indicates bearish movement.
Green indicates bullish movement.
Usage recommendations:
Best suited for assets with a significant historical dataset.
Only functional on daily timeframes.
Powers Strategy IndicatorEMA cross with signals. NQ 5/20 and ES 9/30. Wait for cross and then look for pullback. Signal prints on next bullish or bearish candle.

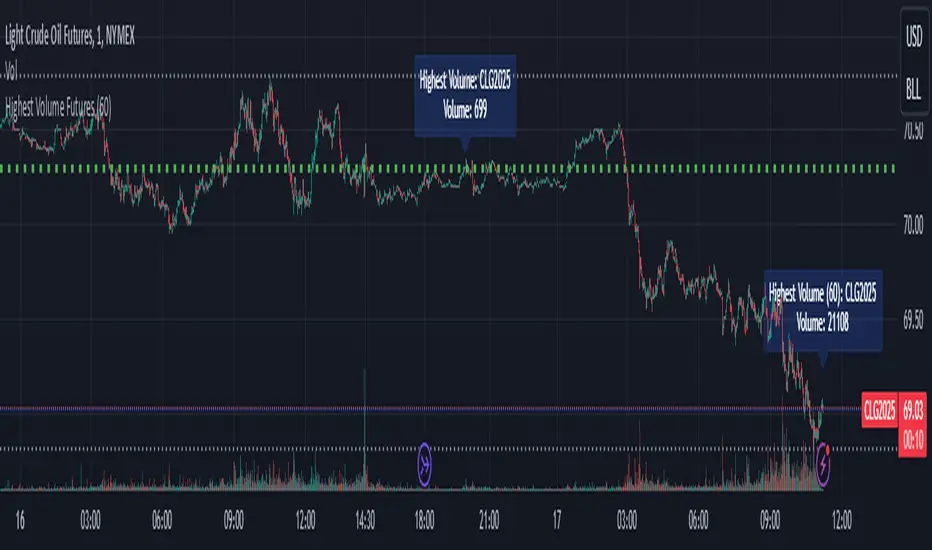
Highest Volume FuturesScript tracks the volume of futures contracts which are not expired for the current and next year. Provides a label at the real-time bar and when a different contract has higher volume in the last bar of the timeframe input as long as it is different from the current ticker. It should display on continuous and lower volume contract charts.
Intended to be used with a higher timeframe input.
Currently supports ES, MES, NQ, MNQ, RTY, M2K, YM, MYM, BTC, MBT, CL, MCL, GC, MGC, E7 and J7. If you'd like to add your own, then include the syminfo.root of your ticker and the appropriate month codes for that contract in the validMonthCodes switch list.
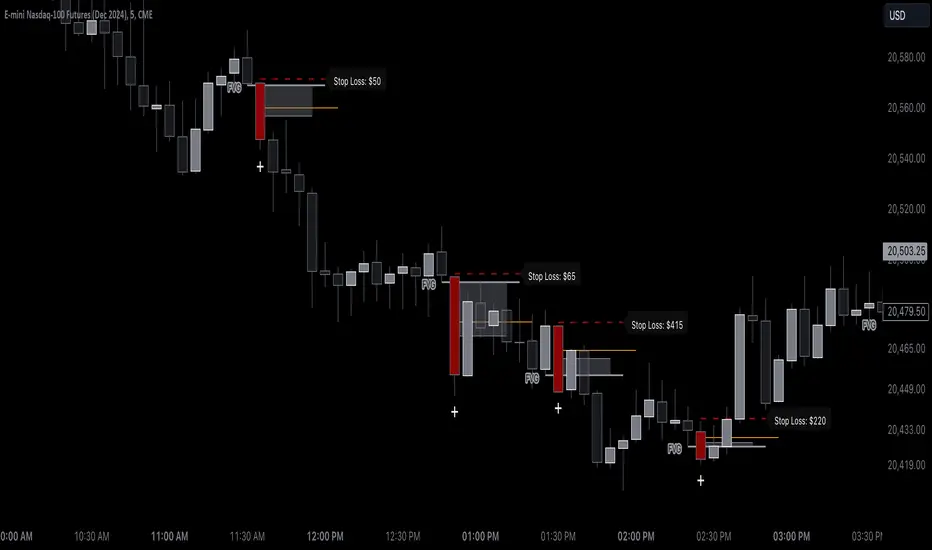
ATR SL Band (No-Repaint, Multi-Timeframe) + Risk per ContractThis indicator draws a non-repainting band for ATR-based Stoploss placement.
If used on Futures, it shows the distance + risk from the previous candle close, as well as from the current price.
The risk value is automatically calculated for the following symbols:
(Micro) ES (S&P 500)
(Micro) NQ (NASDAQ 100)
(Micro) YM (Dow Jones Industrial Average / US30)
The timeframe can be set individually. It is not recommended to use a lower timeframe than the chart timeframe as values differ from the actual timeframe's ATR SL in this case.

Bearish BreakerDescription:
The Bearish Breaker is designed to detect significant bearish candles that meet specific customizable conditions, allowing traders to easily identify potential sell signals or strong downtrends. This indicator highlights bearish candles based on size, close position within the candle's range, and other specific criteria, with options to plot Fibonacci levels, a stop loss line, and dollar loss estimation.
Key Features:
1. Customizable Candle Highlighting Conditions:
Highlights candles that are bearish and whose body is greater than a user-defined multiple of the average candle body size over a specified period.
2.Checks if the candle’s close is within a customizable percentage from the bottom of the candle’s range (default is 35%).
3. Ensures the close is lower than the lows of the previous two candles.
Visual Markings:
1. A plus sign appears below large bearish candles that meet the highlighting criteria.
2. Optionally plots a line at the low of the previous candle, labeled as "FVG" (Fair Value Gap).
3. Fibonacci Levels:
Plots 61.8% and 50% Fibonacci levels from the low to high of the highlighted candle.
4. Provides options to show/hide labels and adjust line colors.
5. Shaded Area:
Fills the area between the 50% and 61.8% levels with customizable color and transparency.
Stop Loss and Dollar Calculation:
1. Calculates a stop loss level, set a user-defined number of ticks above the high of the highlighted candle.
2. Displays a label with the potential dollar loss from the "FVG" to the stop loss line, using a specified dollar value per tick.
How To Use
1. Highlight Conditions: Adjust parameters like the average body length, threshold multiplier, and close percentage to fine-tune the bearish candle detection. typically I like to use the 4-6 body length with a 1.5 multiplier
2. Visual Elements: Toggle labels, colors, and transparency of Fibonacci and FVG lines, allowing you to customize the display for clarity.
3. Risk Management: Set the dollar value per tick and stop loss distance (in ticks) to display potential risk for your specific instrument , for example dollar per tick on NQ is $5 , ES is $12.50, CL is $10
4. Alerts:
An alert can be set to trigger each time a large bearish candle forms and meets all conditions, helping you stay notified of potential bearish momentum shifts.
5. Parameters:
Threshold Multiplier: Adjusts the size threshold for highlighting a bearish candle.
Close Percent in Range: Sets how close to the bottom of the candle’s range the close must be (0-100%). I like the candle to close in the lower 75 percent of the candle.
6. Stop Loss Ticks Above High: Controls how far above the high of the highlighted candle to place the stop loss.
7. Dollar Value per Tick: Calculates potential dollar loss between the FVG level and stop loss based on the asset’s tick value.
8. To trade this setup I like to wait for the first 1-2 candles after the highlighted breaker candle to pull back into the shaded area for a short position and target the low of the breaker candle or a 2-1 risk to reward.
Ideal For:
This indicator is ideal for traders looking to identify strong bearish momentum, manage risk visually, and use Fibonacci and fair value gaps on large bearish candles as potential areas for short entries with suggested stop loss areas and target profits.
Disclaimer: This indicator is for educational and informational purposes only and should not be used as a sole trading strategy. Always perform your own analysis before making trading decisions.
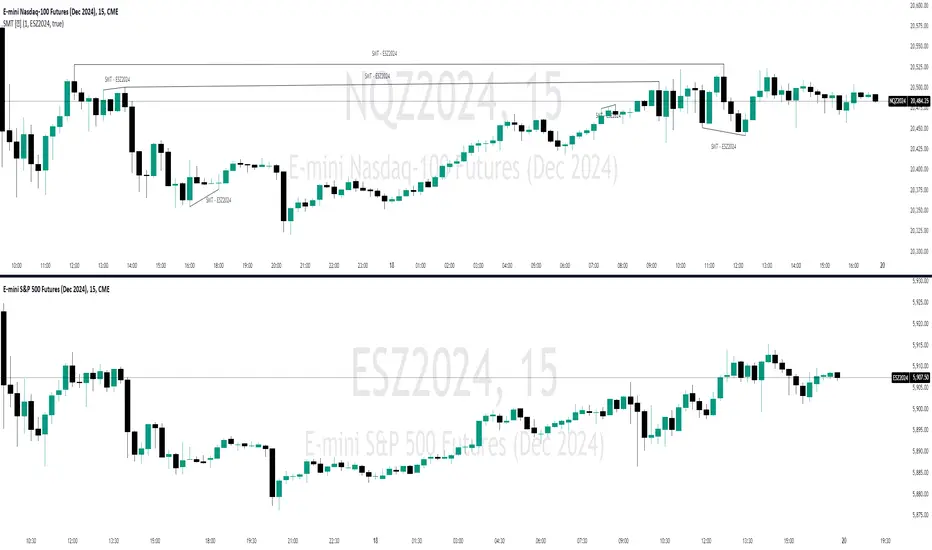
SMT Divergences [OutOfOptions]Smart Money Technique (SMT) Divergence is designed to identify discrepancies between correlated assets within the same timeframe. It occurs when two related assets exhibit opposing signals, such as one forming a higher low while the other forms a lower low. This technique is particularly useful for anticipating market shifts or reversals before they become evident through other Premium Discount (PD) Arrays.
This indicator works by identifying the highs and lows that have formed for an asset on the current chart and the correlated symbol defined in the settings. Once a pivot on either asset is formed, it checks if the pivot has taken liquidity as identified by the previous pivot in the same direction (i.e., a new high taking out a previous high). If this is the case and the corresponding asset has not taken a similar pivot, the condition is determined to be a potential valid divergence. The indicator will then filter out SMTs formed by adjacent candles, requiring at least one candle difference between the candles forming the SMT.
If the “Candle Direction Validation” setting is enabled, the indicator will further check both assets to ensure that for bullish SMTs, the last high on both assets was formed by down candle, and for bearish SMTs, the low was formed by an up candle. This check can often eliminate low-probability SMTs that are frequently broken.
The referenced chart shows divergence between Nasdaq (NQ) and S&P 500 (ES) futures, which are normally closely correlated assets that move in the same direction. The lines shown represent bullish and bearish divergences between the two when they are formed. As you can see from the chart, SMT Divergences may not always indicate a reversal, or a reversal might be just a short-term retrace. Therefore, SMT Divergences should not be used independently. However, in conjunction with other PD arrays, they can provide strong confirmation of a change in market direction.
Configurability:
Pivot strength - Indicates how many bars to the left/right of a high for pivot to be considered, recommended to keep at 1 for maximum detection speed
Candle Direction Validation - Additional SMT validation to filter out weak/low-probability SMTs be examining candle direction
Line Styling for Bullish/Bearish SMTs - Ability to customize line style, color & width for bullish/bearish SMTs
Label Control - Whether or not to show SMT label and if shown what font size & color should be used
What makes this indicator different:
Unlike other SMT indicators, this indicators has additional built-in controls to remove low-probability SMTs
RSI/MFI Divergence Finder [idahodev]Monitoring RSI (Relative Strength Index) and MFI (Money Flow Index) divergences on a stock or index chart offers several benefits to traders and analysts. Let's break down the advantages:
Comprehensive Market View: Combining both indicators provides a more complete picture of market conditions, as they measure different aspects of price movement. RSI focuses on recent gains/losses relative to price change, while MFI incorporates volume data to assess money flow in and out of a security.
Enhanced Signal Accuracy: When divergences occur simultaneously in both RSI and MFI, it may be considered a stronger signal than if only one indicator showed divergence. This can potentially lead to more reliable trading decisions.
Identification of False Breakouts: Divergences between these indicators and price action can help identify false breakouts or misleading price movements that are not supported by underlying market strength or volume.
More Nuanced Market Understanding: By examining divergent behavior between money flow (MFI) and momentum (RSI), traders gain a more detailed comprehension of the interplay between these factors in shaping market trends.
Early Warning Signs: These divergences can act as early warning signs for potential trend reversals or changes in market sentiment, allowing traders to adjust their strategies proactively.
It's important to note that RSI/MFI divergences should be used as part of a broader trading strategy rather than solely relying on them for buy/sell signals. They can serve as valuable tools for confirming trends, identifying potential turning points, or warning against overbought/oversold conditions.
When using these indicators together, traders must be cautious of false signals, especially in choppy markets or during periods of high volatility. It's crucial to combine this analysis with other technical and fundamental factors before making trading decisions.
In summary, monitoring RSI/MFI divergences may offer a way to gain insights into the underlying strengths and weaknesses of market movements.
This utility differs from other in that it allows for a choke/threshold/sensitivity setting to help weed out noisy signals. This needs to be carefully adjusted per chart.
It also allows for tuning of the MFI smoothing length (number of bars on the current chart) as well as how many previous bars it will take into consideration when calculating RSI and MFI divergences. It will signal when it sees alignment forming between RSI and MFI divergences in a direction. You will likely need to tune this script's settings every few days or at least anytime there is a change in overall market behavior or sustained volatility.
Ultimately, the goal with this script is to provide an additional level of confirmation of weakness or strength. It should be combined with other indicators such as exhaustion, pivots, supply/demand, trendline breaks or tests, and structure changes, to name a few complementary tools or strategies. It's not meant to be a standalone buy/sell signal indicator!
Here are some settings for futures that may help you get started:
ES (4m chart)
RSI Length: 26
MFI Length: 8
MFI Smoothing Length: 32
Divergence Sensitivity: 124
Left Bars for Pivot: 10
Right Bars for Pivot: 1
NQ (4m chart)
RSI Length: 14
MFI Length: 14
MFI Smoothing Length: 21
Divergence Sensitivity: 400
Left Bars for Pivot: 21
Right Bars for Pivot: 1
YM (4m chart)
RSI Length: 14
MFI Length: 14
MFI Smoothing Length: 21
Divergence Sensitivity: 810
Left Bars for Pivot: 33
Right Bars for Pivot: 1

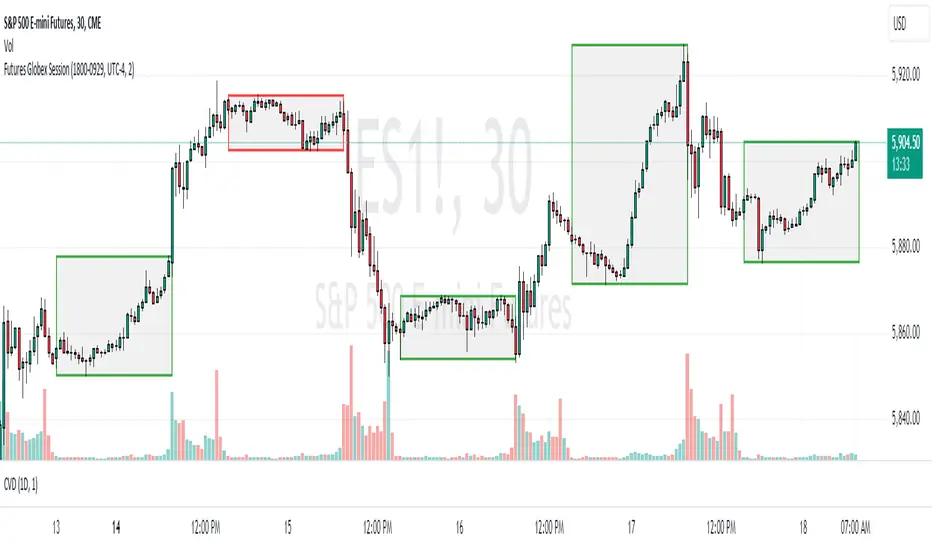
Futures Globex Session(s)This indicator draws a box around the Globex Session for the various Futures markets. The box height defines the highs and lows of that session, and the width defines the timeframe of that session. The boxes are outlined green if price rose during that period, and red if price fell during that period. The default Globex Session is set for the Equity Index Futures and is set in the UTC-4 time zone (Eastern Time). In the settings you can adjust the session time and time zone of your Globex Session to reflect the trading times of that market. Below are the session times for various Futures markets set in time zone UTC-4.
Equity Indexes: 18:00 - 9:30
(ES, NQ, YM, RTY)
Treasuries: 18:00 - 8:20
(ZN, ZB)
Metals: 18:00 - 8:20
(GC)
Energies: 18:00 - 9:00
(CL, NG)
Agricultures: 20:00 - 9:30
(ZS, ZW)
Market Volatility Key: CHOP, ATR, VIX & 10Y BondThis script builds upon existing market analysis tools by providing a comprehensive dashboard that combines the Choppiness Index (CHOP), Average True Range (ATR) with a user-selectable timeframe, VIX (Volatility Index), and the 10-year US Treasury bond price in a compact tile format. The color-coded key provides quick visual cues for market conditions—highlighting whether the market is trending or consolidating—allowing traders to make informed decisions quickly.
For example, when trading the Nasdaq (NQ), you might use this indicator to help manage your scalping trades. If you trade on a 10-minute chart but set the ATR timeframe to 1 minute, it helps identify whether there is enough price movement to justify entering a trade. If the ATR is less than 10, it suggests there's not enough range for scalping opportunities, and you may choose to stay out of the trade.
This expanded indicator integrates and enhances existing concepts to deliver a well-rounded view of volatility, trend strength, and market conditions all in one glance, making it an essential tool for both trend-following and scalping strategies.
