Cross-Correlation Lead/Lag AnalyzerCross-Correlation Lead/Lag Analyzer (XCorr)
Discover which instrument moves first with advanced cross-correlation analysis.
This indicator analyzes the lead/lag relationship between any two financial instruments using rolling cross-correlation at multiple time offsets. Perfect for pairs trading, market timing, and understanding inter-market relationships.
Key Features:
Universal compatibility - Works with any two symbols (stocks, futures, forex, crypto, commodities)
Multi-timeframe analysis - Automatically adjusts lag periods based on your chart timeframe
Real-time correlation table - Shows current correlation values for all lag scenarios
Visual lead/lag detection - Color-coded plots make it easy to spot which instrument leads
Smart "Best" indicator - Automatically identifies the strongest relationship
How to Use:
Set your symbols in the indicator settings (default: NQ1! vs RTY1!)
Adjust correlation length (default: 20 periods for smooth but responsive analysis)
Watch the colored lines:
• Red/Orange: Symbol 2 leads Symbol 1 by 1-2 periods
• Blue: Instruments move simultaneously
• Green/Purple: Symbol 1 leads Symbol 2 by 1-2 periods
Check the table for exact correlation values and the "Best" relationship
Interpreting Results:
Correlation > 0.7: Strong positive relationship
Correlation 0.3-0.7: Moderate relationship
Correlation < 0.3: Weak/no relationship
Highest line indicates the optimal timing relationship
Popular Use Cases:
Index Futures : NQ vs ES, RTY vs IWM
Sector Rotation : XLF vs XLK, QQQ vs SPY
Commodities : GC vs SI, CL vs NG
Currency Pairs : EURUSD vs GBPUSD
Crypto : BTC vs ETH correlation analysis
Technical Notes:
Cross-correlation measures linear relationships between two time series at different time lags. This implementation uses Pearson correlation with adjustable periods, calculating correlations from -2 to +2 period offsets to detect leading/lagging behavior.
Perfect for quantitative analysts, pairs traders, and anyone studying inter-market relationships.
스크립트에서 "NQ"에 대해 찾기

Spread AnalysisSpread Analysis - Futures vs Spot Price Analysis
Advanced spread analysis tool that compares futures/perp prices with spot prices across multiple exchanges, providing insights into market sentiment and potential trading opportunities.
Multi-Asset Support: Automatically detects and analyzes crypto perpetual vs spot spreads, index futures vs cash indices (ES/SPX, NQ/NDX, YM/DJI), and commodity futures vs spot prices (GC/GOLD, CL/USOIL)
Multi-Exchange Aggregation: For crypto, aggregates prices from Binance, BitMEX, Kraken, Bybit, OKX, and Coinbase to calculate mean perp and spot prices
Z-Score Based Alerts: Uses statistical Z-score analysis to identify extreme spread conditions that may signal potential reversals or continuation patterns
Visual Histogram Display: Shows spread differences as colored columns - green for futures premium, red for futures discount
Flexible Calculation Methods: Supports absolute price differences, percentage spreads, or basis point calculations
Trading Applications: Identify market sentiment divergence, spot potential reversal opportunities, and confirm trend strength
Risk Management: Use extreme Z-scores to identify overvalued conditions and potential mean reversion setups
Market Analysis: Understand the relationship between futures and spot markets across different asset classes
Timing Tool: Spread momentum often precedes price moves, providing early signals for entry/exit decisions
Perfect for traders who want to understand the relationship between futures and spot markets, identify divergences, and spot potential reversal opportunities across crypto, indices, and commodities.
Key Features:
• Automatic asset detection and appropriate spread calculation
• Configurable Z-score alerts for extreme conditions
• Comprehensive tooltips and information guide
• Multiple calculation methods (absolute, percentage, basis points)
• Clean, customizable visual display
Use Cases:
• Crypto traders analyzing perp vs spot relationships
• Futures traders monitoring basis relationships
• Mean reversion strategies using extreme spreads
• Trend confirmation using spread momentum
• Market sentiment analysis across asset classes

Z-Score Volume with CVD Clustering Script Title:
Z-Score Volume with CVD Clustering & NY VWAP
📘 Description:
This indicator combines statistical volume analysis with order flow confirmation to detect high-probability trade zones and volume-based divergences.
📌 Components:
Z-Score of Volume: Identifies statistically significant volume surges or drops relative to a moving average baseline.
Cumulative Volume Delta (CVD): Gauges net buying vs. selling pressure using high-frequency bid/ask delta.
K-Means Clustering: Applies clustering logic to classify each bar into:
Cluster 2 – Strong Bullish: Z-Score and CVD both strong
Cluster 1 – Divergence / Bull Trap: Z-Score high, but weak CVD
Cluster 0 – Neutral / Noise: No clear alignment
Anchored VWAP (NY Session Open): Confirms market structure and institutional trend bias from 9:30 AM ET forward.
🎯 Suggested Applications:
✅ 1. Trend Continuation Entries (Add-ons):
Look to add to positions when:
Cluster 2 signal occurs
Price is above the NY session VWAP
Price structure has broken out of prior day high/low or range
⚠️ 2. Divergence Detection (Fade Traps):
Cluster 1 signals a bearish divergence (e.g., high volume but weak CVD).
Especially useful when price is failing to stay above VWAP.
Useful for early exits or reversal setups.
📊 3. Volume Profile Confirmation:
Combine with fixed or session-based volume profile tools.
Use Z-Score clusters to confirm volume spikes into low-volume nodes (LVNs) or during imbalance transitions.
📍 4. VWAP Structure Confirmation:
Anchored VWAP acts as a dynamic reference point.
Helps confirm acceptance vs. rejection zones at key institutional levels.
📈 Visuals & Alerts:
Color-coded volume bars show intensity of Z-Score & CVD confluence
CVD Line plots real-time delta bias with green/red coloring
Cluster-based shape markers highlight key bars for actionable signals
Optional: Add alerts for Cluster 2 above VWAP or Cluster 1 below VWAP
⚙️ Customization Options:
Adjustable Z-Score length
Custom anchor timeframe for CVD (e.g., 1D or sessions)
Adjustable max lookback depth
Toggle VWAP inclusion
Extendable to include additional filters: RSI, structure break alerts, etc.
🔧 Ideal Use Cases:
NY session intraday traders (ES, NQ, CL, 6E, FX pairs)
Breakout traders wanting order flow confirmation
Mean reversion traders spotting fake moves
Volume-based scalpers looking for edge on short-term order imbalance

Futures Support & Resistance LevelsMulti-Timeframe Support & Resistance Levels for Futures Trading
Description:
This indicator automatically identifies and displays key support and resistance levels using multiple technical analysis methods. Designed specifically for futures traders (ES, NQ, etc.), it provides a clean, organized view of important price levels.
Key Features:
Multiple Detection Methods: Combines pivot points, daily ranges, and psychological levels
Smart Ranking System: Levels are numbered by strength (1 = strongest)
Clean Visualization: Extended lines across the chart with clear price labels
Confluence Detection: Highlights areas where multiple levels converge
Customizable Display: Adjust colors, line styles, and label sizes
Level Types Identified:
Daily High/Low (current session)
Previous Daily High/Low
Pivot-based Support/Resistance
Psychological Round Numbers
Confluence Zones (multiple levels clustering)
Technical Approach:
The indicator uses a strength-scoring algorithm to rank levels by importance. Daily levels receive the highest weighting (2.0), followed by previous daily levels (1.5), pivot points (1.0), and psychological levels (0.5). This helps traders focus on the most significant levels.
Visual Elements:
Solid lines = Strong levels
Dashed lines = Medium levels
Dotted lines = Weak levels
Optional technical condition markers for educational analysis
Best Used For:
Identifying key intraday levels for futures trading
Finding high-probability reversal zones
Setting logical stop-loss and take-profit levels
Recognizing confluence areas for stronger setups
Note:
This is a technical analysis tool for educational purposes. No indicator can predict future price movements. Always use proper risk management and combine with other forms of analysis.

Rolling VWAP LevelsRolling VWAP Levels Indicator
Overview
Dynamic horizontal lines showing rolling Volume Weighted Average Price (VWAP) levels for multiple timeframes (7D, 30D, 90D, 365D) that update in real-time as new bars form.
Who This Is For
Day traders using VWAP as support/resistance
Swing traders analyzing multi-timeframe price structure
Scalpers looking for mean reversion entries
Options traders needing volatility bands for strike selection
Institutional traders tracking volume-weighted fair value
Risk managers requiring dynamic stop levels
How To Trade With It
Mean Reversion Strategies:
Buy when price is below VWAP and showing bullish divergence
Sell when price is above VWAP and showing bearish signals
Use multiple timeframes - enter on shorter, confirm on longer
Target opposite VWAP level for profit taking
Breakout Trading:
Watch for price breaking above/below key VWAP levels with volume
Use 7D VWAP for intraday breakouts
Use 30D/90D VWAP for swing trade breakouts
Confirm breakout with move beyond first standard deviation band
Support/Resistance Trading:
VWAP levels act as dynamic support in uptrends
VWAP levels act as dynamic resistance in downtrends
Multiple timeframe VWAP confluence creates stronger levels
Use standard deviation bands as additional S/R zones
Risk Management:
Place stops beyond next VWAP level
Use standard deviation bands for position sizing
Exit partial positions at VWAP levels
Monitor distance table for overextended moves
Key Features
Real-time Updates: Lines move and extend as new bars form
Individual Styling: Custom colors, widths, styles for each timeframe
Standard Deviation Bands: Optional volatility bands with custom multipliers
Smart Labels: Positioned above, below, or diagonally relative to lines
Distance Table: Shows percentage distance from each VWAP level
Alert System: Get notified when price crosses VWAP levels
Memory Efficient: Automatically cleans up old drawing objects
Settings Explained
Display Group: Show/hide labels, font size, line transparency, positioning
Individual VWAP Groups: Color, line width (1-5), line style for each timeframe
Standard Deviation Bands: Enable bands with custom multipliers (0.5, 1.0, 1.5, 2.0, etc.)
Labels Group: Position (8 options including diagonal), custom text, price display
Additional Info: Distance table, alert conditions
Technical Implementation
Uses rolling arrays to maintain sliding windows of price*volume data. The core calculation function processes both VWAP and standard deviation efficiently. Lines are created dynamically and updated every bar. Memory management prevents object accumulation through automatic cleanup.
Best Practices
Start with 7D and 30D VWAP for most strategies
Add 90D/365D for longer-term context
Use standard deviation bands when volatility matters
Position labels to avoid chart clutter
Enable distance table during high volatility periods
Set alerts for key VWAP level breaks
Market Applications
Forex: Major pairs during London/NY sessions
Stocks: Large cap names with good volume
Crypto: Bitcoin, Ethereum, major altcoins
Futures: ES, NQ, CL, GC with continuous volume
Options: Use SD bands for strike selection and volatility assessment

Candle Closer Levels & TP Zones📝 Description:
This indicator is designed to provide intrabar trade levels for high-speed execution strategies, such as scalping and intraday momentum trading.
🧩 Key Features:
Plots High, Low, Mid, and two Quarter Levels on the current candle only, keeping charts clean
Take Profit (TP) lines are calculated as a percentage of candle range, not fixed ticks — this makes it highly adaptable for futures like NQ/ES or volatile markets like crypto
Supports both long and short setups via a simple toggle
Customizable colors, line thickness, and length
Each TP level can be enabled or muted individually
📈 Use Case:
Apply this tool to spot candle-based breakouts or rejections. You can scale TPs dynamically based on the strength of the current candle. This is especially helpful in assets where volatility fluctuates greatly intrabar.
This is not a repackaged built-in indicator — it’s purpose-built for real-time tactical level plotting without historical noise.

Long/Short/Exit/Risk management Strategy # LongShortExit Strategy Documentation
## Overview
The LongShortExit strategy is a versatile trading system for TradingView that provides complete control over entry, exit, and risk management parameters. It features a sophisticated framework for managing long and short positions with customizable profit targets, stop-loss mechanisms, partial profit-taking, and trailing stops. The strategy can be enhanced with continuous position signals for visual feedback on the current trading state.
## Key Features
### General Settings
- **Trading Direction**: Choose to trade long positions only, short positions only, or both.
- **Max Trades Per Day**: Limit the number of trades per day to prevent overtrading.
- **Bars Between Trades**: Enforce a minimum number of bars between consecutive trades.
### Session Management
- **Session Control**: Restrict trading to specific times of the day.
- **Time Zone**: Specify the time zone for session calculations.
- **Expiration**: Optionally set a date when the strategy should stop executing.
### Contract Settings
- **Contract Type**: Select from common futures contracts (MNQ, MES, NQ, ES) or custom values.
- **Point Value**: Define the dollar value per point movement.
- **Tick Size**: Set the minimum price movement for accurate calculations.
### Visual Signals
- **Continuous Position Signals**: Implement 0 to 1 visual signals to track position states.
- **Signal Plotting**: Customize color and appearance of position signals.
- **Clear Visual Feedback**: Instantly see when entry conditions are triggered.
### Risk Management
#### Stop Loss and Take Profit
- **Risk Type**: Choose between percentage-based, ATR-based, or points-based risk management.
- **Percentage Mode**: Set SL/TP as a percentage of entry price.
- **ATR Mode**: Set SL/TP as a multiple of the Average True Range.
- **Points Mode**: Set SL/TP as a fixed number of points from entry.
#### Advanced Exit Features
- **Break-Even**: Automatically move stop-loss to break-even after reaching specified profit threshold.
- **Trailing Stop**: Implement a trailing stop-loss that follows price movement at a defined distance.
- **Partial Profit Taking**: Take partial profits at predetermined price levels:
- Set first partial exit point and percentage of position to close
- Set second partial exit point and percentage of position to close
- **Time-Based Exit**: Automatically exit a position after a specified number of bars.
#### Win/Loss Streak Management
- **Streak Cutoff**: Automatically pause trading after a series of consecutive wins or losses.
- **Daily Reset**: Option to reset streak counters at the start of each day.
### Entry Conditions
- **Source and Value**: Define the exact price source and value that triggers entries.
- **Equals Condition**: Entry signals occur when the source exactly matches the specified value.
### Performance Analytics
- **Real-Time Stats**: Track important performance metrics like win rate, P&L, and largest wins/losses.
- **Visual Feedback**: On-chart markers for entries, exits, and important events.
### External Integration
- **Webhook Support**: Compatible with TradingView's webhook alerts for automated trading.
- **Cross-Platform**: Connect to external trading systems and notification platforms.
- **Custom Order Execution**: Implement advanced order flows through external services.
## How to Use
### Setup Instructions
1. Add the script to your TradingView chart.
2. Configure the general settings based on your trading preferences.
3. Set session trading hours if you only want to trade specific times.
4. Select your contract specifications or customize for your instrument.
5. Configure risk parameters:
- Choose your preferred risk management approach
- Set appropriate stop-loss and take-profit levels
- Enable advanced features like break-even, trailing stops, or partial profit taking as needed
6. Define entry conditions:
- Select the price source (such as close, open, high, or an indicator)
- Set the specific value that should trigger entries
### Entry Condition Examples
- **Example 1**: To enter when price closes exactly at a whole number:
- Long Source: close
- Long Value: 4200 (for instance, to enter when price closes exactly at 4200)
- **Example 2**: To enter when an indicator reaches a specific value:
- Long Source: ta.rsi(close, 14)
- Long Value: 30 (triggers when RSI equals exactly 30)
### Best Practices
1. **Always backtest thoroughly** before using in live trading.
2. **Start with conservative risk settings**:
- Small position sizes
- Reasonable stop-loss distances
- Limited trades per day
3. **Monitor and adjust**:
- Use the performance table to track results
- Adjust parameters based on how the strategy performs
4. **Consider market volatility**:
- Use ATR-based stops during volatile periods
- Use fixed points during stable markets
## Continuous Position Signals Implementation
The LongShortExit strategy can be enhanced with continuous position signals to provide visual feedback about the current position state. These signals can help you track when the strategy is in a long or short position.
### Adding Continuous Position Signals
Add the following code to implement continuous position signals (0 to 1):
```pine
// Continuous position signals (0 to 1)
var float longSignal = 0.0
var float shortSignal = 0.0
// Update position signals based on your indicator's conditions
longSignal := longCondition ? 1.0 : 0.0
shortSignal := shortCondition ? 1.0 : 0.0
// Plot continuous signals
plot(longSignal, title="Long Signal", color=#00FF00, linewidth=2, transp=0, style=plot.style_line)
plot(shortSignal, title="Short Signal", color=#FF0000, linewidth=2, transp=0, style=plot.style_line)
```
### Benefits of Continuous Position Signals
- Provides clear visual feedback of current position state (long/short)
- Signal values stay consistent (0 or 1) until condition changes
- Can be used for additional calculations or alert conditions
- Makes it easier to track when entry conditions are triggered
### Using with Custom Indicators
You can adapt the continuous position signals to work with any custom indicator by replacing the condition with your indicator's logic:
```pine
// Example with moving average crossover
longSignal := fastMA > slowMA ? 1.0 : 0.0
shortSignal := fastMA < slowMA ? 1.0 : 0.0
```
## Webhook Integration
The LongShortExit strategy is fully compatible with TradingView's webhook alerts, allowing you to connect your strategy to external trading platforms, brokers, or custom applications for automated trading execution.
### Setting Up Webhooks
1. Create an alert on your chart with the LongShortExit strategy
2. Enable the "Webhook URL" option in the alert dialog
3. Enter your webhook endpoint URL (from your broker or custom trading system)
4. Customize the alert message with relevant information using TradingView variables
### Webhook Message Format Example
```json
{
"strategy": "LongShortExit",
"action": "{{strategy.order.action}}",
"price": "{{strategy.order.price}}",
"quantity": "{{strategy.position_size}}",
"time": "{{time}}",
"ticker": "{{ticker}}",
"position_size": "{{strategy.position_size}}",
"position_value": "{{strategy.position_value}}",
"order_id": "{{strategy.order.id}}",
"order_comment": "{{strategy.order.comment}}"
}
```
### TradingView Alert Condition Examples
For effective webhook automation, set up these alert conditions:
#### Entry Alert
```
{{strategy.position_size}} != {{strategy.position_size}}
```
#### Exit Alert
```
{{strategy.position_size}} < {{strategy.position_size}} or {{strategy.position_size}} > {{strategy.position_size}}
```
#### Partial Take Profit Alert
```
strategy.order.comment contains "Partial TP"
```
### Benefits of Webhook Integration
- **Automated Trading**: Execute trades automatically through supported brokers
- **Cross-Platform**: Connect to custom trading bots and applications
- **Real-Time Notifications**: Receive trade signals on external platforms
- **Data Collection**: Log trade data for further analysis
- **Custom Order Management**: Implement advanced order types not available in TradingView
### Compatible External Applications
- Trading bots and algorithmic trading software
- Custom order execution systems
- Discord, Telegram, or Slack notification systems
- Trade journaling applications
- Risk management platforms
### Implementation Recommendations
- Test webhook delivery using a free service like webhook.site before connecting to your actual trading system
- Include authentication tokens or API keys in your webhook URL or payload when required by your external service
- Consider implementing confirmation mechanisms to verify trade execution
- Log all webhook activities for troubleshooting and performance tracking
## Strategy Customization Tips
### For Scalping
- Set smaller profit targets (1-3 points)
- Use tighter stop-losses
- Enable break-even feature after small profit
- Set higher max trades per day
### For Day Trading
- Use moderate profit targets
- Implement partial profit taking
- Enable trailing stops
- Set reasonable session trading hours
### For Swing Trading
- Use longer-term charts
- Set wider stops (ATR-based often works well)
- Use higher profit targets
- Disable daily streak reset
## Common Troubleshooting
### Low Win Rate
- Consider widening stop-losses
- Verify that entry conditions aren't triggering too frequently
- Check if the equals condition is too restrictive; consider small tolerances
### Missing Obvious Trades
- The equals condition is extremely precise. Price must exactly match the specified value.
- Consider using floating-point precision for more reliable triggers
### Frequent Stop-Outs
- Try ATR-based stops instead of fixed points
- Increase the stop-loss distance
- Enable break-even feature to protect profits
## Important Notes
- The exact equals condition is strict and may result in fewer trade signals compared to other conditions.
- For instruments with decimal prices, exact equality might be rare. Consider the precision of your value.
- Break-even and trailing stop calculations are based on points, not percentage.
- Partial take-profit levels are defined in points distance from entry.
- The continuous position signals (0 to 1) provide valuable visual feedback but don't affect the strategy's trading logic directly.
- When implementing continuous signals, ensure they're aligned with the actual entry conditions used by the strategy.
---
*This strategy is for educational and informational purposes only. Always test thoroughly before using with real funds.*

lib_core_utilsLibrary "lib_core_utils"
Core utility functions for Pine Script strategies
Provides safe mathematical operations, array management, and basic helpers
Version: 1.0.0
Author: NQ Hybrid Strategy Team
Last Updated: 2025-06-18
===================================================================
safe_division(numerator, denominator)
safe_division
@description Performs division with safety checks for zero denominators and invalid values
Parameters:
numerator (float) : (float) The numerator value
denominator (float) : (float) The denominator value
Returns: (float) Result of division, or 0.0 if invalid
safe_division_detailed(numerator, denominator)
safe_division_detailed
@description Enhanced division with detailed result information
Parameters:
numerator (float) : (float) The numerator value
denominator (float) : (float) The denominator value
Returns: (SafeCalculationResult) Detailed calculation result
safe_multiply(a, b)
safe_multiply
@description Performs multiplication with safety checks for overflow and invalid values
Parameters:
a (float) : (float) First multiplier
b (float) : (float) Second multiplier
Returns: (float) Result of multiplication, or 0.0 if invalid
safe_add(a, b)
safe_add
@description Performs addition with safety checks
Parameters:
a (float) : (float) First addend
b (float) : (float) Second addend
Returns: (float) Result of addition, or 0.0 if invalid
safe_subtract(a, b)
safe_subtract
@description Performs subtraction with safety checks
Parameters:
a (float) : (float) Minuend
b (float) : (float) Subtrahend
Returns: (float) Result of subtraction, or 0.0 if invalid
safe_abs(value)
safe_abs
@description Safe absolute value calculation
Parameters:
value (float) : (float) Input value
Returns: (float) Absolute value, or 0.0 if invalid
safe_max(a, b)
safe_max
@description Safe maximum value calculation
Parameters:
a (float) : (float) First value
b (float) : (float) Second value
Returns: (float) Maximum value, handling NA cases
safe_min(a, b)
safe_min
@description Safe minimum value calculation
Parameters:
a (float) : (float) First value
b (float) : (float) Second value
Returns: (float) Minimum value, handling NA cases
safe_array_get(arr, index)
safe_array_get
@description Safely retrieves value from array with bounds checking
Parameters:
arr (array) : (array) The array to access
index (int) : (int) Index to retrieve
Returns: (float) Value at index, or na if invalid
safe_array_push(arr, value, max_size)
safe_array_push
@description Safely pushes value to array with size management
Parameters:
arr (array) : (array) The array to modify
value (float) : (float) Value to push
max_size (int) : (int) Maximum array size
Returns: (bool) True if push was successful
safe_array_unshift(arr, value, max_size)
safe_array_unshift
@description Safely adds value to beginning of array with size management
Parameters:
arr (array) : (array) The array to modify
value (float) : (float) Value to add at beginning
max_size (int) : (int) Maximum array size
Returns: (bool) True if unshift was successful
get_array_stats(arr, max_size)
get_array_stats
@description Gets statistics about an array
Parameters:
arr (array) : (array) The array to analyze
max_size (int) : (int) The maximum allowed size
Returns: (ArrayStats) Statistics about the array
cleanup_array(arr, target_size)
cleanup_array
@description Cleans up array by removing old elements if it's too large
Parameters:
arr (array) : (array) The array to cleanup
target_size (int) : (int) Target size after cleanup
Returns: (int) Number of elements removed
is_valid_price(price)
is_valid_price
@description Checks if a price value is valid for trading calculations
Parameters:
price (float) : (float) Price to validate
Returns: (bool) True if price is valid
is_valid_volume(vol)
is_valid_volume
@description Checks if a volume value is valid
Parameters:
vol (float) : (float) Volume to validate
Returns: (bool) True if volume is valid
sanitize_price(price, default_value)
sanitize_price
@description Sanitizes price value to ensure it's within valid range
Parameters:
price (float) : (float) Price to sanitize
default_value (float) : (float) Default value if price is invalid
Returns: (float) Sanitized price value
sanitize_percentage(pct)
sanitize_percentage
@description Sanitizes percentage value to 0-100 range
Parameters:
pct (float) : (float) Percentage to sanitize
Returns: (float) Sanitized percentage (0-100)
is_session_active(session_string, timezone)
Parameters:
session_string (string)
timezone (string)
get_session_progress(session_string, timezone)
Parameters:
session_string (string)
timezone (string)
format_price(price, decimals)
Parameters:
price (float)
decimals (int)
format_percentage(pct, decimals)
Parameters:
pct (float)
decimals (int)
bool_to_emoji(condition, true_emoji, false_emoji)
Parameters:
condition (bool)
true_emoji (string)
false_emoji (string)
log_debug(message, level)
Parameters:
message (string)
level (string)
benchmark_start()
benchmark_end(start_time)
Parameters:
start_time (int)
get_library_info()
get_library_version()
SafeCalculationResult
SafeCalculationResult
Fields:
value (series float) : (float) The calculated value
is_valid (series bool) : (bool) Whether the calculation was successful
error_message (series string) : (string) Error description if calculation failed
ArrayStats
ArrayStats
Fields:
size (series int) : (int) Current array size
max_size (series int) : (int) Maximum allowed size
is_full (series bool) : (bool) Whether array has reached max capacity

Position Size Calculator v206/17/2025 - Updated to add MGC to list of instruments
Position Size Calculator for Futures Trading
A professional position sizing tool designed specifically for futures traders who want to maintain disciplined risk management. This indicator calculates the optimal number of contracts based on your predefined risk amount and provides instant visual feedback.
Key Features:
• Interactive price selection - simply click on the chart to set entry, stop loss, and take profit levels
• Supports all major futures contracts: ES, NQ, GC, RTY, YM, MNQ, MES with accurate contract specifications
• Customizable risk amount (defaults to $500 but fully adjustable)
• Real-time position size calculations that never exceed your risk tolerance
• Visual risk validation with color-coded header (green = valid risk, red = excessive risk)
• Automatic 2:1 risk/reward ratio calculations
• Compact, non-intrusive table display in top-right corner
• Clean interface with no chart clutter
How to Use:
Select your futures instrument from the dropdown
Set your maximum risk amount (default $500)
Click on the chart to set your Entry Price
Click on the chart to set your Stop Loss Price
Optionally click to set your Take Profit Price
The calculator instantly shows maximum contracts, actual risk, expected profit, and R/R ratio
Risk Management:
The indicator enforces strict risk management by calculating the maximum number of contracts you can trade while staying within your specified risk limit. The header turns green when your trade is within acceptable risk parameters and red when the risk is too high, providing instant visual feedback.
Perfect for day traders, swing traders, and anyone trading futures who wants to maintain consistent position sizing and risk management discipline.

Futures Margin Lookup TableThis script applies a table to your chart, which provides the intraday and overnight margin requirements of the currently selected symbol.
In this indicator the user must provide the broker data in the form of specifically formatted text blocks. The data for which should be found on the broker website under futures margin requirements.
The purpose for it's creation is due to the non-standard way each individual broker may price their margins and lack of information within TradingView when connected to some (maybe all) brokers, including during paper trading, as the flat percentage rule is not accurate.
An example of information could look like this
MES;Micro S&P;$50;$2406
ES;E-Mini S&P;$500;$24,053
GC;Gold;$500;$16500
NQ;E-Mini Nasdaq;$1,000;$34,810
FDAX;Dax Index;€2,000;€44,311
Each symbol begins a new line, and the values on that line are separated by semicolons (;)
Each line consists of the following...
SYMBOL : Search string used to match to the beginning of the current chart symbol.
NAME: Human readable name
INTRA: Intraday trading margin requirement per contract
OVERNIGHT: Overnight trading margin requirement per contract
The script simply finds a matching line within your provided information using the current chart symbol.
So for example the continuous chart for
NQ1!
would match to the user specified line starting with NQ... as would the individual contract dates such as NQM2025, NQK2025, etc.
NOTES:
There is a possibility that symbols with similar starting characters could match. If this is the case put the longer symbol higher in the list.
There is also a line / character limit to the text input fields within pinescript. Ensure the text you enter / paste into them is not truncated. If so there are 3 input fields for just this purpose. Find the last complete line and continue the remaining symbol lines on the subsequent inputs.

Cumulative Intraday Volume with Long/Short LabelsThis indicator calculates a running total of volume for each trading day, then shows on the price chart when that total crosses levels you choose. Every day at 6:00 PM Eastern Time, the total goes back to zero so it always reflects only the current day’s activity. From that moment on, each time a new candle appears the indicator looks at whether the candle closed higher than it opened or lower. If it closed higher, the candle’s volume is added to the running total; if it closed lower, the same volume amount is subtracted. As a result, the total becomes positive when buyers have dominated so far today and negative when sellers have dominated.
Because futures markets close at 6 PM ET, the running total resets exactly then, mirroring the way most intraday traders think in terms of a single session. Throughout the day, you will see this running total move up or down according to whether more volume is happening on green or red candles. Once the total goes above a number you specify (for example, one hundred thousand contracts), the indicator will place a small “Long” label at that candle on the main price chart to let you know buying pressure has reached that level. Similarly, once the total goes below a negative number you choose (for example, minus one hundred thousand), a “Short” label will appear at that candle to signal that selling pressure has reached your chosen threshold. You can set these threshold numbers to whatever makes sense for your trading style or the market you follow.
Because raw volume alone never turns negative, this design uses candle direction as a sign. Green candles (where the close is higher than the open) add volume, and red candles (where the close is lower than the open) subtract volume. Summing those signed volume values tells you in a single number whether buying or selling has been stronger so far today. That number resets every evening, so it does not carry over any buying or selling from previous sessions.
Once you have this indicator on your chart, you simply watch the “summed volume” line as it moves throughout the day. If it climbs past your long threshold, you know buyers are firmly in control and a long entry might make sense. If it falls past your short threshold, you know sellers are firmly in control and a short entry might make sense. In quieter markets or times of low volume, you might use a smaller threshold so that even modest buying or selling pressure will trigger a label. During very active periods, a larger threshold will prevent too many signals when volume spikes frequently.
This approach is straightforward but can be surprisingly powerful. It does not rely on complex formulas or hidden statistical measures. Instead, it simply adds and subtracts daily volume based on candle color, then alerts you when that total reaches levels you care about. Over several years of historical testing, this formula has shown an ability to highlight moments when intraday sentiment shifts decisively from buyers to sellers or vice versa. Because the indicator resets every day at 6 PM, it always reflects only today’s sentiment and remains easy to interpret without carrying over past data. You can use it on any intraday timeframe, but it works especially well on five-minute or fifteen-minute charts for futures contracts.
If you want a clear gauge of whether buyers or sellers are dominating in real time, and you prefer a rule-based method rather than a complex model, this indicator gives you exactly that. It shows net buying or selling pressure at a glance, resets each session like most intraday traders do, and marks the moments when that pressure crosses the levels you decide are important. By combining a daily reset with signed volume, you get a single number that tells you precisely what the crowd is doing at any given moment, without any of the guesswork or hidden calculations that more complicated indicators often carry.

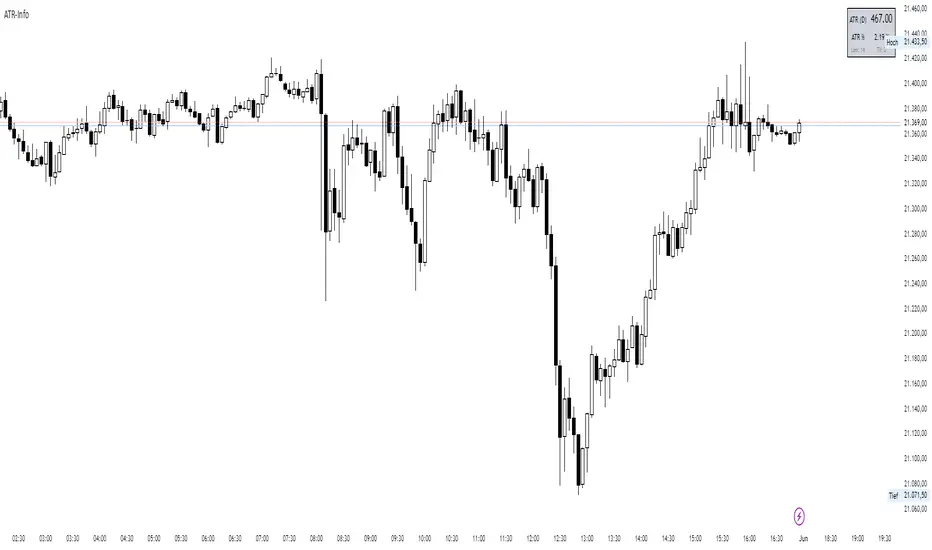
ATR-InfoWHAT IT SHOWS
- ATR (): Average True Range of the chosen timeframe, printed with the instrument’s native tick precision (format.mintick).
- ATR % PRICE: ATR divided by the latest close, multiplied by 100 – the range as a percentage of current price.
- LEN / TF: The ATR length and timeframe you selected (shown in small print).
INPUTS
- ATR Length (default 14)
- ATR Timeframe (for example 60, D, W)
- Design settings: table position, font size, colours, border
EXAMPLES
BTC-USD: price 67 800, ATR 2 450, ATR % 3.6
NQ E-Mini: price 18 230, ATR 355, ATR % 1.9
CL WTI: price 76.40, ATR 2.10, ATR % 2.8
EUR-USD: price 1.0860, ATR 0.0075, ATR % 0.69
USE CASES
Volatility-adjusted stops: place your stop roughly one ATR beyond the entry price.
Position sizing: money at risk divided by ATR gives the number of contracts or coins.
Market selection: trade assets only when their ATR % sits in your preferred range.
Strategy filter: trigger entries or exits only when ATR % crosses a chosen threshold.
LIMITS
ATR is descriptive; it does not predict future moves.
Illiquid symbols may show exaggerated ATR spikes.
ATR % ignores differing session lengths (24/7 crypto versus exchange-traded hours).
LTA - Futures Contract Size CalculatorLTA - Futures Contract Size Calculator
This indicator helps futures traders calculate the potential stop-loss (SL) value for their trades with ease. Simply input your entry price, stop-loss price, and number of contracts, and the indicator will compute the ticks moved, price movement, and total SL value in USD.
Key Features:
Supports a wide range of futures contracts, including:
Index Futures: E-mini S&P 500 (ES), Micro E-mini S&P 500 (MES), E-mini Nasdaq-100 (NQ), Micro E-mini Nasdaq-100 (MNQ)
Commodity Futures: Crude Oil (CL), Gold (GC), Micro Gold (MGC), Silver (SI), Micro Silver (SIL), Platinum (PL), Micro Platinum (MPL), Natural Gas (NG), Micro Natural Gas (MNG)
Bond Futures: 30-Year T-Bond (ZB)
Currency Futures: Euro FX (6E), Japanese Yen (6J), Australian Dollar (6A), British Pound (6B), Canadian Dollar (6C), Swiss Franc (6S), New Zealand Dollar (6N)
Displays key metrics in a clean table (bottom-right corner):
Instrument, Entry Price, Stop-Loss Price, Number of Contracts, Tick Size, Ticks Moved, Price Movement, and Total SL Value.
Automatically calculates based on the selected instrument’s tick size and tick value.
User-friendly interface with a dark theme for better visibility.
How to Use:
Add the indicator to your chart.
Select your instrument from the dropdown (ensure it matches your chart’s symbol, e.g., "NG1!" for NATURAL GAS (NG)).
Input your Entry Price, Stop-Loss Price, and Number of Contracts.
View the results in the table, including the Total SL Value in USD.
Ideal For:
Futures traders looking to quickly assess stop-loss risk.
Beginners and pros trading indices, commodities, bonds, or currencies.
Note: Ensure your chart symbol matches the selected instrument for accurate calculations. For best results, test with a few contracts and price levels to confirm the output.
This description is tailored for TradingView’s audience, providing a clear overview of the indicator’s functionality, supported instruments, and usage instructions. It also includes a note to help users avoid common pitfalls (e.g., mismatched symbols). If you’d like to adjust the tone, add more details, or include specific TradingView tags (e.g., , ), let me know!

Engulfing DetectorThis script detects classic candlestick reversal patterns known as Engulfing formations:
Bullish Engulfing: A green candle fully engulfs the previous red candle.
Bearish Engulfing: A red candle fully engulfs the previous green candle.
🔎 Features:
Works on any time frame or instrument.
Optional filter to ignore overly large or irregular candles.
Visual signals on the chart (BE/SE labels).
Built-in alerts for automation or notification.
✅ Recommended usage:
For intraday trading, this indicator performs best on the 5-minute chart of the Nasdaq (NQ) between 9:45 AM and 1:00 PM ET (15:45–19:00 CET).
💡 Suggested trading approach:
Optimized for scalping with short-term trades and small take-profits around +0.10%.

IPDA with Order Blocks [Enhanced]Summary of the Code
This script plots IPDA Standard Deviations on a price chart, helping traders visualize potential support and resistance levels based on a series of user-defined deviations. It uses swing high/low points and time-based fractal lookbacks (monthly, weekly, daily, or intraday) to define price anchors and compute deviation lines.
Key features include:
Deviations: It calculates and plots deviation levels based on the distance between swing highs and lows, which traders can use as price targets or zones of interest.
Timeframes:
Monthly (higher timeframe analysis)
Weekly (medium-term analysis)
Daily and Intraday (shorter-term precision)
Customization:
Choose which deviation levels (e.g., 0, 1, -1, -2) to display.
Hide labels or adjust their sizes for cleaner charts.
Option to remove invalidated deviation levels dynamically.
Visual Cleanliness: Automatically removes clutter by hiding or deleting invalid deviation levels and focusing on active price zones.
How to Utilize It for Intraday Trading to Make $1,000
Here’s how to effectively use the indicator to optimize intraday trading:
1. Set the Right Timeframe:
Use the 15-minute or 1-hour chart for intraday setups.
Ensure the "Intraday" lookback option is enabled to focus on shorter-term swings.
2. Interpret the Levels:
Bearish Order Blocks: Look for red lines (bearish deviation) as potential resistance zones where the price may reverse downward.
Bullish Order Blocks: Look for green lines (bullish deviation) as potential support zones where the price may bounce upward.
3. Plan Entries and Exits:
Entry: Buy near a green order block or short near a red order block, confirming the trade with additional signals (e.g., candlestick patterns, momentum indicators).
Stop Loss: Place your stop below the green line (for buys) or above the red line (for shorts).
Profit Targets: Use deviation levels as targets (e.g., from the 0 level to +1 or -1).
4. Combine with Market Context:
Use the script alongside volume profile, trend indicators, or news events for confirmation.
Avoid trading during major news events unless aligned with deviations.
5. Position Sizing for $1,000 Goal:
Trade liquid instruments like Nasdaq futures (NQ) or major forex pairs.
Risk 1-2% of your capital on each trade and scale into positions if confirmed.
Target a profit of 10-20 points per trade on Nasdaq futures, with 1-2 trades daily.
6. Monitor Key Timeframes:
Pre-market (before 9:30 AM EST): Mark deviation levels to predict market open behavior.
Midday & Power Hour (3-4 PM EST): Watch for breakouts or retests around key deviation levels.
By combining this tool with disciplined risk management and a clear trading plan, you can systematically work toward your profit target while minimizing unnecessary risks

ryantrad3s session highs and lowsThis indicator allows you find London Session and Asia Session highs and lows without marking them yourself. This indicator can also help you find good draws on liquidity for the day and potential highs and lows you can target during that trading day. I recommend trading NQ and ES with this indicator because that's what I seen it work best with. The blue lines are London Session high and low and the red lines are Asia Session high and low. Hope this can save you time marking out your chart before market open.
Index Futures vs Cash ArbitrageThis indicator measures the statistical spread between major stock index futures and their corresponding cash indices (e.g., ES vs SPX, NQ vs NDX) using Z-score normalization. It automatically detects commonly traded index pairs (S&P 500, Nasdaq, Dow Jones, Russell 2000) and calculates a smoothed spread between futures and spot prices. A Z-score is then derived from this spread to highlight potential overpricing or underpricing conditions.
Traders can use customizable thresholds to identify mean-reversion opportunities where the futures contract may be temporarily overvalued or undervalued relative to the index. The histogram highlights the direction of the Z-score (green = futures > index, red = futures < index), while built-in alerts notify users of key threshold breaches or zero-line crosses.
This tool is designed for discretionary traders, pairs traders, or anyone exploring statistical arbitrage strategies between futures and spot markets. It is not a buy/sell signal by itself and should be used with additional confluence or risk management techniques.

REVELATIONS (VoVix - PoC) REVELATIONS (VoVix - POC): True Regime Detection Before the Move
Let’s not sugarcoat it: Most strategies on TradingView are recycled—RSI, MACD, OBV, CCI, Stochastics. They all lag. No matter how many overlays you stack, every one of these “standard” indicators fires after the move is underway. The retail crowd almost always gets in late. That’s never been enough for my team, for DAFE, or for anyone who’s traded enough to know the real edge vanishes by the time the masses react.
How is this different?
REVELATIONS (VoVix - POC) was engineered from raw principle, structured to detect pre-move regime change—before standard technicals even light up. We built, tested, and refined VoVix to answer one hard question:
What if you could see the spike before the trend?
Here’s what sets this system apart, line-by-line:
o True volatility-of-volatility mathematics: It’s not just "ATR of ATR" or noise smoothing. VoVix uses normalized, multi-timeframe v-vol spikes, instantly detecting orderbook stress and "outlier" market events—before the chart shows them as trends.
o Purist regime clustering: Every trade is enabled only during coordinated, multi-filter regime stress. No more signals in meaningless chop.
o Nonlinear entry logic: No trade is ever sent just for a “good enough” condition. Every entry fires only if every requirement is aligned—local extremes, super-spike threshold, regime index, higher timeframe, all must trigger in sync.
o Adaptive position size: Your contracts scale up with event strength. Tiny size during nominal moves, max leverage during true regime breaks—never guesswork, never static exposure.
o All exits governed by regime decay logic: Trades are closed not just on price targets but at the precise moment the market regime exhausts—the hardest part of systemic trading, now solved.
How this destroys the lag:
Standard indicators (RSI, MACD, OBV, CCI, and even most “momentum” overlays) simply tell you what already happened. VoVix triggers as price structure transitions—anyone running these generic scripts will trade behind the move while VoVix gets in as stress emerges. Real alpha comes from anticipation, not confirmation.
The visuals only show what matters:
Top right, you get a live, live quant dashboard—regime index, current position size, real-time performance (Sharpe, Sortino, win rate, and wins). Bottom right: a VoVix "engine bar" that adapts live with regime stress. Everything you see is a direct function of logic driving this edge—no cosmetics, no fake momentum.
Inputs/Signals—explained carefully for clarity:
o ATR Fast Length & ATR Slow Length:
These are the heart of VoVix’s regime sensing. Fast ATR reacts to sharp volatility; Slow ATR is stability baseline. Lower Fast = reacts to every twitch; higher Slow = requires more persistent, “real” regime shifts.
Tip: If you want more signals or faster markets, lower ATR Fast. To eliminate noise, raise ATR Slow.
o ATR StdDev Window: Smoothing for volatility-of-volatility normalization. Lower = more jumpy, higher = only the cleanest spikes trigger.
Tip: Shorten for “jumpy” assets, raise for indices/futures.
o Base Spike Threshold: Think of this as your “minimum event strength.” If the current move isn’t volatile enough (normalized), no signal.
Tip: Higher = only biggest moves matter. Lower for more signals but more potential noise.
o Super Spike Multiplier: The “are you sure?” test—entry only when the current spike is this multiple above local average.
Tip: Raise for ultra-selective/swing-trading; lower for more active style.
Regime & MultiTF:
o Regime Window (Bars):
How many bars to scan for regime cluster “events.” Short for turbo markets, long for big swings/trends only.
o Regime Event Count: Only trade when this many spikes occur within the Regime Window—filters for real stress, not isolated ticks.
Tip: Raise to only ever trade during true breakouts/crashes.
o Local Window for Extremes:
How many bars to check that a spike is a local max.
Tip: Raise to demand only true, “clearest” local regime events; lower for early triggers.
o HTF Confirm:
Higher timeframe regime confirmation (like 45m on an intraday chart). Ensures any event you act on is visible in the broader context.
Tip: Use higher timeframes for only major moves; lower for scalping or fast regimes.
Adaptive Sizing:
o Max Contracts (Adaptive): The largest size your system will ever scale to, even on extreme event.
Tip: Lower for small accounts/conservative risk; raise on big accounts or when you're willing to go big only on outlier events.
o Min Contracts (Adaptive): The “toe-in-the-water.” Smallest possible trade.
Tip: Set as low as your broker/exchange allows for safety, or higher if you want to always have meaningful skin in the game.
Trade Management:
o Stop %: Tightness of your stop-loss relative to entry. Lower for tighter/safer, higher for more breathing room at cost of greater drawdown.
o Take Profit %: How much you'll hold out for on a win. Lower = more scalps. Higher = only run with the best.
o Decay Exit Sensitivity Buffer: Regime index must dip this far below the trading threshold before you exit for “regime decay.”
Tip: 0 = exit as soon as stress fails, higher = exits only on stronger confirmation regime is over.
o Bars Decay Must Persist to Exit: How long must decay be present before system closes—set higher to avoid quick fades and whipsaws.
Backtest Settings
Initial capital: $10,000
Commission: Conservative, realistic roundtrip cost:
15–20 per contract (including slippage per side) I set this to $25
Slippage: 3 ticks per trade
Symbol: CME_MINI:NQ1!
Timeframe: 1 min (but works on all timeframes)
Order size: Adaptive, 1–3 contracts
No pyramiding, no hidden DCA
Why these settings?
These settings are intentionally strict and realistic, reflecting the true costs and risks of live trading. The 10,000 account size is accessible for most retail traders. 25/contract including 3 ticks of slippage are on the high side for NQ, ensuring the strategy is not curve-fit to perfect fills. If it works here, it will work in real conditions.
Tip: Set to 1 for instant regime exit; raise for extra confirmation (less whipsaw risk, exits held longer).
________________________________________
Bottom line: Tune the sensitivity, selectivity, and risk of REVELATIONS by these inputs. Raise thresholds and windows for only the best, most powerful signals (institutional style); lower for activity (scalpers, fast cryptos, signals in constant motion). Sizing is always adaptive—never static or martingale. Exits are always based on both price and regime health. Every input is there for your control, not to sell “complexity.” Use with discipline, and make it your own.
This strategy is not just a technical achievement: It’s a statement about trading smarter, not just more.
* I went back through the code to make sure no the strategy would not suffer from repainting, forward looking, or any frowned upon loopholes.
Disclaimer:
Trading is risky and carries the risk of substantial loss. Do not use funds you aren’t prepared to lose. This is for research and informational purposes only, not financial advice. Backtest, paper trade, and know your risk before going live. Past performance is not a guarantee of future results.
Expect more: We’ll keep pushing the standard, keep evolving the bar until “quant” actually means something in the public code space.
Use with clarity, use with discipline, and always trade your edge.
— Dskyz , for DAFE Trading Systems

VOID Directional Spike MarkerThis indicator highlights significant directional moves on the $VOID chart (NYSE USI:UVOL − DERIBIT:DVOL ) using simple visual cues:
🔼 Green up arrows when the candle closes significantly higher than it opens
🔽 Red down arrows when the candle closes significantly lower than it opens
Threshold is fully customizable (default: 15,000,000)
Ideal for spotting explosive internal shifts on the 5-minute chart during key market moments
Alerts included for both up and down spikes
Use this to track aggressive buying or selling pressure across NYSE internals and time your entries on NQ, ES, or YM with stronger conviction.

Quarterly Theory ICT 05 [TradingFinder] Doubling Theory Signals🔵 Introduction
Doubling Theory is an advanced approach to price action and market structure analysis that uniquely combines time-based analysis with key Smart Money concepts such as SMT (Smart Money Technique), SSMT (Sequential SMT), Liquidity Sweep, and the Quarterly Theory ICT.
By leveraging fractal time structures and precisely identifying liquidity zones, this method aims to reveal institutional activity specifically smart money entry and exit points hidden within price movements.
At its core, the market is divided into two structural phases: Doubling 1 and Doubling 2. Each phase contains four quarters (Q1 through Q4), which follow the logic of the Quarterly Theory: Accumulation, Manipulation (Judas Swing), Distribution, and Continuation/Reversal.
These segments are anchored by the True Open, allowing for precise alignment with cyclical market behavior and providing a deeper structural interpretation of price action.
During Doubling 1, a Sequential SMT (SSMT) Divergence typically forms between two correlated assets. This time-structured divergence occurs between two swing points positioned in separate quarters (e.g., Q1 and Q2), where one asset breaks a significant low or high, while the second asset fails to confirm it. This lack of confirmation—especially when aligned with the Manipulation and Accumulation phases—often signals early smart money involvement.
Following this, the highest and lowest price points from Doubling 1 are designated as liquidity zones. As the market transitions into Doubling 2, it commonly returns to these zones in a calculated move known as a Liquidity Sweep—a sharp, engineered spike intended to trigger stop orders and pending positions. This sweep, often orchestrated by institutional players, facilitates entry into large positions with minimal slippage.
Bullish :
Bearish :
🔵 How to Use
Applying Doubling Theory requires a simultaneous understanding of temporal structure and inter-asset behavioral divergence. The method unfolds over two main phases—Doubling 1 and Doubling 2—each divided into four quarters (Q1 to Q4).
The first phase focuses on identifying a Sequential SMT (SSMT) divergence, which forms when two correlated assets (e.g., EURUSD and GBPUSD, or NQ and ES) react differently to key price levels across distinct quarters. For example, one asset may break a previous low while the other maintains structure. This misalignment—especially in Q2, the Manipulation phase—often indicates early smart money accumulation or distribution.
Once this divergence is observed, the extreme highs and lows of Doubling 1 are marked as liquidity zones. In Doubling 2, the market gravitates back toward these zones, executing a Liquidity Sweep.
This move is deliberate—designed to activate clustered stop-loss and pending orders and to exploit pockets of resting liquidity. These sweeps are typically driven by institutional forces looking to absorb liquidity and position themselves ahead of the next major price move.
The key to execution lies in the fact that, during the sweep in Doubling 2, a classic SMT divergence should also appear between the two assets. This indicates a weakening of the previous trend and adds an extra layer of confirmation.
🟣 Bullish Doubling Theory
In the bullish scenario, Doubling 1 begins with a bullish SSMT divergence, where one asset forms a lower low while the other maintains its structure. This divergence signals weakening bearish momentum and possible smart money accumulation. In Doubling 2, the market returns to the previous low and sweeps the liquidity zone—breaking below it on one asset, while the second fails to confirm, forming a bullish SMT divergence.
f this move is followed by a bullish PSP and a clear market structure break (MSB), a long entry is triggered. The stop-loss is placed just below the swept liquidity zone, while the target is set in the premium zone, anticipating a move driven by institutional buyers.
🟣 Bearish Doubling Theory
The bearish scenario follows the same structure in reverse. In Doubling 1, a bearish SSMT divergence occurs when one asset prints a higher high while the other fails to do so. This suggests distribution and weakening buying pressure. Then, in Doubling 2, the market returns to the previous high and executes a liquidity sweep, targeting trapped buyers.
A bearish SMT divergence appears, confirming the move, followed by a bearish PSP on the lower timeframe. A short position is initiated after a confirmed MSB, with the stop-loss placed
🔵 Settings
⚙️ Logical Settings
Quarterly Cycles Type : Select the time segmentation method for SMT analysis.
Available modes include : Yearly, Monthly, Weekly, Daily, 90 Minute, and Micro.
These define how the indicator divides market time into Q1–Q4 cycles.
Symbol : Choose the secondary asset to compare with the main chart asset (e.g., XAUUSD, US100, GBPUSD).
Pivot Period : Sets the sensitivity of the pivot detection algorithm. A smaller value increases responsiveness to price swings.
Pivot Sync Threshold : The maximum allowed difference (in bars) between pivots of the two assets for them to be compared.
Validity Pivot Length : Defines the time window (in bars) during which a divergence remains valid before it's considered outdated.
🎨 Display Settings
Show Cycle :Toggles the visual display of the current Quarter (Q1 to Q4) based on the selected time segmentation
Show Cycle Label : Shows the name (e.g., "Q2") of each detected Quarter on the chart.
Show Labels : Displays dynamic labels (e.g., “Q2”, “Bullish SMT”, “Sweep”) at relevant points.
Show Lines : Draws connection lines between key pivot or divergence points.
Color Settings : Allows customization of colors for bullish and bearish elements (lines, labels, and shapes)
🔔 Alert Settings
Alert Name : Custom name for the alert messages (used in TradingView’s alert system).
Message Frequenc y:
All : Every signal triggers an alert.
Once Per Bar : Alerts once per bar regardless of how many signals occur.
Per Bar Close : Only triggers when the bar closes and the signal still exists.
Time Zone Display : Choose the time zone in which alert timestamps are displayed (e.g., UTC).
Bullish SMT Divergence Alert : Enable/disable alerts specifically for bullish signals.
Bearish SMT Divergence Alert : Enable/disable alerts specifically for bearish signals
🔵 Conclusion
Doubling Theory is a powerful and structured framework within the realm of Smart Money Concepts and ICT methodology, enabling traders to detect high-probability reversal points with precision. By integrating SSMT, SMT, Liquidity Sweeps, and the Quarterly Theory into a unified system, this approach shifts the focus from reactive trading to anticipatory analysis—anchored in time, structure, and liquidity.
What makes Doubling Theory stand out is its logical synergy of time cycles, behavioral divergence, liquidity targeting, and institutional confirmation. In both bullish and bearish scenarios, it provides clearly defined entry and exit strategies, allowing traders to engage the market with confidence, controlled risk, and deeper insight into the mechanics of price manipulation and smart money footprints.

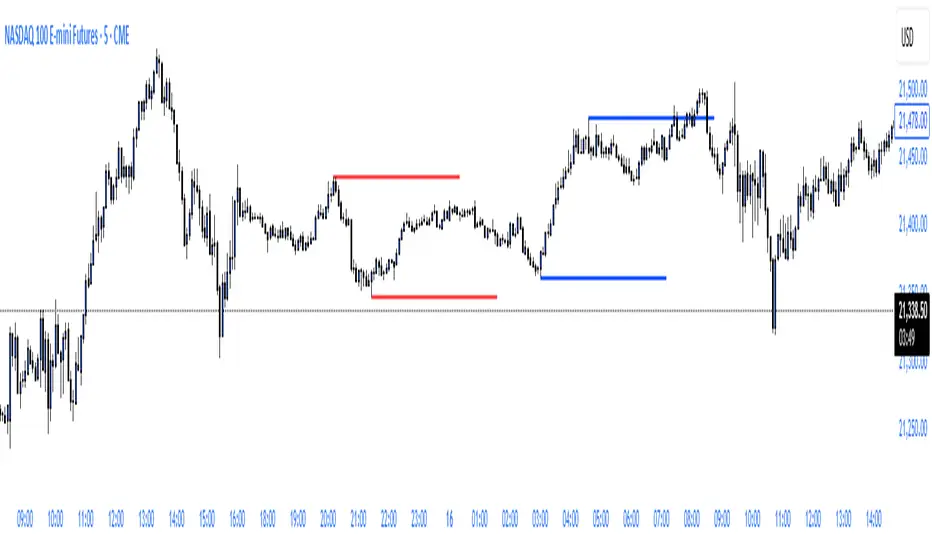
Really Key Levels█ OVERVIEW
This indicator shows the most useful and universally used key trading levels (and only those) in a visually appealing way. Its originality lies in the fact that it was developed due to being unable to find an indicator that wasn't cluttered with other features or far less relevant levels, or one that would indicate the bar causing the level (i.e., not just using a horizontal line over the whole chart), or one that was well-programmed and didn’t frequently refresh for many seconds for no obvious reason, taking far too long to do so for such a seemingly simple indicator.
█ FEATURES
Shows the most frequently used key levels in a visually appealing way
Indicates the bar that causes the level, with the line starting at that bar
Works correctly and consistently on both RTH and ETH charts
Lines can be optionally extended both left and right, if the user prefers
Works with US/European stocks and US futures (at least)
Configurable futures regular session (default time is for CME futures, e.g., ES/NQ, etc.)
Users can configure line colour, style, and thickness
Adjustable label locations to prevent overlap with other indicator labels
Nice defaults that look good, and a well-contrasting label text colour
Well-documented, high-quality, open-source code for those who are interested
█ CONCEPTS
The indicator shows the following levels by a line starting at the bar that causes them:
Current Day RTH High/Low (visible and updated only during RTH; visible with no further updates in the post-market)
Current Day RTH Open (only after the RTH open)
Pre-Market High/Low (as it develops in the pre-market and fixed after RTH open)
Previous Day RTH Close
Previous Day RTH High/Low
Previous Day Pre-Market High-Low
Two Days Ago RTH Close
Other levels may be added in future versions, if requested and if they are Really Key Levels.
Regarding futures: despite being a 23-hour market (for CME futures, 5 p.m. the previous day to 4 p.m. the current day), most trading activity takes place together with the RTH on stock exchanges in New York, 08:30 to 3 p.m. Central (Chicago) time. Therefore, a user-configurable regular market is defined at those times, with times before this (from 5 p.m. the previous day) being considered pre-market, and times after this (until 4 p.m.) being considered post-market.
Care was taken so that the code uses no hard-coded time zones, exchanges, or session times. For this reason, it can in principle work globally. However, it very much depends on the information provided by the exchange, which is reflected in built-in Pine Script variables (see Limitations below).
█ LIMITATIONS
Pre-market levels are not shown when viewing an RTH chart.
The indicator was developed and tested on US/European stocks and US futures. It may or may not work for stocks and futures in other countries (depending on their pre- and post-market definitions and what information the exchange provides to TradingView via the relevant built-in Pine Script variable). It does not work on other security types, especially those with a 24-hour market that don't have a uniquely defined daily close, implicit H/L time window, or a pre-market.

ETH to RTH Gap DetectorETH to RTH Gap Detector
What It Does
This indicator identifies and tracks custom-defined gaps that form between Extended Trading Hours (ETH) and Regular Trading Hours (RTH). Unlike traditional gap definitions, this indicator uses a specialized approach - defining up gaps as the space between previous session close high to current session initial balance low, and down gaps as the space from previous session close low to current session initial balance high. Each detected gap is monitored until it's touched by price.
Key Features
Detects custom-defined ETH-RTH gaps based on previous session close and current session initial balance
Automatically identifies both up gaps and down gaps
Visualizes gaps with color-coded boxes that extend until touched
Tracks when gaps are filled (when price touches the gap area)
Offers multiple display options for filled gaps (color change, border only, pattern, or delete)
Provides comprehensive statistics including total gaps, up/down ratio, and touched gap percentage
Includes customizable alert system for real-time gap filling notifications
Features toggle options for dashboard visibility and weekend sessions
Uses time-based box coordinates to avoid common TradingView drawing limitations
How To Use It
Configure Session Times : Set your preferred RTH hours and timezone (default 9:30-16:00 America/New York)
Set Initial Balance Period : Adjust the initial balance period (default 30 minutes) for gap detection sensitivity
Monitor Gap Formation : The indicator automatically detects gaps between the previous session close and current session IB
Watch For Gap Fills : Gaps change appearance or disappear when price touches them, based on your selected style
Check Statistics : View the dashboard to see total gaps, directional distribution, and touched percentage
Set Alerts : Enable alerts to receive notifications when gaps are filled
Settings Guide
RTH Settings : Configure the start/end times and timezone for Regular Trading Hours
Initial Balance Period : Controls how many minutes after market open to calculate the initial balance (1-240 minutes)
Display Settings : Toggle gap boxes, extension behavior, and dashboard visibility
Filled Box Style : Choose how filled gaps appear - Filled (color change), Border Only, Pattern, or Delete
Color Settings : Customize colors for up gaps, down gaps, and filled gaps
Alert Settings : Control when and how alerts are triggered for gap fills
Weekend Session Toggle : Option to include or exclude weekend trading sessions
Technical Details
The indicator uses time-based coordinates (xloc.bar_time) to prevent "bar index too far" errors
Gap boxes are intelligently limited to avoid TradingView's 500-bar drawing limitation
Box creation and fill detection use proper range intersection logic for accuracy
Session detection is handled using TradingView's session string format for reliability
Initial balance detection is precisely calculated based on time difference
Statistics calculations exclude zero-division scenarios for stability
This indicator works best on futures markets with extended and regular trading hours, especially indices (ES, NQ, RTY) and commodities. Performs well on timeframes from 1-minute to 1-hour.
What Makes It Different
Most gap indicators focus on traditional open-to-previous-close gaps, but this tool offers a specialized definition more relevant to ETH/RTH transitions. By using the initial balance period to define gap edges, it captures meaningful price discrepancies that often provide trading opportunities. The indicator combines sophisticated gap detection logic with clean visualization and comprehensive tracking statistics. The customizable fill styles and integrated alert system make it practical for both chart analysis and active trading scenarios.

ChopFlow ATR Scalp StrategyA lean, high-velocity scalp framework for NQ and other futures that blends trend clarity, volume confirmation, and adaptive exits to give you precise, actionable signals—no cluttered bands or lagging indicators.
⸻
🔍 Overview
This strategy locks onto rapid intraday moves by:
• Filtering for directional momentum with the Choppiness Index (CI)
• Confirming conviction via On-Balance Volume (OBV) against its moving average
• Automatically sizing stops and targets with a multiple of the Average True Range (ATR)
It’s designed for scalp traders who need clean, timely entries without wading through choppy noise.
⸻
⚙️ Key Features & Inputs
1. ATR Length & Multiplier
• Controls exit distances based on current volatility.
2. Choppiness Length & Threshold
• Measures trend strength; only fires when the market isn’t “stuck in the mud.”
3. OBV SMA Length
• Smoothes volume flow to confirm genuine buying or selling pressure.
4. Custom Session Hours
• Avoid overnight gaps or low-liquidity periods.
All inputs are exposed for rapid tuning to your preferred scalp cadence.
🚀 How It Works
1. Long Entry triggers when:
• CI < threshold (strong trend)
• OBV > its SMA (positive volume flow)
• You’re within the defined session
2. Short Entry mirrors the above (CI < threshold, OBV < SMA)
3. Exit uses ATR × multiplier for both stop-loss and take-profit
⸻
🎯 Usage Tips
• Start with defaults (ATR 14, multiplier 1.5; CI 14, threshold 60; OBV SMA 10).
• Monitor signal frequency, then tighten/loosen CI or OBV look-back as needed.
• Pair with a fast MA crossover or price-action trigger if you want even sharper timing.
• Backtest across different sessions (early open vs. power hours) to find your edge.
⸻
⚠️ Disclaimer
This script is provided “as-is” for educational and research purposes. Always paper-trade any new setup extensively before deploying live capital, and adjust risk parameters to your personal tolerance.
⸻
Elevate your scalp game with ChopFlow ATR—where trend, volume, and volatility converge for clear, confident entries. Happy scalping!
