4C NYSE Market Breadth RatioThe NYSE Market Breadth Ratio is considered by some to be the “king” of market internals. It lets you know instantly how strong current buying or selling pressure is in the broad market, to eliminate guessing or opinion.
This indicator plots the Market Breadth Ratio values for the NYSE and the NASD exchanges in real time.
It also plots the NYSE Market Breadth Ratio in a histogram plot for visual reference.
The indicator dynamically changes colors between green and red depending on whether breadth is currently positive or negative.
This indicator divides the 'Up-Volume' ("UVOL") by 'Down-Volume' ("DVOL"), for each exchange.
It can be added to any chart, but is incredibly useful when added to other sources of market internals like the NYSE Advancers/Decliners Difference (ticker ADD) or with the NYSE UVOL / DVOL Difference (ticker VOLD ).
Credit goes to author=@auron9000 as the bulk of this code was from their Breadth Ratio Bubbles indicator.
---> The changes made to their indicator include: bug fixes where the values werent properly updating; fixed indicator to be a separate plot (not chart overlay), and added the histogram plot.
스크립트에서 "N+credit最新动态"에 대해 찾기

ATR BandsIn many strategies, it's quite common to use a scaled ATR to help define a stop-loss, and it's not uncommon to use it for take-profit targets as well. While it's possible to use the built-in ATR indicator and manually calculate the offset value, we felt this wasn't particularly intuitive or efficient, and could lead to the potential for miscalculations. And while there are quite a few indicators that plot ATR bands in some form or another already on TV, we could not find one that actually performed the exact way that we wanted. They all had at least one of the following gaps:
The ATR offset was not configurable (usually hard-coded to be based off the high or low, while we generally prefer to use close)
It would only print a single band (either the upper or lower), which would require the same indicator to be added twice
The ATR scaling factor was either not configurable or only stepped in whole numbers (often time fractional factors like 1.5 yield better results)
To that end, we took to making this enhanced version to meet all of the above requirements. While we were doing so, we decided to take this opportunity to also make some non-functional enhancements as well:
Updated the indicator to the most recent version of Pine
Updated the indicator definition to allow alternate (non-chart) timeframe usage
Made the input types explicitly defined to improve consistency
Updated the inputs with appropriate minimum values and step sizes where appropriate
Separated settings into logical groups
Added helptext to the indicator settings noting usage and common settings values
Explicitly titled the on-chart plots of the ATR bands so that they can more easily be identified and referenced in other indicators/scripts, as well as the Data Window
Food for thought : When looking at some of the behaviors of these ATR bands, you can see that when price first levels out, you can draw a "consolidation zone" from the first peak of the upper ATR band to the first valley of the lower ATR band that price will generally respect. Look for price to break and close outside of that zone. When that happens, price will usually (but not always) make a notable move in that direction, which can be used as either a potential trigger or as an additional confluence with other indicators/price action.
Finally, while we have made what we feel are some noteworthy updates and enhancements to this indicator, and have every intention of continuing to do so as we find worthy opportunities for enhancement, credit is still due to the original author: AlexanderTeaH

4C Volume w/ Relative Volume at TimeThis is a Volume indicator that also shows Relative Volume at Time (RVOL).
The RVOL is easily visible as a background color, that changes between Low and High RVOL colors.
The RVOL portion of the indicator is a modified version of the 'Relative Volume At Time' indicator by Tradingview (which has been the best/most accurate RVOL indicator i have seen yet on Tradingview, and seems to closely match the how the "Zanger Volume" indicator works).
Elevated RVOL can be a very important criteria for trading , especially on lower time frames.
This indicator can be used as a simple filter when looking at charts to determine whether it should be traded or not, based on the RVOL.
Higher volume/participation relative to previous time periods can lead to better follow through of moves and price action, and can lead to trending conditions.
Lower RVOL can lead to choppy market conditions, with lower participation and follow through on chart patterns.
The RVOL portion of the indicator draws from the Tradingview 'Relative Volume At Time' indicator developed by authors @e2e4mfck and @LucF , for TradingView.
This indicator takes the Past Volume mark and changes it into a background color.
High RVOL = When the day's cumulative volume is greater than the Past Volume levels, then the background is painted Blue by default
Low RVOL = When the day's cumulative volume is lower than the Past Volume levels, then the background is painted Purple by default
See annotated examples in the chart Below, which compares/contrasts this new indicator with the RVOL indicator by Tradingview:
Portions of the 'Relative Volume At Time' indictor code have been removed to clean up the script.
Plans in the future are to remove more code were possible, to further refine the script and speed up the processing times for the indicator.
If anyone is able to strip out more and keep it functioning the same, please let me know.
Enjoy.
Credit also goes to author @LazyBear . Portions of the Volume indicator is adapted from - HawkEye Volume Indicator

Fusion: ATR Ranging using PercentileA simple (but improved on my first attempt) way to determine a ranging market.
The defaults are for a specific use of my own so by no means feel a need to use them, adjust as needed.
By default this sits on the main chart however if you want to see the lines behind the result make a copy and put the copy on it's own chart and then just check the "Show ATR" and "Show PLI" (Percentile Linear Interpolation) flags.
There is no reason for using a Hull MA over any other except that it's a preference of mine, that is, it's not for some magical reason I figured out. That said, the Hull is perhaps my favorite because of what I learned about it after quite a bit of research so take that as you will.
Credit to: "Hull Suite by InSilico" from which I used the HMAs.
The code is structured to easily drop into bigger system so use as a lone indicator or add to some bigger project you are creating. If you do add this to a bigger system please drop me a note as it's nice to know your system is being used in something greater.
Finally, if you find value please do make a comment, give thumbs up etc.
Enjoy and good luck!

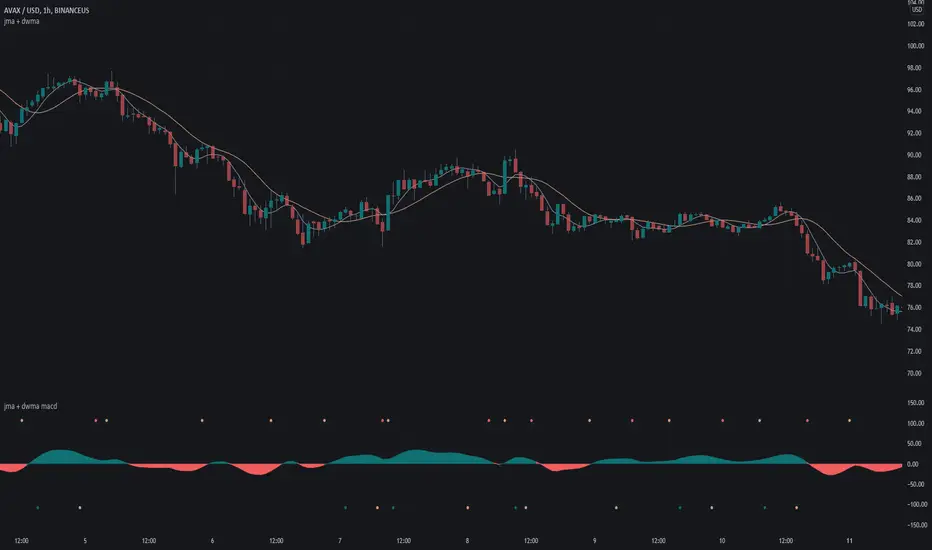
jma + dwma macdThis MACD system was originally conceptualized by Jurik Research and made public to the world on their website .
The indicator consists of the faster Jurik Moving Average ( JMA ) and the slower Double Weighted Moving Average (DWMA). A long signal (green dot at the bottom) is shown when the JMA line crosses above the DWMA line (indicating a possible reversal in trend). A short signal (red dot at the top) is shown when the JMA line crosses below the DWMA line. Take profit signals (tan dot at the top/bottom) are shown when the JMA line reverses directions. Alerts for signals are included in this indicator.
The default settings are not optimized for any timeframe.
For an overlay version of this script, please see the following:
Credit to @everget for the re-creation of the Jurik Moving Average in pinescript.
jma + dwma crossoverThis crossover system was originally conceptualized by Jurik Research and made public to the world on their website .
The indicator consists of the faster Jurik Moving Average (JMA) and the slower Double Weighted Moving Average (DWMA). A long signal is shown when the JMA line crosses above the DWMA line (indicating a possible reversal in trend). A short signal is shown when the JMA line crosses below the DWMA line. Take profit signals are shown when the JMA line reverses directions. Alerts for signals are included in this indicator.
The default settings are not optimized for any timeframe. Both JMA and DWMA lines are defaulted to hidden.
Credit to @everget for the re-creation of the Jurik Moving Average in pinecsript.

Strings█ OVERVIEW
This library provides string manipulation functions to complement the Pine Script™ `str.*()` built-in functions.
█ CONCEPTS
At the time our String Manipulation Framework was published, there was little in the way of built-in functions to manipulate strings. Since then, we have witnessed several meaningful developments on this front by the nimble Pine team. The newly released functions (including the ones in this blog post ) have deprecated most of our functions. This library captures the small handful of functions we think are still pertinent. It is worth noting that, thanks to the new string built-ins in Pine Script™, these functions greatly outperform their earlier counterparts, both performance-wise and because they can return values of simple form, which are a necessity in some circumstances, such as when used as arguments to some parameters of request.security() .
█ NOTES
`leftOf()` and `rightOf()`
Using the functions in this library is straightforward. The `leftOf()` and `rightOf()` functions extract the part of a string that is to the left or to the right of another string or character. This can be useful to separate the exchange and symbol components of user-entered tickers, for example. The separation is done with the underused str.match() , which can use regular expressions (or regex) to scan a string and separate characters based on a search pattern. The possibilities with regex are virtually endless; they can be used in “find and replace” applications, or to validate phone numbers, emails, passwords, credit card numbers, dates, etc. Note that Pine supports the same regex features as Java .
String operations in Pine Script™
The Pine Script™ runtime is optimized for number crunching. You can thus optimize script performance by limiting operations on strings whenever possible. This includes declaring strings with the var keyword, and containing re-assignments to local if blocks using barstate.islast , for example.
Look first. Then leap.
█ FUNCTIONS
leftOf(str, separator, occurrence)
Extracts the part of the `str` string that is left of the nth `occurrence` of the `separator` string.
Parameters:
str : (series string) Source string.
separator : (series string) Separator string.
occurrence : (series int) Occurrence of the separator string. Optional. The default value is zero (the 1st occurrence).
Returns: (string) The extracted string.
rightOf(str, separator, occurrence)
Extracts the part of the `str` string that is right of the nth `occurrence` of the `separator` string.
Parameters:
str : (series string) Source string.
separator : (series string) Separator string.
occurrence : (series int) Occurrence of the separator string. Optional. The default value is zero (the 1st occurrence).
Returns: (string) The extracted string.

MTF previous high and low quarter levelsDescription
An experimental script that prints quarter levels of the previous timeframe's high and low to the current timeframe. The idea is quite simple and is basically the Fibonacci pivoted on the previous high and low with quarter level settings (0,0.25,0.5,0.75,1 etc). The default setting is the previous daily high and low but can be customized on user discretion.
New quarter levels are printed after the close of the previous timeframe and open of the new timeframe (user's timeframe setting)
How To Use
Levels should not be used blindly. Levels can be used as confluence when aligned with high probability supply and demand zones, support, resistance, order blocks, and so on.
Credit to @HeWhoMustNotBeNamed for the Previous High/Low MTF indicator code and @mrbirman for the idea to put this together.

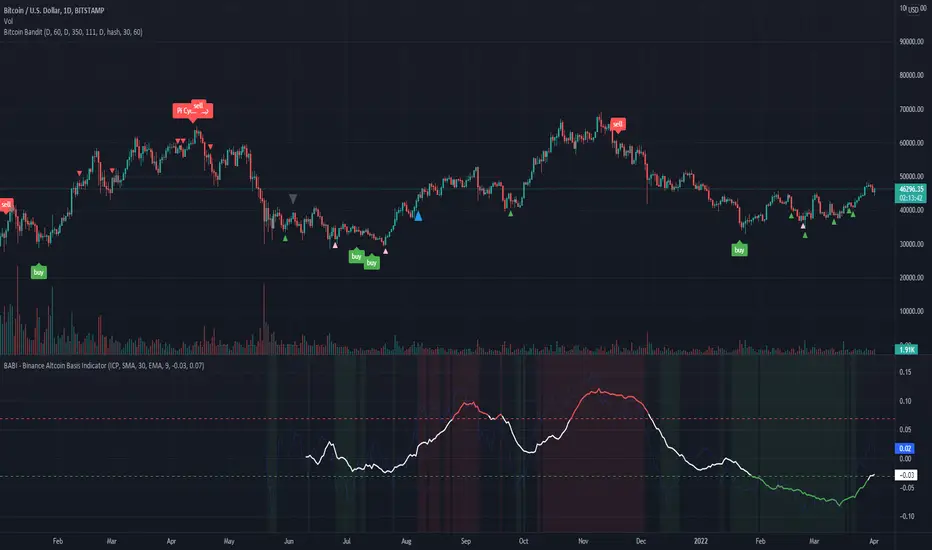
BABI - Binance Altcoin Basis Indicator
This indicator works by taking the basis between various altcoin perpetual futures contracts and spot market indexes on Binance, and then smooths out the data with a basic moving average.
The result is a useful oscillator that shows potential "buy" and "sell" areas.
Simply put, a spot premium is usually bullish and a derivatives premium is usually bearish.
Other versions of this indicator only worked for BTC and ETH, so I have extended its functionality to include popular altcoin trading pairs.
USDT Trading pairs included in this version:
•BTC
•ETH
•LTC
•ICP
•SOL
•LUNA
•GRT
•ATOM
•ADA
•XRP
•ETC
•AVAX
Default setting is BTC. To choose a different oscillator, go to settings and pick your desired crypto.
Thanks for looking. I think you could create a pretty basic trading strategy based on this indicator by simply placing buy and sell orders once the oscillator rises or falls below certain thresholds.
**Credit to @chestbrook on Twitter and Pinnacle_Investor on TradingView
Binance Basis Oscillator ()
Uptrend and Oversold Index Swing Trading System 8H--- Foreword ---
The Overbought and Oversold Index Swing Trading System or short: I11L Hypertrend primarily uses money management Strategies, EMA and SMA and my momentum Ideas for trying to produce satisfactory Alpha over a timespan of multiple years.
--- How does it Work? ---
It uses 20 different EMA's and SMA's to produce a score for each Bar.
It will credit one Point If the EMA is above the SMA.
A high score means that there is a strong Uptrend.
Spotting the strong Uptrend early is important.
The I11L Hypertrend System trys to spot the "UPTREND" by checking for a crossover of the Score(EMA) / Score(SMA).
A low score means that there is a strong Downtrend.
Its quite common to see a reversal to the mean after a Downtrend and spotting the bottom is important.
The System trys to spot the reversal, or "OVERSOLD" state by a crossunder of the Score(EMA) / Score(SMA).
--- What can i customize? ---
-> Trading Mode: You can choose between two different trading modes, Oversold and Overbought(trend) and Random Buys to check if your systems Profitfactor is actually better then market.
-> Work with the total equity: The system uses the initial capital per default for Backtesting purposes but seeing the maximum drawdown in a compounding mode might help!
-> Use a trailing SL: A TSL trys to not lose too much if the trade goes against your TP
-> Lookbackdistance for the Score: A higher Lookbackdistance results in a more lagging indicator. You have to find the balance between the confirmation of the Signal and the frontrunning.
-> Leverage: To see how your strategie and your maximum Drawdown with the total equity mode enabled would have performed.
-> Risk Capital per Trade unleveraged: How much the underlying asset can go against your position before the TSL hits, or the SL if no TSL is set.
-> TPFactor: Your risk/reward Ratio. If you risk 3% and you set the ratio to 1.2, you will have a TP at 3 * 1.2 = 3.6%
-> Select Date: Works best in the 8H Timeframe for CFD's. Good for getting a sense of what overfitting actually means and how easy one can fool themself, find the highest Profitfactor setting in the first Sector (Start - 2012) and then see if the second Sector (2012 - Now) produces Alpha over the Random Buy mode.
--- I have some questions about the System ---
Dear reader, please ask the question in the comment Section and i will do my best to assist you.

Strategy LinReg ST@RLStrategy LinReg ST@RL
Strategy LinReg ST@RL is a visual trend following indicator.
It is compiled in PINE Script Version V5 language.
This indicator/strategy, based on Linear Regression Calculation, is intended to help beginners (and also the more experienced ones) to trade in the right direction of the market trend and test strategy. It allows you to avoid the mistakes of always trading against the trend.
Strategy based on an original idea of @KivancOzbilgic (SuperTrend) and DevLucem (@LucemAnb) (Lin Reg ++)
A special credit goes to - KivancOzbilgic and @LucemAnb which inspired me a lot to improve this indicator/Strategy.
This indicator can be configured to your liking,according to your needs or your tastes.
The indicator/Strategy works in multi time frame.
The settings (length, offset, deviation, smoothing) are identical for all time frames if “Conf Auto” is not checked.
In this case the default settings (time frame=H1 settings) apply for all time frames.
The choice of source setting is common for all time frames.
If “Auto Conf” is checked,
then the settings will be optimized for each selected time frame (1m-3m H2 H3 H1 H4 & Daily). Time frames, other than 1m-3m H2 H3 H1 H4 & Daily will be affected with the default settings corresponding to the H1 time frame and will therefore not be optimized! The default setting values of each time frame (1m-3m H2 H3 H1 H4 & Daily) can be configured differently and optimized by you.
REVERSAL mode: Signal Buy=Sell and Signal Sell=Buy.
This option may be better than the regular strategy. Default mode is Reversal option.
Note that only for 1m (1 minute) Time frame, the option REVERSAL is opposite as default choice in configuration. (If reversal option is checked, then option for time frame 1m is not reversal!)
Trend indications (potential sell or buy areas) are displayed as a background color (bullish: green or bearish: red), assume that the market is moving in one direction.
You can tune the input, style and visibility settings to match your own preferences or habits.
Label Info (Simple or Full) gives trend info for each Exit (or current trade)
The choice of indicator colors is suitable for a graph with a "dark" theme, which you will probably need to modify for visual comfort, if you are using a "Light" mode or a custom mode.
This script is an indicator that you can run on standard chart types. It also works on non-standard chart types but the results will be skewed and different.
Non-standard charts are:
• Heikin Ashi (HA)
• Renko
• Kagi
• Point & Figure
• Range
As a reminder: No indicator is capable of providing accurate signals 100% of the time. Every now and then, even the best will fail, leaving you with a losing deal. Whichever indicator you base yourself on, remember to follow the basic rules of risk management and capital allocation.
BINANCE:BTCUSDT
! Français !
Strategy LinReg ST@RL
Stratégie LinReg ST@RL est un indicateur visuel de suivi de tendance.
Il est compilé en langage PINE Script Version V5.
Stratégie basée sur une idée originale de @KivancOzbilgic (SuperTrend) et DevLucem (@LucemAnb) (Lin Reg ++) Un crédit spécial va à - KivancOzbilgic et @LucemAnb qui m'ont beaucoup inspiré pour améliorer cet indicateur/stratégie.
Cet indicateur/strategie, basé sur le calcul de régression linéaire, est destiné à aider les débutants (et aussi les plus expérimentés) à trader dans le bon sens de la tendance du marché et à tester la stratégie. Cela vous permet d'éviter les erreurs de toujours négocier à contre-courant.
Cet indicateur peut être configuré à votre guise, selon vos besoins ou vos goûts.
L'indicateur/Stratégie fonctionne sur plusieurs bases de temps.
Les réglages (longueur, décalage, déviation, lissage) sont identiques pour toutes les bases de temps si
« Conf Auto » n'est pas coché. Dans ce cas, les paramètres par défaut (intervalle de temps=paramètres H1) s'appliquent à toutes les bases de temps.
Le choix du réglage de la source est commun à toutes les bases de temps.
Si "Auto Conf" est coché, alors les paramètres seront optimisés pour chaque base de temps sélectionnée (1m-3m H2 H3 H1 H4 & Daily). Les bases de temps, autres que 1m-3m H2 H3 H1 H4 & Daily seront affectées par les paramètres par défaut correspondant à la base de temps H1 et ne seront donc pas optimisées ! Les valeurs de réglage par défaut de chaque période (1m-3m H2 H3 H1 H4 & Daily) peuvent être configurées différemment et optimisées par vous.
Mode REVERSAL : Signal Achat=Vente et Signal Vente=Achat. Cette option peut être meilleure que la stratégie habituelle. Le mode par défaut est l'option REVERSAL.
Notez que seulement pour la base de temps de 1m (1 minute), l'option REVERSAL est l’opposée du choix par défaut dans la configuration. (Si l'option REVERSAL est cochée, alors l'option pour la base de temps 1 m n'est pas REVERSAL !)
Les indications de tendance (zones potentielles de vente ou d'achat) sont affichées en couleur de fond (haussier : vert ou baissier : rouge), supposons que le marché évolue dans une direction. Vous pouvez ajuster les paramètres d'entrée, de style et de visibilité en fonction de vos propres préférences ou habitudes.
Les informations sur l'étiquette (simples ou complètes) donnent des informations sur de chaque clôture (ou position en cours)
Le choix des couleurs des indicateurs est adapté à un graphique avec un thème "sombre", qu'il vous faudra probablement modifier pour le confort visuel, si vous utilisez un mode "Clair" ou un mode personnalisé.
Ce script est un indicateur que vous pouvez exécuter sur des types de graphiques standard. Cela fonctionne également sur les types de graphiques non standard, mais les résultats seront faussés et différents.
Les graphiques non standard sont :
• Heikin Ashi (HA)
• Renko
• Kagi
• Point & Figure
• Range
Pour rappel : Aucun indicateur n'est capable de fournir des signaux précis 100% du temps. De temps en temps, même les meilleurs échoueront, vous laissant avec une affaire perdante. Quel que soit l'indicateur sur lequel vous vous basez, rappelez-vous de suivre les règles de base de la gestion des risques et de l'allocation du capital.

[TTI] All-time-high (ATH), (ATL), 52 week high and low Dots––––History & Credit
I wanted to show our community the idea that stocks that make All Time High are likely to continue making ATHs for some time. It goes contrary to the idea "buy cheap sell high". Actually, in the real market leaders the stocks that make 100+% return are just getting started on returns to few THOUSAND percent. I have used code from QuantNovad scrip in this one too. So thanks to him as well, since it speeded writing it from scratch!
–––––What it does
The script paints dots and shows stats.
The dots are 4 types:
🟢 = Every time a new ATH is achieved, a green dot paints above the bar
🟣 = Every time a new 52week High is achieved, a purple dot paints above the bar
🟡 = Every time a new ATL is achieved, a yellow dot paints below the bar
🟠 = Every time a new 52week Low is achieved, a orange dot paints below the bar
Stats =
Show in a box in the bottom right corner of the screen. How many times has this stock achieved:
👉 ATHs
👉 52WK High
👉 ATLs
👉 52WK LOW
–––––How to use it
This is really an illustrative script to get the idea of the methodology "buy high sell higher', that we teach as momentum traders.
Some notable examples to check are:
HOOD
MSFT
TSLA
AAPL
See the stock dynamics and understand that bottom fishing doesn't result in stocks making massive moves.

Top 5 Power Momentum IndicatorHow I Never Trade Against the Trend
"Today I want to reveal another amazing tool in my arsenal when it comes to intraday trading. Now this is only for intraday time frames and not for swings or anything longer than few minutes to few hours ."
from Tic Tock Trading Substack
credit to Vincente

Up Volume vs Down VolumeCalculating NYSE Up Volume (UPVOL.NY) vs NYSE Down Volume (DNVOL.NY). The triangles appear when the ratio exceeds 90% in either direction.
Also has the option to switch to NQ, US, DJ, AM, or AX tickers.
Credit to @MagicEins for the original script:

harmonicpatternsarraysLibrary "harmonicpatternsarrays"
Library provides an alternative method to scan harmonic patterns and contains utility functions using arrays.
These are mostly customized for personal use. Hence, will not add documentation for arrays. All credit to @HeWhoMustNotBeNamed
getLabel()
delete()
delete()
delete()
delete()
delete()
pop()
pop()
pop()
pop()
pop()
shift()
shift()
shift()
shift()
shift()
unshift()
unshift()
unshift()
unshift()
unshift()
unshift()
unshift()
unshift()
unshift()
unshift()
clear()
clear()
clear()
clear()
clear()
push()
push()
push()
push()
push()
push()
push()
push()
push()
push()
get_trend_series()
getrange()
getSupportedPatterns()
scan_xab()
scan_abc_axc()
scan_bcd()
scan_xad_xcd()
get_prz_range()
isHarmonicPattern()

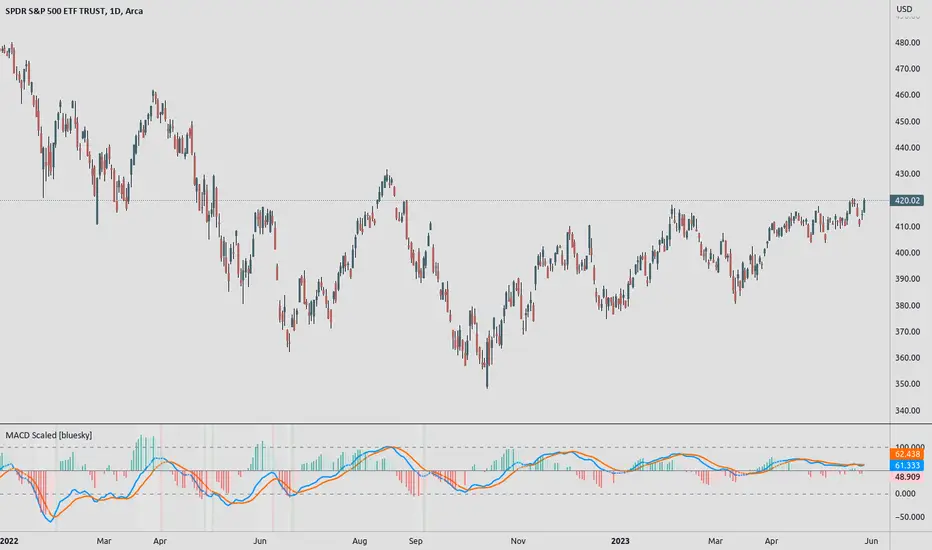
MACD ScaledMACD scaled and re-centered for 0-100 range (user adjustable)
+ Leader
+ Stochastic RSI
Details: A simple MACD re-centered to 50 lines rather than 0 line. Also added MACD Leader and Stochastic RSI to show possible usefulness of re-scaling the MACD.
NOTE: Due to nature of MACD, could not get the lines cannot be contained within top/bottom borders without excess distortion.
Credit to lazybear for leader formula.
Cowen CorridorI'm reposting the Cowen Corridor that was originally developed by Benjamin Cowen of "Into the Cryptoverse"
This indicator was originally developed by Ben publicly on stream. It may be used to predict upper and lower bound limits for the price of Bitcoin .
I've set up this indicator for it to be used on the weekly timeframe as was intended.
The indicator plots in any BTCUSD spot, futures , BLX index and BTCEUR .
It paints in all time frames, but Weekly time frame is the correct one to interpret the 'official' read of it.
For that reason, I've enabled by default an option that forces the indicator to display on the Weekly value even though the time frame could be higher or lower.
Credit for this idea goes to Benjamin Cowen: @intocryptoverse

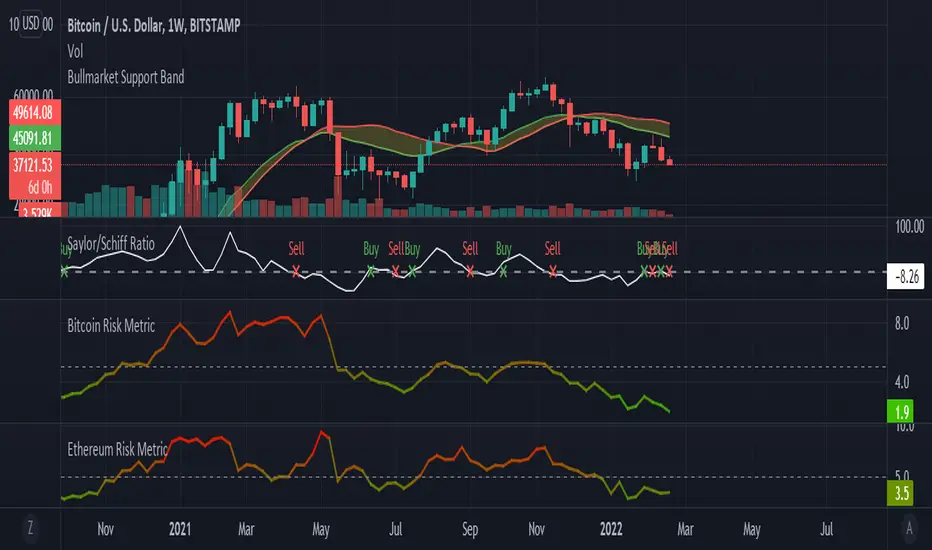
Saylor to Schiff RatioI'm reposting the Saylor to Schiff Ratio indicator that was originally developed by Michael Silva
This indicator may be used to predict key momentum shifts in the price of Bitcoin
I've set up this indicator for it to be used on the weekly timeframe as was intended.
The indicator plots in any BTCUSD spot, futures , BLX index and BTCEUR .
It paints in all time frames, but Weekly time frame is the correct one to interpret the 'official' read of it.
For that reason, I've enabled by default an option that forces the indicator to display on the Weekly value even though the time frame could be higher or lower.
Credit for this idea goes to Michael Silva: @mikepsilva
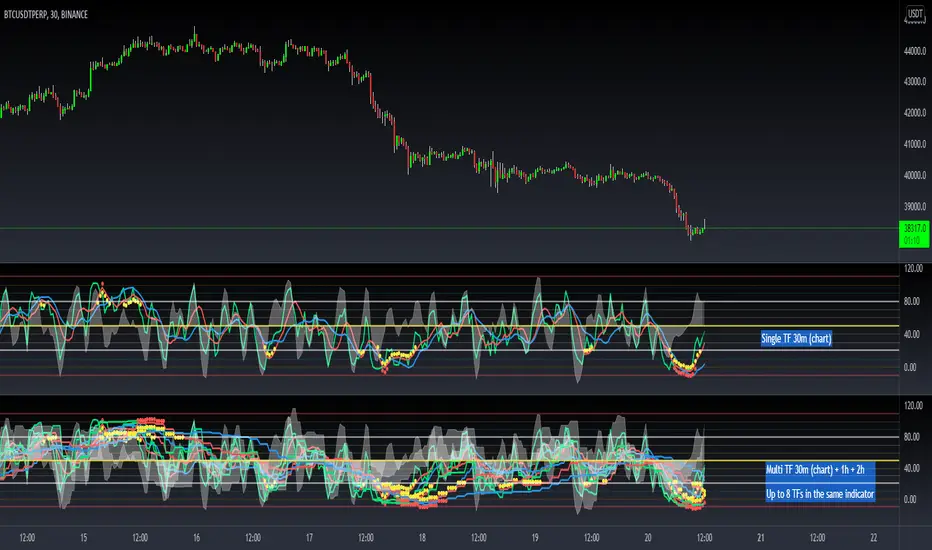
[Dipiers] Phoenix MTF v2.1This indicator is a modified (Multi Timeframe) version of the Phoenix Ascending that you can find between the @WyckoffMode scripts and it follows the same rules at the moment of the pubblication.
A special thanks to @Neuromantic that did a great part of the MTF coding and to @HedgeMode for the "real-time" idea to make the ongoing candle visibly different to always remember that it hasn't closed yet.
The chart TF must be the lowest between all the ones analysed.
The value of the higher TFs candles are the ones at the last close so to avoid repainting.
It is best used applying no more than a couple of TFs each chart so to have a better view of the races, you can apply the indicator multiple times to have a good view of the different TFs.
If you are using the code remember to give credit to the persons have worked on it.
3 Candle Strike StretegyMainly developed for AMEX:SPY trading on 1 min chart. But feel free to try on other tickers.
Basic idea of this strategy is to look for 3 candle reversal pattern within trending market structure. The 3 candle reversal pattern consist of 3 consecutive bullish or bearish candles,
followed by an engulfing candle in the opposite direction. This pattern usually signals a reversal of short term trend. This strategy also uses multiple moving averages to filter long or short
entries. ie. if the 21 smoothed moving average is above the 50, only look for long (bullish) entries, and vise versa. There is option change these moving average periods to suit your needs.
I also choose to use Linear Regression to determine whether the market is ranging or trending. It seems the 3 candle pattern is more successful under trending market. Hence I use it as a filter.
There is also an option to combine this strategy with moving average crossovers. The idea is to look for 3 candle pattern right after a fast moving average crosses over a slow moving average.
By default , 21 and 50 smoothed moving averages are used. This gives additional entry opportunities and also provides better results.
This strategy aims for 1:3 risk to reward ratio. Stop losses are calculated using the closest low or high values for long or short entries, respectively, with an offset using a percentage of
the daily ATR value. This allows some price fluctuation without being stopped out prematurely. Price target is calculated by multiplying the difference between the entry price and the stop loss
by a factor of 3. When price target is reach, this strategy will set stop loss at the price target and wait for exit condition to maximize potential profit.
This strategy will exit an order if an opposing 3 candle pattern is detected, this could happen before stop loss or price target is reached, and may also happen after price target is reached.
*Note that this strategy is designed for same day SPY option scalping. I haven't determined an easy way to calculate the # of contracts to represent the equivalent option values. Plus the option
prices varies greatly depending on which strike and expiry that may suits your trading style. Therefore, please be mindful of the net profit shown. By default, each entry is approximately equal
to buying 10 of same day or 1 day expiry call or puts at strike $1 - $2 OTM. This strategy will close all open trades at 3:45pm EST on Mon, Wed, and Fri.
**Note that this strategy also takes into account of extended market data.
***Note pyramiding is set to 2 by default, so it allows for multiple entries on the way towards price target.
Remember that market conditions are always changing. This strategy was only able to be back-tested using 1 month of data. This strategy may not work the next month. Please keep that in mind.
Also, I take no credit for any of the indicators used as part of this strategy.
Enjoy~

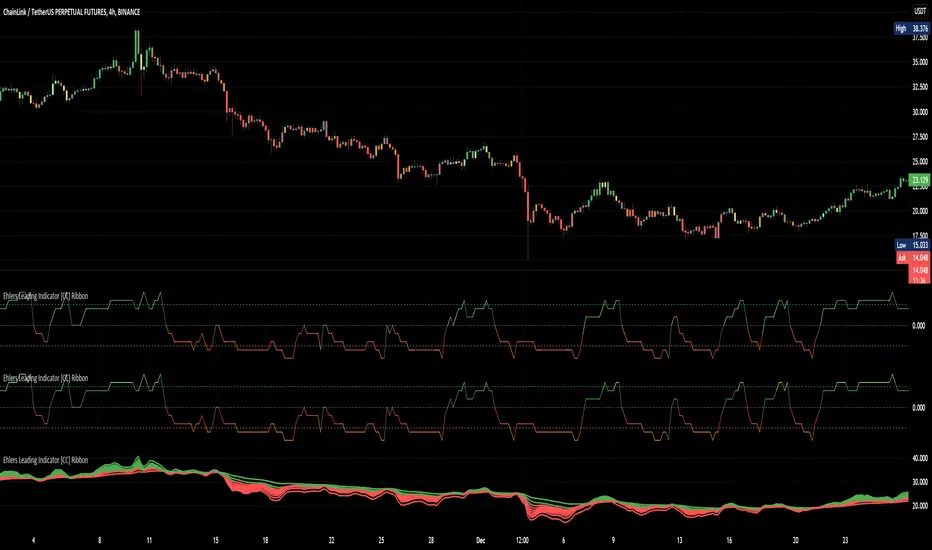
Ehlers Leading Indicator [CC] RibbonQuoted from Cheatcountry : “The Leading Indicator was created by John Ehlers (Cybernetic Analysis For Stocks And Futures pg 235) and as the name implies, this is a leading indicator that provides super early signals. Feel free to change the alpha values to adjust to your needs. Buy when the indicator line is green and sell when it is red.”
His original script:
This is a mod of Cheatcountrys script. I put it into a function and plotted several and implemented a tally of all.
Credit to him and John Ehler. Published with permission.
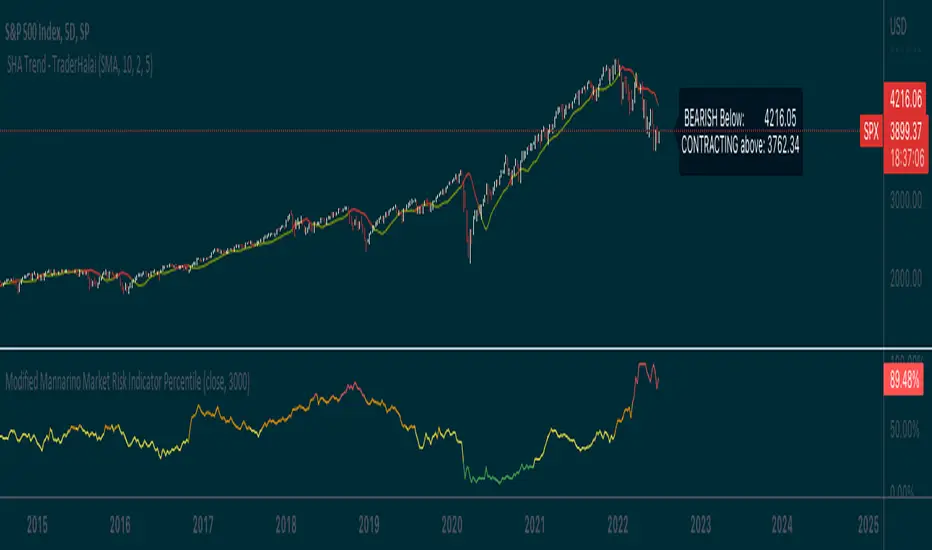
Modified Mannarino Market Risk IndicatorThis indicator is meant to give an overall indication of risk and a very basic implementation of the modified mannarino market risk indicator. I take no credit for the original formula, and just decided to hack this together so that it could be useful to the community
FX Mini-Day/Index Dividers V2This is a combination of the Mini-Day Separator Indicator, timings based off the research by Tom Henstridge/@LiquiditySniper and additional Index KZ delineations, based on ICT's 2022 Youtube Mentorship.
*It borrows some minor code from Enricoamato997 . Credit where it is due!
This is a joint effort by myself, @vbwilkes / Offseason Vince and @Tom_FOREX / TraderTom on the Index/Index Future portion.
Index Future Example
Forex Example
