Dual Weis Wave VolumeIt took but left, a Weis wave volume that shows the main wave and the fractal wave, thinking of everyone who wants to save space with indicators, you can adjust 2 indicators within 1, it is the dual indicator.
This indicator calculates the volume waves, being created initially by David Weis, largely behind the wyckoff method that unfortunately died, being very useful in reading flow, replacing even Times in Trades in Tape Reading, since he makes the information more accurate visually.
The novelty is the addition of a fractal flow, that is, if the main one misses an information, the fractal will show, in addition to saving space to add another indicator and not the same with other values.
스크립트에서 "Fractal"에 대해 찾기

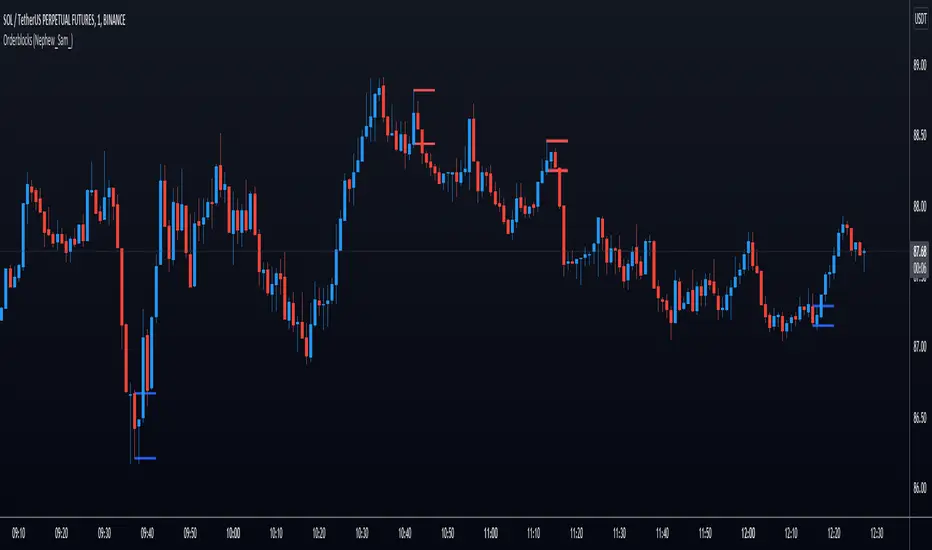
Orderblocks (Nephew_Sam_)Highlights orderblocks based on fractal market structure.
Whenever a new fractal high/low is created, it will search for the Orderblock and plot lines and labels
Note: this indicator does not have an option to delete once filled.
Options:
1. Select 3/5 bar fractal
2. Plot lines and labels on OB's
- Ability to filter OB only when a candle is fully engulfed
3. Change bar color of engulfed candles
Fibonacci Disciples Auto Levels (ES/NQ/GC/NQ WIDE) - APPROVEDPVTEvery Index, every ETF , every sector started somewhere.
That starting point defines Zones that follow that Index, or ETF forever.
What i am saying is - everything you are trading has a pre-defined range of movement that was established when the stock Index became available to the market.
It is this range that defines specific levels that will always play a significant part in the movement of that stock, or Index for its entire lifespan.
This script will automatically multiply that original price range to the stock or index’s current real time value using Fibonacci sequence and a proprietary pre-calculated Fibonacci formula to draw custom Golden Ratios on your chart in real-time. Each gold line represents a new “Golden Ratio” that is, or has already emerged as price moves up and down.
This phenomenon becomes possible by sealing the gaps between Fibonacci Fractal retracements making each gold line a measured .618:1.618 Golden Ratio.
Having these unique Golden Ratios displayed automatically on your chart allows you as the Trader to always have a price target in mind rather than having to guess where price might be headed on a naked chart.
From there you are welcome to add your favorite moving average or any other tool you wish to help determine the overall direction of the trend whilst using these Golden Ratio targets for scalping opportunities. If you do not know how to identify fractal W’s and M’s may I suggest you utilize a public Williams Fractal tool to accompany this indicator script.
Due to the scalping nature of this tool it will be best used on all time frames from 1min up to 4hrs.
Each measured line is customizable to your liking. If you wish to see less you can unclick individual measurements. I suggest leaving the “Baseline” and each “.618%” line active.
You can also change the color of the lines if you wish.
If you would like access to this script you can either DM me on TradingView

FilthyIchiEMAXIchiEMAX has been backtested giving some great results, using Ichimoku and a mix of EMA'S/SMA .
I use this for both Cryptocurrency and Forex Trading.
Ema/SmaX system i have studied and have found it is giving me the results i want very similar to all the wave trend indicators being used currently. I have now adde buy/sell signals on crosses and williams fractal.

(JS) Ultimate RSISo my goal here was to combine all of my RSI ideas into a single indicator in order to make kind of a "Swiss Army Knife" version of the Relative Strength Index ...
------------------------------------------------------------------------------------------------------------------------------------------------------------------------------------------------------------------------------------------------------------------
So, let's begin with the first RSI indicator I made, which is the RSIDVW (Divergence/Volume Weighted);
To rephrase my original post, the "divergence/volume weighted" portion is meant to expand upon the current RSI format by adding more variables into the equation.
The standard RSI is based off one value that you select (open, close, OHLC4, HLC3, etc.) while this version takes three variables into account.
The default setting is to have RSI normal without anything added to it (Divergence Weight = 0)
1st - it takes the standard variable that RSI normally uses.
2nd - it factors RSI divergence by taking the RSI change % and price change % to form a ratio. Using this ratio, I duplicated the RSI formula and created a divergence RS to be factored in with the standard price RS .
3rd - it takes Relative Volume and amplifies/weakens the move based upon volume confirmation. (So if Relative Volume for a price bar is 1.0, the RSI plot would be the same as it normally would)
So to explain the parameters
- Relative Volume Length: This uses the RV length you specify to determine spikes in volume (or lack of volume ), which then is added into the formula to influence the strength of the RSI move
- RV x Divergence: This is how I calculated the original formula, but you can leave this unchecked to turn Relative Volume off, or apply elsewhere.
- RV x RS: There's two sides, Divergence RS and Standard RS - these check marks allow you to select which part you prefer to be multiplied by Relative Volume .
Checking neither turns off Relative Volume , while checking both amplifies its effects by placing it on both sides of the equation.
-Divergence Weight: This controls how much the DVW portion of the formula influences the RSI plot. As I referred to earlier, default is 0 making RSI normal. The Scale is 0-2, so 1.0 would be the same as 50%.
When I do have DVW on, I generally set it to 0.5
-SMA Divergence: To smooth, or not to smooth, that is the question. UJsing an SMA here is much smoother in my opinon, but leaving it unchecked runs it through an RMA the same way standard RSI is calculated.
-Show Fractal Channel: This allows you to see the whole fractal channel around the RSI (This portion of the code, compliments of the original Ricardo Santos fractal script)
------------------------------------------------------------------------------------------------------------------------------------------------------------------------------------------------------------------------------------------------------------------
The next portion of the script is adding a "Slow RSI"...
This is rather simple really, it allows you to add a second RSI plot so that you can watch for crossovers between fast and slow lines.
-Slow RSI: This turns on the second RSI Plot.
-Slow RSI Length: This determines the length of the second RSI Plot.
------------------------------------------------------------------------------------------------------------------------------------------------------------------------------------------------------------------------------------------------------------------
Pivot Point RSI was something a friend of mine requested I make which turned out pretty cool, I thought... It is also available in this indicator.
-Pivot Points: Selecting this enables the rest of the pivot point related parts of the script
If Pivot Points isn't selected, none of the following things will work
-Plot Pivot: Plots the pivot point .
-Plot S1/R1: Plots S1/R1.
-Plot S2/R2: Plots S2/R2.
-Plot S3/R3: Plots S3/R3.
-Plot S4/R4: Plots S4/R4.
-Plot S5/R5: Plots S5/R5.
-Plot Halfway Points: Plots a line between each pivot .
-Show Pivot Labels: Shows the proper label for each pivot .
When using intraday charts, from a 15 minute interval or less the pivots are calculated based on a single days worth of price action, above that the distance expands.
Here are the current resolutions Pivot Points will work with:
Minutes - 1 , 2, 3, 5, 10, 13, 15, 20, 30, 39, 78, 130, 195
Hours - 1, 2, 3, 4, 5, 6
Daily
Weekly
Currently not available on seconds or monthly
------------------------------------------------------------------------------------------------------------------------------------------------------------------------------------------------------------------------------------------------------------------
Background Colors
Background Colors: I have six color schemes I created for this which can be toggled here (they can be edited).
Gray Background for Dark Mode: Having this on looks much better when using dark mode on your charts.
------------------------------------------------------------------------------------------------------------------------------------------------------------------------------------------------------------------------------------------------------------------
Now finally the last portion, Fibonacci Levels
-Fibonacci Levels: This is off, by default, which then uses the standard levels on RSI (30-50-70). When turned on, it removes these and marks fib levels from 0.146 through 0.886.
------------------------------------------------------------------------------------------------------------------------------------------------------------------------------------------------------------------------------------------------------------------
So the quick rundown:
Ultimate RSI contains "divergence/volume weighted" modifications, a slow RSI plot, pivot points , and Fibonacci levels all while auto-plotting divergence and having the trend illustrated in the background colors.
RSI has always been my "go to" indicator, so I hope you all enjoy this as much as I do!

GA - Momentum DivergencesGA Momentum Divergences Script highlights Trend Strength, Overbought-Oversold Conditions, Regular-Hidden Divergences. Besides, it shows the Buying-Selling Pressure.
The practical use of any Momentum Curve helps in the comprehension of:
Supply-Demand Absorption.
Thrusts and their shortening.
The reversing and the continuation of the trend.
True Strength of the Trend.
Price Strength.
Increase and Decrease in Buying-Selling Pressure.
You choose which curve to show, according to your needs. There are 2 groups of curves.
Momentum Curves
GA Momentum.
Commodity Channel Index ( CCI ).
Relative Strength Index ( RSI ).
Stochastic %K.
True Strength Indicator ( TSI ).
Money Flow Curves
GA Money Flow.
Chaikin Money Flow.
Money Flow Index.
Every Curve used in this script has 0 as center. This means that RSI and Stochastic Curves wave around 0 and not around 50.
Fractal Algorithm for Pivots and Divergences
GA Momentum script highlights Divergences. This is possible by the Fractal Calculation of Pivot Points .
The sensibility of the algorithm depends on the look back and on the look forward of pivot points . This means that it does not highlight every divergence. But it marks divergences according to settings.
Besides, the interpretation of those divergences depends on the experience of the trader.
This feature has a particular use for the purpose to simplify and optimize. Besides, it is a very important feature provided by the GA Money Flow script.
Regular and Hidden Divergences highlight the weakening and strengthening of the price behavior. They give an anticipation to price changing. Besides, they enforce the judgment on the condition that marks the price continuation.
The Fractal Algorithm can also mark a Channel. This happens enveloping the Curve between its marked pivot points .
Flags and lines mark Divergences in the Curve. GA Momentum Divergences highlights Regular Divergences and Hidden Divergences.
Price and Momentum, Volume and Money Flow
The GA Momentum script works with any marketplace. It uses price variations and volume variations, according to needs and market.
Every curve available in the script is a mathematical discretization of the market. But in those marketplaces that includes the volume you can use Money Flow Curves. Where the volume is missing the Money Flow Curves return zero. In this case, a Momentum Curve is the right choice because it uses the price variations.
GA Momentum and GA Money Flow are formulas built for this script. They include several peculiarities that are a privilege of other functions. This gives a better visual impact by their practical use.
TSI Curve or RSI Curve are the right choices to replace Money Flow Curves where the volume is not available. In the same way, RSI Curve can replace the TSI Curve for the Trend Strength. Then, the RSI Curve is universal. It works on any marketplace giving a lot of information, using it in the right way.
RSI is a slow curve. It waves above and below the middle line, according to the bullish and bearish trend . This is why it incorporates the Trend Strength in its calculation.
Instead, other choices give Faster Momentum Curves that give different advantages and peculiarities. The final result and purpose do not change.
Market Conditions
Overbought and Oversold Conditions could not cause the immediate reversing of the trend. The changing occurs according to Thrusts and their shortening.
This happens by one or more rebounds in the price action. Indeed, this marks hesitation to continue the advancing or the declining of the price.
The Momentum Curve can highlight the absorption of Supply Pressure and Supporting Demand. This precedes the Climactic Point so as a Thrust during the advancing or declining of the price.
True Strength and Money Flow curves follow the trend. They show where the trend is weakening or strengthening.
When these curves rise together with the trend, this confirms the trend. Instead, when these curves hesitate, they are marking a changing.
TSI and Money Flow have advantages. They show the continuation of the trend by its positive or negative value. Besides, they show the shortening of the trend. Moreover, the curve anticipates the shortening of the thrust.
Money Flow Curves highlights the prevailing of Buying Pressure of Selling Pressure. This is possible because their formulas includes the volume . But the TSI discretization that uses prices, works giving a fair result.
This returns an unconditional conclusion. The volume has a high relevance because of the correlation between effort and result. But despite this, the mathematical discretization of the market can work without it.
Short and Long Signal Lines
The GA Momentum plots 2 extra curves to support the market momentum interpretation. They are Exponential Moving Average applied to the momentum curve.
The Short Signal Line follows the main curve and it gives the first crossing for an entry signal. Of course, this is useful only when there are the right condition for an entry point.
Instead, the Long Signal Line exists to be a trending indicator. When the main curve is approaching it, rebounds, the shortening of the thrust, can mark a changing. Following the thrust, these curves become closer and closer for some waves. This becomes better visible by the plotting of the Histogram.
The Histogram shows the difference between the main curve and the Long Signal Line. The distance between those curves becomes relevant and helpful in many circumstances. This highlights the changing in the Strength or Weakness of the trend.
Short and Long Signal Curves can have a partial plotting. This reduces the impact of those curves on screen. The script can show them only when they give a relevant visual impact for the trading practice.
Coloring
GA Momentum Script colors curve and price bars. It highlights conditions where the price is Overbought or Oversold. But it highlights also divergences with labels and colored lines.
The script plots colors on bars with extended prices. Besides, the script plots colors on bars that are the ending of divergences
GA Momentum script colors the price bars using the same criteria applied to color curves. Color used on the Curve are the same used on the price bars.
True Strength Curve and Momentum Curves color price bars. This happens for the entire Trend Strength. Then the prevailing of the Buying Pressure or Bearish Pressure is also visible on bars. This occurs by the persistent green or red colors according to Pressure and Trend.
Alerts
GA Momentum provides 2 alerts for Bearish and Bullish Signals. Both uses the crossing of Short and Long Signals in the same direction.
Note: I restrict access to the tool.
Regards
Girolamo Aloe
Founder of Profiting Me

TRI-IWBADT (PA) 2.0Put together by a TRI site member (ty Peter), this script changes your background color depending on higher time frame Institutional MA bias (9ema vs 18ema). If all three are pointed up then a green background is displayed. If all three are down then a red background is displayed. Various other colors are displayed on other conditions.
Once a background has changed to either green or red, IWBDT model then hunts every fractal off the LTF (15m ideal) chart. Take every fractal (enter on confirmation of fractal and risk to break of it). Profits are to be taken at a 2:1 r/r ratio and stops can only be moved (to break even) if/when half of the 2:1 move have been realized.
This script is for private use only (by invite) and should meet TradingView's publication requirements (if not please advise on what needs changing)
Brian

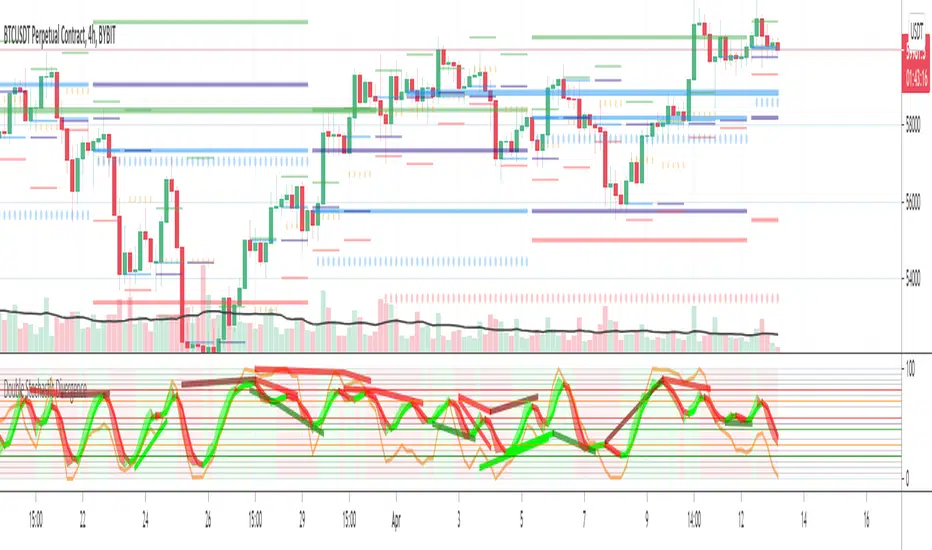
Double Stochastic DivergenceSame as my protected script but you can now see the code
This Study plots divergences and overlays a second %K as a fractal and changes the color of %D for the non fractal
Option to use Stochastic RSI for Fractal
Background Shading according to trend
Feel Free to change the indicator values to suit your style / system
The divergence script is thanks to @RicardoSantos, I've just adjusted it to suite my indicator
Remember that divergences work best when traded with the trend or very late in a trend when going against the trend
Common value for %K is 5, I have chosen 3 as it gives faster entries when using multiple time frames
If you are not using a momentum indicator as a trailing stop and using only cycle indicator
then I would recommended %K be 4 for exits
TB!Guppy,Fib GMMA, VWap Resistance, Liquidity PoolThis is an assistive chart for the TB! Fibonacci Elliot Wave Oscillator indicator
It incorporates Fib Based fractalized GMMA , Liquidity Pool Theory and VWap based resistance zones.

Multi Time Frame Williams Alligator H1M5specifically for fractalist scalpers; apply H1 MTFWA on M5 chart.

Momentum MultiTimeFrame + EMA SMA SignalsThis combines multiple ideas and indicators into one script.
This can be used for all time frames minutely, daily, weekly etc.
Relies heavily on EMA(8) and EMA(15) and looks at SMA(50) and SMA(200) levels at times.
It also gives an indication of next higher level momentum (Custom Time Frame - Ideally should be next level than selected time fractal.) momentum with thick Lines and Daily (21) trend with thin lines.
There's an option to Hide/Display Exit Short labels (hidden by default). Also, an option to display/Hide Weaker Buy Signal (Enabled by default).
Exit Long (Ex-L) can't be configured to hide as each Ex-L indicator is important and will help in exiting the trade.
Roadmap:
Include Ex-L signal below EMA(3) when gap is more between EMA(8) and EMA(3)
Include Candle stick lower wicks to indicate strong Buy Signals.
FRAMA (Ehlers true modified calculation)Credit goes to Shizaru for the original calculation. I made just a few fixes, so that the calculation is really that of Ehlers.
Fixed H2 and L2 period, fixed w natural logarithm
Body Close Continuity & failure Backtesting @MaxMaseratiThis indicator, is a highly advanced institutional-grade tool designed to track the "lifespan" of a trend based on Body Close (BC) sequences.
Unlike basic indicators that just show direction, this script analyzes the structural integrity of a trend by monitoring how many candles continue the move before a "Touch" (retest) or a "Break" (failure) occurs.
The Continuity & Failure Stats indicator tracks sequences of Bullish Body Closes (BuBC) and Bearish Body Closes (BeBC). It measures three critical phases: Building (pure momentum), Touching (price retesting the low/high of the sequence), and Resumption (price continuing the trend after a retest). It provides a statistical distribution of how long these "buildings" typically last before failing, allowing traders to know exactly when a trend is overextended.
This comprehensive analysis blends the statistical breakdown of the Continuity & Failure Stats indicator to provide a deep understanding of the structural momentum for the S&P 500 E-mini (ES1!) on a 4-hour timeframe.
1. Extensive Table Breakdown
A. Building Distribution (Left Table): The Fatigue Gauge
This table acts as a histogram of momentum, tracking the "Building Count"—the number of consecutive candles closing in a trend without price returning to its origin.
Count Column: Represents the streak length (e.g., 1, 2, or 3 candles).
Touch Column: Shows how many times a streak was interrupted by a retest ("touch") but remained structurally intact.
Break Column: Counts total structural failures where price closed beyond the sequence's anchor.
Data Insight: For BuBC, 92 sequences reached Count 1, but only 28 remained by Count 4. This reveals a steep momentum decay after the 3rd candle, establishing a "Statistical Wall" where only 2 sequences in history reached a count of 9.
B. MMM Summary Stats (Top Right): The Mathematical DNA
This table provides the "Expected Value" and behavior of a trend over the lookback period.
Avg Building (2.39 for BuBC): On average, a bullish move lasts ~2.4 candles of pure momentum before a retest or reversal occurs.
Avg Touches (0.8): This low number indicates "clean" trends that rarely wobble back to retest levels multiple times before reaching a conclusion.
Avg R Cycles (0.55): This suggests that once a bullish trend is interrupted, it only successfully resumes its momentum about half the time.
Max R Count (1): Typically, once a trend is "touched," it only manages one more push before failing.
C. Multi-Timeframe (MTF) Quick Stats (Bottom Right): Trend Weight
This compares the 4H chart against other layers of the market to identify "global" alignment.
Sample Comparison: There are 3,594 tracked BuBC sequences on the 4H compared to only 142 on the Weekly chart.
Fractal Law: The Avg Building (2.4) is consistent across several timeframes, implying that the "Rule of Three" (momentum fading after 3 candles) is a fractal characteristic of this asset.
2. Table Comparison: Synthesizing the Data
To trade effectively, you must compare Distribution (timing) against Summary Stats (averages):
Continuity vs. Failure: The Summary Stats show an average building of 2.39. When checking the Distribution table at Count 2, the "Break" count (58) is already high relative to the "Total". This confirms that the risk of failure increases exponentially the moment you exceed the average.
Momentum vs. Mean Reversion: Distribution tells you when a trend is "tired". If the 4H is at a "Building Count 4" (statistically overextended) while the Weekly chart is at "Building Count 1" (fresh momentum), you may choose to prioritize the higher timeframe's strength despite the local overextension.
3. Strategic Summary & Application
This indicator proves that market momentum follows a predictable "Building" cycle rather than an infinite streak.
The "Rule of Three" for ES1! 4H:
The Entry Zone (Momentum Start): The most profitable entries occur at Building Count 1. Statistically, you have a high probability of reaching a count of 2 or 3.
The Exit Zone (Momentum Limit): Take profits or tighten stops at Count 3. The data shows the sample size drops by nearly 50% between Count 3 and Count 4.
The "Touch" Rule (Retest Reliability): If price returns to the sequence low (a "Touch"), do not expect a massive continuation. The Max R Count of 1 tells us that resumptions are usually short-lived.
Danger Zone: Entering at Building Count 4 or higher is statistically dangerous, as the "Break" probability significantly outweighs the "Touch" or continuation probability.

Bassi Enhanced Next Candle Prediction with Neural Network & SMCOverview
This advanced all-in-one indicator combines machine learning-based next candle direction prediction with comprehensive Smart Money Concepts (SMC/ICT) tools, classic technical indicators, and visual aids for price action traders. It predicts whether the next candle will close bullish (green), bearish (red), or neutral — with a confidence percentage — using either a logistic regression neural network approximation (pre-trained on historical data) or a rule-based decision tree ensemble.
Perfect for scalpers, day traders, and swing traders seeking confluence from multiple sources.
Key Features
Next Candle Prediction
Real-time probability and direction (BUY/SELL/HOLD) with confidence level (0-100%).
Visual simulated future candle (one bar ahead) based on ATR-scaled body size.
Background coloring for predicted up/down moves.
Large label on the chart showing prediction, strength, confidence, and recent patterns.
Machine Learning Models (toggle via inputs)
NN Mode: Logistic regression (single-layer neural net) using normalized features from RSI, MACD, Stochastic, EMA, Bollinger Bands, ATR, OBV, Ichimoku, VWAP, CCI, Williams %R, MFI, and volume.
Tree Mode: Ensemble of 6 decision trees incorporating trend, volume, oscillators, candlestick patterns, divergences, and SMC elements.
Smart Money Concepts (SMC/ICT)
Order Blocks (Bullish/Bearish) with auto-extension and labels.
Fair Value Gaps (FVG) with volume-confirmed 3-candle detection and minimum size filter.
Breaker Blocks (when OB is broken).
Liquidity Sweeps (fakeouts at recent highs/lows).
Market Structure: Break of Structure (BOS) and Change of Character (CHoCH) labels.
Mitigation Blocks, Equal Highs/Lows, Imbalances.
Divergence Detection (Regular & Hidden)
RSI, MACD, and Stochastic divergences with lines and labels.
Classic Indicators & Tools
EMA, Ichimoku Cloud, Bollinger Bands, Parabolic SAR, SuperTrend, VWAP with bands.
ADX trend strength, Volume confirmation, Candlestick patterns (Engulfing, Hammer, Shooting Star).
Fibonacci Retracement from recent fractals (auto-updating on last bar).
Volume Profile (POC, VAH, VAL) over lookback period.
Visual & Info Enhancements
Customizable info table (Full/Summary/Mobile modes) showing key metrics, predictions, and statuses.
Trend background coloring.
Auto-cleanup of old drawings to prevent chart clutter.
Alerts
Buy/Sell/Hold predictions.
Patterns, divergences, SMC events (OB, FVG, BOS, CHoCH, Liquidity Sweeps, etc.).
How to Use
Add to any chart/timeframe (best on 1-15min for predictions).
Watch the next-candle label and simulated candle for directional bias.
Use SMC zones for entries/exits, confirmed by prediction confidence >66% (STRONG).
Combine with table for quick confluence overview.
Enable alerts for real-time notifications.
Disclaimer
No indicator guarantees profits. This is a tool for confluence — always use proper risk management. Backtest thoroughly on your assets/timeframes.

Live Ichimoku BOXThis indicator offers a unique "Visual" approach to the Ichimoku Kinko Hyo system. Instead of just plotting lines, it visualizes the mathematical logic behind the Tenkan-sen (9), Kijun-sen (26), and Span B (52) in real-time.
Core Concept: Ichimoku lines represent the equilibrium (50% level) of the High-Low range over a specific period. This tool draws Equilibrium Boxes to show exactly where these Highs and Lows are located relative to the current price.
Key Features:
Live Equilibrium Boxes: Visualizes the 9, 26, and 52-period ranges on the current live candle.
Mid-Lines: Clearly marks the equilibrium points (Tenkan, Kijun, Span B) within each box.
Vector Lines: Diagonal lines connecting the High and Low of each box to visualize momentum direction.
Fractals & Signals: Marks major pivots with Stars (*) and secondary pivots with Arrows.
Time Counters: Displays the candle count from the pivot to the current bar.
Future & Past: Visualizes the Chikou Span (lagging) and Future Cloud levels (leading) using dash lines.
Split-Color Background: distinct transparency for the upper and lower halves of the boxes for better trend identification.
How to Use: Use this tool to understand the market structure behind the Ichimoku lines. If the price is above the box's mid-line, the trend is bullish for that period. Aligned mid-lines indicate strong support/resistance levels.
این اندیکاتور یک دیدگاه کاملاً جدید و "بصری" (Visual) به سیستم ایچیموکو کینکو هیو (Ichimoku Kinko Hyo) ارائه میدهد. برخلاف اندیکاتورهای کلاسیک که فقط خطوط را رسم میکنند، این ابزار منطق محاسباتی پشت خطوط تنکانسن (۹)، کیجونسن (۲۶) و اسپن بی (۵۲) را در لحظه حال (Live) به تصویر میکشد.
فلسفه عملکرد: در ایچیموکو، خطوط بر اساس میانگینِ بالاترین قیمت (High) و پایینترین قیمت (Low) در یک دوره خاص محاسبه میشوند. این اندیکاتور با رسم باکسهای تعادلی (Equilibrium Boxes)، دقیقاً نشان میدهد که این سقف و کفها کجا هستند و قیمت در حال حاضر نسبت به "ناحیه تعادل" (۵۰٪ باکس) چه وضعیتی دارد.
ویژگیهای کلیدی:
🟥 باکسهای ۹، ۲۶ و ۵۲ دوره: نمایش محدوده نوسان قیمت در دورههای زمانی استاندارد ایچیموکو بر روی کندل زنده.
➖ خطوط میانی (Mid-Lines): نمایش دقیق محل تنکانسن، کیجونسن و اسپن بی به صورت خطوط دش یا ضخیم در وسط باکسها.
📐 بردارهای حرکتی (Vectors): رسم خطوط مورب داخل باکس که جهت و شتاب حرکت از High به Low (یا برعکس) را نشان میدهند.
✨ نقاط چرخش (Pivots): نمایش سقفها و کفهای ماژور با علامت ستاره (*) و نقاط برگشت فرعی با فلش (Arrows).
🔢 شمارشگر زمانی: نمایش تعداد کندلهای گذشته از سقف یا کف باکس تا لحظه حال.
🔮 آینده و گذشته: نمایش وضعیت چیکو اسپن (۲۵ کندل عقبتر) و ابرهای آینده (۲۵ کندل جلوتر) به صورت خطوط راهنما.
🎨 طراحی دو رنگ (Split Color): ناحیه بالای تعادل و پایین تعادل با شفافیتهای متفاوت نمایش داده میشوند تا تشخیص روند صعودی/نزولی در یک نگاه ساده باشد.
نحوه استفاده: این ابزار برای کسانی طراحی شده که میخواهند "چرایی" حرکت قیمت را درک کنند. وقتی قیمت بالای خط میانی باکس قرار دارد، خریداران در آن بازه زمانی کنترل را در دست دارند و برعکس. همپوشانی باکسها و خطوط میانی، نواحی قدرتمند حمایت و مقاومت را نشان میدهد.

[AlscapeLabs] HTF Candle Stack (Multi-Timeframe)
Overview
The HTF Candle Stack (Multi-TF) indicator is a powerful visualization tool designed to overlay high-timeframe (HTF) price action directly onto your current chart, independent of the chart's price scale. This gives traders a clear, aligned, and non-overlapping view of simultaneous price movements across customizable timeframes.
By stacking the candles horizontally next to the chart's price action, the indicator allows for quick identification of multi-timeframe correlation, trend confluence, and key levels without switching chart timeframes.
Key Features
6 Independent Stacks: Configure up to 6 separate timeframes (e.g., 5m, 15m, 1H, 4H, Daily, Weekly) to view the complete market fractals from micro to macro.
Price-Aligned Visualization : All HTF candle stacks are perfectly aligned with the main chart's vertical price axis
Replay Mode Safe : Includes dedicated logic to prevent "duplicate candles" during Bar Replay, ensuring accurate backtesting and historical analysis.
Toggleable Stacks : Each stack can be individually enabled or disabled via input settings
Dynamic Spacing : The distance between active stacks is automatically calculated and adjusted based on the visibility of the preceding stack.
Settings Guide
Stack Configuration (1 - 6)
Each of the six stacks has identical controls:
Show/Hide : Enable or disable this specific stack.
Timeframe : The specific HTF to display (e.g., "60" for 1 Hour, "D" for Daily).
[*} Count : How many candles to show in this stack (Current Active Candle + Past Closed Candles). Tip: Use higher counts (10-12) for lower TFs (Stack 1-2) and lower counts (2-4) for higher TFs (Stack 5-6)
Candle Color
Controls global coloring
Bullish / Bearish : Customize the body colors.
Wick : Separate control for wick color and transparency
Layout
Distance from Chart : How far (in bars) to the right the first stack begins
Space between Stacks : The gap (in bars) between each active stack.
Candle Width : The thickness of the HTF candles.
Labels
Displays a time-frame next to the active (live) candle in each stack
Show TF Labels : Enable or disable labels through all stacks
Text Color : Label text color
Background : Label background color
Style : Label position (Left, Down)
Size : Label text size (Tiny, Small, Normal, Large, Huge)
Developed by AlscapeLabs

Trading Module [BackQuant]Trading Module
A modular overlay that lets you combine three core components, a Trend Model, an Impulse Model, and an optional Stop Loss framework, then layer in a multi-symbol RSI screener plus a full price action toolkit (market structure, FVGs, order blocks, volumetric S/R). Built for discretionary execution and study, not for blind automation.
────────────────────────────────────────────────────────────
What this script is
This indicator is designed like a “module picker”. Instead of forcing one opinionated system, it gives you selectable models that can be combined into a workflow:
1) Trend Model , answers “what side is the market biased to?”
2) Impulse Model , answers “is there currently expansion, pressure, or a momentum event worth paying attention to?”
3) Stop Loss Layer , answers “where are reasonable invalidation zones if I’m managing risk manually?”
4) RSI Screener , answers “what are my watchlist assets doing right now, on multiple timeframes, in one place?”
5) Price Action Concepts , answers “what structure levels, imbalances, institutional zones, and volume-based levels matter?”
You can run it as a lightweight overlay (trend + impulse only), or turn on the heavier price action stack when you want deeper context.
────────────────────────────────────────────────────────────
How to use it, the intended workflow
Step 1, pick your Trend Model
The trend model is your baseline directional filter. It is meant to reduce “random trading” by keeping you aligned with the dominant structure or momentum bias.
Trend Models (examples)
Typical usage:
- If the trend model reads bullish, you focus on long setups and avoid shorting into strength.
- If the trend model reads bearish, you focus on short setups and avoid catching bottoms.
- If the trend model is neutral or mixed, you reduce size or wait for confirmation.
What you can expect from the options (without exposing internal weighting or thresholds):
- Universal Trend+ , a composite trend regime model that blends multiple families of trend evidence. It is designed to be more robust than a single indicator and reduce “one-indicator failure modes”.
- EMA Cross , a classic fast vs slow trend bias. Simple, responsive, but can whipsaw in ranges.
- DEMA ATR , a smoother trend anchor that adapts to volatility. Often cleaner in chop than basic crosses.
- Relative Strength Overlay , a strength scoring style bias built from an RSI-style internal scoring process. Useful when you want “strength state” more than “moving average state”.
Color conventions:
- Long color and short color are user-defined, so you can keep consistent visuals across your BackQuant suite.
Step 2, pick your Impulse Model
Impulse is separate from trend on purpose. Trend answers direction, impulse answers timing. A market can be trending but not currently impulsing, or impulsing in a counter-trend squeeze.
Impulse Models (examples)
How to use impulse signals:
- Treat impulse as “permission” to engage, not as a standalone trade trigger.
- Best pairing is trend aligned impulse, meaning bullish trend model plus bullish impulse, bearish plus bearish.
- Counter-trend impulses can be used as warning signals, take-profit cues, or short-lived mean reversion opportunities, depending on your style.
The impulse options in this module are built around pressure and expansion detection. They are meant to identify moments where conditions shift from “noise” to “initiative activity”.
Step 3, choose a Stop Loss framework
This script includes optional stop visualization modes. These are not meant to be blindly used as a “one true stop”, they are tools for structuring invalidation around volatility or defined percentage bands.
Stop Loss (examples)
Stop loss options:
- None , no overlay.
- Dynamic , a volatility-aware band. Useful when you want stops to widen in high vol and tighten in low vol.
- Fixed , preset percentage bands. Useful for quick structure around risk units, scaling, or rule-based journaling.
- Bar-to-Bar , a micro-structure invalidation reference that uses the prior bar as a risk anchor. Useful for very tight management and fast invalidation.
How to apply them properly:
- Stops should be placed where the trade idea is wrong, not where you “feel pain”.
- A volatility stop is usually an environment stop, while a fixed stop is usually a plan stop.
- If you use impulses for entries, your stop should account for impulse volatility, otherwise you get stopped on the exact move you’re trying to capture.
────────────────────────────────────────────────────────────
RSI Screener module
This module is built for scanning multiple symbols and timeframes from one chart, without switching tabs.
RSI Screener (example)
What it does:
- Lets you define up to 10 symbols (defaults to major crypto pairs).
- Each slot can have its own timeframe.
- Computes an RSI value per symbol and assigns a directional state relative to a midline threshold.
- Displays a stacked overlay readout using a monospace label style for quick scanning.
How to use it:
- Set slots 1–5 as your majors, 6–10 as your rotation candidates.
- Use higher timeframes for regime, lower timeframes for timing.
- Use the midline threshold as a “trend bias” line, not an overbought or oversold line.
- Treat the screener as context, not a signal. Your chart model and price action still decide the trade.
Performance note:
- Screeners are heavy by nature because each symbol is a security() request. Keep the number of enabled slots reasonable if you are on lower-end hardware or running many scripts.
────────────────────────────────────────────────────────────
Price Action Concepts and Market Structure stack
This script includes a full price action toolkit intended to provide “where” context, levels, zones, and structural breaks, so the trend and impulse models are not operating in a vacuum.
Price Action Concepts / Market Structure (example)
This section is split into five major blocks:
1) Market Structure, Swing and Internal
You can enable swing structure and internal structure separately, with independent lookbacks.
- Swing structure tracks larger, slower pivots, better for macro trend structure.
- Internal structure tracks tighter pivots, better for entry timing and micro shifts.
It prints structure events as:
- BOS (Break of Structure), continuation-style break.
- MSB (Market Structure Break), shift-style break. Some traders call this CHoCH, here it’s presented as an MSB concept.
Usage:
- Swing BOS is good for confirming a larger regime.
- Internal structure is good for timing entries within the swing context.
- If internal flips but swing does not, treat it as a warning, not necessarily a full reversal.
2) Fair Value Gaps (FVG)
Optional imbalance boxes that highlight displacement zones.
Key controls:
- Timeframe selection (or current timeframe).
- How many to keep on chart.
- How far to extend them right.
Usage:
- FVGs are best treated as “areas of interest”, not guaranteed support/resistance.
- They help you frame where price might rebalance after an impulse event.
3) Order Blocks (OB)
Optional institutional-style zones detected from structure and candle logic, with filters.
Key controls:
- Fractal type (3 or 5) changes how “strict” structure detection is.
- Break method (close vs high/low) changes confirmation strictness.
- Optional filter with FVG distance to reduce low-quality blocks.
- Extend, delete-when-filled, and label options for chart hygiene.
Usage:
- OBs are strongest when aligned with swing context and confirmed by volume or displacement.
- Filled blocks are informational, they can be removed to reduce clutter.
4) Volumetric Support and Resistance
This module creates support and resistance “zones” based on high-volume pivot events, then manages them over time.
Key controls:
- Detection sensitivity, volume multiplier, and lookback period.
- Minimum distance between zones to avoid stacking duplicates.
- Remove broken, extend, and volume display toggles.
How to interpret:
- Levels are thicker zones, not single price lines.
- “Touches” are tracked as an interaction count, useful for identifying repeatedly defended or attacked zones.
- High-volume zones are visually emphasized, these tend to matter more than low volume pivots.
Usage:
- Pair volumetric levels with impulse signals, an impulse into a high-volume resistance zone is not the same as an impulse in open space.
- Use volumetric levels as structure anchors for invalidation and targets.
5) Alerts
The price action stack includes alerts for new levels, touches, breaks, and order block creation or interaction.
Use alerts for:
- Watchlist management, you get notified when price hits an area.
- Avoiding screen-watching, especially when you run multi-timeframe setups.
────────────────────────────────────────────────────────────
Core philosophy of the module
This indicator is not “one model to rule them all”. It is meant to let you build a trading process:
- Trend decides bias.
- Impulse decides engagement timing.
- Price action decides location and structure.
- Stops decide risk containment.
- Screener decides where to look.
If you only use one layer, you are throwing away most of the edge this style of framework is designed to create. The strength is in confluence and filtering.
────────────────────────────────────────────────────────────
Suggested presets
Preset A, clean trend-following overlay
- Trend Model, Universal Trend+ or DEMA ATR
- Impulse Model, either option
- Stop Loss, Dynamic
- Price action modules off (structure off, FVG off, OB off, volumetric off)
- Screener on (high timeframe)
Preset B, execution and structure mode
- Trend Model on
- Impulse Model on
- Market Structure on (swing + internal)
- FVG on (current timeframe or one higher)
- Order Blocks on with FVG filter
- Volumetric S/R on
- Stop Loss, Dynamic or Bar-to-Bar depending on speed
Preset C, watchlist scanner mode
- Screener on
- Minimal chart overlays on
- Use alerts for touches and breaks
- Only open charts that show alignment across trend and impulse
────────────────────────────────────────────────────────────
Notes and limitations
- This is a heavy script when multiple modules are enabled, because it draws objects and can request multiple symbols.
- The models are designed to be modular, so not every combination will be optimal for every market or timeframe.
────────────────────────────────────────────────────────────
Quick input map
Main Settings/Models
- Select Trend Model
- Select Impulse Model
- Select Stop Loss
- Show Screener
- Long/Short colors
Screener Settings
- Label size and offsets
- RSI length and midline
- Up to 10 symbol slots with per-slot timeframe and enable toggle
Market Structure
- Swing and internal structure mode and lookbacks
- Bull and bear colors
Fair Value Gaps
- Enable, count, timeframe, extend, colors
Order Blocks
- Enable, labels, fractal type, break method
- FVG filter and distance
- Lookback, extend, delete-when-filled, colors
Volumetric S/R
- Sensitivity, volume multiplier, analysis window
- Level limits, distance rules, extension and cleanup rules
- Volume display preferences
────────────────────────────────────────────────────────────
End note
This is intended as a full visual decision-support module for discretionary traders who want trend, timing, structure, and watchlist scanning in one place. Use it to build a repeatable process, then validate that process with proper testing and journaling before risking real capital.

Sentinel System V1.1
Sentinel System – High-Probability Confluence Indicator (Non-Repainting)The Sentinel System is a powerful all-in-one indicator designed for traders who want clean, high-probability entries with minimal false signals. Built around the principle of multiple confluence, it combines trend filtering, momentum triggers, and dynamic price zones to deliver precise buy/sell arrows only when everything aligns.Key Features:Trend Filter: Uses EMA 50/200 to ensure signals only appear in the direction of the prevailing trend (no counter-trend noise).
Sentinel Trigger: Custom fast/slow momentum crossover optimized to catch the beginning of impulsive moves.
Sentinel Zones: Shaded dynamic areas based on recent pivots/fractals, mild overbought/oversold conditions, and relative strength. Signals are only validated inside these high-confluence zones.
Clean Arrows & Alerts: Non-repainting ↑ (long) and ↓ (short) arrows with pop-up, sound, and push alerts.
Confluence Dashboard: Small on-chart label showing signal strength (Strong / Medium / Weak).
Works on any timeframe and any asset – exceptional performance on volatile markets like BTC, ETH, XAU/USD, and major forex pairs.
Why traders love it:Extremely low false signal rate thanks to triple-layer confirmation.
Fully non-repainting – once an arrow appears, it stays.
Perfect for scalping (lower TFs) or swing trading (higher TFs).
Simple and clean visuals – no chart clutter.
Whether you're a beginner looking for reliable signals or an experienced trader seeking confluence confirmation, Sentinel System helps you stay on the right side of the market with confidence.Feel free to test it extensively – the results speak for themselves. Disclaimer: No indicator guarantees profits. Always use proper risk manageme
¿Cómo funciona?Combina tres capas de confirmación:Tendencia (EMA).
Momentum (trigger).
Zona de precio dinámica.
Solo cuando las tres coinciden, aparece una señal. Esto reduce mucho las entradas falsas.¿Para qué sirve?Funciona en cualquier timeframe y cualquier activo.
Destaca especialmente en mercados volátiles como Bitcoin (BTC), Ethereum (ETH), oro (XAU/USD) y pares mayores de forex.
Ideal para scalping (timeframes bajos) o swing trading (timeframes altos).
Perfecto para principiantes que buscan señales claras o traders avanzados que quieren confirmación extra.

UK100 London Judas & IFVG SetupUK100 London Judas & IFVG Setup
Overview This indicator is a specialized trading tool designed to automate the ICT Judas Swing strategy specifically for the UK100 (FTSE 100) index during the London Market Open. It combines institutional time-based logic with price action confirmation using Inversion Fair Value Gaps (IFVG) to identify high-probability reversal setups.
How It Works The strategy is based on the concept that the initial move after the London Open is often a "fake-out" (manipulation) designed to trap retail traders and engineer liquidity before the true trend of the day begins.
Session & Opening Price:
The script marks the London Open price (default 09:00 Warsaw / 08:00 London time) with a dashed line.
This serves as the "line in the sand." Prices moving away from this line initially are monitored for manipulation.
Judas Swing (Liquidity Sweep):
If price moves BELOW the open, it is hunting Sell-Side Liquidity (trapping sellers).
If price moves ABOVE the open, it is hunting Buy-Side Liquidity (trapping buyers).
The Entry Trigger: Inversion FVG (IFVG):
The indicator scans for Fair Value Gaps (FVG) created during the manipulation phase.
BUY Signal: The price manipulates lower, creates a Bearish FVG (Red Box), but then aggressively reverses and closes ABOVE that gap. The gap is now "Inverted" (turns Green), acting as support.
SELL Signal: The price manipulates higher, creates a Bullish FVG (Green Box), but then aggressively reverses and closes BELOW that gap. The gap is now "Inverted" (turns Orange), acting as resistance.
Key Features
Automated Pattern Recognition: No need to manually draw gaps. The script detects valid FVG inversions that align with the Judas Swing logic.
Built-in Risk Calculator: The signal labels display the exact Lot Size you should use based on your account balance and risk percentage (default 0.5%). It calculates this dynamically based on the Stop Loss distance.
Institutional Targets: The indicator fetches H1 Fractals (Liquidity) from the 1-hour timeframe and plots them on your 1-minute chart as blue lines. These are your primary Take Profit (TP) levels.
Stop Loss Visualization: Automatically suggests a Stop Loss placement behind the swing high/low of the reversal structure.
How to Use
Timeframe: Set your chart to 1 Minute (1m).
Asset: UK100 (FTSE 100).
Wait: Allow the London session to open. Watch for price to move away from the opening line.
Execute: When a BUY or SELL label appears:
Enter the trade using the Lot Size shown on the label.
Set your Stop Loss at the price shown on the label.
Target the blue H1 Liquidity lines for profit taking.
Settings
Timezone: Set this to your chart/exchange timezone (Default: Europe/Warsaw).
Account Balance: Input your current trading capital (e.g., 100,000) for accurate risk calculations.
Risk Per Trade %: The percentage of your account you are willing to lose if the Stop Loss is hit (Standard: 0.5% - 1.0%).
Contract Size: The value of 1 point movement (Check your broker's specifications. Usually 1 for CFDs).
Alerts You can set a single alert in TradingView to capture all signals. Select the indicator and choose "Any alert() function call". You will receive a notification with the direction (Buy/Sell), Entry Price, and Lot Size.

Quarterly Theory The Quarterly Theory indicator is a refined analytical tool that applies the ICT (Inner Circle Trader) framework and fractal time principles. It divides market time into structured quarterly cycles, anchored by the True Open of each period, to provide precise signals for trade entry and exit. This approach is consistently effective across all timeframes—from yearly and monthly charts down to 90-minute sessions.
The core model defines four distinct market phases within each cycle:
Q1 – Accumulation: A consolidation phase where the market builds a base for the next move.
Q2 – Manipulation (Judas Swing): Characterized by deceptive, rapid price action designed to trap traders before a true trend emerges.
Q3 – Distribution: A period of high volatility as positions are unwound and transferred.
Q4 – Continuation/Reversal: The cycle concludes with the established trend either extending or reversing.
By leveraging smart algorithms, the indicator analyzes these phases to detect critical market structures such as liquidity zones, stop-runs, and high-probability price patterns. This synthesis of Quarterly Theory, fractal timing, and liquidity analysis delivers a data-driven edge, empowering traders to decode complex market behavior and execute informed, strategic trades.

[Yorsh] BJN iFVG Model BJN iFVG Model - Mechanical Trading System
Description:
The BJN iFVG Model is not just an indicator; it is a full-scale, semi-automated trading architecture designed to mechanically execute the specific "BJN" Inverted FVG strategy.
Designed for precision traders operating on Lower Timeframes (1m to 5m), this script eliminates the cognitive load of manual analysis. It automates every single step of the mechanical model—from Higher Timeframe narrative building to tick-perfect structural validation and risk calculation.
This tool transforms your chart into a professional trading cockpit, split into three intelligent engines:
1. The Matrix (Context Engine)
Before looking for an entry, you must understand the narrative. The Matrix handles the heavy lifting of multi-timeframe analysis without cluttering your chart:
Real-Time Delivery State: Automatically detects if price is reacting from valid HTF PD Arrays (1H, 4H, Daily) to confirm a "Delivery" state.
Liquidity Sweeps: Tracks Fractals across three dimensions (1H, 15m, and Micro-Structure) to identify liquidity raids instantly.
Advanced SMT Divergence: A built-in, multi-mode SMT engine scans for correlation breaks (Pivot SMT, Adjacent Wick SMT, and FVG SMT) between NQ/ES (or custom tickers) in real-time.
Time & Macro Tracking: Automatically visualizes Killzones and highlights high-probability Macro windows.
2. The Executioner (Entry Engine)
Once the context is set, the Executioner handles the specific Inverted FVG (iFVG) entry model with strict mechanical rules:
Structural Integrity: Automatically identifies the Invalidation Point (IP), Floor/Ceiling, and Break-Even levels for every setup.
Hazard Detection: The script proactively scans the "Trading Leg" for opposing unmitigated FVGs (Hazards). If the path isn't clean, the trade is flagged or invalidated.
Composite Logic: Intelligently merges "noisy" price action into Composite FVGs to reduce false signals.
Integrated Position Sizer: When a trade is confirmed, a visual box appears showing your precise Entry, Stop Loss, Hard Stop, and Take Profit levels, along with a calculated Contract Quantity based on your risk tolerance.
3. The Ranking System (Quality Control)
Not all trades are created equal. This system grades every single confirmed setup in real-time based on confluence factors:
Grades: Ranges from A++ (Perfect Confluence) to C (Low Probability).
Confluence Check: Checks for Delivery, Sweeps (HTF/LTF), SMT, and Macro alignment at the exact moment of the trigger.
Live Status Panel: A dashboard on your chart displays the current live trade status (Armed, Triggered, Confirmed) and its Rank, so you never miss a beat.
Optimization & Performance
Trading on the 1-minute timeframe requires speed. This script has been rigorously optimized for high-frequency environments:
Smart Garbage Collection: The script manages its own memory, cleaning up old data arrays to prevent lag, ensuring the chart remains fluid even after days of data accumulation.
Tunnel Vision: Calculations are strictly focused on the relevant trading leg, ignoring historical noise to maximize execution speed.
Zero-Repaint: All historical analysis is strictly non-repainting to ensure backtesting reliability.
How to Use
Timeframes: Optimized for 1m, 2m, 3m, 4m, 5m execution.
Alerts: Configure the robust alert system to notify you only when setups meet your standards (e.g., "Alert only on Rank B+ or higher").
Strategy: Wait for the Status Panel to show a "CONFIRMED" signal. Use the on-screen Position Sizer to execute the trade with the displayed risk parameters.
Stop analyzing; start executing. Welcome to mechanical trading.
----------------------------------------------------------------------------------------------------------------
RISK DISCLAIMER:
The content, tools, and signals generated by this script are strictly for educational and informational purposes only. This script does not constitute financial advice, investment recommendations, or a solicitation to buy or sell any securities, futures, or other financial instruments.
Trading financial markets involves a high degree of risk and is not suitable for all investors. The "Position Sizer" and "Trade Setups" displayed are hypothetical simulations designed to demonstrate the mechanics of the BJN methodology; they do not guarantee future performance.
Use this tool at your own risk. The author assumes no responsibility or liability for any trading losses or damages incurred in connection with the use of this script. Always consult with a qualified financial advisor and practice proper risk management.

Order Blocks v2This is a short code script that shows you a REAL Order Blocks.
There is many indicators that show you random blocks on the screen, these are by definition Order Blocks. The code is simple and short.
You can use this indicator as an extra confluence or as a place to put your stop losses or to put your stop losses in profit.
I recommend always keeping the "Consider order block only with following FVG" on, as the best Order Blocks are found with that setting on.
I have a lot more code i can share, use this and let me know how it works for you!
THE SETTINGS I USE ARE:
(NO) Only show on on time levels 3,7,11,14
fractal bars 3
Order blocks on break of Fractal close or HL Close
(YES) Consider order block only with following FVG
Max distance of FVG following Order Blocks 2
Oder Block Height Body
Dotted 13 length and 3 width

Bassi MA Entry Helper MTF EMA , VWMA Swing , ADX , SMA200 , TPBassi MA Entry Helper is an advanced multi-timeframe confluence system designed to identify high-probability entries using trend, volume, market structure, and volatility filters.
It is built for traders who want cleaner signals, fewer false entries, and strong multi-confirmation setups.
Key Features
Multi-Timeframe EMA Crossovers – HTF signal engine
SMA200 Trend Filter – prevents counter-trend trades
VWMA Swing Confirmation – volume-validated micro-swings
ADX Filter – only trade when the trend has strength
Fractal Structure Mapping – identifies swing highs/lows
Retracement Filter – confirms pullbacks before entries
TP/SL Automation – ATR or percentage based
Clean Entry Labels – main & additional entry signals
Highly Customizable – mode, timeframe, filters, visuals
This script is ideal for:
Scalping • Intraday • Swing • Trend continuation • Volume-based setups • Multi-timeframe alignment
How It Works
Main Buy/Sell Signals
Triggered when:
✔ Fast EMA crosses Slow EMA (HTF)
✔ Price aligned with trend
✔ SMA200 filter valid
✔ VWMA confirmation (optional)
✔ ADX strong
✔ Retracement valid (optional)
Additional Buy/Sell Signals
Triggered when VWMA crosses Slow EMA during trend continuation.
TP/SL System
You can choose between:
%-based take-profit & stop-loss
ATR-based dynamic levels
Automatically projects clean visual levels on your chart.
Notes
This indicator does not repaint and is suitable for both real-time and historical analysis.
Always combine signals with proper risk management.
Initial Release – v1.0
Added multi-timeframe EMA engine
Added SMA200 trend filter
Added VWMA swing entries
Added ADX strength filter
Added retracement filter
Added fractal swing detection
Added TP/SL auto plotting
Added main & additional entry labels
Performance optimized
