14/30 SMA Price DivergencePrice divergence from 14 and 30 SMA, identify overbought + oversold conditions
스크립트에서 "Divergence"에 대해 찾기

ScalpyScalpy is made up of a 2 main parts.
- The cloud comprising of a 10 period SMA and a 30 period SMA.
- When the cloud is green you should be looking for long entries.
- When the cloud is red you should be looking for short entries.
- Price is most bullish above a green cloud and most bearish below a red cloud.
- Being within the cloud indicates indecision.
The blue and white lines on the indicator show the relationship between price and momentum.
They can be used to spot reversals in two ways:
- The first is a divergence between price (blue line) and RSI (white line)
- If the price makes a lower low but the RSI makes a higher low this shows the trend is weakening and may be reversing soon (as can be seen by the two yellow lines on the chart).
The second is a simple crossover:
- When the white line crosses the blue line to the upside this signals a long entry.
- When the white line crosses the blue line to the downside this signals a short entry.

Double MA CCI"What is the Commodity Channel Index (CCI)?
Developed by Donald Lambert, the Commodity Channel Index (CCI) is a momentum-based oscillator used to help determine when an investment vehicle is reaching a condition of being overbought or oversold. It is also used to assess price trend direction and strength. This information allows traders to determine if they want to enter or exit a trade, refrain from taking a trade, or add to an existing position. In this way, the indicator can be used to provide trade signals when it acts in a certain way.
KEY TAKEAWAYS
• The CCI measures the difference between the current price and the historical average price.
• When the CCI is above zero it indicates the price is above the historic average. When CCI is below zero, the price is below the hsitoric average.
• High readings of 100 or above, for example, indicate the price is well above the historic average and the trend has been strong to the upside.
• Low readings below -100, for example, indicate the price is well below the historic average and the trend has been strong to the downside.
• Going from negative or near-zero readings to +100 can be used as a signal to watch for an emerging uptrend.
• Going from positive or near-zero readings to -100 may indicate an emerging downtrend.
• CCI is an unbounded indicator meaning it can go higher or lower indefinitely. For this reason, overbought and oversold levels are typically determined for each individual asset by looking at historical extreme CCI levels where the price reversed from." ----> 1
SOURCE
1: (SINCE IM NOT A "PRO" MEMBER I C'ANT POST THE SOUCRE URL..., webpage consulted at : 8:50 GMT -5 ; the 2020-01-18)
I- Added a 2nd MA length and changed the default values of the source type and switched the SMA to a MA.
II- In process to add analytic MACD histogram correlation and if possible, ploting a relative histogram between the CCI upper and lower band.
P.S.:
Don't set your moving averages lengths to far from each other... This could result in fewer convergence and divergence, also in fewer crossing MA's.
Have a good year 2020 !!
//----CODER----//
R.V.

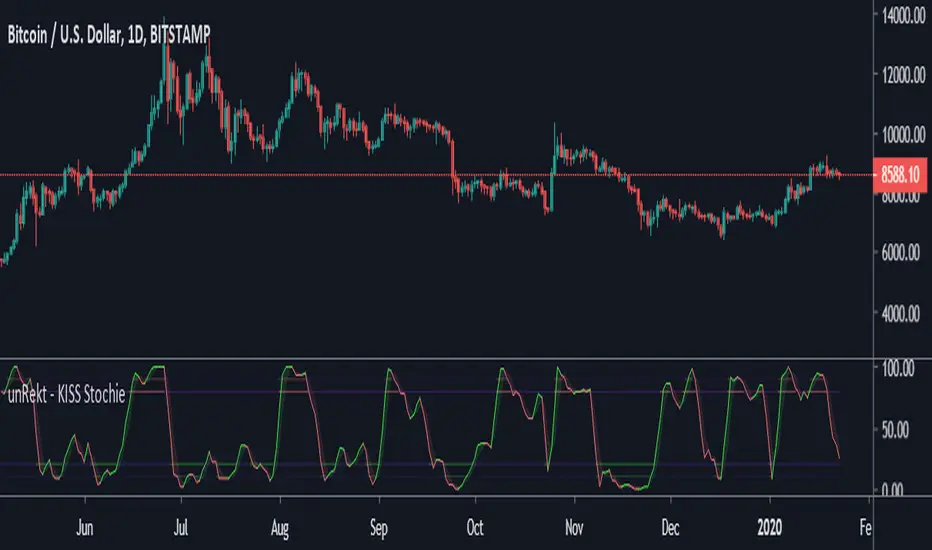
unRekt - KISS StochieStochie is the StochRSI indicator and is part of the ''keeping it simple' series that have a similar color scheme. The Stochastic RSI technical indicator applies the Stochastic Oscillator to values of the Relative Strength Index (RSI). The indicator thus produces two main plots FullK and FullD oscillating between oversold and overbought levels. The StochRSI can also be used to detect divergence and trend.
Multi-Oscillator Divergence StudyCreated study to allow access to alert conditions.
See strategy to understand how this indicator is used.

Mk 47 (Width)This is a good divergence indicator, in very short timeframes for the intraday trader who wants to get that bounty.
Ladies and Gentlemen, This is Mark 47.

Moving Average Convergence/Divergence Histogram/AreaMoving Average Convergence/Divergence Histogram/Area

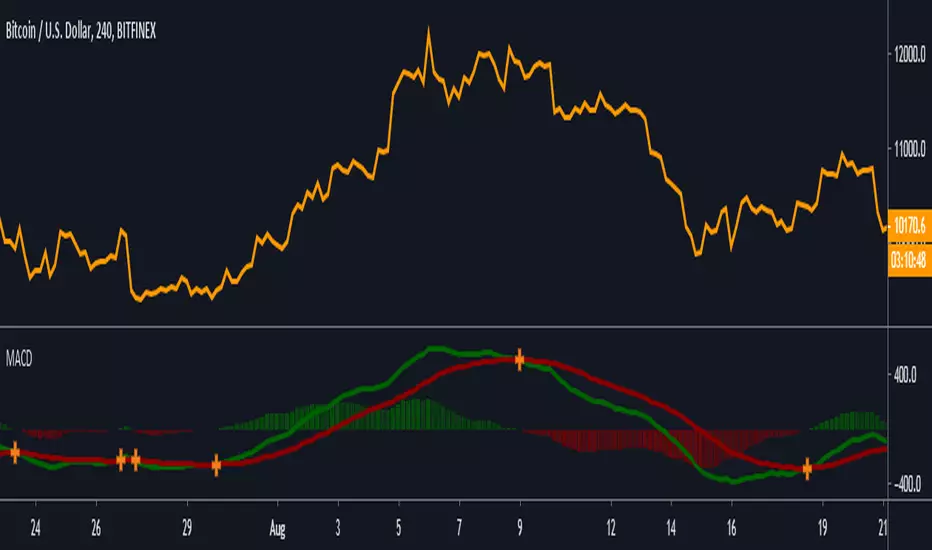
MACD [Gu5]Extremely popular indicator MACD (Moving Average Convergence/Divergence)
Same design of my previous indicators
Show Cross Line for a better visualization
```
Setting recommended for BTC
"Fast Length" = 21
"Slow Length" = 55
"Signal Smoothing" = 14
Other markets try
"Fast Length" = 12
"Slow Length" = 26
"Signal Smoothing" = 9
```
--
El MACD (Convergencia/Divergencia de Medias Móviles) es uno de los mas populares indicadores
Continuando con el mismo estilo de diseño de mis anteriores indicadores
Destaca el cruce de medias para una mejor visualización
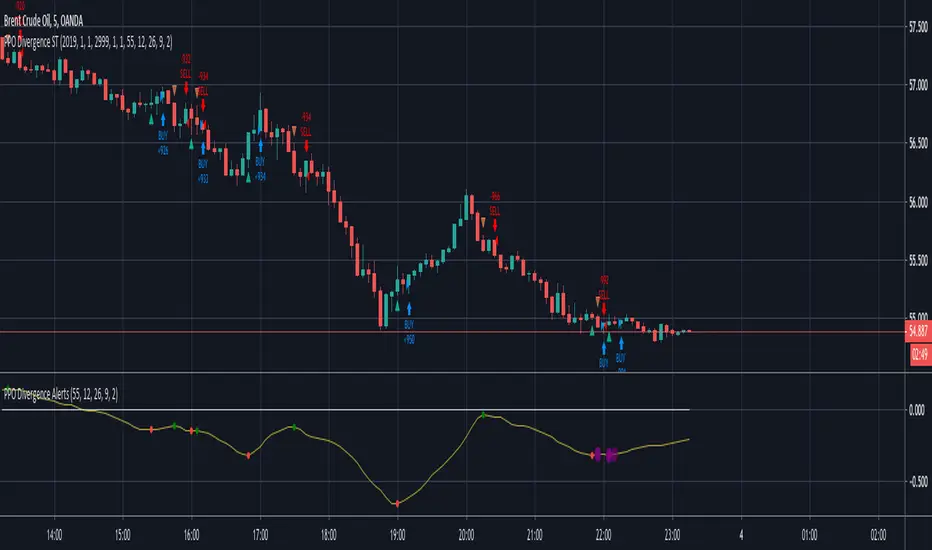
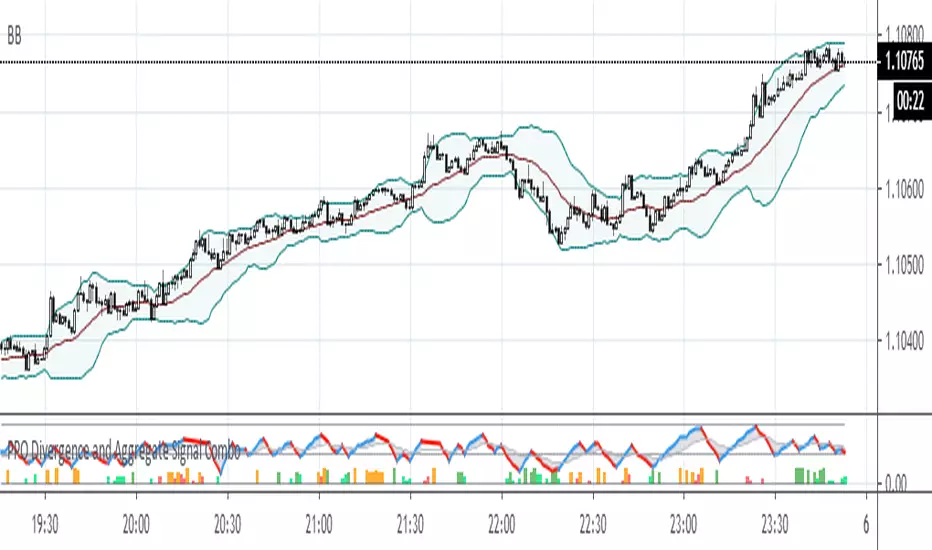
PPO Divergence and Aggregate Signal ComboThis is a further development of the last two posts on aggregated signal generation. It shows how to implement the idea in conjunction with another indicator. In this case general rule for long and short entry: the aggregated curve (gray) must cross the mid-line. Colored columns serve as an early warning. Settings were tested with EURUSD in 5m, 30m and 1H TFs.
PriceDivergence (ps4)This script implements price divergence module using signals from several factors like:
RSI, RSI Stochastic, MACD, Volume MA, Accumulation/Distribution, Fisher Transform and CCI

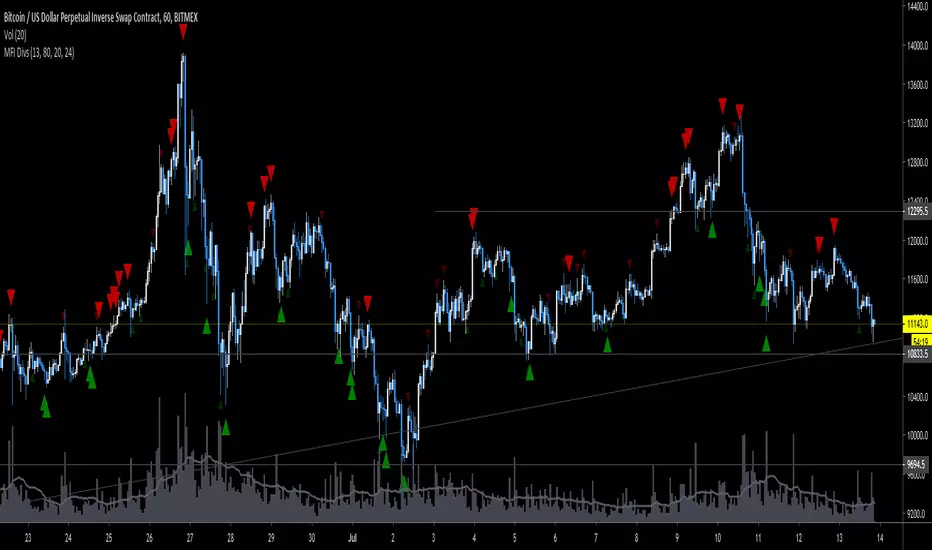
MFI DivergenceThis is an edit of the RSI divergence indicator by Libertus (thanks!). Play around with the settings, you'll want to tweak length & lookback per market & timeframe.
Sizing GuideThis indicator helps you defining your max sizing, depending on the max $$$ amount you're willing to risk against a specific exponential moving average (or VWAP, default is the 13ema).
You can define your max risk amount and your max allowed sizing. The indicator would suggest the best sizing in order to risk only up to the amount you are comfortable with on a potential trade.
Moreover, the column bar would turn yellow/red if the divergence is above a certain threshold (default are yellow > 1.50% and red > 2.75%, green otherwise).

Trading System(Light)Combo of many useful indicators modified to suit dark theme, contains
1)Regular and Hidden Divergence Buy and Sell signals by scarf
2)Time and Money channels by Lazybear
3)Fibonacci Bollinger Bands by Rashad
4) Linear Regression Curve by ucsgears
Thanks for all the creators for the source codes!

Trading System(Dark)Combo of many useful indicators, contains
1)Regular and Hidden Divergence Buy and Sell signals by scarf
2)Time and Money channels by Lazybear
3)Fibonacci Bollinger Bands by Rashad
4)Linear Regression Curve by ucsgears
Thanks for all the creators for the source codes!
Blau Divergence RSISuggested useage: monthly index or asset class charts.
Traffic light colour system offers opinion on market risk.
Good for long term timing / hedging & allocation adjustment
with hat tip to William Blau !
www.amazon.com

Average Indicators Positionsby this script you can see the average level of macd, macd-asprey, rsi, stochastic, cci, momentum, obv, DI, volume weighted macd, cmf indicators within a period. It also calculates and creates the same graph for higher time frame, so you can see average levels for current and higher time frame. you can also check it for divergence/convergence. You can use it as you wish and add/remove indicators.

The Last 50 Trading System - RSIThis is an adjustment to default RSI indicator
14 time period to 8
70 and 30 lines to 80 and 20
change RSI line color on oversold and overbought area to yellow
this indicator is for the use of "RSI 80 - 20 Trading Sytem: Learn to Trade Divergence, and Find a Low Risk Way to Sell Near The Top or Buy Near The Bottom " by TradingStrategyGuides.com
You can FREE download the PDF here drive.google.com (GDrive)
you will also need "The Last 50 Overlay" Indicator to put on chart

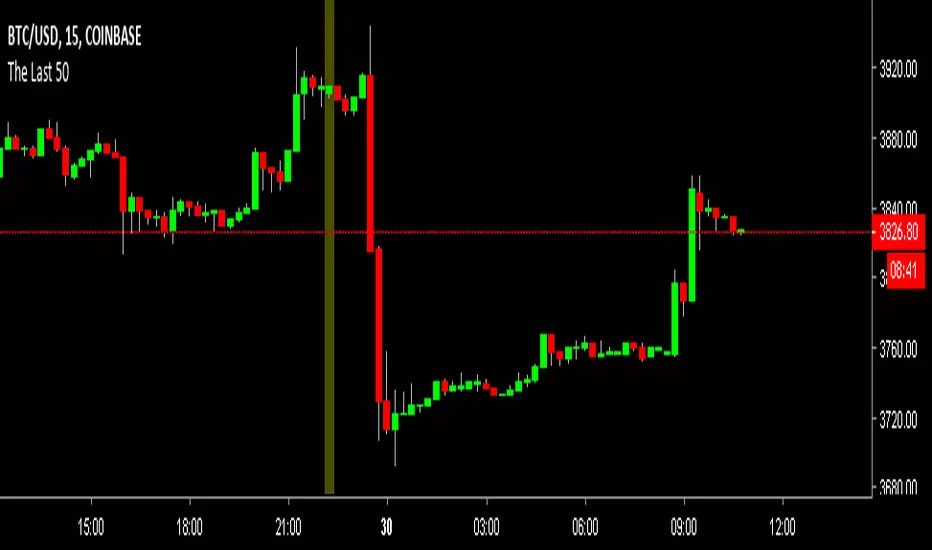
The Last 50 Overlaythis indicator will put a mark on the last 50 candle/bar.
for the use of "RSI 80 - 20 Trading Sytem: Learn to Trade Divergence, and Find a Low Risk Way to Sell Near The Top or Buy Near The Bottom " by TradingStrategyGuides.com
You can Free download the PDF here drive.google.com (GDrive)
Gator OscillatorThis indicator was originally developed by Bill M. Williams. It shows the degree of convergence / divergence of the Alligator lines.

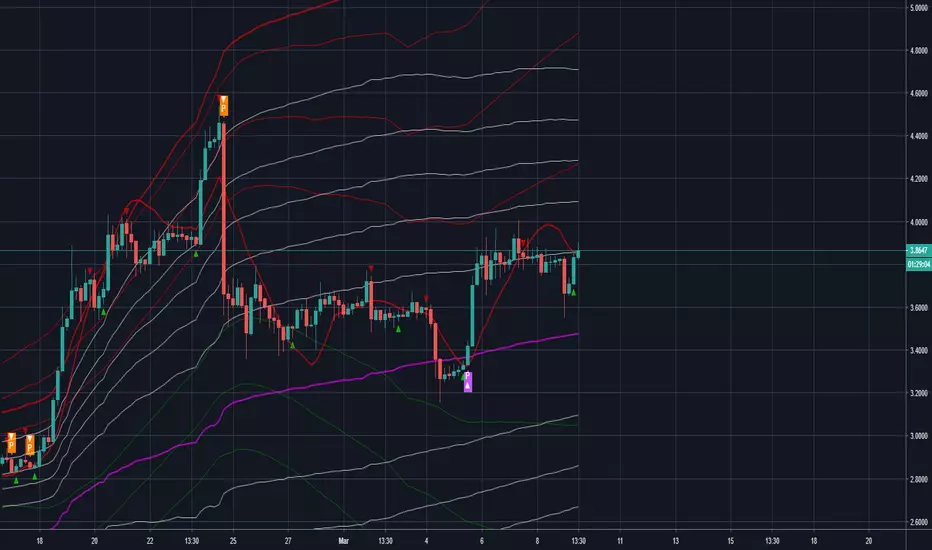
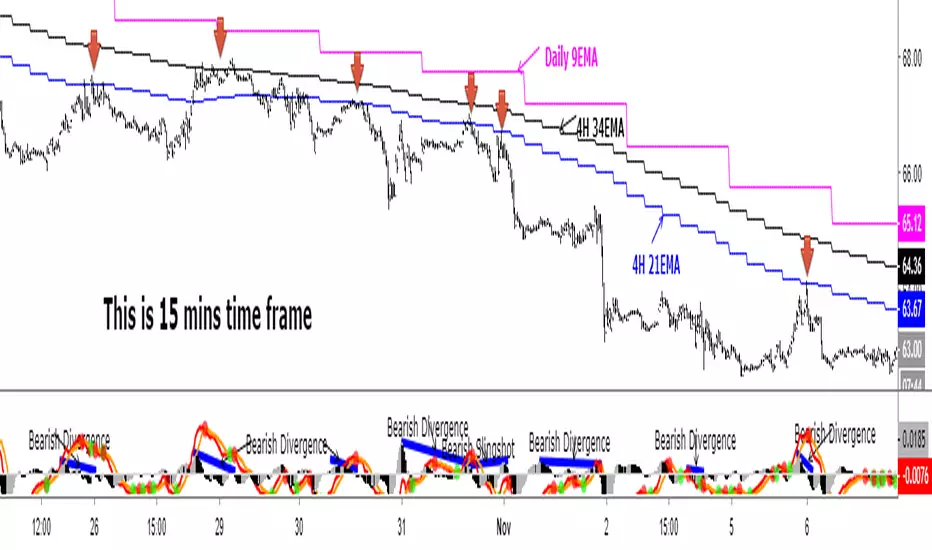
Daily 9 EMA Plotted at Other Than Daily Time Frame
Credit to the great @Zoen Triste for his original script at:
I just amend it for the Daily, 4H and other time frames. The main function of the Daily 9EMA (pink line) is to easily distinguish the big trend. It is also for multi time frames dynamic support / resistance when trading using tf lower than Daily, without having to toggle between the time frames. Everything is there at a single time frame chart. I like to day trade and switch to swing trade when there is a solid setup for it. To be able to do that, I use 15mins tf together with the Daily 9EMA, 4H 34EMA and 4H 21EMA.
How to trade using this setup?
First of all, if price is below the pink line (Daily 9EMA), it means the big trend is downtrend (and vice versa). When price retrace and reach the blue (4H 21EMA) or black (4H 34EMA) or the pink (Daily 9EMA) line (look at the red arrows), if there is bearish divergence / slingshot at the MACD's histogram together with a reversal candle such as pin bar (shooting star), dark cloud cover or bearish engulf, it's a short setup. We don't need to put the Stop Loss immediately. We can wait for the price to resume in the direction of the big trend to trail the SL.
I do add up daily and weekly pivots and trendlines for additional support / resistance for greater confidence. If the above setup occurs at certain pivots and trendline, we'll have a very high probability setup. Please see the zoomed-in chart as below:
When price is above the pink line, the setup is just the opposite.
My conclusion: When day trading using this setup at smaller time frames such as 15mins, we don't have to toggle between 4H and 15min time frames to see where is the EMA21 and EMA34 at 4H for the moment.
It's like we are able to see a microscopic and bird's eye views at the same time using a single time frame chart.
MACD Divergence added in CM_MacD_Ult_MTFYou must have missed some trading opportunities of MACD Divergence due to oversight. So I create and share this script to help u seize the chances.
This indicator is based on CM_MacD_Ult_MTF created by ChrisMoody.

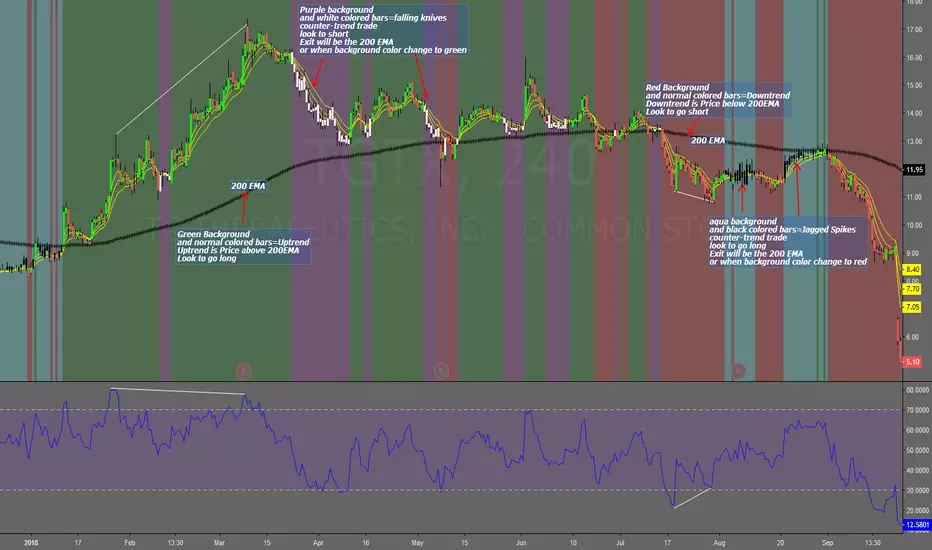
Falling Knives Jagged SpikesThe purpose of this script is to trade with the trend, trade trend continuation, and counter-trend trades.
Uptrend is price above 200 ema: Background is green and the bar colors are normal
Downtrend is price below 200 ema: Background is red and the bar colors are normal
Counter-trend to uptrend--Bar colors are white and the background is purple
counter-trend to downtrend--Bar colors are black and the background is aqua.
How to use:
Uptrend (green background): Only go long
Downtrend (red background): only go short
Counter-trend to uptrend/downtrend (white bars/black bars): Take counter-trend trade when price is a substantial distance from the 200 EMA. Best if there was a divergence with an oscillator. A lot of times these are just deep pullbacks or rallies.
trend continuation: In uptrend, after falling knives, and trend continues up (background turns to green) look to buy, you are getting a great price on the asset. Same for downtrend.
Keep in mind that nothing is perfect, and to of-course test everything.
Best of luck in all you do. Get money.