Liquid Pulse Liquid Pulse by Dskyz (DAFE) Trading Systems
Liquid Pulse is a trading algo built by Dskyz (DAFE) Trading Systems for futures markets like NQ1!, designed to snag high-probability trades with tight risk control. it fuses a confluence system—VWAP, MACD, ADX, volume, and liquidity sweeps—with a trade scoring setup, daily limits, and VIX pauses to dodge wild volatility. visuals include simple signals, VWAP bands, and a dashboard with stats.
Core Components for Liquid Pulse
Volume Sensitivity (volumeSensitivity) controls how much volume spikes matter for entries. options: 'Low', 'Medium', 'High' default: 'High' (catches small spikes, good for active markets) tweak it: 'Low' for calm markets, 'High' for chaos.
MACD Speed (macdSpeed) sets the MACD’s pace for momentum. options: 'Fast', 'Medium', 'Slow' default: 'Medium' (solid balance) tweak it: 'Fast' for scalping, 'Slow' for swings.
Daily Trade Limit (dailyTradeLimit) caps trades per day to keep risk in check. range: 1 to 30 default: 20 tweak it: 5-10 for safety, 20-30 for action.
Number of Contracts (numContracts) sets position size. range: 1 to 20 default: 4 tweak it: up for big accounts, down for small.
VIX Pause Level (vixPauseLevel) stops trading if VIX gets too hot. range: 10 to 80 default: 39.0 tweak it: 30 to avoid volatility, 50 to ride it.
Min Confluence Conditions (minConditions) sets how many signals must align. range: 1 to 5 default: 2 tweak it: 3-4 for strict, 1-2 for more trades.
Min Trade Score (Longs/Shorts) (minTradeScoreLongs/minTradeScoreShorts) filters trade quality. longs range: 0 to 100 default: 73 shorts range: 0 to 100 default: 75 tweak it: 80-90 for quality, 60-70 for volume.
Liquidity Sweep Strength (sweepStrength) gauges breakouts. range: 0.1 to 1.0 default: 0.5 tweak it: 0.7-1.0 for strong moves, 0.3-0.5 for small.
ADX Trend Threshold (adxTrendThreshold) confirms trends. range: 10 to 100 default: 41 tweak it: 40-50 for trends, 30-35 for weak ones.
ADX Chop Threshold (adxChopThreshold) avoids chop. range: 5 to 50 default: 20 tweak it: 15-20 to dodge chop, 25-30 to loosen.
VWAP Timeframe (vwapTimeframe) sets VWAP period. options: '15', '30', '60', '240', 'D' default: '60' (1-hour) tweak it: 60 for day, 240 for swing, D for long.
Take Profit Ticks (Longs/Shorts) (takeProfitTicksLongs/takeProfitTicksShorts) sets profit targets. longs range: 5 to 100 default: 25.0 shorts range: 5 to 100 default: 20.0 tweak it: 30-50 for trends, 10-20 for chop.
Max Profit Ticks (maxProfitTicks) caps max gain. range: 10 to 200 default: 60.0 tweak it: 80-100 for big moves, 40-60 for tight.
Min Profit Ticks to Trail (minProfitTicksTrail) triggers trailing. range: 1 to 50 default: 7.0 tweak it: 10-15 for big gains, 5-7 for quick locks.
Trailing Stop Ticks (trailTicks) sets trail distance. range: 1 to 50 default: 5.0 tweak it: 8-10 for room, 3-5 for fast locks.
Trailing Offset Ticks (trailOffsetTicks) sets trail offset. range: 1 to 20 default: 2.0 tweak it: 1-2 for tight, 5-10 for loose.
ATR Period (atrPeriod) measures volatility. range: 5 to 50 default: 9 tweak it: 14-20 for smooth, 5-9 for reactive.
Hardcoded Settings volLookback: 30 ('Low'), 20 ('Medium'), 11 ('High') volThreshold: 1.5 ('Low'), 1.8 ('Medium'), 2 ('High') swingLen: 5
Execution Logic Overview trades trigger when confluence conditions align, entering long or short with set position sizes. exits use dynamic take-profits, trailing stops after a profit threshold, hard stops via ATR, and a time stop after 100 bars.
Features Multi-Signal Confluence: needs VWAP, MACD, volume, sweeps, and ADX to line up.
Risk Control: ATR-based stops (capped 15 ticks), take-profits (scaled by volatility), and trails.
Market Filters: VIX pause, ADX trend/chop checks, volatility gates. Dashboard: shows scores, VIX, ADX, P/L, win %, streak.
Visuals Simple signals (green up triangles for longs, red down for shorts) and VWAP bands with glow. info table (bottom right) with MACD momentum. dashboard (top right) with stats.
Chart and Backtest:
NQ1! futures, 5-minute chart. works best in trending, volatile conditions. tweak inputs for other markets—test thoroughly.
Backtesting: NQ1! Frame: Jan 19, 2025, 09:00 — May 02, 2025, 16:00 Slippage: 3 Commission: $4.60
Fee Typical Range (per side, per contract)
CME Exchange $1.14 – $1.20
Clearing $0.10 – $0.30
NFA Regulatory $0.02
Firm/Broker Commis. $0.25 – $0.80 (retail prop)
TOTAL $1.60 – $2.30 per side
Round Turn: (enter+exit) = $3.20 – $4.60 per contract
Disclaimer this is for education only. past results don’t predict future wins. trading’s risky—only use money you can lose. backtest and validate before going live. (expect moderators to nitpick some random chart symbol rule—i’ll fix and repost if they pull it.)
About the Author Dskyz (DAFE) Trading Systems crafts killer trading algos. Liquid Pulse is pure research and grit, built for smart, bold trading. Use it with discipline. Use it with clarity. Trade smarter. I’ll keep dropping badass strategies ‘til i build a brand or someone signs me up.
2025 Created by Dskyz, powered by DAFE Trading Systems. Trade smart, trade bold.
스크립트에서 "CME"에 대해 찾기

Dskyz (DAFE) Adaptive Regime - Quant Machine ProDskyz (DAFE) Adaptive Regime - Quant Machine Pro:
Buckle up for the Dskyz (DAFE) Adaptive Regime - Quant Machine Pro, is a strategy that’s your ultimate edge for conquering futures markets like ES, MES, NQ, and MNQ. This isn’t just another script—it’s a quant-grade powerhouse, crafted with precision to adapt to market regimes, deliver multi-factor signals, and protect your capital with futures-tuned risk management. With its shimmering DAFE visuals, dual dashboards, and glowing watermark, it turns your charts into a cyberpunk command center, making trading as thrilling as it is profitable.
Unlike generic scripts clogging up the space, the Adaptive Regime is a DAFE original, built from the ground up to tackle the chaos of futures trading. It identifies market regimes (Trending, Range, Volatile, Quiet) using ADX, Bollinger Bands, and HTF indicators, then fires trades based on a weighted scoring system that blends candlestick patterns, RSI, MACD, and more. Add in dynamic stops, trailing exits, and a 5% drawdown circuit breaker, and you’ve got a system that’s as safe as it is aggressive. Whether you’re a newbie or a prop desk pro, this strat’s your ticket to outsmarting the markets. Let’s break down every detail and see why it’s a must-have.
Why Traders Need This Strategy
Futures markets are a gauntlet—fast moves, volatility spikes (like the April 28, 2025 NQ 1k-point drop), and institutional traps that punish the unprepared. Meanwhile, platforms are flooded with low-effort scripts that recycle old ideas with zero innovation. The Adaptive Regime stands tall, offering:
Adaptive Intelligence: Detects market regimes (Trending, Range, Volatile, Quiet) to optimize signals, unlike one-size-fits-all scripts.
Multi-Factor Precision: Combines candlestick patterns, MA trends, RSI, MACD, volume, and HTF confirmation for high-probability trades.
Futures-Optimized Risk: Calculates position sizes based on $ risk (default: $300), with ATR or fixed stops/TPs tailored for ES/MES.
Bulletproof Safety: 5% daily drawdown circuit breaker and trailing stops keep your account intact, even in chaos.
DAFE Visual Mastery: Pulsing Bollinger Band fills, dynamic SL/TP lines, and dual dashboards (metrics + position) make signals crystal-clear and charts a work of art.
Original Craftsmanship: A DAFE creation, built with community passion, not a rehashed clone of generic code.
Traders need this because it’s a complete, adaptive system that blends quant smarts, user-friendly design, and DAFE flair. It’s your edge to trade with confidence, cut through market noise, and leave the copycats in the dust.
Strategy Components
1. Market Regime Detection
The strategy’s brain is its ability to classify market conditions into five regimes, ensuring signals match the environment.
How It Works:
Trending (Regime 1): ADX > 20, fast/slow EMA spread > 0.3x ATR, HTF RSI > 50 or MACD bullish (htf_trend_bull/bear).
Range (Regime 2): ADX < 25, price range < 3% of close, no HTF trend.
Volatile (Regime 3): BB width > 1.5x avg, ATR > 1.2x avg, HTF RSI overbought/oversold.
Quiet (Regime 4): BB width < 0.8x avg, ATR < 0.9x avg.
Other (Regime 5): Default for unclear conditions.
Indicators: ADX (14), BB width (20), ATR (14, 50-bar SMA), HTF RSI (14, daily default), HTF MACD (12,26,9).
Why It’s Brilliant:
Regime detection adapts signals to market context, boosting win rates in trending or volatile conditions.
HTF RSI/MACD add a big-picture filter, rare in basic scripts.
Visualized via gradient background (green for Trending, orange for Range, red for Volatile, gray for Quiet, navy for Other).
2. Multi-Factor Signal Scoring
Entries are driven by a weighted scoring system that combines candlestick patterns, trend, momentum, and volume for robust signals.
Candlestick Patterns:
Bullish: Engulfing (0.5), hammer (0.4 in Range, 0.2 else), morning star (0.2), piercing (0.2), double bottom (0.3 in Volatile, 0.15 else). Must be near support (low ≤ 1.01x 20-bar low) with volume spike (>1.5x 20-bar avg).
Bearish: Engulfing (0.5), shooting star (0.4 in Range, 0.2 else), evening star (0.2), dark cloud (0.2), double top (0.3 in Volatile, 0.15 else). Must be near resistance (high ≥ 0.99x 20-bar high) with volume spike.
Logic: Patterns are weighted higher in specific regimes (e.g., hammer in Range, double bottom in Volatile).
Additional Factors:
Trend: Fast EMA (20) > slow EMA (50) + 0.5x ATR (trend_bull, +0.2); opposite for trend_bear.
RSI: RSI (14) < 30 (rsi_bull, +0.15); > 70 (rsi_bear, +0.15).
MACD: MACD line > signal (12,26,9, macd_bull, +0.15); opposite for macd_bear.
Volume: ATR > 1.2x 50-bar avg (vol_expansion, +0.1).
HTF Confirmation: HTF RSI < 70 and MACD bullish (htf_bull_confirm, +0.2); RSI > 30 and MACD bearish (htf_bear_confirm, +0.2).
Scoring:
bull_score = sum of bullish factors; bear_score = sum of bearish. Entry requires score ≥ 1.0.
Example: Bullish engulfing (0.5) + trend_bull (0.2) + rsi_bull (0.15) + htf_bull_confirm (0.2) = 1.05, triggers long.
Why It’s Brilliant:
Multi-factor scoring ensures signals are confirmed by multiple market dynamics, reducing false positives.
Regime-specific weights make patterns more relevant (e.g., hammers shine in Range markets).
HTF confirmation aligns with the big picture, a quant edge over simplistic scripts.
3. Futures-Tuned Risk Management
The risk system is built for futures, calculating position sizes based on $ risk and offering flexible stops/TPs.
Position Sizing:
Logic: Risk per trade (default: $300) ÷ (stop distance in points * point value) = contracts, capped at max_contracts (default: 5). Point value = tick value (e.g., $12.5 for ES) * ticks per point (4) * contract multiplier (1 for ES, 0.1 for MES).
Example: $300 risk, 8-point stop, ES ($50/point) → 0.75 contracts, rounded to 1.
Impact: Precise sizing prevents over-leverage, critical for micro contracts like MES.
Stops and Take-Profits:
Fixed: Default stop = 8 points, TP = 16 points (2:1 reward/risk).
ATR-Based: Stop = 1.5x ATR (default), TP = 3x ATR, enabled via use_atr_for_stops.
Logic: Stops set at swing low/high ± stop distance; TPs at 2x stop distance from entry.
Impact: ATR stops adapt to volatility, while fixed stops suit stable markets.
Trailing Stops:
Logic: Activates at 50% of TP distance. Trails at close ± 1.5x ATR (atr_multiplier). Longs: max(trail_stop_long, close - ATR * 1.5); shorts: min(trail_stop_short, close + ATR * 1.5).
Impact: Locks in profits during trends, a game-changer in volatile sessions.
Circuit Breaker:
Logic: Pauses trading if daily drawdown > 5% (daily_drawdown = (max_equity - equity) / max_equity).
Impact: Protects capital during black swan events (e.g., April 27, 2025 ES slippage).
Why It’s Brilliant:
Futures-specific inputs (tick value, multiplier) make it plug-and-play for ES/MES.
Trailing stops and circuit breaker add pro-level safety, rare in off-the-shelf scripts.
Flexible stops (ATR or fixed) suit different trading styles.
4. Trade Entry and Exit Logic
Entries and exits are precise, driven by bull_score/bear_score and protected by drawdown checks.
Entry Conditions:
Long: bull_score ≥ 1.0, no position (position_size <= 0), drawdown < 5% (not pause_trading). Calculates contracts, sets stop at swing low - stop points, TP at 2x stop distance.
Short: bear_score ≥ 1.0, position_size >= 0, drawdown < 5%. Stop at swing high + stop points, TP at 2x stop distance.
Logic: Tracks entry_regime for PNL arrays. Closes opposite positions before entering.
Exit Conditions:
Stop-Loss/Take-Profit: Hits stop or TP (strategy.exit).
Trailing Stop: Activates at 50% TP, trails by ATR * 1.5.
Emergency Exit: Closes if price breaches stop (close < long_stop_price or close > short_stop_price).
Reset: Clears stop/TP prices when flat (position_size = 0).
Why It’s Brilliant:
Score-based entries ensure multi-factor confirmation, filtering out weak signals.
Trailing stops maximize profits in trends, unlike static exits in basic scripts.
Emergency exits add an extra safety layer, critical for futures volatility.
5. DAFE Visuals
The visuals are pure DAFE magic, blending function with cyberpunk flair to make signals intuitive and charts stunning.
Shimmering Bollinger Band Fill:
Display: BB basis (20, white), upper/lower (green/red, 45% transparent). Fill pulses (30–50 alpha) by regime, with glow (60–95 alpha) near bands (close ≥ 0.995x upper or ≤ 1.005x lower).
Purpose: Highlights volatility and key levels with a futuristic glow.
Visuals make complex regimes and signals instantly clear, even for newbies.
Pulsing effects and regime-specific colors add a DAFE signature, setting it apart from generic scripts.
BB glow emphasizes tradeable levels, enhancing decision-making.
Chart Background (Regime Heatmap):
Green — Trending Market: Strong, sustained price movement in one direction. The market is in a trend phase—momentum follows through.
Orange — Range-Bound: Market is consolidating or moving sideways, with no clear up/down trend. Great for mean reversion setups.
Red — Volatile Regime: High volatility, heightened risk, and larger/faster price swings—trade with caution.
Gray — Quiet/Low Volatility: Market is calm and inactive, with small moves—often poor conditions for most strategies.
Navy — Other/Neutral: Regime is uncertain or mixed; signals may be less reliable.
Bollinger Bands Glow (Dynamic Fill):
Neon Red Glow — Warning!: Price is near or breaking above the upper band; momentum is overstretched, watch for overbought conditions or reversals.
Bright Green Glow — Opportunity!: Price is near or breaking below the lower band; market could be oversold, prime for bounce or reversal.
Trend Green Fill — Trending Regime: Fills between bands with green when the market is trending, showing clear momentum.
Gold/Yellow Fill — Range Regime: Fills with gold/aqua in range conditions, showing the market is sideways/oscillating.
Magenta/Red Fill — Volatility Spike: Fills with vivid magenta/red during highly volatile regimes.
Blue Fill — Neutral/Quiet: A soft blue glow for other or uncertain market states.
Moving Averages:
Display: Blue fast EMA (20), red slow EMA (50), 2px.
Purpose: Shows trend direction, with trend_dir requiring ATR-scaled spread.
Dynamic SL/TP Lines:
Display: Pulsing colors (red SL, green TP for Trending; yellow/orange for Range, etc.), 3px, with pulse_alpha for shimmer.
Purpose: Tracks stops/TPs in real-time, color-coded by regime.
6. Dual Dashboards
Two dashboards deliver real-time insights, making the strat a quant command center.
Bottom-Left Metrics Dashboard (2x13):
Metrics: Mode (Active/Paused), trend (Bullish/Bearish/Neutral), ATR, ATR avg, volume spike (YES/NO), RSI (value + Oversold/Overbought/Neutral), HTF RSI, HTF trend, last signal (Buy/Sell/None), regime, bull score.
Display: Black (29% transparent), purple title, color-coded (green for bullish, red for bearish).
Purpose: Consolidates market context and signal strength.
Top-Right Position Dashboard (2x7):
Metrics: Regime, position side (Long/Short/None), position PNL ($), SL, TP, daily PNL ($).
Display: Black (29% transparent), purple title, color-coded (lime for Long, red for Short).
Purpose: Tracks live trades and profitability.
Why It’s Brilliant:
Dual dashboards cover market context and trade status, a rare feature.
Color-coding and concise metrics guide beginners (e.g., green “Buy” = go).
Real-time PNL and SL/TP visibility empower disciplined trading.
7. Performance Tracking
Logic: Arrays (regime_pnl_long/short, regime_win/loss_long/short) track PNL and win/loss by regime (1–5). Updated on trade close (barstate.isconfirmed).
Purpose: Prepares for future adaptive thresholds (e.g., adjust bull_score min based on regime performance).
Why It’s Brilliant: Lays the groundwork for self-optimizing logic, a quant edge over static scripts.
Key Features
Regime-Adaptive: Optimizes signals for Trending, Range, Volatile, Quiet markets.
Futures-Optimized: Precise sizing for ES/MES with tick-based risk inputs.
Multi-Factor Signals: Candlestick patterns, RSI, MACD, and HTF confirmation for robust entries.
Dynamic Exits: ATR/fixed stops, 2:1 TPs, and trailing stops maximize profits.
Safe and Smart: 5% drawdown breaker and emergency exits protect capital.
DAFE Visuals: Shimmering BB fill, pulsing SL/TP, and dual dashboards.
Backtest-Ready: Fixed qty and tick calc for accurate historical testing.
How to Use
Add to Chart: Load on a 5min ES/MES chart in TradingView.
Configure Inputs: Set instrument (ES/MES), tick value ($12.5/$1.25), multiplier (1/0.1), risk ($300 default). Enable ATR stops for volatility.
Monitor Dashboards: Bottom-left for regime/signals, top-right for position/PNL.
Backtest: Run in strategy tester to compare regimes.
Live Trade: Connect to Tradovate or similar. Watch for slippage (e.g., April 27, 2025 ES issues).
Replay Test: Try April 28, 2025 NQ drop to see regime shifts and stops.
Disclaimer
Trading futures involves significant risk of loss and is not suitable for all investors. Past performance does not guarantee future results. Backtest results may differ from live trading due to slippage, fees, or market conditions. Use this strategy at your own risk, and consult a financial advisor before trading. Dskyz (DAFE) Trading Systems is not responsible for any losses incurred.
Backtesting:
Frame: 2023-09-20 - 2025-04-29
Slippage: 3
Fee Typical Range (per side, per contract)
CME Exchange $1.14 – $1.20
Clearing $0.10 – $0.30
NFA Regulatory $0.02
Firm/Broker Commis. $0.25 – $0.80 (retail prop)
TOTAL $1.60 – $2.30 per side
Round Turn: (enter+exit) = $3.20 – $4.60 per contract
Final Notes
The Dskyz (DAFE) Adaptive Regime - Quant Machine Pro is more than a strategy—it’s a revolution. Crafted with DAFE’s signature precision, it rises above generic scripts with adaptive regimes, quant-grade signals, and visuals that make trading a thrill. Whether you’re scalping MES or swinging ES, this system empowers you to navigate markets with confidence and style. Join the DAFE crew, light up your charts, and let’s dominate the futures game!
(This publishing will most likely be taken down do to some miscellaneous rule about properly displaying charting symbols, or whatever. Once I've identified what part of the publishing they want to pick on, I'll adjust and repost.)
Use it with discipline. Use it with clarity. Trade smarter.
**I will continue to release incredible strategies and indicators until I turn this into a brand or until someone offers me a contract.
Created by Dskyz, powered by DAFE Trading Systems. Trade smart, trade bold.

Dskyz (DAFE) Aurora Divergence – Quant Master Dskyz (DAFE) Aurora Divergence – Quant Master
Introducing the Dskyz (DAFE) Aurora Divergence – Quant Master , a strategy that’s your secret weapon for mastering futures markets like MNQ, NQ, MES, and ES. Born from the legendary Aurora Divergence indicator, this fully automated system transforms raw divergence signals into a quant-grade trading machine, blending precision, risk management, and cyberpunk DAFE visuals that make your charts glow like a neon skyline. Crafted with care and driven by community passion, this strategy stands out in a sea of generic scripts, offering traders a unique edge to outsmart institutional traps and navigate volatile markets.
The Aurora Divergence indicator was a cult favorite for spotting price-OBV divergences with its aqua and fuchsia orbs, but traders craved a system to act on those signals with discipline and automation. This strategy delivers, layering advanced filters (z-score, ATR, multi-timeframe, session), dynamic risk controls (kill switches, adaptive stops/TPs), and a real-time dashboard to turn insights into profits. Whether you’re a newbie dipping into futures or a pro hunting reversals, this strat’s got your back with a beginner guide, alerts, and visuals that make trading feel like a sci-fi mission. Let’s dive into every detail and see why this original DAFE creation is a must-have.
Why Traders Need This Strategy
Futures markets are a battlefield—fast-paced, volatile, and riddled with institutional games that can wipe out undisciplined traders. From the April 28, 2025 NQ 1k-point drop to sneaky ES slippage, the stakes are high. Meanwhile, platforms are flooded with unoriginal, low-effort scripts that promise the moon but deliver noise. The Aurora Divergence – Quant Master rises above, offering:
Unmatched Originality: A bespoke system built from the ground up, with custom divergence logic, DAFE visuals, and quant filters that set it apart from copycat clutter.
Automation with Precision: Executes trades on divergence signals, eliminating emotional slip-ups and ensuring consistency, even in chaotic sessions.
Quant-Grade Filters: Z-score, ATR, multi-timeframe, and session checks filter out noise, targeting high-probability reversals.
Robust Risk Management: Daily loss and rolling drawdown kill switches, plus ATR-based stops/TPs, protect your capital like a fortress.
Stunning DAFE Visuals: Aqua/fuchsia orbs, aurora bands, and a glowing dashboard make signals intuitive and charts a work of art.
Community-Driven: Evolved from trader feedback, this strat’s a labor of love, not a recycled knockoff.
Traders need this because it’s a complete, original system that blends accessibility, sophistication, and style. It’s your edge to trade smarter, not harder, in a market full of traps and imitators.
1. Divergence Detection (Core Signal Logic)
The strategy’s core is its ability to detect bullish and bearish divergences between price and On-Balance Volume (OBV), pinpointing reversals with surgical accuracy.
How It Works:
Price Slope: Uses linear regression over a lookback (default: 9 bars) to measure price momentum (priceSlope).
OBV Slope: OBV tracks volume flow (+volume if price rises, -volume if falls), with its slope calculated similarly (obvSlope).
Bullish Divergence: Price slope negative (falling), OBV slope positive (rising), and price above 50-bar SMA (trend_ma).
Bearish Divergence: Price slope positive (rising), OBV slope negative (falling), and price below 50-bar SMA.
Smoothing: Requires two consecutive divergence bars (bullDiv2, bearDiv2) to confirm signals, reducing false positives.
Strength: Divergence intensity (divStrength = |priceSlope * obvSlope| * sensitivity) is normalized (0–1, divStrengthNorm) for visuals.
Why It’s Brilliant:
- Divergences catch hidden momentum shifts, often exploited by institutions, giving you an edge on reversals.
- The 50-bar SMA filter aligns signals with the broader trend, avoiding choppy markets.
- Adjustable lookback (min: 3) and sensitivity (default: 1.0) let you tune for different instruments or timeframes.
2. Filters for Precision
Four advanced filters ensure signals are high-probability and market-aligned, cutting through the noise of volatile futures.
Z-Score Filter:
Logic: Calculates z-score ((close - SMA) / stdev) over a lookback (default: 50 bars). Blocks entries if |z-score| > threshold (default: 1.5) unless disabled (useZFilter = false).
Impact: Avoids trades during extreme price moves (e.g., blow-off tops), keeping you in statistically safe zones.
ATR Percentile Volatility Filter:
Logic: Tracks 14-bar ATR in a 100-bar window (default). Requires current ATR > 80th percentile (percATR) to trade (tradeOk).
Impact: Ensures sufficient volatility for meaningful moves, filtering out low-volume chop.
Multi-Timeframe (HTF) Trend Filter:
Logic: Uses a 50-bar SMA on a higher timeframe (default: 60min). Longs require price > HTF MA (bullTrendOK), shorts < HTF MA (bearTrendOK).
Impact: Aligns trades with the bigger trend, reducing counter-trend losses.
US Session Filter:
Logic: Restricts trading to 9:30am–4:00pm ET (default: enabled, useSession = true) using America/New_York timezone.
Impact: Focuses on high-liquidity hours, avoiding overnight spreads and erratic moves.
Evolution:
- These filters create a robust signal pipeline, ensuring trades are timed for optimal conditions.
- Customizable inputs (e.g., zThreshold, atrPercentile) let traders adapt to their style without compromising quality.
3. Risk Management
The strategy’s risk controls are a masterclass in balancing aggression and safety, protecting capital in volatile markets.
Daily Loss Kill Switch:
Logic: Tracks daily loss (dayStartEquity - strategy.equity). Halts trading if loss ≥ $300 (default) and enabled (killSwitch = true, killSwitchActive).
Impact: Caps daily downside, crucial during events like April 27, 2025 ES slippage.
Rolling Drawdown Kill Switch:
Logic: Monitors drawdown (rollingPeak - strategy.equity) over 100 bars (default). Stops trading if > $1000 (rollingKill).
Impact: Prevents prolonged losing streaks, preserving capital for better setups.
Dynamic Stop-Loss and Take-Profit:
Logic: Stops = entry ± ATR * multiplier (default: 1.0x, stopDist). TPs = entry ± ATR * 1.5x (profitDist). Longs: stop below, TP above; shorts: vice versa.
Impact: Adapts to volatility, keeping stops tight but realistic, with TPs targeting 1.5:1 reward/risk.
Max Bars in Trade:
Logic: Closes trades after 8 bars (default) if not already exited.
Impact: Frees capital from stagnant trades, maintaining efficiency.
Kill Switch Buffer Dashboard:
Logic: Shows smallest buffer ($300 - daily loss or $1000 - rolling DD). Displays 0 (red) if kill switch active, else buffer (green).
Impact: Real-time risk visibility, letting traders adjust dynamically.
Why It’s Brilliant:
- Kill switches and ATR-based exits create a safety net, rare in generic scripts.
- Customizable risk inputs (maxDailyLoss, dynamicStopMult) suit different account sizes.
- Buffer metric empowers disciplined trading, a DAFE signature.
4. Trade Entry and Exit Logic
The entry/exit rules are precise, filtered, and adaptive, ensuring trades are deliberate and profitable.
Entry Conditions:
Long Entry: bullDiv2, cooldown passed (canSignal), ATR filter passed (tradeOk), in US session (inSession), no kill switches (not killSwitchActive, not rollingKill), z-score OK (zOk), HTF trend bullish (bullTrendOK), no existing long (lastDirection != 1, position_size <= 0). Closes shorts first.
Short Entry: Same, but for bearDiv2, bearTrendOK, no long (lastDirection != -1, position_size >= 0). Closes longs first.
Adaptive Cooldown: Default 2 bars (cooldownBars). Doubles (up to 10) after a losing trade, resets after wins (dynamicCooldown).
Exit Conditions:
Stop-Loss/Take-Profit: Set per trade (ATR-based). Exits on stop/TP hits.
Other Exits: Closes if maxBarsInTrade reached, ATR filter fails, or kill switch activates.
Position Management: Ensures no conflicting positions, closing opposites before new entries.
Built To Be Reliable and Consistent:
- Multi-filtered entries minimize false signals, a stark contrast to basic scripts.
- Adaptive cooldown prevents overtrading, especially after losses.
- Clean position handling ensures smooth execution, even in fast markets.
5. DAFE Visuals
The visuals are a DAFE hallmark, blending function with clean flair to make signals intuitive and charts stunning.
Aurora Bands:
Display: Bands around price during divergences (bullish: below low, bearish: above high), sized by ATR * bandwidth (default: 0.5).
Colors: Aqua (bullish), fuchsia (bearish), with transparency tied to divStrengthNorm.
Purpose: Highlights divergence zones with a glowing, futuristic vibe.
Divergence Orbs:
Display: Large/small circles (aqua below for bullish, fuchsia above for bearish) when bullDiv2/bearDiv2 and canSignal. Labels show strength (0–1).
Purpose: Pinpoints entries with eye-catching clarity.
Gradient Background:
Display: Green (bullish), red (bearish), or gray (neutral), 90–95% transparent.
Purpose: Sets the market mood without clutter.
Strategy Plots:
- Stop/TP Lines: Red (stops), green (TPs) for active trades.
- HTF MA: Yellow line for trend context.
- Z-Score: Blue step-line (if enabled).
- Kill Switch Warning: Red background flash when active.
What Makes This Next-Level?:
- Visuals make complex signals (divergences, filters) instantly clear, even for beginners.
- DAFE’s unique aesthetic (orbs, bands) sets it apart from generic scripts, reinforcing originality.
- Functional plots (stops, TPs) enhance trade management.
6. Metrics Dashboard
The top-right dashboard (2x8 table) is your command center, delivering real-time insights.
Metrics:
Daily Loss ($): Current loss vs. day’s start, red if > $300.
Rolling DD ($): Drawdown vs. 100-bar peak, red if > $1000.
ATR Threshold: Current percATR, green if ATR exceeds, red if not.
Z-Score: Current value, green if within threshold, red if not.
Signal: “Bullish Div” (aqua), “Bearish Div” (fuchsia), or “None” (gray).
Action: “Consider Buying”/“Consider Selling” (signal color) or “Wait” (gray).
Kill Switch Buffer ($): Smallest buffer to kill switch, green if > 0, red if 0.
Why This Is Important?:
- Consolidates critical data, making decisions effortless.
- Color-coded metrics guide beginners (e.g., green action = go).
- Buffer metric adds transparency, rare in off-the-shelf scripts.
7. Beginner Guide
Beginner Guide: Middle-right table (shown once on chart load), explains aqua orbs (bullish, buy) and fuchsia orbs (bearish, sell).
Key Features:
Futures-Optimized: Tailored for MNQ, NQ, MES, ES with point-value adjustments.
Highly Customizable: Inputs for lookback, sensitivity, filters, and risk settings.
Real-Time Insights: Dashboard and visuals update every bar.
Backtest-Ready: Fixed qty and tick calc for accurate historical testing.
User-Friendly: Guide, visuals, and dashboard make it accessible yet powerful.
Original Design: DAFE’s unique logic and visuals stand out from generic scripts.
How to Use
Add to Chart: Load on a 5min MNQ/ES chart in TradingView.
Configure Inputs: Adjust instrument, filters, or risk (defaults optimized for MNQ).
Monitor Dashboard: Watch signals, actions, and risk metrics (top-right).
Backtest: Run in strategy tester to evaluate performance.
Live Trade: Connect to a broker (e.g., Tradovate) for automation. Watch for slippage (e.g., April 27, 2025 ES issues).
Replay Test: Use bar replay (e.g., April 28, 2025 NQ drop) to test volatility handling.
Disclaimer
Trading futures involves significant risk of loss and is not suitable for all investors. Past performance is not indicative of future results. Backtest results may not reflect live trading due to slippage, fees, or market conditions. Use this strategy at your own risk, and consult a financial advisor before trading. Dskyz (DAFE) Trading Systems is not responsible for any losses incurred.
Backtesting:
Frame: 2023-09-20 - 2025-04-29
Fee Typical Range (per side, per contract)
CME Exchange $1.14 – $1.20
Clearing $0.10 – $0.30
NFA Regulatory $0.02
Firm/Broker Commis. $0.25 – $0.80 (retail prop)
TOTAL $1.60 – $2.30 per side
Round Turn: (enter+exit) = $3.20 – $4.60 per contract
Final Notes
The Dskyz (DAFE) Aurora Divergence – Quant Master isn’t just a strategy—it’s a movement. Crafted with originality and driven by community passion, it rises above the flood of generic scripts to deliver a system that’s as powerful as it is beautiful. With its quant-grade logic, DAFE visuals, and robust risk controls, it empowers traders to tackle futures with confidence and style. Join the DAFE crew, light up your charts, and let’s outsmart the markets together!
(This publishing will most likely be taken down do to some miscellaneous rule about properly displaying charting symbols, or whatever. Once I've identified what part of the publishing they want to pick on, I'll adjust and repost.)
Use it with discipline. Use it with clarity. Trade smarter.
**I will continue to release incredible strategies and indicators until I turn this into a brand or until someone offers me a contract.
Created by Dskyz, powered by DAFE Trading Systems. Trade fast, trade bold.

Overnight ES Strategy: CBC + Fractal + RSI + ATR FilterThis script is designed for overnight trading of the E-mini S&P 500 futures (ES) between 6 PM and 11 PM EST.
It combines multiple technical confluences to generate high-probability buy and sell signals, focusing on volatility-rich, low-liquidity evening sessions.
Key Features:
Candle Body Confluence (CBC) Approximation:
Identifies candles with small real bodies compared to total range, simulating consolidation zones where price is likely to reverse.
Williams Fractal Confirmation:
Detects local tops and bottoms based on 5-bar fractal reversal patterns, helping validate breakout or reversal points.
RSI Filter:
Ensures momentum is supportive — buys only when RSI < 35 (oversold) and sells only when RSI > 65 (overbought).
ATR Volatility Filter:
Trades are only allowed if the Average True Range (ATR) exceeds a user-defined threshold, filtering out low-volatility, risky environments.
Time Session Control:
Signals are only generated during the user-defined evening session (default: 6 PM to 11 PM EST) to match market behavior.
Real-Time Alerts Enabled:
Alerts can be set for BUY or SELL conditions, enabling mobile notifications, emails, or pop-ups without constant chart monitoring.
Recommended Settings:
Chart Timeframe: 15-minute or 30-minute candles
Assets: ES Mini (ES1!), NQ Mini, or other CME futures
Session: New York Time (EST)
ATR Threshold: Adjust based on market conditions; 5.0 suggested starting point for ES Mini on 15m.
Important:
This script only plots signals, it does not auto-execute trades.
Always backtest and paper trade before using live capital.
Volatility can vary; consider adjusting RSI and ATR filters based on market environment.
Credits:
Script designed based on confluence of price action, momentum, reversal structure, and volatility filtering principles used by professional traders.
Inspired by Candle Body Confluence (CBC) theory and Williams fractal techniques.

Bullish and Bearish Breakout Alert for Gold Futures PullbackBelow is a Pine Script (version 6) for TradingView that includes both bullish and bearish breakout conditions for my intraday trading strategy on micro gold futures (MGC). The strategy focuses on scalping two-legged pullbacks to the 20 EMA or key levels with breakout confirmation, tailored for the Apex Trader Funding $300K challenge. The script accounts for the Daily Sentiment Index (DSI) at 87 (overbought, favoring pullbacks). It generates alerts for placing stop-limit orders for 175 MGC contracts, ensuring compliance with Apex’s rules ($7,500 trailing threshold, $20,000 profit target, 4:59 PM ET close).
Script Requirements
Version: Pine Script v6 (latest for TradingView, April 2025).
Purpose:
Bullish: Alert when price breaks above a rejection candle’s high after a two-legged pullback to the 20 EMA in a bullish trend (price above 20 EMA, VWAP, higher highs/lows).
Bearish: Alert when price breaks below a rejection candle’s low after a two-legged pullback to the 20 EMA in a bearish trend (price below 20 EMA, VWAP, lower highs/lows).
Context: 5-minute MGC chart, U.S. session (8:30 AM–12:00 PM ET), avoiding overbought breakouts above $3,450 (DSI 87).
Output: Alerts for stop-limit orders (e.g., “Buy: Stop=$3,377, Limit=$3,377.10” or “Sell: Stop=$3,447, Limit=$3,446.90”), quantity 175 MGC.
Apex Compliance: 175-contract limit, stop-losses, one-directional news trading, close by 4:59 PM ET.
How to Use the Script in TradingView
1. Add Script:
Open TradingView (tradingview.com).
Go to “Pine Editor” (bottom panel).
Copy the script from the content.
Click “Add to Chart” to apply to your MGC 5-minute chart .
2. Configure Chart:
Symbol: MGC (Micro Gold Futures, CME, via Tradovate/Apex data feed).
Timeframe: 5-minute (entries), 15-minute (trend confirmation, manually check).
Indicators: Script plots 20 EMA and VWAP; add RSI (14) and volume manually if needed .
3. Set Alerts:
Click the “Alert” icon (bell).
Add two alerts:
Bullish Breakout: Condition = “Bullish Breakout Alert for Gold Futures Pullback,” trigger = “Once Per Bar Close.”
Bearish Breakout: Condition = “Bearish Breakout Alert for Gold Futures Pullback,” trigger = “Once Per Bar Close.”
Customize messages (default provided) and set notifications (e.g., TradingView app, SMS).
Example: Bullish alert at $3,377 prompts “Stop=$3,377, Limit=$3,377.10, Quantity=175 MGC” .
4. Execute Orders:
Bullish:
Alert triggers (e.g., stop $3,377, limit $3,377.10).
In TradingView’s “Order Panel,” select “Stop-Limit,” set:
Stop Price: $3,377.
Limit Price: $3,377.10.
Quantity: 175 MGC.
Direction: Buy.
Confirm via Tradovate.
Add bracket order (OCO):
Stop-loss: Sell 175 at $3,376.20 (8 ticks, $1,400 risk).
Take-profit: Sell 87 at $3,378 (1:1), 88 at $3,379 (2:1) .
Bearish:
Alert triggers (e.g., stop $3,447, limit $3,446.90).
Select “Stop-Limit,” set:
Stop Price: $3,447.
Limit Price: $3,446.90.
Quantity: 175 MGC.
Direction: Sell.
Confirm via Tradovate.
Add bracket order:
Stop-loss: Buy 175 at $3,447.80 (8 ticks, $1,400 risk).
Take-profit: Buy 87 at $3,446 (1:1), 88 at $3,445 (2:1) .
5. Monitor:
Green triangles (bullish) or red triangles (bearish) confirm signals.
Avoid bullish entries above $3,450 (DSI 87, overbought) or bearish entries below $3,296 (support) .
Close trades by 4:59 PM ET (set 4:50 PM alert) .

Dskyz (DAFE) MAtrix with ATR-Powered Precision Dskyz (DAFE) MAtrix with ATR-Powered Precision
This cutting‐edge futures trading strategy built to thrive in rapidly changing market conditions. Developed for high-frequency futures trading on instruments such as the CME Mini MNQ, this strategy leverages a matrix of sophisticated moving averages combined with ATR-based filters to pinpoint high-probability entries and exits. Its unique combination of adaptable technical indicators and multi-timeframe trend filtering sets it apart from standard strategies, providing enhanced precision and dynamic responsiveness.
imgur.com
Core Functional Components
1. Advanced Moving Averages
A distinguishing feature of the DAFE strategy is its robust, multi-choice moving averages (MAs). Clients can choose from a wide array of MAs—each with specific strengths—in order to fine-tune their trading signals. The code includes user-defined functions for the following MAs:
imgur.com
Hull Moving Average (HMA):
The hma(src, len) function calculates the HMA by using weighted moving averages (WMAs) to reduce lag considerably while smoothing price data. This function computes an intermediate WMA of half the specified length, then a full-length WMA, and finally applies a further WMA over the square root of the length. This design allows for rapid adaptation to price changes without the typical delays of traditional moving averages.
Triple Exponential Moving Average (TEMA):
Implemented via tema(src, len), TEMA uses three consecutive exponential moving averages (EMAs) to effectively cancel out lag and capture price momentum. The final formula—3 * (ema1 - ema2) + ema3—produces a highly responsive indicator that filters out short-term noise.
Double Exponential Moving Average (DEMA):
Through the dema(src, len) function, DEMA calculates an EMA and then a second EMA on top of it. Its simplified formula of 2 * ema1 - ema2 provides a smoother curve than a single EMA while maintaining enhanced responsiveness.
Volume Weighted Moving Average (VWMA):
With vwma(src, len), this MA accounts for trading volume by weighting the price, thereby offering a more contextual picture of market activity. This is crucial when volume spikes indicate significant moves.
Zero Lag EMA (ZLEMA):
The zlema(src, len) function applies a correction to reduce the inherent lag found in EMAs. By subtracting a calculated lag (based on half the moving average window), ZLEMA is exceptionally attuned to recent price movements.
Arnaud Legoux Moving Average (ALMA):
The alma(src, len, offset, sigma) function introduces ALMA—a type of moving average designed to be less affected by outliers. With parameters for offset and sigma, it allows customization of the degree to which the MA reacts to market noise.
Kaufman Adaptive Moving Average (KAMA):
The custom kama(src, len) function is noteworthy for its adaptive nature. It computes an efficiency ratio by comparing price change against volatility, then dynamically adjusts its smoothing constant. This results in an MA that quickly responds during trending periods while remaining smoothed during consolidation.
Each of these functions—integrated into the strategy—is selectable by the trader (via the fastMAType and slowMAType inputs). This flexibility permits the tailored application of the MA most suited to current market dynamics and individual risk management preferences.
2. ATR-Based Filters and Risk Controls
ATR Calculation and Volatility Filter:
The strategy computes the Average True Range (ATR) over a user-defined period (atrPeriod). ATR is then used to derive both:
Volatility Assessment: Expressed as a ratio of ATR to closing price, ensuring that trades are taken only when volatility remains within a safe, predefined threshold (volatilityThreshold).
ATR-Based Entry Filters: Implemented as atrFilterLong and atrFilterShort, these conditions ensure that for long entries the price is sufficiently above the slow MA and vice versa for shorts. This acts as an additional confirmation filter.
Dynamic Exit Management:
The exit logic employs a dual approach:
Fixed Stop and Profit Target: Stops and targets are set at multiples of ATR (fixedStopMultiplier and profitTargetATRMult), helping manage risk in volatile markets.
Trailing Stop Adjustments: A trailing stop is calculated using the ATR multiplied by a user-defined offset (trailOffset), which captures additional profits as the trade moves favorably while protecting against reversals.
3. Multi-Timeframe Trend Filtering
The strategy enhances its signal reliability by leveraging a secondary, higher timeframe analysis:
15-Minute Trend Analysis:
By retrieving 15-minute moving averages (fastMA15m and slowMA15m) via request.security, the strategy determines the broader market trend. This secondary filter (enabled or disabled through useTrendFilter) ensures that entries are aligned with the prevailing market direction, thereby reducing the incidence of false signals.
4. Signal and Execution Logic
Combined MA Alignment:
The entry conditions are based primarily on the alignment of the fast and slow MAs. A long condition is triggered when the current price is above both MAs and the fast MA is above the slow MA—complemented by the ATR filter and volume conditions. The reverse applies for a short condition.
Volume and Time Window Validation:
Trades are permitted only if the current volume exceeds a minimum (minVolume) and the current hour falls within the predefined trading window (tradingStartHour to tradingEndHour). An additional volume spike check (comparing current volume to a moving average of past volumes) further filters for optimal market conditions.
Comprehensive Order Execution:
The strategy utilizes flexible order execution functions that allow pyramiding (up to 10 positions), ensuring that it can scale into positions as favorable conditions persist. The use of both market entries and automated exits (with profit targets, stop-losses, and trailing stops) ensures that risk is managed at every step.
5. Integrated Dashboard and Metrics
For transparency and real-time analysis, the strategy includes:
On-Chart Visualizations:
Both fast and slow MAs are plotted on the chart, making it easy to see the market’s technical foundation.
Dynamic Metrics Dashboard:
A built-in table displays crucial performance statistics—including current profit/loss, equity, ATR (both raw and as a percentage), and the percentage gap between the moving averages. These metrics offer immediate insight into the health and performance of the strategy.
Input Parameters: Detailed Breakdown
Every input is meticulously designed to offer granular control:
Fast & Slow Lengths:
Determine the window size for the fast and slow moving averages. Smaller values yield more sensitivity, while larger values provide a smoother, delayed response.
Fast/Slow MA Types:
Choose the type of moving average for fast and slow signals. The versatility—from basic SMA and EMA to more complex ones like HMA, TEMA, ZLEMA, ALMA, and KAMA—allows customization to fit different market scenarios.
ATR Parameters:
atrPeriod and atrMultiplier shape the volatility assessment, directly affecting entry filters and risk management through stop-loss and profit target levels.
Trend and Volume Filters:
Inputs such as useTrendFilter, minVolume, and the volume spike condition help confirm that a trade occurs in active, trending markets rather than during periods of low liquidity or market noise.
Trading Hours:
Restricting trade execution to specific hours (tradingStartHour and tradingEndHour) helps avoid illiquid or choppy markets outside of prime trading sessions.
Exit Strategies:
Parameters like trailOffset, profitTargetATRMult, and fixedStopMultiplier provide multiple layers of risk management and profit protection by tailoring how exits are generated relative to current market conditions.
Pyramiding and Fixed Trade Quantity:
The strategy supports multiple entries within a trend (up to 10 positions) and sets a predefined trade quantity (fixedQuantity) to maintain consistent exposure and risk per trade.
Dashboard Controls:
The resetDashboard input allows for on-the-fly resetting of performance metrics, keeping the strategy’s performance dashboard accurate and up-to-date.
Why This Strategy is Truly Exceptional
Multi-Faceted Adaptability:
The ability to switch seamlessly between various moving average types—each suited to particular market conditions—enables the strategy to adapt dynamically. This is a testament to the high level of coding sophistication and market insight infused within the system.
Robust Risk Management:
The integration of ATR-based stops, profit targets, and trailing stops ensures that every trade is executed with well-defined risk parameters. The system is designed to mitigate unexpected market swings while optimizing profit capture.
Comprehensive Market Filtering:
By combining moving average crossovers with volume analysis, volatility thresholds, and multi-timeframe trend filters, the strategy only enters trades under the most favorable conditions. This multi-layered filtering reduces noise and enhances signal quality.
-Final Thoughts-
The Dskyz Adaptive Futures Elite (DAFE) MAtrix with ATR-Powered Precision strategy is not just another trading algorithm—it is a multi-dimensional, fully customizable system built on advanced technical principles and sophisticated risk management techniques. Every function and input parameter has been carefully engineered to provide traders with a system that is both powerful and transparent.
For clients seeking a state-of-the-art trading solution that adapts dynamically to market conditions while maintaining strict discipline in risk management, this strategy truly stands in a class of its own.
****Please show support if you enjoyed this strategy. I'll have more coming out in the near future!!
-Dskyz
Caution
DAFE is experimental, not a profit guarantee. Futures trading risks significant losses due to leverage. Backtest, simulate, and monitor actively before live use. All trading decisions are your responsibility.

10K's RTH open ±0.35% for CMEInstant Visualization of ±0.35% from RTH Open — Spot Intraday Reversals at a Glance!
This is a visual tool designed for the U.S. regular trading hours (RTH), which instantly highlights the ±0.35% range from the RTH opening price of futures at the start of the session.
The range is displayed as a light purple box, accompanied by a dashed line marking the exact opening price, helping traders quickly assess how price reacts around this key level.
With adjustable transparency settings, this tool is ideal for intraday analysis of price positioning and directional strength — a valuable aid for short-term trading strategies.

Circuit Breaker - MFFUThis Indicator Is Used To Protect User From Over Trading After Market Hit The Circuit Breakers.
The CME Exchange Usually Halts Trading If Market Hit + or - 7%.
To Protect Users From Extreme Volatile Condition MFFU, Halts Trading If Market Hits + or - 5%.
This Indicator helps us to plot the circuit breaking lines helping us to when to stop trading.

Market Clock with Inline HoursThis script displays a powerful, configurable market session clock that shows the open/closed status and trading hours for major global financial markets — including specialized logic for NY Futures (Globex).
🔑 Key Features:
✅ Real-Time Session Status:
Shows whether each selected market is currently OPEN or CLOSED, based on the user’s selected time zone.
✅ NY Futures Weekend Logic:
Built-in logic ensures NY Futures are marked CLOSED:
Friday after 5:00 PM ET
All of Saturday
Sunday until 6:00 PM ET
This reflects the true CME Globex trading schedule.
✅ 12-Hour Format + Timezone Labels:
Session hours are displayed in 12-hour AM/PM format alongside their associated timezone (EST, GMT, JST, etc.) for clarity.
✅ Fully Configurable Markets:
You can choose to display:
NY Market (RTH)
NY Futures (Globex)
London
Tokyo
Frankfurt
And you can easily toggle them on/off in the settings.
✅ Text Size & Position Customization:
Easily control the text size (tiny → huge) and screen position (top/bottom, left/center/right).
✅ Auto Timezone Offset Support:
Select from a list of common time zones (EST, UTC, JST, etc.), or enter your own custom UTC offset for global flexibility.
✅ Compact & Clean Design:
The layout groups each market’s:
Real-time OPEN/CLOSED status
Trading hours
All into a single column, making the layout clean and dashboard-ready.
🧠 Who is this for?
Day traders
Futures traders
Forex traders
Anyone who tracks multiple time zones or global markets
📌 Notes:
Clock updates based on chart timeframe (e.g., every 1m on a 1-minute chart)
Pine Script doesn't support real-time per-second updates, but works well for market status tracking
💬 Feedback Welcome!
This script was designed to be lightweight and user-friendly. Suggestions and improvements are always welcome — feel free to leave a comment or reach out directly.

Historical High/Lows Statistical Analysis(More Timeframe interval options coming in the future)
Indicator Description
The Hourly and Weekly High/Low (H/L) Analysis indicator provides a powerful tool for tracking the most frequent high and low points during different periods, specifically on an hourly basis and a weekly basis, broken down by the days of the week (DOTW). This indicator is particularly useful for traders seeking to understand historical behavior and patterns of high/low occurrences across both hourly intervals and weekly days, helping them make more informed decisions based on historical data.
With its customizable options, this indicator is versatile and applicable to a variety of trading strategies, ranging from intraday to swing trading. It is designed to meet the needs of both novice and experienced traders.
Key Features
Hourly High/Low Analysis:
Tracks and displays the frequency of hourly high and low occurrences across a user-defined date range.
Enables traders to identify which hours of the day are historically more likely to set highs or lows, offering valuable insights into intraday price action.
Customizable options for:
Hourly session start and end times.
22-hour session support for futures traders.
Hourly label formatting (e.g., 12-hour or 24-hour format).
Table position, size, and design flexibility.
Weekly High/Low Analysis by Day of the Week (DOTW):
Captures weekly high and low occurrences for each day of the week.
Allows traders to evaluate which days are most likely to produce highs or lows during the week, providing insights into weekly price movement tendencies.
Displays the aggregated counts of highs and lows for each day in a clean, customizable table format.
Options for hiding specific days (e.g., weekends) and customizing table appearance.
User-Friendly Table Display:
Both hourly and weekly data are displayed in separate tables, ensuring clarity and non-interference.
Tables can be positioned on the chart according to user preferences and are designed to be visually appealing yet highly informative.
Customizable Date Range:
Users can specify a start and end date for the analysis, allowing them to focus on specific periods of interest.
Possible Uses
Intraday Traders (Hourly Analysis):
Analyze hourly price action to determine which hours are more likely to produce highs or lows.
Identify intraday trading opportunities during statistically significant time intervals.
Use hourly insights to time entries and exits more effectively.
Swing Traders (Weekly DOTW Analysis):
Evaluate weekly price patterns by identifying which days of the week are more likely to set highs or lows.
Plan trades around days that historically exhibit strong movements or price reversals.
Futures and Forex Traders:
Use the 22-hour session feature to exclude the CME break or other session-specific gaps from analysis.
Combine hourly and DOTW insights to optimize strategies for continuous markets.
Data-Driven Trading Strategies:
Use historical high/low data to test and refine trading strategies.
Quantify market tendencies and evaluate whether observed patterns align with your strategy's assumptions.
How the Indicator Works
Hourly H/L Analysis:
The indicator calculates the highest and lowest prices for each hour in the specified date range.
Each hourly high and low occurrence is recorded and aggregated into a table, with counts displayed for all 24 hours.
Users can toggle the visibility of empty cells (hours with no high/low occurrences) and adjust the table's design to suit their preferences.
Supports both 12-hour (AM/PM) and 24-hour formats.
Weekly H/L DOTW Analysis:
The indicator tracks the highest and lowest prices for each day of the week during the user-specified date range.
Highs and lows are identified for the entire week, and the specific days when they occur are recorded.
Counts for each day are aggregated and displayed in a table, with a "Totals" column summarizing the overall occurrences.
The analysis resets weekly, ensuring accurate tracking of high/low days.
Code Breakdown:
Data Aggregation:
The script uses arrays to store counts of high/low occurrences for both hourly and weekly intervals.
Daily data is fetched using the request.security() function, ensuring consistent results regardless of the chart's timeframe.
Weekly Reset Mechanism:
Weekly high/low values are reset at the start of a new week (Monday) to ensure accurate weekly tracking.
A processing flag ensures that weekly data is counted only once at the end of the week (Sunday).
Table Visualization:
Tables are created using the table.new() function, with customizable styles and positions.
Header rows, data rows, and totals are dynamically populated based on the aggregated data.
User Inputs:
Customization options include text colors, background colors, table positioning, label formatting, and date ranges.
Code Explanation
The script is structured into two main sections:
Hourly H/L Analysis:
This section captures and aggregates high/low occurrences for each hour of the day.
The logic is session-aware, allowing users to define custom session times (e.g., 22-hour futures sessions).
Data is displayed in a clean table format with hourly labels.
Weekly H/L DOTW Analysis:
This section tracks weekly highs and lows by day of the week.
Highs and lows are identified for each week, and counts are updated only once per week to prevent duplication.
A user-friendly table displays the counts for each day of the week, along with totals.
Both sections are completely independent of each other to avoid interference. This ensures that enabling or disabling one section does not impact the functionality of the other.
Customization Options
For Hourly Analysis:
Toggle hourly table visibility.
Choose session start and end times.
Select hourly label format (12-hour or 24-hour).
Customize table appearance (colors, position, text size).
For Weekly DOTW Analysis:
Toggle DOTW table visibility.
Choose which days to include (e.g., hide weekends).
Customize table appearance (colors, position, text size).
Select values format (percentages or occurrences).
Conclusion
The Hourly and Weekly H/L Analysis indicator is a versatile tool designed to empower traders with data-driven insights into intraday and weekly market tendencies. Its highly customizable design ensures compatibility with various trading styles and instruments, making it an essential addition to any trader's toolkit.
With its focus on accuracy, clarity, and customization, this indicator adheres to TradingView's guidelines, ensuring a robust and valuable user experience.

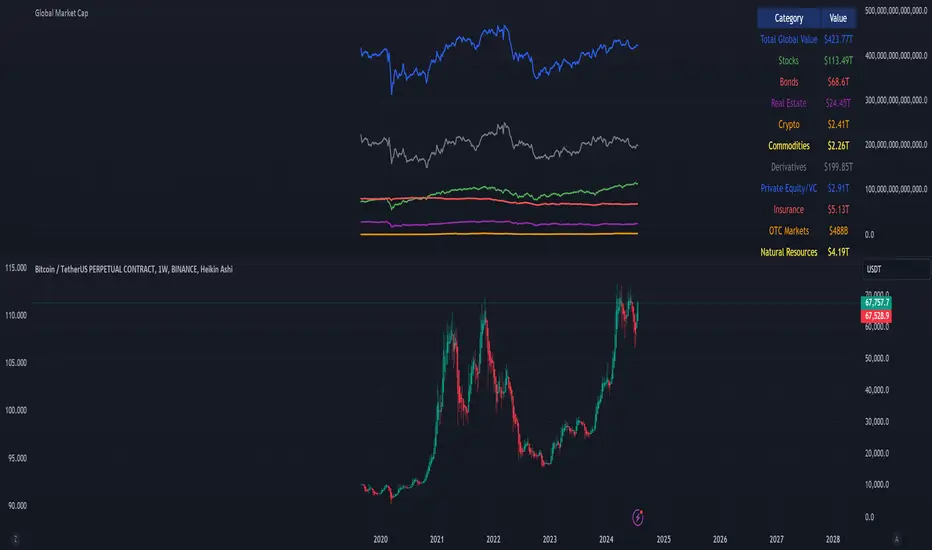
Global Market Cap of all measuable assets# Comprehensive Global Market Cap Overview
This indicator provides a dynamic, real-time estimate of the total global market value across multiple asset classes and economic sectors. It aims to give traders and analysts a broad perspective on the state of global markets and wealth.
## Features:
- Real-time data for major market segments including stocks, bonds, real estate, cryptocurrencies, and commodities
- Estimates for hard-to-quantify sectors like derivatives, private equity, and OTC markets
- Includes often-overlooked categories such as cash deposits, insurance markets, and natural resources
- Static estimates for art/collectibles and intellectual property
- Total global value calculation and breakdown by category
- Easy-to-read table display of all categories
## Categories Tracked:
1. Global Stock Market
2. Global Bond Market
3. Real Estate
4. Cryptocurrencies
5. Commodities
6. Derivatives Market
7. Private Equity and Venture Capital
8. Cash and Bank Deposits
9. Insurance Markets
10. Sovereign Wealth Funds
11. OTC Markets
12. Natural Resources
13. Art and Collectibles
14. Intellectual Property
## Data Sources:
- Uses popular ETFs and indices as proxies for global markets where possible
- Incorporates data from specific company stocks to represent certain markets (e.g., CME for derivatives, OTCM for OTC markets)
- Utilizes FRED data for bank deposits
- Includes static estimates for categories without reliable real-time data sources
## Notes:
- All values are approximate and should be used for general perspective rather than precise financial analysis
- Some categories use scaled proxy data, which may not perfectly represent global totals
- Static estimates are used where real-time data is unavailable and should be updated periodically
- The total global value includes human capital but this is not displayed in the table due to its speculative nature
This indicator is designed to provide a comprehensive overview of global market value, going beyond traditional market capitalization metrics. It's ideal for traders, researchers, and anyone interested in gaining a broader understanding of global wealth distribution across various sectors.
Please note that due to the complexity of global markets and limitations in data availability, all figures should be considered estimates and used as part of a broader analysis rather than as definitive values.
Opening Range Gap + Std Dev [starclique]The ICT Opening Range Gap is a concept taught by Inner Circle Trader and is discussed in the videos: 'One Trading Setup For Life' and 2023 ICT Mentorship - Opening Range Gap Repricing Macro
ORGs, or Opening Range Gaps, are gaps that form only on the Regular Trading Hours chart.
The Regular Trading Hours gap occurs between 16:15 PM - 9:29 AM EST (UTC-4)
These times are considered overnight trading, so it is useful to filter the PA (price action) formed there.
The RTH option is only available for futures contracts and continuous futures from CME Group.
To change your chart to RTH, first things first, make sure you’re looking at a futures contract for an asset class, then on the bottom right of your chart, you’ll see ETH (by default) - Click on that, and change it to RTH.
Now your charts are filtering the price action that happened overnight.
To draw out your gap, use the Close of the 4:14 PM candle and the open of the 9:30 AM candle.
How is this concept useful?
Well, It can be used in many ways.
---
How To Use The ORG
One of the ways you can use the opening range gap is simply as support and resistance
If we extend out the ORG from the example above, we can see that there is a clean retest of the opening range gap high after breaking structure to the upside and showing acceptance outside of the gap after consolidating within it.
The ORG High (4:14 Candle Close in this case) was used as support.
We then see an expansion to the upside.
Another way to implement the ORG is by using it as a draw on liquidity (magnet for price)
In this example, if we looked to the left, there was a huge ORG to the downside, leaving a massive gap.
The market will want to rebalance that gap during the regular trading hours.
The market rallies higher, rejects, comes down to clear the current days ORG low, then closes.
That is one example of how you can combine liquidity & ICT market structure concepts with Opening Range Gaps to create a story in the charts.
Now let’s discuss standard deviations.
---
Standard Deviations
Standard Deviations are essentially projection levels for ranges / POIs (Point of Interests)
By this I mean, if you have a range, and you would like to see where it could potentially expand to, you’d place your fibonacci retracement tool on and high and low of the range, then use extension levels to find specific price points where price might reject from.
Since 0 and 1 are your Range High and Low respectively, your projection levels would be something like 1.5, 2, 2.5, and 3, for the extension from your 1 Fib Level, and -0.5, -1, -1.5, and -2 for your 0 Fib level.
The -1 and 2 level produce a 1:1 projection of your range low and high, meaning, if you expect price to expand as much as it did from the range low to range high, then you can project a -1 and 2 on your Fib, and it would show you what ICT calls “symmetrical price”
Now, how are standard deviations relevant here?
Well, if you’ve been paying attention to ICT’s recent videos, you would’ve caught that he’s recently started using Standard Deviation levels on breakers.
So my brain got going while watching his video on ORGs, and I decided to place the fib on the ORG high and low and see what it’d produce.
The results were very interesting.
Using this same example, if we place our fib on the ORG High and Low, and add some projection levels, we can see that we rejected right at the -2 Standard Deviation Level.
---
You can see that I also marked out the EQ (Equilibrium, 50%, 0.5 of Fib) of the ORG. This is because we can use this level as a take profit level if we’re using an old ORG as our draw.
In days like these, where the gap formed was within a consolidation, and it continued to consolidate within the ORG zone that we extended, we can use the EQ in the same way we’d use an EQ for a range.
If it’s showing acceptance above the EQ, we are bullish, and expect the high of the ORG to be tapped, and vice versa.
---
Using The Indicator
Here’s where our indicator comes in play.
To avoid having to do all this work of zooming in and marking out the close and open of the respective ORG candles, we created the Opening Range Gap + Standard Deviations Indicator, with the help of our dedicated Star Clique coder, a1tmaniac.
With the ORG + STD DEV indicator, you will be able to view ORG’s and their projections on the ETH (Electronic Trading Hours) chart.
---
Features
Range Box
- Change the color of your Opening Range Gap to your liking
- Enable or disable the box from appearing using the checkbox
Range Midline
- Change the color of your Opening Range Gap Equilibrium
- Enable or disable the midline from appearing using the checkbox
Std. Dev
- Add whichever standard deviation levels you’d like.
- By default, the indicator comes with 0.5, 1, 1.5, and 2 standard deviation levels.
- Ensure that you add a comma ( , ) in between each standard deviation level
- Enable or disable the standard deviations from appearing using the opacity of the color (change to 0%)
Labels / Offset
- Adjust the offset of the label for the Standard Deviations
- Enable or disable the Labels from appearing using the checkbox
Time
- Adjust the time used for the indicators range
- If you’d like to use this for a Session or ICT Killzone instead, adjust the time
- Adjust the timezone used for the time referenced
- Options are UTC, US (UTC-4, New York Local Time) or UK (UTC+1, London Time)
- By default, the indicator is set to US

itradesize /\ Overnight Session & Silver BulletOvernight Session & Silver Bullet indicator
The indicator can be divided into two separate stuff:
ONS ( Overnight Session ) based on TCM’s ( TheCurrencyMerchant ) theory and Silver Bullet based on what ICT ( InnerCircleTrader ) is teaching to us.
Overnight Session
• ONS will be always based on Chicago 4am to 8am time according to TCM’s CME teaching.
The indicator has the option to show TSO ( Today’s session only ) which is good to have the chart not messed up by it. At this time when it comes to backtesting just turn this off to have the past ONS and SB ranges showed up on your chart.
• Mid line at the ONS range is useful to have as you are able to decide wether price is in a premium or a discount under the ONS.
If Im a buyer target is above the range, if Im a seller target is below the range.
• You are also able to have SD ( Standard Deviation ) lines for price projections. In the variety of TCM’s videos you are able to have a deeper knowledge.
• You can also extend Today’s ONS lines to the very end of the chart which could make an easier looking on the levels you eyeing with.
Silver Bullet
It’s based on New York time as ICT ( Inner Circle Trader ) is always teaching to us that we should use New York time, every time when it comes to his concepts.
Silver Bullets are always be there aiming of an opposing liquidity pool. They are working even on choppy days.
Silver Bullet hours:
• 03:00 - 04:00am NY Time
• 10:00 - 11:00am NY Time
• 02:00 - 03:00pm NY Time
SB highlighted areas could be shown as a box or a range according to your taste, with or without Start/End lines.
Both of them ca be used to form trades.
You should dig yourself into Silver Bullet ( InnerCircleTrader ) and Overnight Session ( TheCurrencyMerchant ) teachings before the use of the indicator.
Simple setups
• Silver Bullet
Look 20-30 minutes before any SB where the Buy or Sell program has started.
Where the first 1m FVG ( Fair Value Gap ) appears under the range, enter the trade.
Expect only a 5 handle move as a beginner.
1m chart is a must for these kind of FVG entries. ( 30s , 15s can also be used )
• ONS
Price is trading aggressively out of the range to take liquidity.
Once price grabbed liquidity that candle on the 3-5m could considered as on order block for the further movement.
If you are trading in the range, then the opposite side can be the target, if its out of the range and trading one sided, then use standard deviations as 0.5 is a minimum target.

Pivot Highs&lows: Short/Medium/Long-term + Spikeyness FilterShows Pivot Highs & Lows defined or 'Graded' on a fractal basis: Short-term, medium-term and long-term. Also applies 'Spikeyness' condition by default to filter-out weak/rounded pivots
ES1! 4hr chart (CME) shown above, with lookback = 15; clearly identifying the major highs & lows on the basis of how they are fractally 'nested' within lesser Pivots.
-- in the above chart Short term pivot highs (STH) are simply represented by green 'ʌ', and short-term pivot lows (STL) are simply represented by orange 'v'.
//Basics: (as applying to pivot highs, the following is reversed for pivot lows)
-Short term highs (STH) are simple pivot highs, albeit refined from standard with the 'spikeyness' filter.
-Medium-term highs (MTH) are defined as having a lower STH on either side of them.
-Long-term highs (LTH) are defined as having a lower MTH on either side of them.
//Purpose:
-Education: Quick and easy visualization of the strength or importance of a pivot high or low; a way of grading them based on their larger context.
-Backtesting: use in combination with other trading methods when backtesting to see the relative significance and price sensitivity of LTHs/LTLs compared to lower grade highs and lows.
//Settings:
-Choose Pivot lookback/lookforward bars: One setting, the basis from which all further pivot calculations are done.
-Toggle on/off 'Spikeyness' condition to filter-out weak/rounded/unimpressive pivot highs or lows (default is ON).
-Toggle on/off each of STH, MTH, LTH, STL, MTL, LTL; and choose label text-styles/colors/sizes independently.
-Set text Vertically, horizonally, or simply use 'ʌ' or 'v' symbols if you want to declutter your chart.
//Usage notes:
-Pivots take time to print (lookback bars must have elapsed before confirmation). Fractally nested pivots as here (i.e. a LTH), take even longer to print/confirm, so please be patient.
-Works across timeframes & Assets. Different timeframes may require slightly tweaked lookback/forward settings for optimal use; default is 15 bars.
Example usage with just symbolic labels short-term, med-term, long-term with 1x, 2x and 3x ʌ/v respectively:

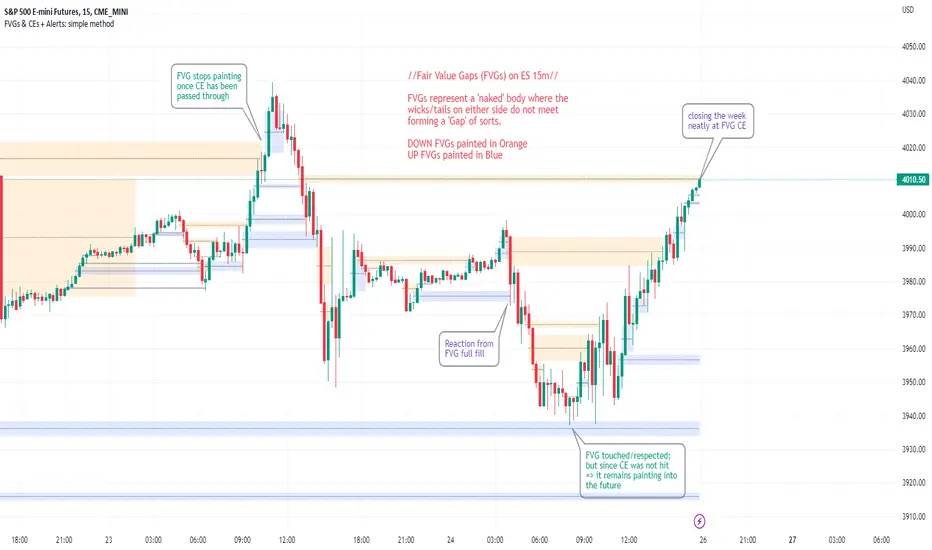
FVGs & CEs + Alerts: simple & efficient methodFair Value Gap indicator: Paints FVGs and their midlines (CEs). Stops painting when CE is hit, or when fully filled; user choice of threshold. This threshold is also used in the Alert conditions.
~~Plotted here on ES1! (CME), on the 15m timeframe~~
-A FVG represents a 'naked' body where the wicks/tails on either side do not meet. This can be seen as a type of 'gap', which price will have a tendency to want to re-fill (in part or in full).
-The midline (CE, or 'Consequent encroachment') of FVGs also tend to show price sensitivity.
-This indicator paints all FVGs until priced into, and should give an idea of which are more meaningful and which are best ignored (based on context: location, Time of day, market structure, etc).
-This is a simpler and more efficient method of painting Fair value gaps which auto-stop painting when price reaches them.
//Aims of Publishing:
-Education of ICT concepts of Fair Value Gaps and their midlines (CEs): To easily see via forward testing or backtesting, the sensitivity that price shows to these areas & levels.
-Demonstration of a much more efficient way of plotting FVGs which terminate at price, thanks to a modification of @Bjorgums's clever looping method referenced below.
//Settings:
-Toggle on/off upward and downward FVGs independently(blue and orange by default).
-Toggle on/off midline (CE).
-Standard color/line formatting options.
-Choose Threshold: CE of FVG or Full Fill of FVG: This will determine both the 'stop-painting' trigger and the 'Alert' trigger.
-Choose number of days lookback to control how many historical FVGs paint on chart.
//On alerts:
-Simple choice of 2 alerts:
~~One for price crossing into/above the nearest untouched 'premium' FVG above ( orange ). Trigger is user choice of CE or full fill.
~~Another for price crossing into/below the nearest untouched 'discount' FVG below (blue). Trigger is user choice of CE or full fill.
-Alerts set via the three dots in indicator status line.
//Cautionary notes:
-Do not use the alerts blindly to find trades. Wait until you have identified a good FVG above/below which you think price may show sensitivity to
-Usage on very low timeframes can cause unexpected results with alerts: due to new FVGs forming in realtime the Alert will always trigger at the most recent FVG above/ below having its threshold hit.
-Big thank you to @Bjorgum for his fantastic extendAndRemove method. Modified here for use with boxes and to integrate Alerts.
-Also Credit to ICT (inner circle trader) for the concepts used here: Fair value gaps and their Consequent Encroachment (CE).
Herrick Payoff Index DailyModified to include new daily open interest from CME futures contracts versus old script that only captured weekly data from commitment of traders data. Script can now be used on monthly and continuous contract traded on CME.

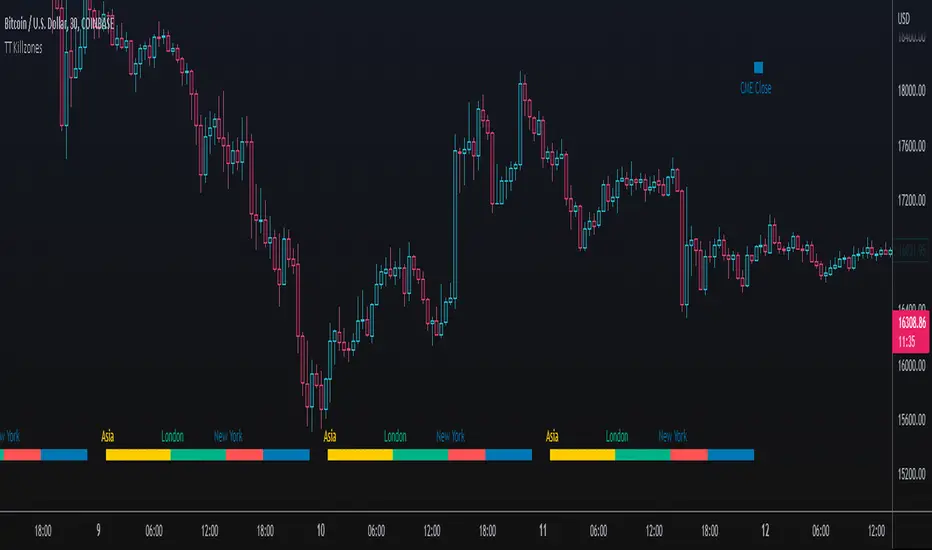
TT KillzonesThis indicator plots the 3 main trading zones : Asia, London, New York
Its is also possible to use a different color for the "High Trading Volume" timezone. It can be adjusted. Default is the overlapping time of London and New York Killzone
It also plots the CME open / close
This indocator can be used as example / copy for your own project!
Have fun!
ILM CFTC COT Disaggregated PlotUse this indicator on Daily Timeframe
Please refer to the below link for CFTC Disaggregated COT
www.cftc.gov
This script is very similar to COT Financial Plot indicator except that it plots the data for Disaggregated Futures


.b pin-up symbolWhen trading cryptocoins, it is necessary to check the price trend of NASDAQ, BTC.D, BTC.OI, BTC spot or other coins of similar groups.
However it is very cumbersome to put a comparison symbol in the Tradingview chart and combine individual indicators one by one.
Moreover even with such a combination, the chart is messy and visibility is not good.
This script was developed as a composite-solution to that situation, and will make you happy.
- NQ1!, USTECH100CFD | symbol fixed
- BTC.Dominance, BTC.OpenInterest, BTC symbol, others pin-up-symbol | selectable
- Pin-up-symbol | selectable
- Pin-up-symbol's candle chart
- Trending
* EMA 9,21,50,200 ribbon classic EMA
* .b price line ; .b price = unique trending price with price-action + relative-volume-action + ATR
* Dynamic S/R Cloud ; BB + donchian band + high/low + atr mixed custom-logic
* VWWMA + .b price Shadow ; Volume-weighted WMA on .b price = unique MA faster than classic VWMA
Trending shadow direction is not bad even on low-timeframe (1, 2, 3, 5m, 15m...)
- Pattern
* Harmonic Pattern ; A simplified version of the harmonic pattern indicator, simply show-up pattern complete position
for reference only - adopted from HeWhoMustNotBeNamed's script.
- Information Panel
* BTC Dominance, BTC Open Interest, Pin-Up-Symbol price
* Trend meter ; 5,15,30,1h,2h,4h Meter Calc with 1 minute-timeframe candles
5 = Green if the current price is higher than the price 5 minutes ago.
1h = Green if the current price is higher than the price 2 hours ago.
4h = Red if the current price is lower than the price 4 hours ago.
* caution ; To use real-time chart of "CME_MINI:NQ1!" you have to additional subscribe CME data,
default setting is 'NQ1!' , you can change to 'USTECH100CFD'
* When you choose symbol which is closed trading hours, the script's update stopped.
Even if the selected pin-up-symbol is on trading hours, the currently selected symbol's chart doesn't update.
* recommended | chart setting > Appearance : Top margin 0%, Bottom margin 0% for optimized screen usage :)
if you have any questions freely contact to me by message on tradingview, or telegram @sr_bt
but please understand that responses may be quite late.
------------------------------------------------------------------------------------------------------------------------------------------------------------
copyright 2022 (sr_b)
Special thanks to all of contributors of community.
The script (originaly .b) may be freely distributed under the MIT license.
The other classic script code also may be freely distributed under the MIT license.
Simplified Harmonic script part | core adopted from 'Multi ZigZag Harmonic Patterns (HeWhoMustNotBeNamed)' MPL2.0 license

COT Report BTC Positions█ OVERVIEW
Showing the Commitments of Traders (COT) report(*) for BITCOIN Positions - CHICAGO MERCANTILE EXCHANGE (futures only) with COT charts on TradingView data.
* COT reports are released each Friday (except for U.S. holidays) by the CFTC.
* Each COT report release includes data from the previous Tuesday.
* Original data is www.cftc.gov
Data currently displayed are through April 12, 2022
█ FEATURES
You can switch the display for each of the following Positions :
Long
Short
You can switch the display for each of the following Categories :
Dealer
Asset manager
Leverage funds
Other reportable
Non reportable
█ HOW TO USE IT
This indicator allows you to see changes for each category within TradingView without having to refer directly to each report.
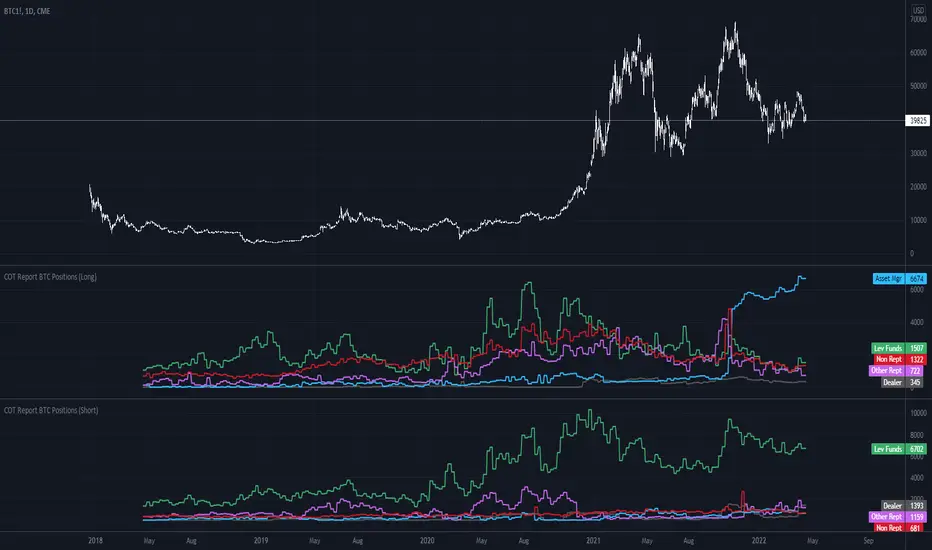
MicroStrategy MetricsA script showing all the key MSTR metrics. I will update the script every time degen Saylor sells some more office furniture to buy BTC.
All based around valuing MSTR, aside from its BTC holdings. I.e. the true market cap = enterprise value - BTC holdings. Hence, you're left with the value of the software business + any premium/discount decided by investors.
From this we can derive:
- BTC Holdings % of enterprise value
- Correlation to BTC (in this case we use CME futures...may change this)
- Equivalent Share Price (true market cap divided by shares outstanding)
- P/E Ratio (equivalent share price divided by quarterly EPS estimates x 4)
- Price to FCF Ratio (true market cap divided by FCF (ttm))
- Price to Revenue (^ but with total revenue (ttm))

Commitment of Traders: Legacy Metrics█ OVERVIEW
This indicator displays the Commitment of Traders (COT) legacy data for futures markets.
█ CONCEPTS
Commitment of Traders (COT) data is tallied by the Commodity Futures Trading Commission (CFTC) , a US federal agency that oversees the trading of derivative markets such as futures in the US. It is weekly data that provides traders with information about open interest for an asset. The CFTC oversees derivative markets traded on different exchanges, so COT data is available for assets that can be traded on CBOT, CME, NYMEX, COMEX, and ICEUS.
A detailed description of the COT report can be found on the CFTC's website .
COT data is separated into three notable reports: Legacy, Disaggregated, and Financial. This indicator presents data from the legacy report, which is broken down by exchange. Legacy reports break down the reportable open interest positions into two classifications: non-commercial and commercial traders.
Our other COT indicators are:
• Commitment of Traders: Disaggregated Metrics
• Commitment of Traders: Financial Metrics
• Commitment of Traders: Total
█ HOW TO USE IT
Load the indicator on an active chart (see here if you don't know how).
By default, the indicator uses the chart's symbol to derive the COT data it displays. You can also specify a CFTC code in the "CFTC code" field of the script's inputs to display COT data from a symbol different than the chart's.
The rest of this section documents the script's input fields.
Metric
Each metric represents a different column of the Commitment of Traders report. Details are available in the explanatory notes on the CFTC's website .
Here is a summary of the metrics:
• "Open Interest" is the total of all futures and/or option contracts entered into and not yet offset by a transaction, by delivery, by exercise, etc.
The aggregate of all long open interest is equal to the aggregate of all short open interest.
• "Traders Total" is the number of all unique reportable traders, regardless of the trading direction.
• "Traders Total Reportable/Traders Noncommercial/Traders Commercial" are the quantities of traders reported to hold any position with the specified direction.
All of a trader's reported futures positions in a commodity are classified as commercial if the trader uses futures contracts in that particular commodity for hedging.
To determine the total number of reportable traders in a market, a trader is counted only once, whether or not the trader appears in more than one category.
• "Total Reportable/Noncommercial/Commercial Positions" are all positions held by all reportable/non-commercial/commercial traders.
• "Non-reportable Positions" is derived by subtracting total long and short "Reportable Positions" from the total open interest.
Accordingly, the number of traders involved and the commercial/non-commercial classification of each trader are unknown.
• "Concentration Gross/Net LT 4/8 TDR" is the percentage of open interest held by 4/8 of the largest traders, by gross/net positions,
without regard to whether they are classified as commercial or non-commercial. The Net position ratios are computed after offsetting each trader’s equal long and short positions.
A reportable trader with relatively large, balanced long and short positions in a single market, therefore,
may be among the four and eight largest traders in both the gross long and gross short categories, but will probably not be included among the four and eight largest traders on a net basis.
Direction
Each metric is available for a particular set of directions. Valid directions for each metric are specified with its name in the "Metric" field's dropdown menu.
Type
Possible values are: All, Old, Other. When commodities have a well-defined marketing season or crop year (e.g. Wheat or Lean Hogs futures), this determines how the data is aggregated. Detailed explanation can be found in the "Old and Other Futures" section of the CTFC Explanatory Notes linked above. The "Major Markets for Which the COT Data Is Shown by Crop Year" table in the Explanatory Notes specifies the commodities that this distinction applies to; selecting "Old" for any of the commodities not in that list will return the same data as in "All", while selecting "Other" will return 0.
COT Selection Mode
This field's value determines how the script determines which COT data to return from the chart's symbol:
- "Root" uses the root of a futures symbol ("ES" for "ESH2020").
- "Base currency" uses the base currency in a forex pair ("EUR" for "EURUSD").
- "Currency" uses the quote currency, i.e., the currency the symbol is traded in ("JPY" for "TSE:9984" or "USDJPY").
- "Auto" tries all modes, in turn.
If no COT data can be found, a runtime error is generated.
Note that if the "CTFC Code" input field contains a code, it will override this input.
Futures/Options
Specifies the type of Commitment of Traders data to display: data concerning only Futures, only Options, or both.
CTFC Code
Instead of letting the script generate the CFTC COT code from the chart and the "COT Selection Mode" input when this field is empty, you can specify an unrelated CFTC COT code here, e.g., 001602 for wheat futures.
Look first. Then leap.
