Custom Weekly Volume Profile [Multi-Timeframe]Description: This indicator renders a high-precision Weekly Volume Profile that resets at the start of every trading week. Unlike standard fixed-range profiles, this script builds the profile bar-by-bar using lower timeframe data (e.g., 1-minute or 5-minute data) to ensure accuracy even on higher timeframe charts.
It is designed for traders who track the developing value of the current week (Auction Market Theory) and need specific alerts when price tests the edges of value.
Key Features:
Developing Weekly Profile:
The profile resets automatically at the beginning of the week (Sunday/Monday).
It tracks the Point of Control (POC), Value Area High (VAH), and Value Area Low (VAL) in real-time as the week progresses.
Previous Week Levels:
The script automatically stores the final levels (POC, VAH, VAL) of the previous week and projects them forward. This allows you to trade tests of the prior week's value.
Auto-Scaling Histogram:
Smart Width: The profile starts wider at the beginning of the week (when data is sparse) and automatically shrinks as the week progresses (Thursday/Friday) to keep your chart clean and readable.
Advanced Alerting:
Crossover Alerts: Trigger alerts when price crosses the developing VAH/VAL or the previous week's levels.
Time Window Filter: Includes a session input (default 08:30-15:00) to restrict alerts to specific trading hours, preventing notifications during low-volume overnight sessions.
Customization:
Precision: Adjustable "Row Size" and "Calculation Timeframe" to tune performance vs. accuracy.
Visuals: Full color control over the Value Area, Outer Volume, and Level Lines.
Settings:
Calculation Precision: Determines the lower timeframe used to calculate the volume (e.g., set to "5" for 5-minute precision).
Value Area %: Default is 70%, standard for AMT trading.
Timezone: Adjustable to ensure the weekly reset aligns with your local exchange time (e.g., America/Chicago for CME Futures).
Disclaimer: This script is for educational and informational purposes only. It does not constitute financial advice, trading recommendations, or a solicitation to buy or sell any financial instrument. Trading futures and other financial markets involves significant risk and is not suitable for every investor. Past performance of any trading system or methodology is not necessarily indicative of future results. The user assumes all responsibility for any trading decisions made based on the information provided by this tool. Use at your own risk.
스크립트에서 "CME"에 대해 찾기

QuantCrawler 5m ORB Pro - Opening Range with Confluence FiltersThis indicator captures the 5-minute Opening Range and generates entry signals using a breakout-then-retest methodology. It includes optional confluence filters to refine entries and reduce false signals.
HOW IT WORKS
1. Captures the 5-minute Opening Range (high, low, midpoint) at your selected session open
2. Waits for price to break beyond OR high or low by your defined distance
3. After breakout, monitors for price to retest the OR midpoint
4. Signals LONG after bullish breakout + midpoint retest
5. Signals SHORT after bearish breakout + midpoint retest
6. Marks invalidated signals with (X) if price breaks through the opposite side
PRE-CONFIGURED SESSIONS
- NYSE - 9:30-9:35 ET
- CME - 8:30-8:35 CT
- London - 3:00-3:05 ET
- Asia - 7:00-7:05 PM ET
- Custom - Define your own session times and timezone
BREAKOUT DISTANCE OPTIONS
Choose between fixed points or percentage-based breakout threshold. Percentage mode automatically scales to the instrument price.
CONFLUENCE FILTERS
Optional filters to add confirmation before signals fire:
- VWAP - Long requires price above VWAP, short requires below
- EMA Slope - Confirms trend direction using 20-period EMA
- Volume - Requires relative volume above 1.5x average
- FVG - Requires a Fair Value Gap supporting trade direction
- ATR - Filters Opening Ranges that are abnormally small or large relative to ATR
When filters block a valid setup, the indicator displays a BLOCKED label so you can see what you missed and why.
STATUS BOX
Real-time display showing:
- Current trade state (Building OR, Watching, Awaiting Retest, Long/Short Active)
- OR High, Low, and Midpoint levels
- Active filters and block reasons
ALERTS
Built-in alerts for Long Entry, Short Entry, or Any Entry.

Session ATR Progression Tracker📊 Session ATR Progression Tracker - SIYL Regression Trading Tool
Track how much of your instrument's 7-day Average True Range (ATR) has been covered during the current trading session. This indicator is specifically designed for regression traders who follow the "Stay In Your Lane" (SIYL) methodology, helping you identify when the probability of mean reversion significantly increases. If you are interested in more on that check out Rod Casselli and tradersdevgroup.com.
🎯 Key Features:
• Real-time ATR Coverage Percentage - See at a glance what percentage of the 7-day ATR has been covered in the current session
• SIYL-Optimized Thresholds - See at a glance when the instrument has achieved 80% and 100% ATR coverage, the proven thresholds where mean reversion probability increases (customizable)
• Flexible Session Modes:
- Daily: Resets at calendar day change
- Session: Uses exchange-defined trading sessions
- Custom Session: Set your exact session start/end times (perfect for futures traders and international markets)
• Visual Alerts - Color-coded display (gray → orange → red) and optional background highlighting
• Repositionable Display - Choose from 9 screen positions to avoid chart clutter
• Session Markers - Green triangles mark the start of each new session
• Detailed Stats - View current range, ATR value, session high/low, and session status
💡 Why Use This Indicator?
This tool is built around a proven concept: regression trading becomes significantly more effective once a session has achieved at least 80% of its 7-day ATR. At this threshold, the probability of price reverting to mean increases substantially, creating higher-probability trade setups for SIYL practitioners.
Benefits for regression traders:
- Identify optimal entry points when mean reversion probability is highest (≥80% ATR coverage)
- Avoid premature regression entries before adequate range has been established
- Recognize when daily moves have "earned their range" and are ripe for reversal
- Time fade-the-move and counter-trend strategies with statistical backing
- Improve win rates by trading only after proven probability thresholds are met
⚙️ Setup Instructions:
1. Add the indicator to your chart
2. Select your preferred "Reset Mode" (recommend "Custom Session" for futures/international markets)
3. If using Custom Session, enter your session times in 24-hour format (e.g., 0930-1600 for US stocks, 1700-1600 for CME futures)
4. Adjust alert thresholds if desired (default: 80% and 100% - proven SIYL thresholds)
5. Position the display where it's most visible on your chart
📈 Works Across All Markets:
Stocks • Futures • Forex • Indices • Crypto • Commodities
Perfect for regression traders, mean reversion specialists, and SIYL practitioners who want to trade with probability on their side by entering only after the session has "earned its range."
---
Tip: For futures contracts with overnight sessions that span calendar days (like MES, MNQ, MYM), use "Custom Session" mode with your exchange's official session times for accurate tracking.

Candle Microstructure ClassifierCandle Microstructure Classifier
Public Description
The Candle Microstructure Classifier is a visual study designed to highlight meaningful single-candle behaviors based purely on price geometry. It classifies candles according to body size and wick structure, helping traders visually identify moments of aggression, commitment, failed pushes, and rejection directly on the price chart.
This script is a study only. It does not generate trade signals, entries, exits, or forecasts. Its purpose is to provide structural context that can be combined with other tools such as trend, volume, or volatility analysis.
Quantitative Description
Each candle is decomposed into its geometric components relative to its total range (high − low). All classifications are based on normalized fractions to remain scale‑independent across instruments and timeframes.
Definitions:
1. Candle Range (R):
R = High − Low
2. Body Size (B):
B = |Close − Open|
Body Fraction = B / R
3. Upper Wick (UW):
UW = High − max(Open, Close)
Upper Wick Fraction = UW / R
4. Lower Wick (LW):
LW = min(Open, Close) − Low
Lower Wick Fraction = LW / R
Candle Classifications:
• Commitment Candle:
Body Fraction ≥ Large Body Threshold
Upper Wick Fraction ≤ Tiny Wick Threshold
Lower Wick Fraction ≤ Tiny Wick Threshold
Interpretation: Strong directional acceptance with minimal intrabar rejection.
• Marubozu (Aggression):
Body Fraction ≥ Large Body Threshold
One wick effectively absent (near zero)
Interpretation: Pure directional aggression with no meaningful counter‑pressure.
• Trend Attempt Failure:
Body Fraction ≥ Large Body Threshold
One wick large, opposite wick small
Interpretation: Strong push followed by immediate rejection on one side.
• Rejection Candle:
Body Fraction ≤ Small Body Threshold
Upper Wick Fraction ≥ Large Wick Threshold
Lower Wick Fraction ≥ Large Wick Threshold
Interpretation: Two‑sided rejection indicating price discovery or balance.
• Pin Rejection (optional):
Body Fraction ≤ Small Body Threshold
Only one wick large
Interpretation: One‑sided rejection often occurring near support or resistance.
Notes and Context
This classifier intentionally avoids pattern names tied to prediction. Each classification describes observed auction behavior inside a single bar, not an expectation of future movement.
Sources and Further Reading
Candle structure and wick interpretation:
• Investopedia – Candlestick Patterns and Anatomy
www.investopedia.com
Volume and volatility context examples:
• Wyckoff Method – Effort vs Result (Volume + Price Structure)
school.stockcharts.com
• CME Group – Using Volume and Volatility Together
www.cmegroup.com
Example Applications:
1. A commitment candle occurring simultaneously with a volume spike may indicate institutional participation and acceptance at that price level.
2. A rejection candle forming during elevated volatility (ATR expansion) may signal failed price discovery and potential mean reversion zones.

Trading Dashboard + Daily SMAsThis indicator is an all-in-one workspace overlay designed for futures and intraday traders. It consolidates critical market internals, session statistics, and daily technical levels into a single, highly customizable dashboard.
The goal of this script is to reduce chart clutter by placing essential data into a clean table while overlaying key Daily Moving Averages onto your intraday timeframe.
Key Features:
1. Comprehensive Market Internals Dashboard Monitor the health of the broad market directly from your chart. The dashboard includes real-time data for:
VIX: Volatility Index.
TICK & TRIN: Sentiment and volume flow indicators.
Breadth Data: ADD, ADV, and DECL (Advance/Decline lines and volume).
Multi-Ticker Watch: Monitor 3 additional assets (Defaults: NQ, RTY, YM) with real-time price and % change.
2. Session Statistics & Probabilities Automated calculation of intraday statistics based on a user-defined lookback period (default 100 days):
RTH Data: Tracks Regular Trading Hours Open, Close, and Range.
Contextual ATR: Compares current RTH range to the 14-day ATR.
Probabilities: Displays historical probabilities for "Gap Fill," "Break of Yesterday's High," and "Break of Yesterday's Low."
3. Daily SMAs on Intraday Charts Plot key Daily Simple Moving Averages (21, 50, 200) directly on your lower timeframe charts (1m, 5m, etc.) without switching views.
Fully Customizable: Toggle each SMA on/off individually.
Color Control: Users can change the color of every SMA line to fit their theme.
4. "Dark Mode" Optimized The dashboard features a specific "Very Dark Grey" (#121212) background by default, designed to reduce eye strain and blend seamlessly with dark-themed trading setups.
Settings & Customization:
Session Times: Define your specific RTH start and end times.
Symbols: All ticker symbols (VIX, ADD, NQ, etc.) can be customized in the settings menu to match your data provider.
Visibility: Every element in the table and every SMA line has a toggle switch. You only see what you need.
Visuals: Change table position, text size, and line colors.
Author's Instructions: Configuration Guide
This script relies on specific ticker symbols to pull data for Market Internals (TICK, TRIN, ADD) and the Watchlist. Depending on your data subscription plan (CME, CBOE, etc.), you may need to adjust the default symbols to match what you have access to.
1. How to Change Symbols
Add the indicator to your chart.
Hover over the indicator name in the top-left corner and click the Settings (Gear Icon).
Scroll to the "Symbols" section.
Click inside the text box for the symbol you want to change.
2. Common Symbol Formats If the default symbols show "N/A" or "Error," try these alternatives based on your data feed:
TICK (NYSE Tick)
Default: USI:TICK (Requires specific data)
Alternative: TVC:TICK (General TradingView feed)
Alternative: TICK (Generic)
TRIN (Arms Index)
Default: USI:TRIN
Alternative: TVC:TRIN
Alternative: TRIN
Breadth (ADD/ADV/DECL)
ADD (Advance-Decline Line): Try USI:ADD, TVC:ADD, or ADD
ADV (Advancing Volume): Try USI:ADV, TVC:ADV, or UVOL (Up Volume)
DECL (Declining Volume): Try USI:DECL, TVC:DECL, or DVOL (Down Volume)
VIX
Standard: CBOE:VIX or TVC:VIX
3. Setting Up the Ticker Watchlist (Ticker 1, 2, 3) The script defaults to "Continuous Contracts" (indicated by the 1!), which automatically rolls to the front month.
Nasdaq: CME_MINI:NQ1!
S&P 500: CME_MINI:ES1!
Russell 2000: CME_MINI:RTY1!
Dow Jones: CBOT_MINI:YM1!
Note: If you want to watch a specific contract month (e.g., December 2025), enter the specific code like NQZ2025.
4. Troubleshooting "N/A" Data If a cell in the table is empty or says "N/A":
Verify you are not viewing the chart on a timeframe that excludes the data (though dynamic_requests=true usually handles this).
Ensure you have the correct data permission for that specific symbol.
Market Closed: Some internal data points only populate during the active NYSE session (09:30 - 16:00 ET).
Disclaimer: This tool is for informational purposes only and does not constitute financial advice. Past probabilities do not guarantee future results.

NYSE CME Market Session Clock This indicator can only work on short-term timeframes, since the time before the opening and before the closing of the session is updated only with the appearance of a new candle.

Morning ORB FVG Trigger✅ Overview
Morning ORB FVG Trigger is a complete intraday trading framework built around:
A Morning Opening Range Breakout (ORB)
The first Fair Value Gap (FVG) after that breakout
Strict risk management and position sizing
Optional HTF trend filter (Daily / Weekly / Monthly)
Optional Daily ATR filter to avoid extreme days
The script is designed for futures / indices / FX on intraday charts up to 15 minutes and for traders who want a clean, mechanical entry framework with clear risk.
🧠 Core idea
Define a morning opening range (e.g. 09:30–09:45).
Wait for a clean breakout above/below that range.
After the breakout, wait for the first FVG in breakout direction,
confirmed by the next candle (no immediate full reclaim).
Use a chosen stop logic + R:R factor to build risk/reward boxes.
Calculate position size based on your account risk.
(Optional) Only take trades:
In the direction of the HTF EMA trend (D/W/M).
On days where the morning range is within a band of the Daily ATR.
You can also disable all signals/boxes and use the script just as a visual ORB tool.
⏰ 1. ORB / Morning Range
Inputs (Main section)
Morning Range Session
Time window of the opening range in exchange time
Example: 09:30–09:45 for a 15-minute ORB.
You can type custom ranges (e.g. 09:30–09:35 for a 5-minute ORB).
Risk/Reward (TP factor)
Multiplier for the take-profit distance relative to the stop.
2.0 = TP is 2× the stop distance
1.5 = TP is 1.5× the stop distance
Show ORB range
If enabled, draws:
ORB high/low lines
ORB labels (e.g. 15min ORB high / low)
Optional midline
Extend ORB lines to the right (bars)
How many bars to extend the ORB high/low horizontally beyond the ORB itself.
Trade box width (bars)
Horizontal width (in bars) of:
Red risk box (entry–stop)
Green reward box (entry–TP)
Implementation details
The ORB is always calculated on 1-minute data internally, so it stays precise even on 5m/15m charts.
The script only works on intraday timeframes up to 15 minutes.
📦 2. FVG Block
Group: “FVG”
Threshold %
Minimum size of an FVG in % of price.
0 = every FVG
Higher values = only larger gaps
Auto threshold (from volatility)
If enabled, the minimum FVG size is derived from historical volatility
instead of a fixed percentage.
Allow breakout FVG partly inside ORB
Off (default): the FVG must lie fully outside the ORB.
On: the breakout FVG itself may still overlap the ORB a bit,
as long as it is the first one attached to the breakout move.
Enable FVG entry signals, boxes & alerts
On: full system – FVG detection, entry labels, risk/TP boxes, alerts.
Off: no entries, no risk/TP boxes, no alerts.
You only get the ORB and (optionally) the HTF dashboard, so you can trade your own setups.
Entry mode
Entry mode (Mid / Edge / NextOpen)
Mid – Entry at the midpoint of the FVG.
Edge – Long at the upper FVG edge, short at the lower FVG edge.
NextOpen – No limit order in the gap. Entry is placed at the next bar open after FVG confirmation.
Edge offset (ticks)
Additional offset for Edge entries:
Long:
+ticks = a bit above the FVG (more conservative)
-ticks = deeper into the FVG (more aggressive)
Short:
+ticks = a bit below the FVG
-ticks = deeper into the FVG
FVG detection logic
Uses a LuxAlgo-style 3-candle FVG pattern (gap between candle 1 and 3).
Only one FVG is taken: the first valid FVG after the ORB breakout in breakup direction.
The FVG candle is the middle bar; the script:
Detects the FVG on the previous bar.
Waits for the current bar to confirm it:
Bullish: current low must stay above the lower FVG boundary
Bearish: current high must stay below the upper FVG boundary
Only then an entry signal is generated.
🛑 3. Stop Logic
Group: “Stop Logic”
Stop mode (PrevBar / Pivot / FVG Candle)
PrevBar – Stop at the low/high of the candle before the FVG
(tight/aggressive).
FVG Candle – Stop at the low/high of the FVG candle itself
(medium).
Pivot – Stop at the most recent swing high/low
using pivotLeft / pivotRight pivots (more conservative).
Ticks (stop buffer)
Offset (in ticks) from the selected stop level.
> 0 = further away (more room, more risk)
< 0 = closer (tighter stop)
Pivot left / Pivot right
Number of candles left/right to define a swing high/low
when using Pivot stop mode.
Typical intraday values: 2–3.
The script also sanity-checks the stop:
if the calculated stop would be invalid (e.g. above entry in a long), it moves it by a minimal distance (2 ticks) to keep a valid risk.
📈 4. HTF Trend Filter (Daily / Weekly / Monthly)
Group: “HTF Trend Filter”
Enable HTF trend filter
If enabled, trades are only allowed:
Long when at least 2 of D/W/M closes are above their EMA
Short when at least 2 of D/W/M closes are below their EMA
EMA length (D/W/M)
EMA length for all three higher timeframes (Daily, Weekly, Monthly).
This helps focus entries in the direction of the dominant higher-timeframe trend.
📊 5. ATR Filter (Daily)
Group: “ATR Filter (Daily)”
Use daily ATR filter
If enabled, the height of the ORB (ORB high – ORB low) must be within
a band of the Daily ATR to allow any signals.
Daily ATR length
ATR period on the Daily timeframe.
Min ORB size vs ATR
Lower bound:
Example: 0.3 → ORB must be at least 0.3 × Daily ATR
0.0 = no minimum.
Max ORB size vs ATR
Upper bound:
Example: 1.5 → ORB must be ≤ 1.5 × Daily ATR
0.0 = no maximum.
If the ORB is too small (choppy) or too large (exhausted move), no breakout or FVG signal will be generated on that day.
🧭 6. HTF Dashboard & Signal Labels
Group: “HTF Trend Dashboard”
Show HTF dashboard
Draws a small label at the top of the chart showing:
HTF Trend (EMA X)
D: UP/FLAT/DOWN
W: UP/FLAT/DOWN
M: UP/FLAT/DOWN
Dashboard position
Top Right, Top Center, Top Left – places the dashboard at the top.
Over Risk Info – no top dashboard; instead, the HTF trend info is shown as a label near the risk box when a new signal appears.
Lookback (bars) for top anchor
How many bars to use to determine the top price level for dashboard placement.
Show HTF trend above risk box on signal
Only relevant if Dashboard position = Over Risk Info.
When enabled, a small HTF label appears near the risk box for each new trade.
Signal label vertical offset (ticks)
Vertical spacing between risk info label and HTF label.
Minimum spacing HTF/Risk (ticks)
Ensures a minimum vertical distance so the two labels don’t overlap.
HTF signal label X offset (bars)
Horizontal offset (left/right) relative to the risk info label.
⏳ 7. ORB–FVG Filters (Session & Time Window)
Group: “ORB FVG Filter”
Only same session day
If enabled, FVG entries are only allowed on the same calendar day
as the ORB. When the date changes, all state & drawings are reset.
Limit hours after ORB
Enables a time window after the ORB end.
Trading window after ORB (hours)
Length of that window in hours.
Example: 2.0 → FVG signals only in the first 2 hours after ORB end.
💰 8. Risk Management & Position Sizing
Group: “Risk Management”
Calculate position size
If enabled, the script computes suggested mini and micro contract size for you.
Account size
Your trading account size (in account currency).
Risk mode
Percent – risk is a % of account size (Account risk %).
Fixed amount – risk is a fixed dollar amount (Fixed risk ($)).
Account risk %
Risk per trade as a percentage of account size (e.g. 1.0 for 1%).
Fixed risk ($)
Fixed risk per trade in dollars when using Fixed amount mode.
Micro factor (vs mini)
How much a micro contract is worth relative to a mini.
Example:
0.1 → one micro moves 1/10 of one mini.
Risk Info label
For each new trade, a label is shown above the boxes with:
Stop distance in price and $ risk per mini
Max risk allowed for the trade
Suggested mini and micro size
Text like:
Suggested: 2 mini
Suggested: 5 micro
or Suggested: no trade
This makes the script especially useful for prop-firm rules or strict risk discipline.
🎨 9. Visual Style (Boxes, Labels, ORB Lines)
Group: “Box & Label Style (Trade)”
Label font size (Very small, Small, Normal, Large)
Entry label BG / text color
Stop label BG / text color
TP label BG / text color
Risk info BG / text color
Risk box color (entry–stop zone)
Reward box color (entry–TP zone)
Group: “ORB Style”
ORB high line color
ORB low line color
ORB line width
ORB label font size
ORB label background color
ORB label text color
Show ORB midline
ORB midline color / width / style (Solid / Dashed / Dotted)
⚠️ 10. Alerts
Group: “Alerts”
The script defines three alert conditions:
Long entry FVG breakout
Triggered when a new long signal appears.
Short entry FVG breakout
Triggered when a new short signal appears.
FVG entry (long/short)
Generic alert for any new signal (long or short).
To use them:
Add the indicator to the chart.
Open the Alerts dialog → “Condition”.
Select this script and one of the alert conditions.
Set your preferred expiration and notification settings.
Alerts only fire when Enable FVG entry signals, boxes & alerts is on.
🧩 11. How the trading logic flows (summary)
Build ORB on 1-minute data during the selected session.
Optionally reject the day if ORB is outside the ATR bounds.
Wait for a breakout (close above high or below low), respecting HTF trend filter.
After breakout, look for the first valid FVG in that direction:
Outside the ORB (unless breakout FVG allowed inside)
Confirmed by the next candle (no full reclaim)
Once confirmed:
Compute entry, stop, target.
Draw risk/reward boxes and all labels.
Optionally show HTF signal label over the risk info.
Trigger alerts if enabled.
If you disable FVG signals, only steps 1–3 (plus dashboard) are effectively active.
⚠️ 12. Notes & Disclaimer
Script is intended for intraday trading up to 15-minute timeframes.
All signals are mechanical and do not guarantee profitability.
Always backtest and forward-test on your own data before risking real money.
This script is for educational purposes only and is not financial advice.
🚀 Quick-start guide
Add the script to your chart
Use an intraday timeframe ≤ 15 minutes (1m, 3m, 5m, 15m).
Works best on liquid indices, futures, FX and large-cap stocks.
Set the Morning Range
In “Morning Range Session” choose the exchange’s opening window.
Examples
US index futures (CME): 08:30–08:45 or 08:30–08:35
US stocks (NYSE/Nasdaq): 09:30–09:45 or 09:30–09:35
The ORB is always calculated on 1-minute data internally, so the range stays accurate on higher intraday charts.
Keep the default filters at first
HTF Trend Filter: ON
EMA length = 20
This will only allow trades in the direction of the dominant D/W/M trend.
ATR Filter: OFF (optional; you can enable later once you’re comfortable).
Use the full trade system
In the FVG group leave
“Enable FVG entry signals, boxes & alerts” = ON
Entry mode: Mid
Stop mode: FVG Candle or PrevBar
Risk/Reward: 2.0 as a starting point.
Set your risk
Turn on “Calculate position size”.
Enter your Account size and choose either:
Risk mode = Percent (e.g. 1.0 = 1% per trade), or
Risk mode = Fixed amount (e.g. $250 per trade).
The risk info label will show:
Stop distance in price and $/contract
Max allowed risk
Suggested mini and micro contract size.
Enable alerts (optional)
Open the Alerts dialog → Condition: this script.
Choose one of:
Long entry FVG breakout
Short entry FVG breakout
FVG entry (long/short)
Choose “Once per bar” or “Once per bar close”, and your preferred notification type.
Replay & journal
Use the TradingView bar replay tool to step through past days.
Focus on:
How the ORB defines the structure.
How the first confirmed FVG outside the ORB behaves.
Whether the risk/TP levels fit your own style and product.
🎛 Recommended settings & profiles
These are starting points, not rules. Always adapt to the instrument and your own risk tolerance.
1. Conservative / Trend-following
Timeframe: 5m or 15m
Morning Range Session: 15-minute ORB around the cash or futures open
FVG
Threshold %: 0.05–0.1 (filter out very small gaps)
Auto threshold: OFF (keep it simple)
Allow breakout FVG partly inside ORB: OFF
Enable FVG entry signals/boxes/alerts: ON
Entry mode: Mid
Stop Logic
Stop mode: Pivot
Pivot left/right: 2–3
Stop buffer: +1–2 ticks
HTF Trend Filter
Enabled: ON
EMA length: 20
ATR Filter
Enabled: ON
Daily ATR length: 14
Min ORB vs ATR: 0.3–0.4
Max ORB vs ATR: 1.2–1.5
Risk Management
Risk mode: Percent
Account risk: 0.5–1.0%
Idea: Only trade when the higher-timeframe trend supports the move and the opening range is of a “normal” size for the current volatility.
2. Balanced / Intraday directional
Timeframe: 3m or 5m
FVG
Threshold %: 0.02–0.05
Auto threshold: ON (lets the script adapt to volatility)
Allow breakout FVG partly inside ORB: ON
(first breakout FVG may partly sit inside the ORB)
Entry mode: Edge
Edge offset (ticks): 0 or +1
Stop Logic
Stop mode: FVG Candle
Stop buffer: 0–1 ticks
HTF Trend Filter
Enabled: ON
ATR Filter
Enabled: OFF (optional)
Risk Management
Risk mode: Percent
Account risk: 1.0–1.5% (if this fits your plan)
Idea: Slightly more aggressive entries at the gap edge, still aligned with HTF trend, but with more flexibility on ATR.
3. Aggressive / Scalping around the ORB
Timeframe: 1m or 3m
FVG
Threshold %: 0.0–0.02
Auto threshold: ON
Allow breakout FVG partly inside ORB: ON
Entry mode: NextOpen or Edge with a negative offset (deeper into the gap)
Stop Logic
Stop mode: PrevBar
Stop buffer: 0 or -1 tick
HTF Trend Filter
Enabled: OFF (or ON but treat as soft guidance)
ATR Filter
Enabled: OFF
Risk Management
Risk mode: Percent
Account risk: lower, e.g. 0.25–0.5% per trade
Idea: More trades and tighter stops. Best for experienced traders who understand the limitations of scalping and whipsaw risk.
Final reminder
All of these are templates, not guarantees:
Always check how the system behaves on your market and session.
Start on replay and demo before trading real money.
Adjust filters (HTF, ATR, thresholds) until the signals fit your personal approach.

SP500 Session Gap Fade StrategySummary in one paragraph
SPX Session Gap Fade is an intraday gap fade strategy for index futures, designed around regular cash sessions on five minute charts. It helps you participate only when there is a full overnight or pre session gap and a valid intraday session window, instead of trading every open. The original part is the gap distance engine which anchors both stop and optional target to the previous session reference close at a configurable flat time, so every trade’s risk scales with the actual gap size rather than a fixed tick stop.
Scope and intent
• Markets. Primarily index futures such as ES, NQ, YM, and liquid index CFDs that exhibit overnight gaps and regular cash hours.
• Timeframes. Intraday timeframes from one minute to fifteen minutes. Default usage is five minute bars.
• Default demo used in the publication. Symbol CME:ES1! on a five minute chart.
• Purpose. Provide a simple, transparent way to trade opening gaps with a session anchored risk model and forced flat exit so you are not holding into the last part of the session.
• Limits. This is a strategy. Orders are simulated on standard candles only.
Originality and usefulness
• Unique concept or fusion. The core novelty is the combination of a strict “full gap” entry condition with a session anchored reference close and a gap distance based TP and SL engine. The stop and optional target are symmetric multiples of the actual gap distance from the previous session’s flat close, rather than fixed ticks.
• Failure mode it addresses. Fixed sized stops do not scale when gaps are unusually small or unusually large, which can either under risk or over risk the account. The session flat logic also reduces the chance of holding residual positions into late session liquidity and news.
• Testability. All key pieces are explicit in the Inputs: session window, minutes before session end, whether to use gap exits, whether TP or SL are active, and whether to allow candle based closes and forced flat. You can toggle each component and see how it changes entries and exits.
• Portable yardstick. The main unit is the absolute price gap between the entry bar open and the previous session reference close. tp_mult and sl_mult are multiples of that gap, which makes the risk model portable across contracts and volatility regimes.
Method overview in plain language
The strategy first defines a trading session using exchange time, for example 08:30 to 15:30 for ES day hours. It also defines a “flat” time a fixed number of minutes before session end. At the flat bar, any open position is closed and the bar’s close price is stored as the reference close for the next session. Inside the session, the strategy looks for a full gap bar relative to the prior bar: a gap down where today’s high is below yesterday’s low, or a gap up where today’s low is above yesterday’s high. A full gap down generates a long entry; a full gap up generates a short entry. If the gap risk engine is enabled and a valid reference close exists, the strategy measures the distance between the entry bar open and that reference close. It then sets a stop and optional target as configurable multiples of that gap distance and manages them with strategy.exit. Additional exits can be triggered by a candle color flip or by the forced flat time.
Base measures
• Range basis. The main unit is the absolute difference between the current entry bar open and the stored reference close from the previous session flat bar. That value is used as a “gap unit” and scaled by tp_mult and sl_mult to build the target and stop.
Components
• Component one: Gap Direction. Detects full gap up or full gap down by comparing the current high and low to the previous bar’s high and low. Gap down signals a long fade, gap up signals a short fade. There is no smoothing; it is a strict structural condition.
• Component two: Session Window. Only allows entries when the current time is within the configured session window. It also defines a flat time before the session end where positions are forced flat and the reference close is updated.
• Component three: Gap Distance Risk Engine. Computes the absolute distance between the entry open and the stored reference close. The stop and optional target are placed as entry ± gap_distance × multiplier so that risk scales with gap size.
• Optional component: Candle Exit. If enabled, a bullish bar closes short positions and a bearish bar closes long positions, which can shorten holding time when price reverses quickly inside the session.
• Session windows. Session logic uses the exchange time of the chart symbol. When changing symbols or venues, verify that the session time string still matches the new instrument’s cash hours.
Fusion rule
All gates are hard conditions rather than weighted scores. A trade can only open if the session window is active and the full gap condition is true. The gap distance engine only activates if a valid reference close exists and use_gap_risk is on. TP and SL are controlled by separate booleans so you can use SL only, TP only, or both. Long and short are symmetric by construction: long trades fade full gap downs, short trades fade full gap ups with mirrored TP and SL logic.
Signal rule
• Long entry. Inside the active session, when the current bar shows a full gap down relative to the previous bar (current high below prior low), the strategy opens a long position. If the gap risk engine is active, it places a gap based stop below the entry and an optional target above it.
• Short entry. Inside the active session, when the current bar shows a full gap up relative to the previous bar (current low above prior high), the strategy opens a short position. If the gap risk engine is active, it places a gap based stop above the entry and an optional target below it.
• Forced flat. At the configured flat time before session end, any open position is closed and the close price of that bar becomes the new reference close for the following session.
• Candle based exit. If enabled, a bearish bar closes longs, and a bullish bar closes shorts, regardless of where TP or SL sit, as long as a position is open.
What you will see on the chart
• Markers on entry bars. Standard strategy entry markers labeled “long” and “short” on the gap bars where trades open.
• Exit markers. Standard exit markers on bars where either the gap stop or target are hit, or where a candle exit or forced flat close occurs. Exit IDs “long_gap” and “short_gap” label gap based exits.
• Reference levels. Horizontal lines for the current long TP, long SL, short TP, and short SL while a position is open and the gap engine is enabled. They update when a new trade opens and disappear when flat.
• Session background. This version does not add background shading for the session; session logic runs internally based on time.
• No on chart table. All decisions are visible through orders and exit levels. Use the Strategy Tester for performance metrics.
Inputs with guidance
Session Settings
• Trading session (sess). Session window in exchange time. Typical value uses the regular cash session for each contract, for example “0830-1530” for ES. Adjust if your broker or symbol uses different hours.
• Minutes before session end to force exit (flat_before_min). Minutes before the session end where positions are forced flat and the reference close is stored. Typical range is 15 to 120. Raising it closes trades earlier in the day; lowering it allows trades later in the session.
Gap Risk
• Enable gap based TP/SL (use_gap_risk). Master switch for the gap distance exit engine. Turning it off keeps entries and forced flat logic but removes automatic TP and SL placement.
• Use TP limit from gap (use_gap_tp). Enables gap based profit targets. Typical values are true for structured exits or false if you want to manage exits manually and only keep a stop.
• Use SL stop from gap (use_gap_sl). Enables gap based stop losses. This should normally remain true so that each trade has a defined initial risk in ticks.
• TP multiplier of gap distance (tp_mult). Multiplier applied to the gap distance for the target. Typical range is 0.5 to 2.0. Raising it places the target further away and reduces hit frequency.
• SL multiplier of gap distance (sl_mult). Multiplier applied to the gap distance for the stop. Typical range is 0.5 to 2.0. Raising it widens the stop and increases risk per trade; lowering it tightens the stop and may increase the number of small losses.
Exit Controls
• Exit with candle logic (use_candle_exit). If true, closes shorts on bullish candles and longs on bearish candles. Useful when you want to react to intraday reversal bars even if TP or SL have not been reached.
• Force flat before session end (use_forced_flat). If true, guarantees you are flat by the configured flat time and updates the reference close. Turn this off only if you understand the impact on overnight risk.
Filters
There is no separate trend or volatility filter in this version. All trades depend on the presence of a full gap bar inside the session. If you need extra filtering such as ATR, volume, or higher timeframe bias, they should be added explicitly and documented in your own fork.
Usage recipes
Intraday conservative gap fade
• Timeframe. Five minute chart on ES regular session.
• Gap risk. use_gap_risk = true, use_gap_tp = true, use_gap_sl = true.
• Multipliers. tp_mult around 0.7 to 1.0 and sl_mult around 1.0.
• Exits. use_candle_exit = false, use_forced_flat = true. Focus on the structured TP and SL around the gap.
Intraday aggressive gap fade
• Timeframe. Five minute chart.
• Gap risk. use_gap_risk = true, use_gap_tp = false, use_gap_sl = true.
• Multipliers. sl_mult around 0.7 to 1.0.
• Exits. use_candle_exit = true, use_forced_flat = true. Entries fade full gaps, stops are tight, and candle color flips flatten trades early.
Higher timeframe gap tests
• Timeframe. Fifteen minute or sixty minute charts on instruments with regular gaps.
• Gap risk. Keep use_gap_risk = true. Consider slightly higher sl_mult if gaps are structurally wider on the higher timeframe.
• Note. Expect fewer trades and be careful with sample size; multi year data is recommended.
Properties visible in this publication
• On average our risk for each position over the last 200 trades is 0.4% with a max intraday loss of 1.5% of the total equity in this case of 100k $ with 1 contract ES. For other assets, recalculations and customizations has to be applied.
• Initial capital. 100 000.
• Base currency. USD.
• Default order size method. Fixed with size 1 contract.
• Pyramiding. 0.
• Commission. Flat 2 USD per order in the Strategy Tester Properties. (2$ buying + 2$selling)
• Slippage. One tick in the Strategy Tester Properties.
• Process orders on close. ON.
Realism and responsible publication
• No performance claims are made. Past results do not guarantee future outcomes.
• Costs use a realistic flat commission and one tick of slippage per trade for ES class futures.
• Default sizing with one contract on a 100 000 reference account targets modest per trade risk. In practice, extreme slippage or gap through events can exceed this, so treat the one and a half percent risk target as a design goal, not a guarantee.
• All orders are simulated on standard candles. Shapes can move while a bar is forming and settle on bar close.
Honest limitations and failure modes
• Economic releases, thin liquidity, and limit conditions can break the assumptions behind the simple gap model and lead to slippage or skipped fills.
• Symbols with very frequent or very large gaps may require adjusted multipliers or alternative risk handling, especially in high volatility regimes.
• Very quiet periods without clean gaps will produce few or no trades. This is expected behavior, not a bug.
• Session windows follow the exchange time of the chart. Always confirm that the configured session matches the symbol.
• When both the stop and target lie inside the same bar’s range, the TradingView engine decides which is hit first based on its internal intrabar assumptions. Without bar magnifier, tie handling is approximate.
Legal
Education and research only. This strategy is not investment advice. You remain responsible for all trading decisions. Always test on historical data and in simulation with realistic costs before considering any live use.

ATR Risk Display - Multi FuturesWhat This Does
I got tired of manually calculating my ATR stops and risk for different futures contracts, especially when switching between ES, NQ, and their micro versions. This indicator automatically detects what futures symbol you're trading and shows you the exact tick count and dollar risk for your stop loss.
The Problem It Solves
If you trade futures with ATR-based stops, you know the hassle:
Different contracts have different tick values
You need to calculate position risk in dollars
Switching between symbols means redoing all the math
Renko charts make it even more confusing since ATR needs to come from regular candles
This handles all of that automatically.
Key Features
Auto-detects futures symbols - ES, NQ, YM, RTY, GC, CL, and all the micros (MES, MNQ, etc.)
Shows everything you need in one line: ATR(timeframe) × multiplier = X ticks ($XXX)
Works on Renko charts - pulls ATR from regular timeframe charts (super important if you use Renko)
Adjustable position sizing - set your contract count and see total risk instantly
Clean, minimal display - just the info you need, no clutter
How to Use
Add it to any futures chart
Set your preferred ATR timeframe (I use 5-minute)
Set your ATR multiplier (I use 1.5x for my stops)
Set your contract size
That's it - the indicator handles the rest
The display will show something like: "ES ATR(5) × 1.5 = 12 ticks ($150)"
Settings Explained
ATR Timeframe: What timeframe to calculate ATR from (always uses regular candles, even on Renko)
ATR Multiplier: How many ATRs for your stop (1.5 is common, 2.0 for wider stops)
Number of Contracts: Your position size for risk calculation
Auto-Detect Symbol: Leave on unless you want to manually override
Supported Futures
Full size: ES, NQ, YM, RTY, GC, CL, ZB, ZN, 6E, 6J
Micros: MES, MNQ, MYM, M2K, MGC, MCL
Notes
Made this primarily for my own ES trading but figured others might find it useful
The tick values are based on standard CME specs
If you trade other futures, you can modify the code to add them
Works great alongside level indicators for risk management
Why This Exists
I use ATR trailing stops on all my trades and got tired of doing mental math every time I switched between charts or contracts. Especially useful if you trade both full-size and micro contracts - the risk difference is huge and easy to mess up.
Hope this helps your trading! Feel free to suggest improvements.

Camarilla Pivot Plays (Lite) [BruzX]█ OVERVIEW
This indicator implements the Camarilla Pivot Points levels and a system for suggesting particular plays. It only 3rd, 4th, and 6th levels, as these are the only ones used by the system. It also optionally shows the Central Pivot Range, which is in fact between S2 and R2. In total, there are 12 possible plays, grouped into two groups of six. The algorithm evaluates in real-time which plays fulfil their precondition and shows the candidate plays. The user must then decide if and when to take the play.
█ CREDITS
The Camarilla pivot plays are defined in a strategy developed by Thor Young, and the whole system is explained in his book "A Complete Day Trading System". This description is self-sufficient for effective use.
█ FEATURES
Display the 3rd, 4th and 6th Camarilla pivot levels
Works for stocks, futures, indices, forex and crypto
Automatically switches between RTH and ETH data based on criteria defined by the system.
Option to force RTH/ETH data and force a close price to be used in the calculation.
Preconditions for the plays can be toggled on/off
Works correctly on both RTH and ETH charts
Well-documented options tooltips
Well-documented and high-quality open-source code for those who are interested
█ HOW TO USE
The defaults work well; at a minimum, just add the indicator and watch the plays being called. For US futures, you will probably want to chat the "Timezone for sessions" to New York and the regular session times to 09:30 - 16:00. The following diagram shows its key features.
By default, the indicator draws plays 1 days back; this can be changed up to 20 days. The labels can be shifted left/right using the "label offset" option to avoid overlapping with other labels in this indicator or those of another indicator.
An information box at the top-right of the chart shows:
The data currently in use for the main pivots. This can switch in the pre-market if the H/L range exceeds the previous day's H/L, and if it does, you will see that switch at the time that it happens
Whether the current day's pivots are in a higher or lower range compared to the previous day's.
The width of the pivots compared to the previous day
The current candidate plays fulfilling preconditions. You then need to watch the price action to decide whether to take the play.
The resistance pivots are all drawn in the same colour (red by default), as are the support pivots (green by default). You can change the resistance and support colours, but it is not possible to have different colours for different levels of the same kind.
█ CONCEPTS
The indicator is focused around daily Camarilla pivots and evaluates the preconditions for 12 possible plays: 6 when in a higher range, 6 when in a lower range. The plays are labelled by two letters—the first indicates the range, the second indicates the play—as shown in this diagram:
The pivots can be calculated using only RTH (Regular Trading Hours) data, or ETH (Extended Trading Hours) data, which includes the pre-market and post-market. The indicator implements logic to automatically choose the correct data, based on the rules defined by the strategy. This is user-overridable. With the default options, ETH will be used when the H/L range in the previous day's post-market or current day's pre-market exceeds that of the previous day's regular market. In auto mode, the chosen pivots are considered the main pivots for that day and are the ones used for play evaluation. The "other" pivots can also be shown—"other" here meaning using ETH data when the main pivots use RTH data, and vice versa.
The plays must fulfil a set of preconditions. There are preconditions for valid region and range, price sweeps into levels, correct pivot width, opening position, price action, and whether neutral range plays and premarket plays are enabled. When all the preconditions are fulfilled, the play will be shown as a candidate.
█ NOTE FOR FUTURES
Futures don't officially have a pre-market or post-market like equities. Let's take ES on CME as an example. It trades from 18:00 ET Sunday to 17:00 Friday (ET), with a daily pause between 17:00 and 18:00 ET. However, most of the trading activity is done between 09:30 and 16:00, which you can tell from the volume spikes at those times, and this coincides with NYSE/NASDAQ regular hours. So we define a pseudo-pre-market from 18:00 the previous day to 09:30 on the current day, then a pseudo-regular market from 08:30 to 16:00, then a pseudo-post-market from 16:00 to 17:00. The indicator then works exactly the same as with equities—all the options behave the same, just with different session times defined for the pre-, regular, and post-market, with "RTH" meaning just the regular market and "ETH" meaning all three.
█ LIMITATIONS
The pivots are very close to those shown in DAS Trader Pro. They are not to-the-cent exact, but within a few cents. The reasons are:
TradingView provides free real-time data from CBOE One, not full exchange data (you can pay for this though, and it's not expensive), and
the close/high/low are taken from the intraday timeframe you are currently viewing, not daily data—which are very close, but often not exactly the same. For example, the high on the daily timeframe may differ slightly from the daily high you'll see on an intraday timeframe.
Despite these caveats, occasionally large spikes will be seem in one platform and not the other (even with paid data), or the spikes will reach significantly difference prices. Where these spikes create the daily high or low, this can cause significantly different pivots levels. The more traded the stock is, the less the difference tends to be. Highly traded stocks are usually within a few cents (but even they occasionally have large differences in spikes). There is nothing that can be done about this.
The 6th Camarilla level does not have a standard definition and may not match the level shown on other platforms. It does match the definition used by DAS Trader Pro.
Replay mode for stocks does not work correctly. This is due to some important Pine Script variables provided by the TradingView platform and used by the script not being assigned correct values in replay mode. Futures do not use these variables, so they should work in replay mode.
The indicator is an intraday indicator (despite also being able to show weekly and monthly pivots on an intraday chart). It deactivates on a daily timeframe and higher. Sub-minute timeframes are also not supported.
The indicator was developed and tested for US/European stocks, US futures and EURUSD forex and BTCUSD. It should work as intended for stocks and futures in different countries, and for all forex and crypto, but this is tested as much as the security it was developed for.
█ DISCLAIMER
This indicator is provided for information only and should not be used in isolation without a good understand of the system and without considering other factors. You should not take trades using real money based solely on what this indicator says. Any trades you take are entirely at your own risk.

Weekend GapsIdentify unfilled gaps between the close of one candle and the opening of the next. Optimised for weekends by highlighting friday gaps with a triangle and bold horizontal ray. Depending on the price action required to fill it, they are marked in red or green.

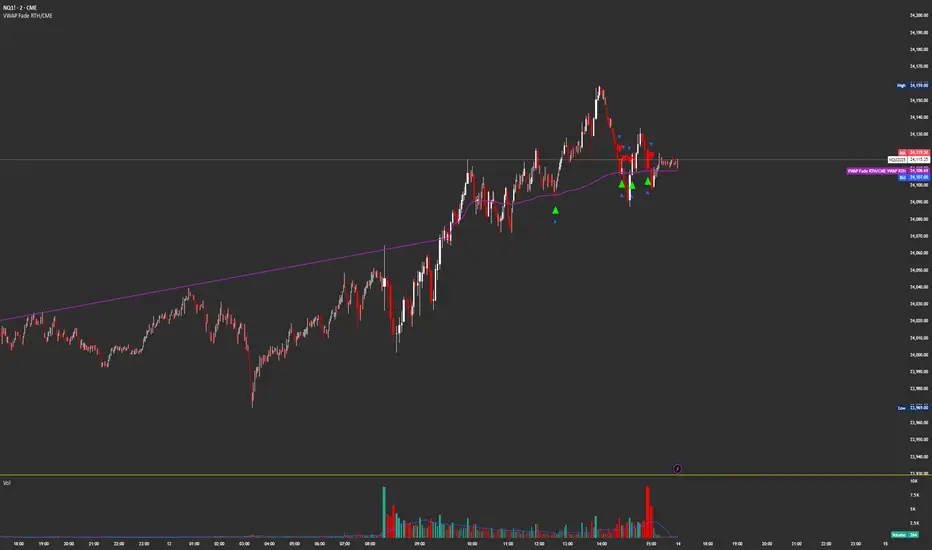
VWAP Fade RTHSame as
Except this version only updates during CME Regular Trading Hours
9:30 AM NY/EST -4 PM NY/EST
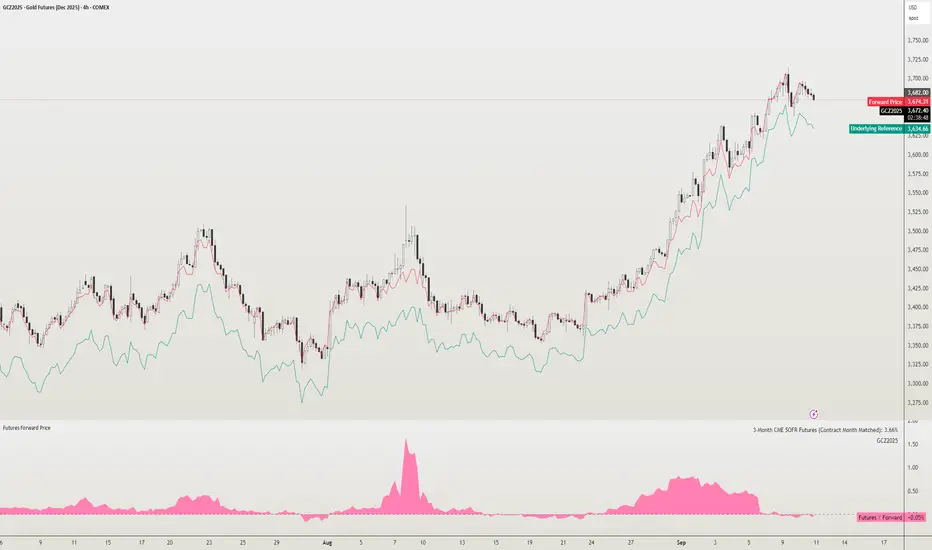
Futures Forward Price [NeoButane]In futures markets, the theoretical value of a futures contract can be derived from its underlying price and cost of carry. By baking in the costs and potential yields, the theoretical forward price then be used in basis against futures prices in place of the underlying spot price.
Usage
The script creates plots on the main chart and a separate window pane. Both are meant to be used to visualize dislocations in the market.
By using a futures vs. forward basis instead of futures vs. spot basis, discounts in the market are clearer.
Last month, the gold futures market GCZ2025 traded >1% above forward price when tariffs were announced and fell back in line once the tariffs were verbally retracted.
View roll spreads over a back-adjusted continuous chart. I guess. I don't think spread traders only look at one chart. This is as educational for me as it is you.
Configuration
The underlying reference needs to be changed to match the futures contract you are using.
The Risk-Free Rate defaults to FRED:SOFR. I found the contract month matched 3-Month SOFR Futures to be the closest for forward price.
Risk-Free Rate: The interest rate source for forward price.
Constant Risk-Free Rate: a static interest rate that can be used in advance of future changes in risk-free rate.
Underlying Reference: spot or index price. Some examples include TVC:SPX, TVC:GOLD, CRYPTO:BTCUSD, TVC:USOIL.
Forward Price Compounding: determines which formula to use. They're similar and become closer as the contract matures.
Alternative Contract: enable and select a futures contract to use it on a chart different than the main.
Storage Cost and Yield: for use with commodities. I haven't found a proper use for them yet but enabling is simple if you are able to.
The following are meant to be used with the continuous formula as they are compounded. However the rate sources don't differ much for the purpose of futures prices.
3-Month CME SOFR Futures
3-Month ICEEUR SONIA Futures
3-Month Osaka TONA Futures
The other rate sources are either meant for futures contracts shorter than quarterly such as monthly crypto futures or were meant to help myself understand how different rates would align with futures prices, like inflation.
What this script does
It uses the cost of carry formula to output the forward price (red line). The underlying reference (green line) is plotted alongside and a futures-derived reference (blue line) can be displayed to see how it looks next to the real reference price.
The data pane displays either the nominal difference or percentage difference between the real futures price and the calculated forward price.
Further reading
www.investopedia.com
www.cmegroup.com
www.oxfordenergy.org
www-2.rotman.utoronto.ca
www.cmegroup.com
3-month rate futures
www.cmegroup.com
www.ice.com
www.bankofengland.co.uk
www.jpx.co.jp
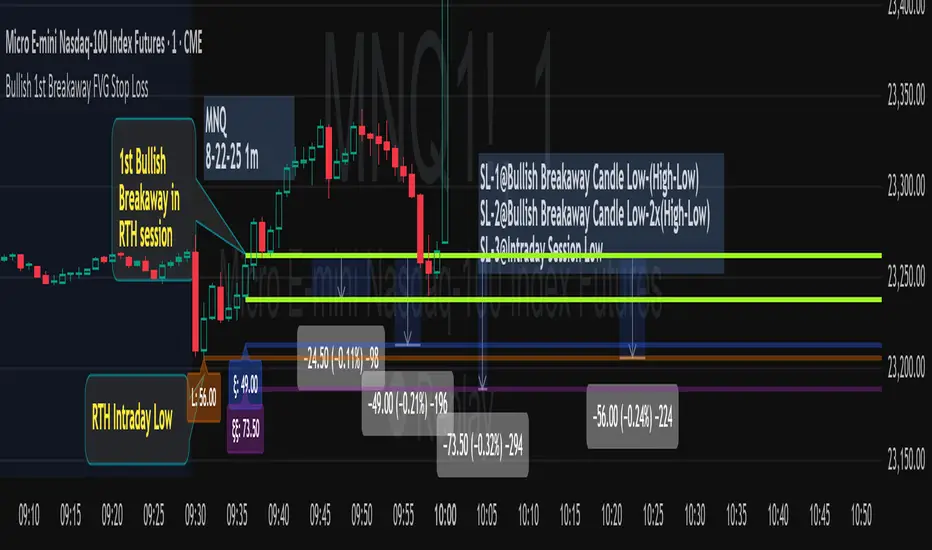
Bullish 1st Breakaway FVG Stop Loss
This indicator provides a defined 3-tier stop loss placement when you want to trade the 1st Bullish Breakaway FVG strategy. The Bullish Breakaway Dual Session FVG indicator is an independent indicator that track all bullish breakaway candles, however this one only tracks the very 1st breakaway candle with a stop loss visual cue.
Introduction of Bullish Breakaway Consolidated FVG:
Inspired by the FVG Concept:
This indicator is built on the Fair Value Gap (FVG) concept, with a focus on Consolidated FVG. Unlike traditional FVGs, this version only works within a defined session (e.g., ETH 18:00–17:00 or RTH 09:30–16:00).
Bullish consolidated FVG & Bullish breakaway candle
Begins when a new intraday low is printed. After that, the indicator searches for the 1st bullish breakaway candle, which must have its low above the high of the intraday low candle. Any candles in between are part of the consolidated FVG zone. Once the 1st breakaway forms, the indicator will shades the candle’s range (high to low).
Session Reset: Occurs at session close.
Choose your own session: use 930 to 1615 for RTH, 1800 to 1615 for ETH. (New York Time Zone)
Repaint Behavior:
If a new intraday (or intra-session) low forms, earlier breakaway patterns are wiped, and the system restarts from the new low.
Product Optimization:
This indicator is designed for CME future product with New York time zone. If you want to trade other products, please adjust your own time session.
Entry:
Long after the 1st Bullish Breakaway Candle in your active session.
However, best position of long is executed by your own trading skill and edge.
Stop Loss: ξ
ξ: This is the 1st stop loss, it is 1 equal size of the breakaway candle below the low.
ξξ: This is the 2nd stop loss, it is 2 equal sizes of the breakaway candle below the low.
L: This is the 3rd stop loss, it is the intraday session low.
Stop loss calculation:
Assuming you enter at the high of the breakaway candle, the SL number is shown as the high minus the stop loss placement.
Last Mention:
If you don't see anything in the indicator, adjust your session to an active session only, and use Tradingview replay function. This indicator is a live indicator with repainting mechanism.
Bearish Breakaway Dual Session-FVGInspired by the FVG Concept:
This indicator is built on the Fair Value Gap (FVG) concept, with a focus on Consolidated FVG. Unlike traditional FVGs, this version only works within a defined session (e.g., ETH 18:00–17:00 or RTH 09:30–16:00).
See the Figure below as an example:
Bearish consolidated FVG & Bearish breakaway candle
Begins when a new intraday high is printed. After that, the indicator searches for the 1st bearish breakaway candle, which must have its high below the low of the intraday high candle. Any candles in between are part of the consolidated FVG zone. Once the 1st breakaway forms, the indicator will shades the candle’s range (high to low). Then it will use this candle as an anchor to search for the 2nd, 3rd, etc. breakaways until the session ends.
Session Reset: Occurs at session close.
Repaint Behavior:
If a new intraday (or intra-session) high forms, earlier breakaway patterns are wiped, and the system restarts from the new low.
Counter:
A session-based counter at the top of the chart displays how many bullish consolidated FVGs have formed.
Settings
• Session Setup:
Choose ETH, RTH, or custom session. The indicator is designed for CME futures in New York timezone, but can be adjusted for other markets.
If nothing appears on your chart, check if you loaded it during an inactive session (e.g., weekend/Friday night).
• Max Zones to Show:
Default = 3 (recommended). You can increase, but 3 zones are usually most useful.
• Timeframe:
Best on 1m, 5m, or 15m. (If session range is big, try higher time frame)
Usage:
See this figure as an example
1. Avoid Trading in Wrong Direction
• No Bearish breakaway = No Short trade.
• Prevents the temptation to countertrade in strong uptrends.
2. Catch the Trend Reversal
• When a bearish breakaway appears after an intraday high, it signals a potential reversal.
• You will need adjust position sizing, watch out liquidity hunt, and place stop loss.
• Best entries of your preferred choices: (this is your own trading edge)
Retest
Breakout
Engulf
MA cross over
Whatever your favorite approach
• Reversal signal is the strongest when price stays within/below the breakaway candle’s
range. Weak if it breaks above.
3. Higher Timeframe Confirmation
• 1m can give false reversals if new lows keep forming.
• 5m often provides cleaner signals and avoids premature reversals.
Summary
This indicator offers 3 main advantages:
1. Prevents wrong-direction trades.
2. Confirms trend entry after reversal signals.
3. Filters false positives using higher timeframes.
Failed example:
Usually happen if you are countering a strong trend too early and using 1m time frame
Last Mention:
The indicator is only used for bearish side trading.

Bullish Breakaway Dual Session-Publish-Consolidated FVG
Inspired by the FVG Concept:
This indicator is built on the Fair Value Gap (FVG) concept, with a focus on Consolidated FVG. Unlike traditional FVGs, this version only works within a defined session (e.g., ETH 18:00–17:00 or RTH 09:30–16:00).
Bullish consolidated FVG & Bullish breakaway candle
Begins when a new intraday low is printed. After that, the indicator searches for the 1st bullish breakaway candle, which must have its low above the high of the intraday low candle. Any candles in between are part of the consolidated FVG zone. Once the 1st breakaway forms, the indicator will shades the candle’s range (high to low). Then it will use this candle as an anchor to search for the 2nd, 3rd, etc. breakaways until the session ends.
Session Reset: Occurs at session close.
Repaint Behavior:
If a new intraday (or intra-session) low forms, earlier breakaway patterns are wiped, and the system restarts from the new low.
Counter:
A session-based counter at the top of the chart displays how many bullish consolidated FVGs have formed.
Settings
• Session Setup:
Choose ETH, RTH, or custom session. The indicator is designed for CME futures in New York timezone, but can be adjusted for other markets.
If nothing appears on your chart, check if you loaded it during an inactive session (e.g., weekend/Friday night).
• Max Zones to Show:
Default = 3 (recommended). You can increase, but 3 zones are usually most useful.
• Timeframe:
Best on 1m, 5m, or 15m. (If session range is big, try higher time frame)
Usage
1. Avoid Trading in Wrong Direction
• No bullish breakaway = No long trade.
• Prevents the temptation to countertrade in strong downtrends.
2. Catch the Trend Reversal
• When a bullish breakaway appears after an intraday low, it signals a potential reversal.
• You will need adjust position sizing, watch out liquidity hunt, and place stop loss.
• Best entries of your preferred choices: (this is your own trading edge)
Retest
Breakout
Engulf
MA cross over
Whatever your favorite approach
• Reversal signal is the strongest when price stays within/above the breakaway candle’s
range. Weak if it breaks below.
3. Higher Timeframe Confirmation
• 1m can give false reversals if new lows keep forming.
• 5m often provides cleaner signals and avoids premature reversals.
Failed Trade Example:
This indicator will repaint if a new intraday session low is updated. So it is possible to have a failed trade. Here is an example from the same session in 1m chart. However, if you enter the trade later at another bullish breakaway candle signal. The loss can be mitigated by the profit.
Therefore you should use smaller position size for your 1st trade. You should also considering using 5m chart to avoid 1m bull trap. In this example, if you use 5m chart, you can totally avoid this failed trade.
If you enter the trade, you will see the intraday low is stop loss hunted. You can also see the 1st bullish breakaway candle is super weak. There are a lot of candles below the breakaway candle low, so it is very possible to fail.
In the next chart, you can see the failed traded get stop loss hunted. However you can enter another trade with huge profit to win back the loss from the 1st trade if you follow the rule.
Summary
This indicator offers 3 main advantages:
1. Prevents wrong-direction trades.
2. Confirms trend entry after reversal signals.
3. Filters false positives using higher timeframes.
How to sharp your edge:
1. ⏳Extreme patience⏳: Do not guess the bottom during a downtrend before a confirmed bullish breakaway candle. If you get caught, have the courage to cut loss. This is literally the most important usage of this indicator. Again, this is the most important rule of this indicator and actually the hardest rule to follow.
2. 🛎Better Entry🛎: After a confirmed bullish breakaway, you will always have a good opportunity to enter the trade using established trading technique. Your edge will come from the position size, draw down, stop loss placement, risk/reward ratio.
3. ✂Cut loss fast✂: If you enter a trade according to the rule, but you are still not making profit for a period of time, and the price is below the low of the breakaway candle. It is very likely you may hit stop loss soon (intraday session low). It won't be a bad idea to cut loss before stop loss hit.
4. 🔂Reentry with confidence after stop loss🔂: a stop loss will not invalidate the indicator. If you see a second chance to reenter, you should still follow the trade guide and rule.
5. 🕔Time frame matter🕔: try 1m, 3m, 5m, 10m, 15m time frame. Over time, you should know what time frame work best for you and the market. Higher time frame will reduce the noise of false positive trade, but it comes with a higher stop loss placement and less max profit, however it may come with a lower draw down. Time frame will matter depending on the range of the session. If the session range is small (<0.5%), lower time frame is good. If session range is big (>1%), 5m time frame is better. Remember to wait for candle to close, if you use higher time frame.
Last Mention:
The indicator is only used for bullish side trading.

Signal Stack MeterWhat it is
A lightweight “go or no‑go” meter that combines your manual read of Structure, Location, and Momentum with automatic context from volatility and macro timing. It surfaces a single, tradeable answer on the chart: OK to engage or Standby.
Why traders like it
You keep your discretion and nuance, and the meter adds guardrails. It prevents good trade ideas from being executed in the wrong conditions.
What it measures
Manual buckets you set each day: Structure, Location, Momentum from 0 to 2
Volatility from VIX, term structure, ATR 5 over 60, and session gaps
Time windows for CPI, NFP, and FOMC with ET inputs and an exchange‑offset
Total score and a simple gate: threshold plus a “strong bucket” rule you choose
How to use in 30 seconds
Pick a preset for your market.
Set Structure, Location, Momentum to 0, 1, or 2.
Leave defaults for the auto metrics while you get a feel.
Read the header. When it says OK to engage, you have both your read and the context.
Defaults we recommend
OK threshold: 5
Strong bucket rule: Either Structure or Location equals 2
VIX triggers: 22 and 1.25× the 20‑SMA
Term mode: Diff at 0.00 tolerance. Ratio mode at 1.00+ is available
ATR 5/60 defense: 1.25. Offense cue: 0.85 or lower
ATR smoothing: 1
Gap mode: RTH with 0.60× ATR5 wild gap. ON wild range at 0.80× ATR5
CPI window 08:25 to 08:40 ET. FOMC window 13:50 to 14:30 ET
ET to exchange offset: −60 for CME index futures. Set to 0 for NYSE symbols like SPY
Alert cadence: Once per RTH session. Snooze first 30 minutes optional
New since the last description
Parity with Defense Mode for presets, sessions, ratio vs diff term mode, ATR smoothing, RTH‑key cadence, and snooze options
Event windows in ET with a simple offset to your exchange time
Alternate row backgrounds and full color control for readability
Exposed series for automation: EngageOK(1=yes) plus TotalScore
Debug toggle to see ATR ratio, term, and gap measurements directly
Notes
Dynamic alerts require “Any alert() function call”.
The meter is designed to sit opposite Defense Mode on the chart. Use the position input to avoid overlap.

SITFX_FuturesSpec_v17SITFX_FuturesSpec_v17 – Universal Futures Contract Library
Full-scale futures contract specification library for Pine Script v6. Covers CME, CBOT, NYMEX, COMEX, CFE, Eurex, ICE, and more – including minis, micros, metals, energies, FX, and bonds.
Key Features:
✅ Instrument‑agnostic: ES/MES, NQ/MNQ, YM/MYM, RTY/M2K, metals, energies, FX, bonds
✅ Full contract data: Tick size, tick value, point value, margins
✅ Continuation‑safe: Single‑line logic, no arrays or continuation errors
✅ Foundation for SITFX tools: Gann, Fibs, structure, and risk modules
Usage example:
import SITFX_FuturesSpec_v17/1 as fs
spec = fs.get(syminfo.root)
label.new(bar_index, high, str.format("{0}: Tick={1}, Value=${2}", spec.name, spec.tickSize, spec.tickValue))


VoVix DEVMA🌌 VoVix DEVMA: A Deep Dive into Second-Order Volatility Dynamics
Welcome to VoVix+, a sophisticated trading framework that transcends traditional price analysis. This is not merely another indicator; it is a complete system designed to dissect and interpret the very fabric of market volatility. VoVix+ operates on the principle that the most powerful signals are not found in price alone, but in the behavior of volatility itself. It analyzes the rate of change, the momentum, and the structure of market volatility to identify periods of expansion and contraction, providing a unique edge in anticipating major market moves.
This document will serve as your comprehensive guide, breaking down every mathematical component, every user input, and every visual element to empower you with a profound understanding of how to harness its capabilities.
🔬 THEORETICAL FOUNDATION: THE MATHEMATICS OF MARKET DYNAMICS
VoVix+ is built upon a multi-layered mathematical engine designed to measure what we call "second-order volatility." While standard indicators analyze price, and first-order volatility indicators (like ATR) analyze the range of price, VoVix+ analyzes the dynamics of the volatility itself. This provides insight into the market's underlying state of stability or chaos.
1. The VoVix Score: Measuring Volatility Thrust
The core of the system begins with the VoVix Score. This is a normalized measure of volatility acceleration or deceleration.
Mathematical Formula:
VoVix Score = (ATR(fast) - ATR(slow)) / (StDev(ATR(fast)) + ε)
Where:
ATR(fast) is the Average True Range over a short period, representing current, immediate volatility.
ATR(slow) is the Average True Range over a longer period, representing the baseline or established volatility.
StDev(ATR(fast)) is the Standard Deviation of the fast ATR, which measures the "noisiness" or consistency of recent volatility.
ε (epsilon) is a very small number to prevent division by zero.
Market Implementation:
Positive Score (Expansion): When the fast ATR is significantly higher than the slow ATR, it indicates a rapid increase in volatility. The market is "stretching" or expanding.
Negative Score (Contraction): When the fast ATR falls below the slow ATR, it indicates a decrease in volatility. The market is "coiling" or contracting.
Normalization: By dividing by the standard deviation, we normalize the score. This turns it into a standardized measure, allowing us to compare volatility thrust across different market conditions and timeframes. A score of 2.0 in a quiet market means the same, relatively, as a score of 2.0 in a volatile market.
2. Deviation Analysis (DEV): Gauging Volatility's Own Volatility
The script then takes the analysis a step further. It calculates the standard deviation of the VoVix Score itself.
Mathematical Formula:
DEV = StDev(VoVix Score, lookback_period)
Market Implementation:
This DEV value represents the magnitude of chaos or stability in the market's volatility dynamics. A high DEV value means the volatility thrust is erratic and unpredictable. A low DEV value suggests the change in volatility is smooth and directional.
3. The DEVMA Crossover: Identifying Regime Shifts
This is the primary signal generator. We take two moving averages of the DEV value.
Mathematical Formula:
fastDEVMA = SMA(DEV, fast_period)
slowDEVMA = SMA(DEV, slow_period)
The Core Signal:
The strategy triggers on the crossover and crossunder of these two DEVMA lines. This is a profound concept: we are not looking at a moving average of price or even of volatility, but a moving average of the standard deviation of the normalized rate of change of volatility.
Bullish Crossover (fastDEVMA > slowDEVMA): This signals that the short-term measure of volatility's chaos is increasing relative to the long-term measure. This often precedes a significant market expansion and is interpreted as a bullish volatility regime.
Bearish Crossunder (fastDEVMA < slowDEVMA): This signals that the short-term measure of volatility's chaos is decreasing. The market is settling down or contracting, often leading to trending moves or range consolidation.
⚙️ INPUTS MENU: CONFIGURING YOUR ANALYSIS ENGINE
Every input has been meticulously designed to give you full control over the strategy's behavior. Understanding these settings is key to adapting VoVix+ to your specific instrument, timeframe, and trading style.
🌀 VoVix DEVMA Configuration
🧬 Deviation Lookback: This sets the lookback period for calculating the DEV value. It defines the window for measuring the stability of the VoVix Score. A shorter value makes the system highly reactive to recent changes in volatility's character, ideal for scalping. A longer value provides a smoother, more stable reading, better for identifying major, long-term regime shifts.
⚡ Fast VoVix Length: This is the lookback period for the fastDEVMA. It represents the short-term trend of volatility's chaos. A smaller number will result in a faster, more sensitive signal line that reacts quickly to market shifts.
🐌 Slow VoVix Length: This is the lookback period for the slowDEVMA. It represents the long-term, baseline trend of volatility's chaos. A larger number creates a more stable, slower-moving anchor against which the fast line is compared.
How to Optimize: The relationship between the Fast and Slow lengths is crucial. A wider gap (e.g., 20 and 60) will result in fewer, but potentially more significant, signals. A narrower gap (e.g., 25 and 40) will generate more frequent signals, suitable for more active trading styles.
🧠 Adaptive Intelligence
🧠 Enable Adaptive Features: When enabled, this activates the strategy's performance tracking module. The script will analyze the outcome of its last 50 trades to calculate a dynamic win rate.
⏰ Adaptive Time-Based Exit: If Enable Adaptive Features is on, this allows the strategy to adjust its Maximum Bars in Trade setting based on performance. It learns from the average duration of winning trades. If winning trades tend to be short, it may shorten the time exit to lock in profits. If winners tend to run, it will extend the time exit, allowing trades more room to develop. This helps prevent the strategy from cutting winning trades short or holding losing trades for too long.
⚡ Intelligent Execution
📊 Trade Quantity: A straightforward input that defines the number of contracts or shares for each trade. This is a fixed value for consistent position sizing.
🛡️ Smart Stop Loss: Enables the dynamic stop-loss mechanism.
🎯 Stop Loss ATR Multiplier: Determines the distance of the stop loss from the entry price, calculated as a multiple of the current 14-period ATR. A higher multiplier gives the trade more room to breathe but increases risk per trade. A lower multiplier creates a tighter stop, reducing risk but increasing the chance of being stopped out by normal market noise.
💰 Take Profit ATR Multiplier: Sets the take profit target, also as a multiple of the ATR. A common practice is to set this higher than the Stop Loss multiplier (e.g., a 2:1 or 3:1 reward-to-risk ratio).
🏃 Use Trailing Stop: This is a powerful feature for trend-following. When enabled, instead of a fixed stop loss, the stop will trail behind the price as the trade moves into profit, helping to lock in gains while letting winners run.
🎯 Trail Points & 📏 Trail Offset ATR Multipliers: These control the trailing stop's behavior. Trail Points defines how much profit is needed before the trail activates. Trail Offset defines how far the stop will trail behind the current price. Both are based on ATR, making them fully adaptive to market volatility.
⏰ Maximum Bars in Trade: This is a time-based stop. It forces an exit if a trade has been open for a specified number of bars, preventing positions from being held indefinitely in stagnant markets.
⏰ Session Management
These inputs allow you to confine the strategy's trading activity to specific market hours, which is crucial for day trading instruments that have defined high-volume sessions (e.g., stock market open).
🎨 Visual Effects & Dashboard
These toggles give you complete control over the on-chart visuals and the dashboard. You can disable any element to declutter your chart or focus only on the information that matters most to you.
📊 THE DASHBOARD: YOUR AT-A-GLANCE COMMAND CENTER
The dashboard centralizes all critical information into one compact, easy-to-read panel. It provides a real-time summary of the market state and strategy performance.
🎯 VOVIX ANALYSIS
Fast & Slow: Displays the current numerical values of the fastDEVMA and slowDEVMA. The color indicates their direction: green for rising, red for falling. This lets you see the underlying momentum of each line.
Regime: This is your most important environmental cue. It tells you the market's current state based on the DEVMA relationship. 🚀 EXPANSION (Green) signifies a bullish volatility regime where explosive moves are more likely. ⚛️ CONTRACTION (Purple) signifies a bearish volatility regime, where the market may be consolidating or entering a smoother trend.
Quality: Measures the strength of the last signal based on the magnitude of the DEVMA difference. An ELITE or STRONG signal indicates a high-conviction setup where the crossover had significant force.
PERFORMANCE
Win Rate & Trades: Displays the historical win rate of the strategy from the backtest, along with the total number of closed trades. This provides immediate feedback on the strategy's historical effectiveness on the current chart.
EXECUTION
Trade Qty: Shows your configured position size per trade.
Session: Indicates whether trading is currently OPEN (allowed) or CLOSED based on your session management settings.
POSITION
Position & PnL: Displays your current position (LONG, SHORT, or FLAT) and the real-time Profit or Loss of the open trade.
🧠 ADAPTIVE STATUS
Stop/Profit Mult: In this simplified version, these are placeholders. The primary adaptive feature currently modifies the time-based exit, which is reflected in how long trades are held on the chart.
🎨 THE VISUAL UNIVERSE: DECIPHERING MARKET GEOMETRY
The visuals are not mere decorations; they are geometric representations of the underlying mathematical concepts, designed to give you an intuitive feel for the market's state.
The Core Lines:
FastDEVMA (Green/Maroon Line): The primary signal line. Green when rising, indicating an increase in short-term volatility chaos. Maroon when falling.
SlowDEVMA (Aqua/Orange Line): The baseline. Aqua when rising, indicating a long-term increase in volatility chaos. Orange when falling.
🌊 Morphism Flow (Flowing Lines with Circles):
What it represents: This visualizes the momentum and strength of the fastDEVMA. The width and intensity of the "beam" are proportional to the signal strength.
Interpretation: A thick, steep, and vibrant flow indicates powerful, committed momentum in the current volatility regime. The floating '●' particles represent kinetic energy; more particles suggest stronger underlying force.
📐 Homotopy Paths (Layered Transparent Boxes):
What it represents: These layered boxes are centered between the two DEVMA lines. Their height is determined by the DEV value.
Interpretation: This visualizes the overall "volatility of volatility." Wider boxes indicate a chaotic, unpredictable market. Narrower boxes suggest a more stable, predictable environment.
🧠 Consciousness Field (The Grid):
What it represents: This grid provides a historical lookback at the DEV range.
Interpretation: It maps the recent "consciousness" or character of the market's volatility. A consistently wide grid suggests a prolonged period of chaos, while a narrowing grid can signal a transition to a more stable state.
📏 Functorial Levels (Projected Horizontal Lines):
What it represents: These lines extend from the current fastDEVMA and slowDEVMA values into the future.
Interpretation: Think of these as dynamic support and resistance levels for the volatility structure itself. A crossover becomes more significant if it breaks cleanly through a prior established level.
🌊 Flow Boxes (Spaced Out Boxes):
What it represents: These are compact visual footprints of the current regime, colored green for Expansion and red for Contraction.
Interpretation: They provide a quick, at-a-glance confirmation of the dominant volatility flow, reinforcing the background color.
Background Color:
This provides an immediate, unmistakable indication of the current volatility regime. Light Green for Expansion and Light Aqua/Blue for Contraction, allowing you to assess the market environment in a split second.
📊 BACKTESTING PERFORMANCE REVIEW & ANALYSIS
The following is a factual, transparent review of a backtest conducted using the strategy's default settings on a specific instrument and timeframe. This information is presented for educational purposes to demonstrate how the strategy's mechanics performed over a historical period. It is crucial to understand that these results are historical, apply only to the specific conditions of this test, and are not a guarantee or promise of future performance. Market conditions are dynamic and constantly change.
Test Parameters & Conditions
To ensure the backtest reflects a degree of real-world conditions, the following parameters were used. The goal is to provide a transparent baseline, not an over-optimized or unrealistic scenario.
Instrument: CME E-mini Nasdaq 100 Futures (NQ1!)
Timeframe: 5-Minute Chart
Backtesting Range: March 24, 2024, to July 09, 2024
Initial Capital: $100,000
Commission: $0.62 per contract (A realistic cost for futures trading).
Slippage: 3 ticks per trade (A conservative setting to account for potential price discrepancies between order placement and execution).
Trade Size: 1 contract per trade.
Performance Overview (Historical Data)
The test period generated 465 total trades , providing a statistically significant sample size for analysis, which is well above the recommended minimum of 100 trades for a strategy evaluation.
Profit Factor: The historical Profit Factor was 2.663 . This metric represents the gross profit divided by the gross loss. In this test, it indicates that for every dollar lost, $2.663 was gained.
Percent Profitable: Across all 465 trades, the strategy had a historical win rate of 84.09% . While a high figure, this is a historical artifact of this specific data set and settings, and should not be the sole basis for future expectations.
Risk & Trade Characteristics
Beyond the headline numbers, the following metrics provide deeper insight into the strategy's historical behavior.
Sortino Ratio (Downside Risk): The Sortino Ratio was 6.828 . Unlike the Sharpe Ratio, this metric only measures the volatility of negative returns. A higher value, such as this one, suggests that during this test period, the strategy was highly efficient at managing downside volatility and large losing trades relative to the profits it generated.
Average Trade Duration: A critical characteristic to understand is the strategy's holding period. With an average of only 2 bars per trade , this configuration operates as a very short-term, or scalping-style, system. Winning trades averaged 2 bars, while losing trades averaged 4 bars. This indicates the strategy's logic is designed to capture quick, high-probability moves and exit rapidly, either at a profit target or a stop loss.
Conclusion and Final Disclaimer
This backtest demonstrates one specific application of the VoVix+ framework. It highlights the strategy's behavior as a short-term system that, in this historical test on NQ1!, exhibited a high win rate and effective management of downside risk. Users are strongly encouraged to conduct their own backtests on different instruments, timeframes, and date ranges to understand how the strategy adapts to varying market structures. Past performance is not indicative of future results, and all trading involves significant risk.
🔧 THE DEVELOPMENT PHILOSOPHY: FROM VOLATILITY TO CLARITY
The journey to create VoVix+ began with a simple question: "What drives major market moves?" The answer is often not a change in price direction, but a fundamental shift in market volatility. Standard indicators are reactive to price. We wanted to create a system that was predictive of market state. VoVix+ was designed to go one level deeper—to analyze the behavior, character, and momentum of volatility itself.
The challenge was twofold. First, to create a robust mathematical model to quantify these abstract concepts. This led to the multi-layered analysis of ATR differentials and standard deviations. Second, to make this complex data intuitive and actionable. This drove the creation of the "Visual Universe," where abstract mathematical values are translated into geometric shapes, flows, and fields. The adaptive system was intentionally kept simple and transparent, focusing on a single, impactful parameter (time-based exits) to provide performance feedback without becoming an inscrutable "black box." The result is a tool that is both profoundly deep in its analysis and remarkably clear in its presentation.
⚠️ RISK DISCLAIMER AND BEST PRACTICES
VoVix+ is an advanced analytical tool, not a guarantee of future profits. All financial markets carry inherent risk. The backtesting results shown by the strategy are historical and do not guarantee future performance. This strategy incorporates realistic commission and slippage settings by default, but market conditions can vary. Always practice sound risk management, use position sizes appropriate for your account equity, and never risk more than you can afford to lose. It is recommended to use this strategy as part of a comprehensive trading plan. This was developed specifically for Futures
"The prevailing wisdom is that markets are always right. I take the opposite view. I assume that markets are always wrong. Even if my assumption is occasionally wrong, I use it as a working hypothesis."
— George Soros
— Dskyz, Trade with insight. Trade with anticipation.

Golden Pocket Syndicate [GPS]Golden Pocket Syndicate is a multi-layered market analysis toolkit built for precision entries and sniper-style reversals in both trending and ranging conditions. The script fuses volume dynamics, golden pocket structures, market maker behavior, and liquidation cluster tracking into one high-confluence system.
Core Features:
• 📐 Golden Pocket Zones: Dynamic GP levels from daily, weekly, monthly, and yearly timeframes. These levels update in real-time and serve as confluence zones for entries and exits.
• 📊 WaveTrend Divergence Diamonds: Momentum shifts are detected using a custom filtered WaveTrend cross system to mark high-probability reversal conditions.
• 🧠 Market Maker Premium Divergence: Tracks price dislocation between CME and Binance to detect large player manipulation using a configurable premium threshold.
• 💎 MM Reversal Diamonds: Identifies potential market maker traps and large player pivots using historical candle behavior, EMA alignment, and price structure breaks.
• 📉 Stealth Liquidation Cluster Arrows: Volume-based liquidation pressure visualized as lightweight directional arrows based on calculated wick expansion and volume bursts. Highlights key zones where price is likely to bounce or reject.
• 🧭 Trend Validation: Uses volume-based trend conditions and short-term EMA positioning to further qualify signals and eliminate noise.
How to Use:
This indicator is designed to help traders visualize confluence between key institutional price levels, momentum shifts, and volume-based pressure points. Long/short opportunities can be explored at marked reversal diamonds or liquidation zones that align with key GP levels. Intended for use on higher timeframes (15m to 4H), though flexible across any pair or market.

Advanced Currency Strength Meter# Advanced Currency Strength Meter (ACSM)
The Advanced Currency Strength Meter (ACSM) is a scientifically-based indicator that measures relative currency strength using established academic methodologies from international finance and behavioral economics. This indicator provides traders with a comprehensive view of currency market dynamics through multiple analytical frameworks.
### Theoretical Foundation
#### 1. Purchasing Power Parity (PPP) Theory
Based on Cassel's (1918) seminal work and refined by Froot & Rogoff (1995), PPP suggests that exchange rates should reflect relative price levels between countries. The ACSM momentum component captures deviations from long-term equilibrium relationships, providing insights into currency misalignments.
#### 2. Uncovered Interest Rate Parity (UIP) and Carry Trade Theory
Building on Fama (1984) and Lustig et al. (2007), the indicator incorporates volatility-adjusted momentum to capture carry trade flows and interest rate differentials that drive currency strength. This approach helps identify currencies benefiting from interest rate differentials.
#### 3. Behavioral Finance and Currency Momentum
Following Burnside et al. (2011) and Menkhoff et al. (2012), the model recognizes that currency markets exhibit persistent momentum effects due to behavioral biases and institutional flows. The indicator captures these momentum patterns for trading opportunities.
#### 4. Portfolio Balance Theory
Based on Branson & Henderson (1985), the relative strength matrix captures how portfolio rebalancing affects currency cross-rates and creates trading opportunities between different currency pairs.
### Technical Implementation
#### Core Methodologies:
- **Z-Score Normalization**: Following Sharpe (1994), provides statistical significance testing without arbitrary scaling
- **Momentum Analysis**: Uses return-based metrics (Jegadeesh & Titman, 1993) for trend identification
- **Volatility Adjustment**: Implements Average True Range methodology (Wilder, 1978) for risk-adjusted strength
- **Composite Scoring**: Equal-weight methodology to avoid overfitting and maintain robustness
- **Correlation Analysis**: Risk management framework based on Markowitz (1952) portfolio theory
#### Key Features:
- **Multi-Source Data Integration**: Supports OANDA, Futures, and CFD data sources
- **Scientific Methodology**: No arbitrary scaling or curve-fitting; all calculations based on established statistical methods
- **Comprehensive Dashboard**: Clean, professional table showing currency strengths and best trading pairs
- **Alert System**: Automated notifications for strong/weak currency conditions and extreme values
- **Best Pair Identification**: Algorithmic detection of highest-potential trading opportunities
### Practical Applications
#### For Swing Traders:
- Identify currencies in strong uptrends or downtrends
- Select optimal currency pairs based on relative strength divergence
- Time entries based on momentum convergence/divergence
#### For Day Traders:
- Use with real-time futures data for intraday opportunities
- Monitor currency correlations for risk management
- Detect early reversal signals through extreme value alerts
#### For Portfolio Managers:
- Multi-currency exposure analysis
- Risk management through correlation monitoring
- Strategic currency allocation decisions
### Visual Design
The indicator features a clean, professional dashboard that displays:
- **Currency Strength Values**: Each major currency (EUR, GBP, JPY, CHF, AUD, CAD, NZD, USD) with color-coded strength values
- **Best Trading Pairs**: Filtered list of highest-potential currency pairs with BUY/SELL signals
- **Market Analysis**: Real-time identification of strongest and weakest currencies
- **Potential Score**: Quantitative measure of trading opportunity strength
### Data Sources and Latency
The indicator supports multiple data sources to accommodate different trading needs:
- **OANDA (Delayed)**: Free data with 15-20 minute delay, suitable for swing trading
- **Futures (Real-time)**: CME currency futures for real-time analysis
- **CFDs**: Alternative real-time data source option
### Mathematical Framework
#### Strength Calculation:
Momentum = (Price - Price ) / Price * 100
Z-Score = (Price - Mean) / Standard Deviation
Volatility-Adjusted = Momentum / ATR-based Volatility
Composite = 0.5 * Momentum + 0.3 * Z-Score + 0.2 * Volatility-Adjusted
#### USD Strength Derivation:
USD strength is calculated as the weighted average of all USD-based pairs, providing a true baseline for relative strength comparison.
### Performance Considerations
The indicator is optimized for:
- **Computational Efficiency**: Uses Pine Script v6 best practices
- **Memory Management**: Appropriate lookback periods and array handling
- **Visual Clarity**: Clean table design optimized for both light and dark themes
- **Alert Reliability**: Robust signal generation with statistical significance testing
### Limitations and Risk Disclosure
- Model performance may vary during extreme market stress (Black Swan events)
- Requires stable data feeds for accurate calculations
- Not optimized for high-frequency scalping strategies
- Central bank interventions may temporarily distort signals
- Performance assumes normal market conditions with behavioral adjustments
### Academic References
- Branson, W. H., & Henderson, D. W. (1985). "The Specification and Influence of Asset Markets"
- Burnside, C., Eichenbaum, M., & Rebelo, S. (2011). "Carry Trade and Momentum in Currency Markets"
- Cassel, G. (1918). "Abnormal Deviations in International Exchanges"
- Fama, E. F. (1984). "Forward and Spot Exchange Rates"
- Froot, K. A., & Rogoff, K. (1995). "Perspectives on PPP and Long-Run Real Exchange Rates"
- Jegadeesh, N., & Titman, S. (1993). "Returns to Buying Winners and Selling Losers"
- Lustig, H., Roussanov, N., & Verdelhan, A. (2007). "Common Risk Factors in Currency Markets"
- Markowitz, H. (1952). "Portfolio Selection"
- Menkhoff, L., Sarno, L., Schmeling, M., & Schrimpf, A. (2012). "Carry Trades and Global FX Volatility"
- Sharpe, W. F. (1994). "The Sharpe Ratio"
- Wilder, J. W. (1978). "New Concepts in Technical Trading Systems"
### Usage Instructions
1. **Setup**: Add the indicator to your chart and select your preferred data source
2. **Currency Selection**: Choose which currencies to analyze (default: all major currencies)
3. **Methodology**: Select calculation method (Composite recommended for most users)
4. **Monitoring**: Watch the dashboard for strength changes and best pair opportunities
5. **Alerts**: Set up notifications for strong/weak currency conditions

RISK## Main Purpose
The indicator calculates and displays risk levels based on margin requirements and daily settlement prices, helping traders visualize their potential risk exposure.
## Key Features
**Inputs:**
- **Margin for Calculation**: The CME long margin requirement for the asset
- **HTF Margin Line**: An anchor point for higher timeframe margin calculations
**Core Calculations:**
1. **Settlement Price Tracking**: Captures daily settlement prices during specific session times (6:58-6:59 PM ET for close, 6:00-6:01 PM ET for new day open)
2. **Risk Percentage**: Calculates `margin / (point value × settlement price)` - with special handling for Micro contracts (symbols starting with "M") that uses 10× point value
3. **Risk Intervals**: Determines price intervals representing one margin unit of risk
## Visual Display
The indicator plots multiple risk levels on the chart:
- **Settlement price** (orange circles)
- **Globex open** (green circles)
- **Upper/Lower Risk levels** (red circles) - one and two risk intervals away
- **Subdivision levels** (blue crosses) - 25%, 50%, and 75% of each risk interval
- **MHP+ level** (black crosses) - HTF anchor adjusted by risk percentage
- **HTF Anchor** (black crosses)
## Practical Use
This helps futures traders:
- Visualize how far price can move before hitting margin calls
- See risk levels relative to daily settlements
- Plan position sizing and risk management
- Understand exposure in terms of actual margin requirements
The indicator essentially transforms abstract margin numbers into concrete price levels on the chart, making risk management more visual and intuitive.