6E update Session Prep (CME Day Session 6E, UTC-4)6E update Session Prep (CME Day Session 6E, UTC-4) updated. hope it helps :)
스크립트에서 "CME"에 대해 찾기

Indicador CME - DOLAR BRLConversão do Dólar em Real pelo CME. Normalmente o gráfico do CME é Dólar/Real. Com esse indicador é possível inverter e obter o valor do real em dólar.

Crypto BTC Correlation Scalper Gaps StrategyThis strategy is based on the gaps theory.
In this case we have the BTC futures from CME, which acts in a way similar to stocks, and we can have gaps present between close/open session, and also sometimes between same candle due to huge movements intra candle.
At the same time I have combined this with a daily moving average, to help out a bit with the trend, since we are looking at small timeframe like 1-15/30min .
On top of that we have a reverse option, where long = short and viceversa, which can be used with against BTC pairs .
Rule are simple:
For long, we have a long gap and the close of the correlated candle is above daily sma
For short, we have a short gap and the close of the correlated candle is below daily sma
For exit:
For exit, we take the highest highest values for short entry TP, meaning we get the different from the HH and rest the current open candle distance, and use that distance as a TP.
At the same time for long entry, we take the lowest low value and rest current close of the candle to that value, and we get the TP.
Can also be applied this logic for SL aswell but from the test I have found out that exiting based on a reverse condition(when tp is not being hit), gives better results/dd overall.
If you have any questions, please let me know !

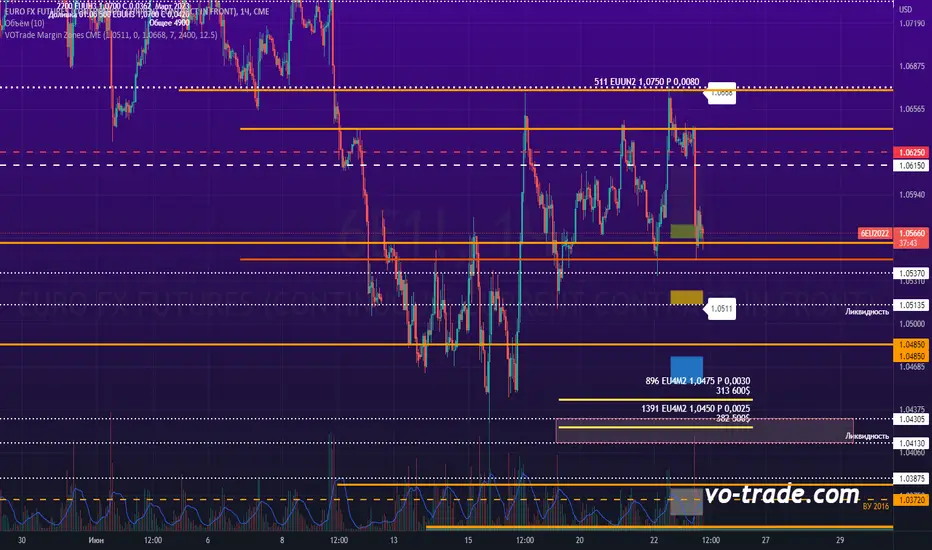
VOTrade Margin Zones CMEMargin zones are zones that are strong support and resistance levels and on the basis of which further movement of a trading instrument can be assumed. Margin zones are built based on the levels of margin requirements for futures of the Chicago Mercantile Exchange (CME), which corresponds to a specific trading instrument on the spot market. The margin requirement levels form a certain amount of the futures move (and therefore the corresponding currency pair), conditionally this can be called the volatility that the market maker sets for the trading instrument.
Margin zones in trading are the areas to which the price reacts, and the closing of the day (the American trading session) below or above a certain level signals to us about the potential of a further trend (this is one of the classic rules based on observation and statistics collection, but you can use the zones as a kind of volatility move in other ways).
BTC COT Delta BBitcoin CME COT Delta Strategy
---------------------------------------
Reading 4 largest long positions and 4 largest short positions, this script uses (shorts - longs) to produce a long/short signal.
• When delta <= buy threshold, a "long" signal will appear on the chart.
• When shorts >= sell threshold, a "short" signal will appear on the chart.
To see the indicator below, since it's not possible to mix the two, use this script:
** This is not a trading advice, it's for research purposes only. Do not trade based upon these signals.

Bitcoin CME Gaps [NeoButane]Simple script that checks for gaps in price from CME. tickerid(x, y, sess) doesn't seem to be applying correctly for the ticker specified at the moment so there are a couple of 'gaps' peppered on lower timeframes.
Gaps are legitimate price levels to look as a support or resistance. The theory is that volume needs to be gap filled, but I currently believe it's an easy entry/exit trade for those who can move the market. I don't think there is sound analysis behind the why, but it is real.

ANEO - CME Contract CalendarI built this indicator to show CME contracts periods
Send me feedback to improve the indicator or if I made any mistake.
enjoy :)

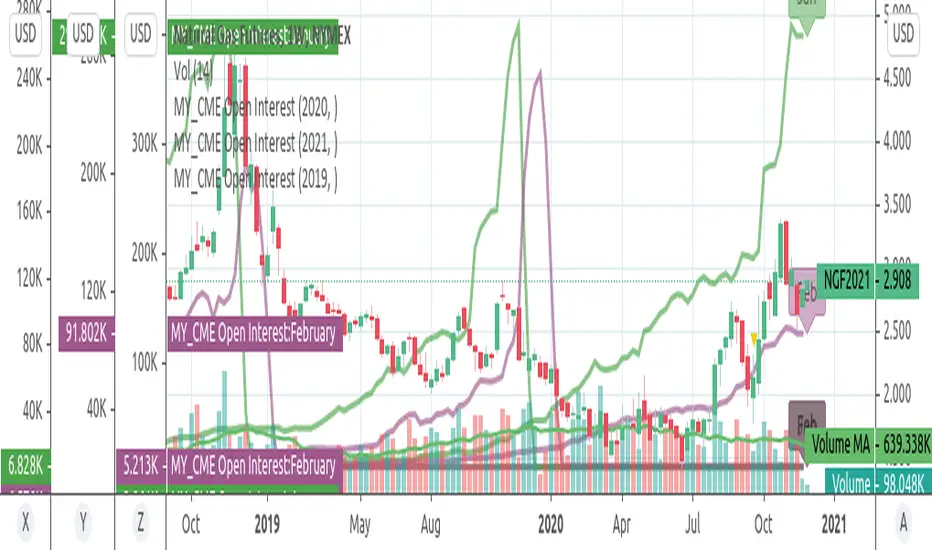
MY_CME eod OI vs CFTC eow OIDaily e-o-d Open Interest as published by CME.
As CFTC COT Open Interest relates to last Tuesday, here you can have an idea how things evolved day-by-day since then.
As CME total OI is not accessibl as data, here I sum OI of the next 9 outstanding contracts, which gives a fair idea of the trend in OI

MY_CME Open Interestend-of-day Open Interest as provided by CME for D interval.
Can select Commodity (Gold.Silver,Crude), year, contract (Feb,April,June,AugOct,Dec)
CME Close PriceThis script adds the closing price of another asset on your chart, such as the BTC1! Futures Price on your BTC Spot Chart for example.

CME Futures RTH net change % levelsRTH Session time calculated for AMERICAN FUTURES ONLY.
Plots the net change % from the last session's RTH close, a.k.a daily % change for that specific instrument. Best used as support and resistance zones in confluence with other analysis, and also serve as a gauge for how volatile the session is.


Smart MACD Volume Trader# Smart MACD Volume Trader
## Overview
Smart MACD Volume Trader is an enhanced momentum indicator that combines the classic MACD (Moving Average Convergence Divergence) oscillator with an intelligent high-volume filter. This combination significantly reduces false signals by ensuring that trading signals are only generated when price momentum is confirmed by substantial volume activity.
The indicator supports over 24 different instruments including major and exotic forex pairs, precious metals (gold and silver), energy commodities (crude oil, natural gas), and industrial metals (copper). For forex and commodity traders, the indicator automatically maps to CME and COMEX futures contracts to provide accurate institutional-grade volume data.
## Originality and Core Concept
Traditional MACD indicators generate signals based solely on price momentum, which can result in numerous false signals during low-activity periods or ranging markets. This indicator addresses this critical weakness by introducing a volume confirmation layer with automatic institutional volume integration.
**What makes this approach original:**
- Signals are triggered only when MACD crossovers coincide with elevated volume activity
- Implements a lookback mechanism to detect volume spikes within recent bars
- Automatically detects and maps 24+ forex pairs and commodities to their corresponding CME and COMEX futures contracts
- Provides real institutional volume data for forex pairs where spot volume is unreliable
- Combines two independent market dimensions (price momentum and volume) into a single, actionable signal
- Includes intelligent asset detection that works across multiple exchanges and ticker formats
**The underlying principle:** Volume validates price movement. When institutional money enters the market, it creates volume signatures. By requiring high volume confirmation and using actual institutional volume data from futures markets, this indicator filters out weak price movements and focuses on trades backed by genuine market participation. The automatic futures mapping ensures that forex and commodity traders always have access to the most accurate volume data available, without manual configuration.
## How It Works
### MACD Component
The indicator calculates MACD using standard methodology:
1. **Fast EMA (default: 12 periods)** - Tracks short-term price momentum
2. **Slow EMA (default: 26 periods)** - Tracks longer-term price momentum
3. **MACD Line** - Difference between Fast EMA and Slow EMA
4. **Signal Line (default: 9-period SMA)** - Smoothed average of MACD line
**Crossover signals:**
- **Bullish:** MACD line crosses above Signal line (momentum turning positive)
- **Bearish:** MACD line crosses below Signal line (momentum turning negative)
### Volume Filter Component
The volume filter adds an essential confirmation layer:
1. **Volume Moving Average** - Calculates exponential MA of volume (default: 20 periods)
2. **High Volume Threshold** - Multiplies MA by ratio (default: 2.0x or 200%)
3. **Volume Detection** - Identifies bars where current volume exceeds threshold
4. **Lookback Period** - Checks if high volume occurred in recent bars (default: 5 bars)
**Signal logic:**
- Buy/Sell signals only trigger when BOTH conditions are met:
- MACD crossover/crossunder occurs
- High volume detected within lookback period
### Automatic CME Futures Integration
For forex traders, spot FX volume data can be unreliable or non-existent. This indicator solves this problem by automatically detecting forex pairs and mapping them to corresponding CME futures contracts with real institutional volume data.
**Supported Major Forex Pairs (7):**
- EURUSD → CME:6E1! (Euro FX Futures)
- GBPUSD → CME:6B1! (British Pound Futures)
- AUDUSD → CME:6A1! (Australian Dollar Futures)
- USDJPY → CME:6J1! (Japanese Yen Futures)
- USDCAD → CME:6C1! (Canadian Dollar Futures)
- USDCHF → CME:6S1! (Swiss Franc Futures)
- NZDUSD → CME:6N1! (New Zealand Dollar Futures)
**Supported Exotic Forex Pairs (4):**
- USDMXN → CME:6M1! (Mexican Peso Futures)
- USDRUB → CME:6R1! (Russian Ruble Futures)
- USDBRL → CME:6L1! (Brazilian Real Futures)
- USDZAR → CME:6Z1! (South African Rand Futures)
**Supported Cross Pairs (6):**
- EURJPY → CME:6E1! (Uses Euro Futures)
- GBPJPY → CME:6B1! (Uses British Pound Futures)
- EURGBP → CME:6E1! (Uses Euro Futures)
- AUDJPY → CME:6A1! (Uses Australian Dollar Futures)
- EURAUD → CME:6E1! (Uses Euro Futures)
- GBPAUD → CME:6B1! (Uses British Pound Futures)
**Supported Precious Metals (2):**
- Gold (XAUUSD, GOLD) → COMEX:GC1! (Gold Futures)
- Silver (XAGUSD, SILVER) → COMEX:SI1! (Silver Futures)
**Supported Energy Commodities (3):**
- WTI Crude Oil (USOIL, WTIUSD) → NYMEX:CL1! (Crude Oil Futures)
- Brent Oil (UKOIL) → NYMEX:BZ1! (Brent Crude Futures)
- Natural Gas (NATGAS) → NYMEX:NG1! (Natural Gas Futures)
**Supported Industrial Metals (1):**
- Copper (COPPER) → COMEX:HG1! (Copper Futures)
**How the automatic detection works:**
The indicator intelligently identifies the asset type by analyzing:
1. Exchange name (FX, OANDA, TVC, COMEX, NYMEX, etc.)
2. Currency pair pattern (6-letter codes like EURUSD, GBPUSD)
3. Commodity identifiers (XAU for gold, XAG for silver, OIL for crude)
When a supported instrument is detected, the indicator automatically switches to the corresponding futures contract for volume analysis. For stocks, cryptocurrencies, and other assets, the indicator uses the native volume data from the current chart.
**Visual feedback:**
An information table appears in the top-right corner of the MACD pane showing:
- Current chart symbol
- Exchange name
- Currency pair or asset name
- Volume source being used (highlighted in orange for futures, yellow for native volume)
- Current high volume status
This provides complete transparency about which data source the indicator is using for its volume analysis.
## How to Use
### Basic Setup
1. Add the indicator to your chart
2. The indicator displays in a separate pane (MACD) and overlay (signals/volume bars)
3. Default settings work well for most assets, but can be customized
### Signal Interpretation
### Visual Signals
**Visual Signals:**
- **Green "BUY" label** - Bullish MACD crossover confirmed by high volume
- **Red "SELL" label** - Bearish MACD crossunder confirmed by high volume
- **Green/Red candles** - Highlight bars with volume exceeding the threshold
- **Light green/red background** - Emphasizes signal bars on the chart
**Information Table:**
A detailed information table appears in the top-right corner of the MACD pane, providing real-time transparency about the indicator's operation:
- **Chart:** Current symbol being analyzed
- **Exchange:** The exchange or data feed being used
- **Pair:** The currency pair or asset name extracted from the ticker
- **Volume From:** The actual symbol used for volume analysis
- Orange color indicates CME or COMEX futures are being used (automatic institutional volume)
- Yellow color indicates native volume from the chart symbol is being used
- Hover tooltip shows whether automatic futures mapping is active
- **High Volume:** Current status showing YES (green) when volume exceeds threshold, NO (gray) otherwise
This table ensures complete transparency and allows you to verify that the correct volume source is being used for your analysis.
**Volume Analysis:**
- Gray histogram bars = Normal volume
- Red histogram bars = High volume (exceeds threshold)
- Green line = Volume moving average baseline
**MACD Analysis:**
- Blue line = MACD line (momentum indicator)
- Orange line = Signal line (trend confirmation)
- Gray dotted line = Zero line (bullish above, bearish below)
### Parameter Customization
**MACD Parameters:**
- Adjust Fast/Slow EMA lengths for different sensitivities
- Shorter periods = More signals, faster response
- Longer periods = Fewer signals, less noise
**Volume Parameters:**
- **Volume MA Period:** Higher values smooth volume analysis
- **High Volume Ratio:** Lower values (1.5x) = More signals; Higher values (3.0x) = Fewer, stronger signals
- **Volume Lookback Bars:** Controls how recent the volume spike must be
**Direction Filters:**
- **Only Buy Signals:** Enables long-only strategy mode
- **Only Sell Signals:** Enables short-only strategy mode
### Alert Configuration
The indicator includes three alert types:
1. **Buy Signal Alert** - Triggers when bullish signal appears
2. **Sell Signal Alert** - Triggers when bearish signal appears
3. **High Volume Alert** - Triggers when volume exceeds threshold
To set up alerts:
1. Click the indicator name → "Add alert on Smart MACD Volume Trader"
2. Select desired alert condition
3. Configure notification method (popup, email, webhook, etc.)
## Trading Strategy Guidelines
### Best Practices
**Recommended markets:**
- Liquid stocks (large-cap, high daily volume)
- Major forex pairs (EURUSD, GBPUSD, USDJPY, AUDUSD, USDCAD, USDCHF, NZDUSD)
- Exotic forex pairs (USDMXN, USDRUB, USDBRL, USDZAR)
- Cross pairs (EURJPY, GBPJPY, EURGBP, AUDJPY, EURAUD, GBPAUD)
- Precious metals (Gold, Silver with automatic COMEX futures mapping)
- Energy commodities (Crude Oil, Natural Gas with automatic NYMEX futures mapping)
- Industrial metals (Copper with automatic COMEX futures mapping)
- Major cryptocurrency pairs
- Index futures and ETFs
**Timeframe recommendations:**
- **Day trading:** 5-minute to 15-minute charts
- **Swing trading:** 1-hour to 4-hour charts
- **Position trading:** Daily charts
**Risk management:**
- Use signals as entry confirmation, not standalone strategy
- Combine with support/resistance levels
- Consider overall market trend direction
- Always use stop-loss orders
### Strategy Examples
**Trend Following Strategy:**
1. Identify overall trend using higher timeframe (e.g., daily chart)
2. Trade only in trend direction
3. Use "Only Buy" filter in uptrends, "Only Sell" in downtrends
4. Enter on signal, exit on opposite signal or at resistance/support
**Volume Breakout Strategy:**
1. Wait for consolidation period (low volume, tight MACD range)
2. Enter when signal appears with high volume (confirms breakout)
3. Target previous swing highs/lows
4. Stop loss below/above recent consolidation
**Forex Scalping Strategy (with automatic CME futures):**
1. The indicator automatically detects forex pairs and uses CME futures volume
2. Trade during active sessions only (use session filter)
3. Focus on quick profits (10-20 pips)
4. Exit at opposite signal or profit target
**Commodities Trading Strategy (Gold, Silver, Oil):**
1. The indicator automatically maps to COMEX and NYMEX futures contracts
2. Trade during high-liquidity sessions (overlap of major markets)
3. Use the high volume confirmation to identify institutional entry points
4. Combine with key support and resistance levels for entries
5. Monitor the information table to confirm futures volume is being used (orange color)
6. Exit on opposite MACD signal or at predefined profit targets
## Why This Combination Works
### The Volume Advantage
Studies consistently show that price movements accompanied by high volume are more likely to continue, while low-volume movements often reverse. This indicator leverages this principle by requiring volume confirmation.
**Key benefits:**
1. **Reduced False Signals:** Eliminates MACD whipsaws during low-volume consolidation
2. **Confirmation Bias:** Two independent indicators (price momentum + volume) agreeing
3. **Institutional Alignment:** High volume often indicates institutional participation
4. **Trend Validation:** Volume confirms that price momentum has "conviction"
### Statistical Edge
By combining two uncorrelated signals (MACD crossovers and volume spikes), the indicator creates a higher-probability setup than either signal alone. The lookback mechanism ensures signals aren't missed if volume spike slightly precedes the MACD cross.
## Supported Exchanges and Automatic Detection
The indicator includes intelligent asset detection that works across multiple exchanges and ticker formats:
**Forex Exchanges (Automatic CME Mapping):**
- FX (TradingView forex feed)
- OANDA
- FXCM
- SAXO
- FOREXCOM
- PEPPERSTONE
- EASYMARKETS
- FX_IDC
**Commodity Exchanges (Automatic COMEX/NYMEX Mapping):**
- TVC (TradingView commodity feed)
- COMEX (directly)
- NYMEX (directly)
- ICEUS
**Other Asset Classes (Native Volume):**
- Stock exchanges (NASDAQ, NYSE, AMEX, etc.)
- Cryptocurrency exchanges (BINANCE, COINBASE, KRAKEN, etc.)
- Index providers (SP, DJ, etc.)
The detection algorithm analyzes three factors:
1. Exchange prefix in the ticker symbol
2. Pattern matching for currency pairs (6-letter codes)
3. Commodity identifiers in the symbol name
This ensures accurate automatic detection regardless of which data feed or exchange you use for charting. The information table in the top-right corner always displays which volume source is being used, providing complete transparency.
## Technical Details
**Calculations:**
- MACD Fast MA: EMA(close, fastLength)
- MACD Slow MA: EMA(close, slowLength)
- MACD Line: Fast MA - Slow MA
- Signal Line: SMA(MACD Line, signalLength)
- Volume MA: Exponential MA of volume
- High Volume: Current volume >= Volume MA × Ratio
**Signal logic:**
```
Buy Signal = (MACD crosses above Signal) AND (High volume in last N bars)
Sell Signal = (MACD crosses below Signal) AND (High volume in last N bars)
```
## Parameters Reference
| Parameter | Default | Description |
|-----------|---------|-------------|
| Volume Symbol | Blank | Manual override for volume source (leave blank for automatic detection) |
| Use CME Futures | False | Legacy option (automatic detection is now built-in) |
| Alert Session | 1530-2200 | Active session time range for alerts |
| Timezone | UTC+1 | Timezone for alert sessions |
| Volume MA Period | 20 | Number of periods for volume moving average |
| High Volume Ratio | 2.0 | Volume threshold multiplier (2.0 = 200% of average) |
| Volume Lookback | 5 | Number of bars to check for high volume confirmation |
| MACD Fast Length | 12 | Fast EMA period for MACD calculation |
| MACD Slow Length | 26 | Slow EMA period for MACD calculation |
| MACD Signal Length | 9 | Signal line SMA period |
| Only Buy | False | Filter to show only bullish signals |
| Only Sell | False | Filter to show only bearish signals |
| Show Signals | True | Display buy and sell labels on chart |
## Optimization Tips
**For volatile markets (crypto, small caps):**
- Increase High Volume Ratio to 2.5-3.0
- Reduce Volume Lookback to 3-4 bars
- Consider faster MACD settings (8, 17, 9)
**For stable markets (large-cap stocks, bonds):**
- Decrease High Volume Ratio to 1.5-1.8
- Increase Volume MA Period to 30-50
- Use standard MACD settings
**For forex (with automatic CME futures):**
- The indicator automatically uses CME futures when forex pairs are detected
- Set appropriate trading session based on your timezone
- Use Volume Lookback of 5-7 bars
- Consider session-based alerts only
- Monitor the information table to verify correct futures mapping
**For commodities (Gold, Silver, Oil, Copper):**
- The indicator automatically maps to COMEX and NYMEX futures
- Increase High Volume Ratio to 2.0-2.5 for metals
- Use slightly higher Volume MA Period (25-30) for smoother analysis
- Trade during active market hours for best volume data
- The information table will show the futures contract being used (orange highlight)
## Limitations and Considerations
**What this indicator does NOT do:**
- Does not predict future price direction
- Does not guarantee profitable trades
- Does not replace proper risk management
- Does not work well in extremely low-volume conditions
**Market conditions to avoid:**
- Pre-market and after-hours sessions (low volume)
- Major news events (volatile, unpredictable volume)
- Holidays and low-liquidity periods
- Extremely low float stocks
## Conclusion
Smart MACD Volume Trader represents a significant evolution of the traditional MACD indicator by combining volume confirmation with automatic institutional volume integration. This dual-confirmation approach significantly improves signal quality by filtering out low-conviction price movements and ensuring traders work with accurate volume data.
The indicator's automatic detection and mapping system supports over 24 instruments across forex, commodities, and metals markets. By intelligently switching to CME and COMEX futures contracts when appropriate, the indicator provides forex and commodity traders with the same quality of volume data that stock traders naturally have access to.
This indicator is particularly valuable for traders who want to:
- Align their entries with institutional money flow
- Avoid getting trapped in false breakouts
- Trade forex pairs with reliable volume data
- Access accurate volume information for gold, silver, and energy commodities
- Combine momentum and volume analysis in a single, streamlined tool
Whether you are day trading stocks, swing trading forex pairs, or positioning in commodities markets, this indicator provides a robust framework for identifying high-probability momentum trades backed by genuine institutional participation. The automatic futures mapping works seamlessly across all supported instruments, requiring no manual configuration or expertise in futures markets.
---
## Support and Updates
This indicator is actively maintained and updated based on user feedback and market conditions. For questions about implementation or custom modifications, please use the comments section below.
**Disclaimer:** This indicator is for educational and informational purposes only. Past performance does not guarantee future results. Always conduct your own analysis and risk management before trading.

Smart Margin Zone
SMART MARGIN ZONE - CME-BASED SUPPORT & RESISTANCE INDICATOR
TITLE FOR PUBLICATION:
Smart Margin Zone - CME Margin-Based Support and Resistance
CATEGORY:
Support and Resistance
SHORT DESCRIPTION (for preview):
Automatically plots margin zones based on CME Group requirements. These zones represent critical price levels where leveraged traders face margin calls, creating natural support and resistance through forced liquidations.
═══════════════════════════════════════════════════════════════
FULL DESCRIPTION FOR TRADINGVIEW:
═══════════════════════════════════════════════════════════════
📊 Smart Margin Zone - Professional Trading Zones Based on CME Data
This indicator automatically calculates and displays margin zones derived from official CME Group margin requirements. These zones represent critical price levels where traders using leverage receive margin calls, triggering forced position closures that create natural support and resistance levels.
═══════════════════════════════════════════════════════════════
🎯 CORE CONCEPT
═══════════════════════════════════════════════════════════════
When price reaches calculated margin zones, traders using 2:1 or 4:1 leverage on CME futures receive margin calls. Brokers automatically liquidate these positions, creating waves of buying or selling pressure that form strong support and resistance levels.
This is not theoretical - it's based on actual margin requirements from CME Group, the world's largest derivatives marketplace.
═══════════════════════════════════════════════════════════════
📐 CALCULATION METHODOLOGY
═══════════════════════════════════════════════════════════════
The indicator uses the following formula to calculate zone sizes:
Zone Size = (Margin Requirement / Tick Value) × Tick Size × 1.10
Where:
• Margin Requirement = Official CME initial margin (updated November 2024)
• Tick Value = Dollar value of minimum price movement
• Tick Size = Minimum price increment
• 1.10 = 10% buffer for realistic zone width
SUPPORTED INSTRUMENTS WITH CME DATA:
Currency Pairs:
• EURUSD: $2,100 margin → 0.0168 zone size
• GBPUSD: $1,800 margin → 0.0144 zone size
• AUDUSD: $1,300 margin → 0.0065 zone size
• NZDUSD: $1,100 margin → 0.0055 zone size
• USDJPY: $3,200 margin → custom calculation
• USDCAD: $950 margin → calculated
• USDCHF: $1,650 margin → calculated
Commodities:
• Gold (XAUUSD): $8,000 margin → 80 points zone size
• Silver (XAGUSD): $6,500 margin → calculated
• WTI Crude Oil: $4,500 margin → calculated
═══════════════════════════════════════════════════════════════
🔍 HOW IT WORKS
═══════════════════════════════════════════════════════════════
1. SWING POINT DETECTION
The indicator automatically identifies swing highs and swing lows using a configurable lookback period (default 10 bars). These become anchor points for zone calculations.
2. FIVE ZONE LEVELS
From each swing point, five zone levels are calculated:
• Zone 1/4 (25%) - First correction level
• Zone 1/2 (50%) - KEY ZONE for trend determination
• Zone 3/4 (75%) - Intermediate level
• Zone 1/1 (100%) - Full margin zone (strongest level)
• Zone 5/4 (125%) - Extended zone
3. TREND IDENTIFICATION
• Close above Zone 1/2 resistance = Bullish trend
• Close below Zone 1/2 support = Bearish trend
• Between zones = Range/consolidation
4. HISTORICAL CONTEXT
Current zones are displayed prominently with fills and labels. Historical zones appear as thin, semi-transparent lines for context without cluttering the chart.
═══════════════════════════════════════════════════════════════
⚙️ FEATURES
═══════════════════════════════════════════════════════════════
AUTOMATED CALCULATION:
✅ Auto-detection of swing highs and lows
✅ Real-time zone updates as new swings form
✅ CME margin data built-in for major instruments
✅ Manual override option for custom calculations
VISUAL CLARITY:
✅ Color-coded zones (red=resistance, green=support)
✅ Adjustable transparency for fills and lines
✅ Current zones bold with fills and price labels
✅ Historical zones thin and transparent
✅ Swing point markers show calculation origins
CUSTOMIZATION:
✅ Show/hide individual zone levels (1/4, 1/2, 3/4, 1/1, 5/4)
✅ Toggle historical zones on/off
✅ Adjustable lookback period (5-50 bars)
✅ Customizable colors for all elements
✅ Line width and transparency controls
✅ Zone extension options (none/right/both)
TREND ANALYSIS:
✅ Optional trend background coloring
✅ Customizable trend colors and transparency
✅ Real-time trend identification display
STATISTICS:
✅ Live statistics table showing:
- Current instrument
- Active zone size
- Calculation mode
- Current trend direction
- Number of zones displayed
ALERTS:
✅ Zone 1/2 breakout (up/down)
✅ Full margin zone 1/1 reached
✅ Customizable alert messages
═══════════════════════════════════════════════════════════════
📈 TRADING APPLICATIONS
═══════════════════════════════════════════════════════════════
ENTRY SIGNALS:
• Bounces from zone levels = potential entry points
• Zone 1/2 breakouts = trend continuation entries
• Zone rejections = reversal opportunities
RISK MANAGEMENT:
• Zone levels = logical stop-loss placement
• Zone 1/1 = maximum risk level
• Zone spacing = position sizing guide
PROFIT TARGETS:
• Next zone level = first target
• Zone 1/1 = full profit target
• Zone breakouts = extended targets
TREND CONFIRMATION:
• Price above Zone 1/2 resistance = confirmed uptrend
• Price below Zone 1/2 support = confirmed downtrend
• Consolidation between zones = wait for breakout
═══════════════════════════════════════════════════════════════
📚 USAGE INSTRUCTIONS
═══════════════════════════════════════════════════════════════
GETTING STARTED:
1. Add indicator to chart of any supported instrument
2. Zones automatically calculate and display
3. Adjust swing detection period if needed (default 10 works well)
4. Customize colors and visibility to your preference
OPTIMAL SETTINGS:
• Best timeframes: H1, H4, Daily, Weekly
• Default swing length (10) suitable for most markets
• Show 2-3 historical zones for context
• Enable swing point markers to see calculation origins
INTERPRETATION:
• Watch for price reactions at zone boundaries
• Strong bounces = respect for margin level
• Clean breaks = momentum continuation
• Multiple touches = zone strength confirmation
SET ALERTS:
• Zone 1/2 breakouts for trend entries
• Zone 1/1 reaches for profit-taking
• Custom alerts for your specific strategy
═══════════════════════════════════════════════════════════════
⚠️ IMPORTANT NOTES
═══════════════════════════════════════════════════════════════
DATA ACCURACY:
• CME margin requirements updated November 2024
• Margins change periodically - check CME Group website
• Manual mode available for latest margin data
• Indicator provides analysis tool, not financial advice
STATISTICAL PERFORMANCE:
• Historical data shows >60% probability of continued movement after Zone 1/2 breakout
• Zone effectiveness varies by market conditions
• Best results in trending markets with clear swings
LIMITATIONS:
• Margin requirements change - monitor CME updates
• Works best on liquid instruments with clear swings
• Not a standalone trading system
• Should be combined with additional analysis
═══════════════════════════════════════════════════════════════
🔧 METHODOLOGY CREDIT
═══════════════════════════════════════════════════════════════
This indicator is based on the margin zones concept developed by Alexander Bazylev (BTrade indicator for MetaTrader platforms).
The TradingView implementation has been completely rewritten with original enhancements:
• Multiple zone levels instead of single level
• Automatic swing point detection algorithm
• Direct CME data integration
• Historical zone visualization
• Advanced customization options
• Comprehensive statistics and alerts
All code is original and specifically designed for TradingView's Pine Script v5 environment.
═══════════════════════════════════════════════════════════════
💡 BEST PRACTICES
═══════════════════════════════════════════════════════════════
COMBINE WITH:
• Volume analysis for confirmation
• Trend indicators for direction bias
• Price action patterns at zones
• Higher timeframe analysis
AVOID:
• Trading against strong trends at minor zones
• Over-leveraging based solely on zone placement
• Ignoring broader market context
• Expecting perfect bounces every time
OPTIMIZE:
• Adjust swing length for different timeframes
• Shorter period (5-7) for intraday trading
• Longer period (15-20) for swing trading
• Test historical effectiveness on your instruments
═══════════════════════════════════════════════════════════════
📖 EDUCATIONAL VALUE
═══════════════════════════════════════════════════════════════
This indicator helps traders understand:
• How institutional margin requirements affect price
• Where forced liquidations create pressure
• Natural support and resistance formation
• Relationship between leverage and price levels
• Market structure and key technical levels
═══════════════════════════════════════════════════════════════
🔄 VERSION HISTORY
═══════════════════════════════════════════════════════════════
Version 1.0 (Initial Release):
• CME-based zone calculation for 10 instruments
• Automatic swing high/low detection
• 5 zone levels with customizable display
• Historical zones with transparency control
• Swing point markers
• Trend background indicator
• Live statistics table
• Multiple alert conditions
• Fully customizable colors and styles
• English language interface
═══════════════════════════════════════════════════════════════
📞 SUPPORT & FEEDBACK
═══════════════════════════════════════════════════════════════
Questions or suggestions? Leave a comment below!
If you find this indicator useful:
⭐ Please leave a like
💬 Share your experience in comments
🔔 Follow for updates and new indicators
═══════════════════════════════════════════════════════════════
⚖️ DISCLAIMER
═══════════════════════════════════════════════════════════════
This indicator is provided for educational and analytical purposes only. It is not financial advice and should not be the sole basis for trading decisions.
• Past performance does not guarantee future results
• Trading involves substantial risk of loss
• CME margin requirements subject to change
• Always do your own research and risk management
• Consult a financial advisor for investment advice
The creator is not responsible for any trading losses incurred through use of this indicator.

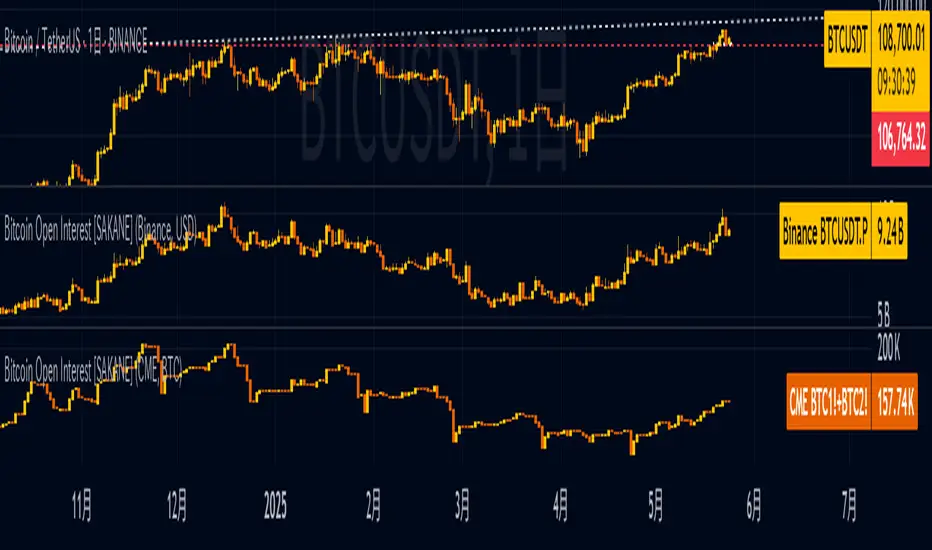
Bitcoin Open Interest [SAKANE]Bitcoin Open Interest
— Unveiling the True Flow of Capital
PurposeVisualize and compare Bitcoin open interest (OI) from CME and Binance, the leading derivatives exchanges, in a single intuitive chart, providing traders with clear insights into crypto market capital dynamics.
Background & MotivationIn the 24/7 crypto market, price movements alone reveal only part of the story. Open interest (OI)—the total outstanding futures contracts—offers critical clues to the market’s next move. Yet, accessing and interpreting OI data is challenging:
CME Constraints: Commitment of Traders (COT) reports are weekly, and standalone BTC1! or BTC2! OI is noisy due to contract rollovers, obscuring true OI changes.
Existing Tool Limitations: Most OI indicators are fixed to either USD or BTC, limiting flexible analysis.
This indicator overcomes these hurdles, enabling seamless comparison of CME and Binance OI to track the market’s “capital center of gravity” in real time.
Key Features
Synthetic CME OI: Combines BTC1! and BTC2! to deliver high-accuracy OI, eliminating rollover noise.
Multi-Timeframe Analysis: Displays daily CME OI as pseudo-candlestick (OHLC) on any timeframe (e.g., 4H), allowing intuitive capital flow tracking across timeframes.
CME/Binance One-Click Toggle: Instantly compare institutional-driven CME and retail-driven Binance OI.
USD/BTC Flexibility: Switch between BTC (real demand) and USD (margin) perspectives for OI analysis.
Robust Design: Concise, global-scope code ensures stability and adaptability to TradingView updates.
Insights & Use Cases
Holistic Market Sentiment: Analyze capital flows by region and exchange for a multidimensional view.
Signal Detection: E.g., a sharp drop in CME OI during a sell-off may signal institutional withdrawal.
Retail Trends: A surge in Binance OI suggests retail-driven inflows.
Event-Driven Insights: E.g., during a hypothetical April 2025 “Trump Tariff Shock,” instantly identify which exchange drives capital shifts.
Unique ValueUnlike price-centric indicators, this tool focuses on capital flow (OI). It’s the only indicator offering one-click multi-timeframe and multi-exchange OI comparison, empowering traders to uncover the market’s “true intent” and gain a strategic edge.
ConclusionBitcoin Open Interest makes the market’s hidden capital movements accessible to all. By capturing market dynamics and pinpointing the “leading forces” during events, it sets a new standard for traders seeking a revolutionary perspective.
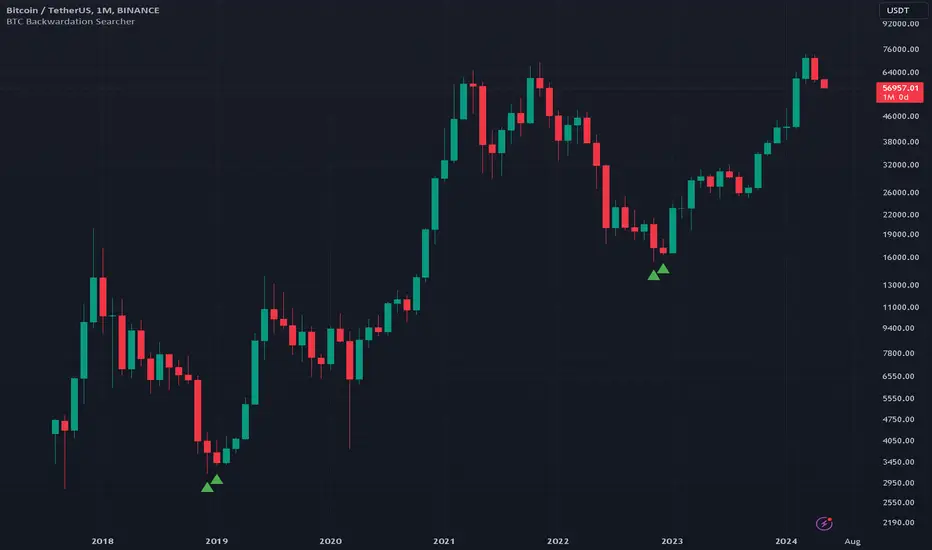
BTC Backwardation SearcherThis Pine Script code is a custom indicator named "BTC Backwardation Searcher" designed for the TradingView platform. The indicator aims to identify and visualize the price difference between two Bitcoin futures contracts: CME:BTC1! and CME:BTC2!.
Here's a breakdown of the code:
1. The script fetches the daily close prices of CME:BTC1! and CME:BTC2! using the security() function.
2. It calculates the percentage price difference between the two contracts using the formula: (btc1Price - btc2Price) / btc2Price * 100.
3. The script also calculates the price difference for the previous two days (2 days ago and 3 days ago) using the same formula.
4. Two conditions are defined:
(1) dailyGreenCondition: If the price difference is greater than or equal to 0.3% for three
consecutive days, including the current day and the previous two days.
(2) dailyRedCondition(commented): If the price difference is less than or equal to -1% for three consecutive days, including the current day and the previous two days.
(I commented it out because I don't think it's useful.)
5. The plotshape() function is used to display green triangles on the chart when the dailyGreenCondition is met, and red triangles when the dailyRedCondition is met. These triangles are displayed on the daily, weekly, and monthly timeframes.
The purpose of this indicator is to help traders identify potential trading opportunities based on the price difference between the two Bitcoin futures contracts. The green triangles suggest a bullish scenario where CME:BTC1! is significantly higher than CME:BTC2!, while the red triangles indicate a bearish scenario where CME:BTC2! is significantly lower than CME:BTC1!.
However, it's important to note that this indicator should be used in conjunction with other technical analysis tools and fundamental analysis. Traders should also consider their risk tolerance, investment goals, and market conditions before making any trading decisions based on this indicator.
Multiple Naked LevelsPURPOSE OF THE INDICATOR
This indicator autogenerates and displays naked levels and gaps of multiple types collected into one simple and easy to use indicator.
VALUE PROPOSITION OF THE INDICATOR AND HOW IT IS ORIGINAL AND USEFUL
1) CONVENIENCE : The purpose of this indicator is to offer traders with one coherent and robust indicator providing useful, valuable, and often used levels - in one place.
2) CLUSTERS OF CONFLUENCES : With this indicator it is easy to identify levels and zones on the chart with multiple confluences increasing the likelihood of a potential reversal zone.
THE TYPES OF LEVELS AND GAPS INCLUDED IN THE INDICATOR
The types of levels include the following:
1) PIVOT levels (Daily/Weekly/Monthly) depicted in the chart as: dnPIV, wnPIV, mnPIV.
2) POC (Point of Control) levels (Daily/Weekly/Monthly) depicted in the chart as: dnPoC, wnPoC, mnPoC.
3) VAH/VAL STD 1 levels (Value Area High/Low with 1 std) (Daily/Weekly/Monthly) depicted in the chart as: dnVAH1/dnVAL1, wnVAH1/wnVAL1, mnVAH1/mnVAL1
4) VAH/VAL STD 2 levels (Value Area High/Low with 2 std) (Daily/Weekly/Monthly) depicted in the chart as: dnVAH2/dnVAL2, wnVAH2/wnVAL2, mnVAH1/mnVAL2
5) FAIR VALUE GAPS (Daily/Weekly/Monthly) depicted in the chart as: dnFVG, wnFVG, mnFVG.
6) CME GAPS (Daily) depicted in the chart as: dnCME.
7) EQUILIBRIUM levels (Daily/Weekly/Monthly) depicted in the chart as dnEQ, wnEQ, mnEQ.
HOW-TO ACTIVATE LEVEL TYPES AND TIMEFRAMES AND HOW-TO USE THE INDICATOR
You can simply choose which of the levels to be activated and displayed by clicking on the desired radio button in the settings menu.
You can locate the settings menu by clicking into the Object Tree window, left-click on the Multiple Naked Levels and select Settings.
You will then get a menu of different level types and timeframes. Click the checkboxes for the level types and timeframes that you want to display on the chart.
You can then go into the chart and check out which naked levels that have appeared. You can then use those levels as part of your technical analysis.
The levels displayed on the chart can serve as additional confluences or as part of your overall technical analysis and indicators.
In order to back-test the impact of the different naked levels you can also enable tapped levels to be depicted on the chart. Do this by toggling the 'Show tapped levels' checkbox.
Keep in mind however that Trading View can not shom more than 500 lines and text boxes so the indocator will not be able to give you the complete history back to the start for long duration assets.
In order to clean up the charts a little bit there are two additional settings that can be used in the Settings menu:
- Selecting the price range (%) from the current price to be included in the chart. The default is 25%. That means that all levels below or above 20% will not be displayed. You can set this level yourself from 0 up to 100%.
- Selecting the minimum gap size to include on the chart. The default is 1%. That means that all gaps/ranges below 1% in price difference will not be displayed on the chart. You can set the minimum gap size yourself.
BASIC DESCRIPTION OF THE INNER WORKINGS OF THE INDICTATOR
The way the indicator works is that it calculates and identifies all levels from the list of levels type and timeframes above. The indicator then adds this level to a list of untapped levels.
Then for each bar after, it checks if the level has been tapped. If the level has been tapped or a gap/range completely filled, this level is removed from the list so that the levels displayed in the end are only naked/untapped levels.
Below is a descrition of each of the level types and how it is caluclated (algorithm):
PIVOT
Daily, Weekly and Monthly levels in trading refer to significant price points that traders monitor within the context of a single trading day. These levels can provide insights into market behavior and help traders make informed decisions regarding entry and exit points.
Traders often use D/W/M levels to set entry and exit points for trades. For example, entering long positions near support (daily close) or selling near resistance (daily close).
Daily levels are used to set stop-loss orders. Placing stops just below the daily close for long positions or above the daily close for short positions can help manage risk.
The relationship between price movement and daily levels provides insights into market sentiment. For instance, if the price fails to break above the daily high, it may signify bearish sentiment, while a strong breakout can indicate bullish sentiment.
The way these levels are calculated in this indicator is based on finding pivots in the chart on D/W/M timeframe. The level is then set to previous D/W/M close = current D/W/M open.
In addition, when price is going up previous D/W/M open must be smaller than previous D/W/M close and current D/W/M close must be smaller than the current D/W/M open. When price is going down the opposite.
POINT OF CONTROL
The Point of Control (POC) is a key concept in volume profile analysis, which is commonly used in trading.
It represents the price level at which the highest volume of trading occurred during a specific period.
The POC is derived from the volume traded at various price levels over a defined time frame. In this indicator the timeframes are Daily, Weekly, and Montly.
It identifies the price level where the most trades took place, indicating strong interest and activity from traders at that price.
The POC often acts as a significant support or resistance level. If the price approaches the POC from above, it may act as a support level, while if approached from below, it can serve as a resistance level. Traders monitor the POC to gauge potential reversals or breakouts.
The way the POC is calculated in this indicator is by an approximation by analysing intrabars for the respective timeperiod (D/W/M), assigning the volume for each intrabar into the price-bins that the intrabar covers and finally identifying the bin with the highest aggregated volume.
The POC is the price in the middle of this bin.
The indicator uses a sample space for intrabars on the Daily timeframe of 15 minutes, 35 minutes for the Weekly timeframe, and 140 minutes for the Monthly timeframe.
The indicator has predefined the size of the bins to 0.2% of the price at the range low. That implies that the precision of the calulated POC og VAH/VAL is within 0.2%.
This reduction of precision is a tradeoff for performance and speed of the indicator.
This also implies that the bigger the difference from range high prices to range low prices the more bins the algorithm will iterate over. This is typically the case when calculating the monthly volume profile levels and especially high volatility assets such as alt coins.
Sometimes the number of iterations becomes too big for Trading View to handle. In these cases the bin size will be increased even more to reduce the number of iterations.
In such cases the bin size might increase by a factor of 2-3 decreasing the accuracy of the Volume Profile levels.
Anyway, since these Volume Profile levels are approximations and since precision is traded for performance the user should consider the Volume profile levels(POC, VAH, VAL) as zones rather than pin point accurate levels.
VALUE AREA HIGH/LOW STD1/STD2
The Value Area High (VAH) and Value Area Low (VAL) are important concepts in volume profile analysis, helping traders understand price levels where the majority of trading activity occurs for a given period.
The Value Area High/Low is the upper/lower boundary of the value area, representing the highest price level at which a certain percentage of the total trading volume occurred within a specified period.
The VAH/VAL indicates the price point above/below which the majority of trading activity is considered less valuable. It can serve as a potential resistance/support level, as prices above/below this level may experience selling/buying pressure from traders who view the price as overvalued/undervalued
In this indicator the timeframes are Daily, Weekly, and Monthly. This indicator provides two boundaries that can be selected in the menu.
The first boundary is 70% of the total volume (=1 standard deviation from mean). The second boundary is 95% of the total volume (=2 standard deviation from mean).
The way VAH/VAL is calculated is based on the same algorithm as for the POC.
However instead of identifying the bin with the highest volume, we start from range low and sum up the volume for each bin until the aggregated volume = 30%/70% for VAL1/VAH1 and aggregated volume = 5%/95% for VAL2/VAH2.
Then we simply set the VAL/VAH equal to the low of the respective bin.
FAIR VALUE GAPS
Fair Value Gaps (FVG) is a concept primarily used in technical analysis and price action trading, particularly within the context of futures and forex markets. They refer to areas on a price chart where there is a noticeable lack of trading activity, often highlighted by a significant price movement away from a previous level without trading occurring in between.
FVGs represent price levels where the market has moved significantly without any meaningful trading occurring. This can be seen as a "gap" on the price chart, where the price jumps from one level to another, often due to a rapid market reaction to news, events, or other factors.
These gaps typically appear when prices rise or fall quickly, creating a space on the chart where no transactions have taken place. For example, if a stock opens sharply higher and there are no trades at the prices in between the two levels, it creates a gap. The areas within these gaps can be areas of liquidity that the market may return to “fill” later on.
FVGs highlight inefficiencies in pricing and can indicate areas where the market may correct itself. When the market moves rapidly, it may leave behind price levels that traders eventually revisit to establish fair value.
Traders often watch for these gaps as potential reversal or continuation points. Many traders believe that price will eventually “fill” the gap, meaning it will return to those price levels, providing potential entry or exit points.
This indicator calculate FVGs on three different timeframes, Daily, Weekly and Montly.
In this indicator the FVGs are identified by looking for a three-candle pattern on a chart, signalling a discrete imbalance in order volume that prompts a quick price adjustment. These gaps reflect moments where the market sentiment strongly leans towards buying or selling yet lacks the opposite orders to maintain price stability.
The indicator sets the gap to the difference from the high of the first bar to the low of the third bar when price is moving up or from the low of the first bar to the high of the third bar when price is moving down.
CME GAPS (BTC only)
CME gaps refer to price discrepancies that can occur in charts for futures contracts traded on the Chicago Mercantile Exchange (CME). These gaps typically arise from the fact that many futures markets, including those on the CME, operate nearly 24 hours a day but may have significant price movements during periods when the market is closed.
CME gaps occur when there is a difference between the closing price of a futures contract on one trading day and the opening price on the following trading day. This difference can create a "gap" on the price chart.
Opening Gaps: These usually happen when the market opens significantly higher or lower than the previous day's close, often influenced by news, economic data releases, or other market events occurring during non-trading hours.
Gaps can result from reactions to major announcements or developments, such as earnings reports, geopolitical events, or changes in economic indicators, leading to rapid price movements.
The importance of CME Gaps in Trading is the potential for Filling Gaps: Many traders believe that prices often "fill" gaps, meaning that prices may return to the gap area to establish fair value.
This can create potential trading opportunities based on the expectation of gap filling. Gaps can act as significant support or resistance levels. Traders monitor these levels to identify potential reversal points in price action.
The way the gap is identified in this indicator is by checking if current open is higher than previous bar close when price is moving up or if current open is lower than previous day close when price is moving down.
EQUILIBRIUM
Equilibrium in finance and trading refers to a state where supply and demand in a market balance each other, resulting in stable prices. It is a key concept in various economic and trading contexts. Here’s a concise description:
Market Equilibrium occurs when the quantity of a good or service supplied equals the quantity demanded at a specific price level. At this point, there is no inherent pressure for the price to change, as buyers and sellers are in agreement.
Equilibrium Price is the price at which the market is in equilibrium. It reflects the point where the supply curve intersects the demand curve on a graph. At the equilibrium price, the market clears, meaning there are no surplus goods or shortages.
In this indicator the equilibrium level is calculated simply by finding the midpoint of the Daily, Weekly, and Montly candles respectively.
NOTES
1) Performance. The algorithms are quite resource intensive and the time it takes the indicator to calculate all the levels could be 5 seconds or more, depending on the number of bars in the chart and especially if Montly Volume Profile levels are selected (POC, VAH or VAL).
2) Levels displayed vs the selected chart timeframe. On a timeframe smaller than the daily TF - both Daily, Weekly, and Monthly levels will be displayed. On a timeframe bigger than the daily TF but smaller than the weekly TF - the Weekly and Monthly levels will be display but not the Daily levels. On a timeframe bigger than the weekly TF but smaller than the monthly TF - only the Monthly levels will be displayed. Not Daily and Weekly.
CREDITS
The core algorithm for calculating the POC levels is based on the indicator "Naked Intrabar POC" developed by rumpypumpydumpy (https:www.tradingview.com/u/rumpypumpydumpy/).
The "Naked intrabar POC" indicator calculates the POC on the current chart timeframe.
This indicator (Multiple Naked Levels) adds two new features:
1) It calculates the POC on three specific timeframes, the Daily, Weekly, and Monthly timeframes - not only the current chart timeframe.
2) It adds functionaly by calculating the VAL and VAH of the volume profile on the Daily, Weekly, Monthly timeframes .

Real-Time Price Comparator→ La version française se trouve plus bas ←
Real-Time Price Spread Comparator
This indicator allows you to compare the real-time price difference (spread) between two assets. It is particularly useful for spotting arbitrage opportunities or price discrepancies between different markets.
💡 Why is this useful?
This tool is especially practical for monitoring the gap between CME futures and the spot market. If the spread becomes too large, we can expect the market to rebalance, which can help anticipate potential price movements.
📌 Features:
✅ Compare two assets of your choice (default: BTC CME vs. BTC OANDA).
✅ Displays the spread as a real-time value on the chart.
✅ Customizable threshold for alerts when the spread exceeds a certain value.
✅ Visual alert: The label changes color and an alert icon appears when the threshold is exceeded.
✅ Adjustable label position to avoid obstructing candlestick wicks.
🛠️ How to Use:
1️⃣ Choose the asset to compare (for example, BTC CME).
2️⃣ Select the main chart (the one you are currently viewing, such as BTC OANDA).
3️⃣ Set the alert threshold (the spread value that will trigger an alert).
4️⃣ Adjust the label position using the offset settings if needed.
5️⃣ When the spread exceeds the threshold, an alert will be displayed!
-------------------------------------------------
Comparateur de Spread en Temps Réel
Cet indicateur permet de comparer en temps réel la différence de prix (spread) entre deux actifs. Il est particulièrement utile pour détecter des opportunités d’arbitrage ou des écarts de prix entre différents marchés.
💡 Pourquoi c'est utile ?
Cet outil est pratique pour surveiller l’écart entre les contrats à terme CME et le marché spot. Si l’écart devient trop important, on peut s’attendre à ce que le marché s’équilibre, ce qui peut nous orienter sur les futurs mouvements du prix.
📌 Fonctionnalités :
✅ Comparez deux actifs de votre choix (par défaut : BTC CME vs. BTC OANDA).
✅ Affiche le spread en temps réel directement sur le graphique.
✅ Définissez un seuil d’alerte pour être notifié visuellement sur le graphique si le spread dépasse une certaine valeur.
✅ Alerte visuelle : le label change de couleur et une icône d’alerte apparaît en cas de dépassement.
✅ Ajustez la position du label pour éviter qu’il ne cache les mèches des bougies.
🛠️ Comment l’utiliser :
1️⃣ Choisissez l’actif à comparer (exemple : BTC CME).
2️⃣ Sélectionnez ensuite l’actif affiché sur votre graphique principal (exemple : BTC OANDA).
3️⃣ Définissez le seuil d’alerte (valeur du spread qui déclenchera une alerte).
4️⃣ Ajustez la position du label grâce aux options d’offset si nécessaire.
5️⃣ Si le spread dépasse le seuil, une alerte visuelle apparaîtra !

Session-Conditioned Regime ATRWhy this exists
Classic ATR is great—until the open. The first few bars often inherit overnight gaps and 24-hour noise that have nothing to do with the intraday regime you actually trade. That inflates early ATR, scrambles thresholds, and invites hyper-recency bias (“today is crazy!”) when it’s just the open being the open.
This tool was built to:
Separate session reality from 24h noise. Measure volatility only inside your defined session (e.g., NYSE 09:30–16:00 ET).
Judge candles against the current regime, not the last 2–3 bars. A rolling statistic from the last N completed sessions defines what “typical” means right now.
Label “large” and “small” objectively. Bars are colored only when True Range meaningfully departs from the session regime—no gut feel, no open-bar distortion (gap inclusion optional).
Overview
Purpose: objectively identify unusually big or small candles within the active trading session, compared to the recent session regime.
Use cases: volatility filters, entry/exit confirmation, session bias detection, adaptive sizing.
This indicator replaces generic ATR with a session-conditioned, regime-aware measure. It colors candles only when their True Range (TR) is abnormally large/small versus the last N completed sessions of the same session window.
How it works
Session gating: Only bars inside the selected session are evaluated (presets for NYSE, CME RTH, FX NY; custom supported).
Per-bar TR: TR = max(high, prevRef) − min(low, prevRef).
prevRef is the prior close for in-session bars.
First bar of the session can include the overnight gap (optional; default off).
Regime statistic: For any bar in session k, aggregate all in-session TRs from the previous N completed sessions (k−N … k−1), then compute Median (default) or Mean.
Today’s anchor: Running statistic from today’s session start → current bar (for context and the on-chart ratio).
Color logic:
Big if TR ≥ bigMult × RegimeStat
Small if TR ≤ smallMult × RegimeStat
Colored states: big bull, big bear, small bull, small bear.
Non-triggering bars retain the chart’s native colors.
Panel (top-right by default)
Regime ATR (Nd): session-conditioned statistic over the past N completed sessions.
Today ATR (anchored): running statistic for the current session.
Ratio (Today/Regime): intraday volatility vs regime.
Sample size n: number of bars used in the regime calculation.
Inputs
Session Preset: NYSE (09:30–16:00 ET), CME RTH (08:30–15:00 CT), FX NY (08:00–17:00 ET), Custom (session + IANA timezone).
Regime Window: number of completed sessions (default 5).
Statistic: Median (robust) or Mean.
Include Open Gap: include overnight gap in the first in-session bar’s TR (default off).
Big/Small thresholds: multipliers relative to RegimeStat (defaults: Big=1.5×, Small=0.67×).
Colors: four independent colors for big/small × bull/bear.
Panel position & text size.
Hidden outputs: expose RegimeStat, TodayStat, Ratio, and Z-score to other scripts.
Alerts
RegimeATR: BIG bar — triggers when a bar meets the “Big” condition.
RegimeATR: SMALL bar — triggers when a bar meets the “Small” condition.
Hidden outputs (for strategies/screeners)
RegimeATR_stat, TodayATR_stat, Today_vs_Regime_Ratio, BarTR_Zscore.
Notes & limitations
No look-ahead: calculations only use information available up to that bar. Historical colors reflect what would have been known then.
Warm-up: colors begin once there are at least N completed sessions; before that, regime is undefined by design.
Changing inputs (session window, multipliers, median/mean, gap toggle) recomputes the full series using the same rolling regime logic per bar.
Designed for standard candles. Styling respects existing chart colors when no condition triggers.
Practical tips
For a broader or tighter notion of “unusual,” adjust Big/Small multipliers.
Prefer Median in markets prone to outliers; use Mean if you want Z-score alignment with the panel’s regime mean/std.
Use the Ratio readout to spot compression/expansion days quickly (e.g., <0.7× = compressed session, >1.3× = expanded).
Roadmap
More session presets:
24h continuous (crypto, index CFDs).
23h/Globex futures (CME ETH with a 60-minute maintenance break).
Regional equities (LSE, Xetra, TSE), Asia/Europe/NY overlaps for FX.
Half-day/holiday templates and dynamic calendars.
Multi-regime comparison: track multiple overlapping regimes (e.g., RTH vs ETH for futures) and show separate stats/ratios.
Robust stats options: trimmed mean, MAD/Huber alternatives; optional percentile thresholds instead of fixed multipliers.
Subpanel visuals: rolling TodayATR and Ratio plots; optional Z-score ribbon.
Screener/strategy hooks: export boolean series for BIG/SMALL, plus a lightweight strategy template for backtesting entries/exits conditioned on regime volatility.
Performance/QOL: per-symbol presets, smarter warm-up, and finer control over sample caps for ultra-low TF charts.
Changelog
v0.9b (Beta)
Session presets (NYSE/CME RTH/FX NY/Custom) with timezone handling.
Panel enhancements: ratio + sample size n.
Four-state bar coloring (big/small × bull/bear).
Alerts for BIG/SMALL bars.
Hidden Z-score stream for downstream use.
Gap-in-TR toggle for the first in-session bar.
Disclaimer
For educational purposes only. Not investment advice. Validate thresholds and session settings across symbols/timeframes before live use.

Sentinel Nexus Dashboard [AGP] Ver.1.5Sentinel Nexus Dashboard is a versatile Pine Script designed as a comprehensive technical analysis tool. It condenses a variety of key indicators and metrics into a single, intuitive visual dashboard, providing an integrated view of market trends, momentum, volatility, and liquidity, all neatly organized on your TradingView chart.
Key Features and Benefits
All-in-One Dashboard: This script centralizes relevant information, offering a clean, efficient control panel that helps you make quick decisions without cluttering your chart with multiple overlays.
Trend Analysis with ADX: It incorporates the Average Directional Index (ADX) to measure trend strength. The dashboard displays ADX, DI+, and DI- values with dynamic color-coding to highlight trend intensity (e.g., blue for a very strong trend).
Momentum Analysis with MACD: The dashboard shows MACD line and signal line values in a table. The background color of the MACD values reflects the histogram's direction, allowing you to quickly identify crosses and shifts in market momentum.
Multi-Timeframe RSI Analysis: The RSI (Relative Strength Index) dashboard displays values across multiple timeframes (from 1 minute to 1 month). Overbought (77) and oversold (23) levels are color-coded for immediate identification of market conditions, making it an ideal tool for multi-timeframe analysis.
Smart and Dynamic Volume: The script uses a bar coloring algorithm based on average volume. Chart bars change color according to volume magnitude (extreme, high, average, or low) relative to the average, distinguishing between bullish and bearish bars. This helps you identify significant, liquidity-driven price movements.
Fair Value Analysis: The script calculates an asset's "fair value" using a noise filter (similar to a Kalman filter) on recent highs and lows to determine a midpoint. The price dashboard's background color changes to indicate if the current price is above or below this fair value.
Fibonacci EMA Analysis: A table displays several Exponential Moving Averages (EMAs) based on the Fibonacci sequence. The values are color-coded to show whether the current price is above (white) or below (orange) each EMA, helping you quickly identify dynamic support and resistance levels.
CME Futures Data Integration: For Bitcoin, the script can show a chart label with the Bitcoin futures price (CME:BTC1!), allowing you to compare the spot price with the CME futures market.
Potential Uses and Applications
The Sentinel Nexus Dashboard is an excellent support tool for trading. It is not a signal system but rather a suite of confirmation tools that can be used to:
Confirm Trend Strength: Before entering a trade, use the ADX data to ensure the trend has enough strength for your expected move.
Detect Reversal Points: Multi-timeframe RSI data can alert you to potential overbought or oversold conditions, indicating possible exhaustion of a price move.
Validate Price Movements: Bar coloring based on volume helps you determine if a price move is genuine and supported by strong market participation. High volume can confirm a breakout or reversal.
Identify Support and Resistance: The Fibonacci EMAs allow you to quickly visualize key levels where price might find support or resistance, aiding in planning entries and exits.
In short, this script is perfect for traders who want a comprehensive market overview without chart clutter. It efficiently integrates trend, momentum, and volume analysis in one place.
Legal Disclaimer
RISK WARNING:
This Pine Script is a technical analysis tool and should not be considered financial advice. Past performance of any indicator is no guarantee of future results. Trading in financial markets involves a high risk of loss and is not suitable for all investors. By using this indicator, you accept full responsibility for your trading decisions and acknowledge that any financial loss is your sole responsibility.
IMPORTANT:
Some script functions, such as the CME price label, may not work correctly if your TradingView subscription plan is not a paid one. Please check your plan's limitations to ensure the indicator's optimal functionality.

Fed Rate ProbabilityFed Rate Probability – Simple & Clean v2.0
Real-time composite score (0–100) for the next Fed move: Rate Cut, Hike or Hold
Overview
A clean, all-in-one indicator that combines the most reliable market signals into two easy-to-read lines:
• Red line → Probability of RATE CUT
• Blue line → Probability of RATE HIKE
• Hold score = 100 – max(cut, hike)
The dominant signal (CUT / HOLD / HIKE) is highlighted in the information table.
Key Features
Automatic daily data from FRED (DFF, 3M/1M/2Y/10Y yields)
Smart fallback to TradingView native symbols (US01MY, US03MY, US02Y, US10Y) when FRED is unavailable
Manual CME FedWatch probability override (perfect for weekends/holidays)
Historical Fed rate cut/hike markers with background shading and labels
Colored probability zones + customizable threshold lines
Threshold-crossing labels and full alert suite
Special alert on 2Y-10Y yield curve un-inversion (strong historical precursor to rate cuts)
Detailed summary table with current spreads, scores and dominant signal
Fully customizable: enable/disable each component, adjust weights indirectly via toggles, change smoothing, thresholds, colors, etc.
Score Composition (0–100 points)
T-bills vs Fed Funds spread – max 50 pts (with persistence & 1M confirmation bonus)
2-Year Treasury vs Fed Funds spread – max 30 pts (or direct CME probability input)
2Y-10Y yield curve behavior – max 20 pts (inversion depth + large bonus on steepening after un-inversion)
Interpretation
0–40 → Low probability
40–60 → Moderate
60–75 → High
75–100 → Very High / Almost certain
Why this indicator?
Instead of checking FRED, CME FedWatch, yield curves and T-bill spreads separately, get everything in one pane with a clear, smoothed composite score and instant alerts when the market starts pricing a Fed move aggressively.
Disclaimer
This is a decision-support tool based on historical relationships and current market pricing. It is not financial advice and past performance is no guarantee of future results.
Enjoy and trade safe! 🚀
