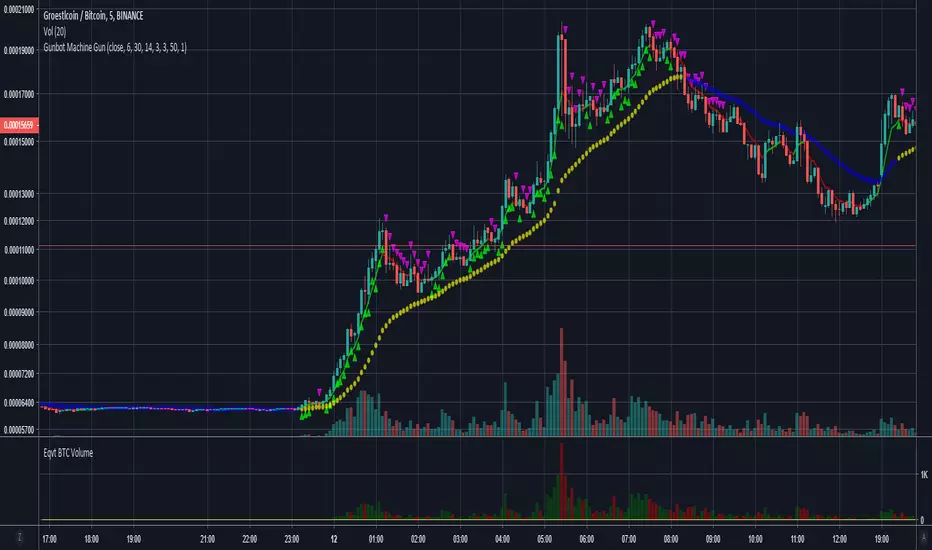
Gunbot Machine Gun (trial version)Hello fellow Gunbotters, you have requested and I have delivered. Here is the trial version for Gunbot Machine Gun strategy.
Note:
1. This is the trial version so the customization settings are locked, subscribe to unlock features.
2. Green triangles = buy signals, Red triangles = sell signals.
3. Both buy and sell alerts are set-up so you can create alerts easily.
This is how the Gunbot Machine Gun works: I have 200 slots for alerts in Tradingview. I use all of those slots to set buy and sell alerts on BTC pairs. I have volatility filter in my script so the Machine Gun will only start firing out rounds (Buy alerts) when the volatility becomes high. Tradingview sends email to gmail. Gunbot waits for the email, once it reads it Gunbot will action the email (buy/sell depending on the message). Gunbot buys the coin based on email message received from Tradingview. It will be rapid fire, accumulating buys while coin is pumping up. Then when the dust settles and momentum starts dying, the script will throw a hand grenade (pink triangles), send a sell signal/email then Gunbot reads that email and executes the sell all trade.
Buys early during pumps. Finds coins that will pump soon. Sells at peak.
Legend:
Green triangles = buy signals
Pink triangles = sell signals
Note:
During period of low volatility there will rarely be any buy signals. The sell signals during this time is irrelevant (can only sell after you bought). But once high volatility is detected the script gets ready to activate. Then it starts sending buy signals close and during the pumps. Sells at peak.
Works on most coins and stocks.
스크립트에서 "Buy sell"에 대해 찾기

Gunbot Machine GunGunbot Machine Gun Strategy
This is how the Gunbot Machine Gun works: I have 200 slots for alerts in Tradingview. I use all of those slots to set buy and sell alerts on BTC pairs. I have volatility filter in my script so the Machine Gun will only start firing out rounds (Buy alerts) when the volatility becomes high. Tradingview sends email to gmail. Gunbot waits for the email, once it reads it Gunbot will action the email (buy/sell depending on the message). Gunbot buys the coin based on email message received from Tradingview. It will be rapid fire, accumulating buys while coin is pumping up. Then when the dust settles and momentum starts dying, the script will throw a hand grenade (pink triangles), send a sell signal/email then Gunbot reads that email and executes the sell all trade.
Buys early during pumps. Finds coins that will pump soon. Sells at peak.
Legend:
Green triangles = buy signals
Pink triangles = sell signals
Note:
During period of low volatility there will rarely be any buy signals. The sell signals during this time is irrelevant (can only sell after you bought). But once high volatility is detected the script gets ready to activate. Then it starts sending buy signals close and during the pumps. Sells at peak.
Works on most coins and stocks.
Color CandlesUses 6 most common indicators to color candles when they give buy/sell signals.
Use line view to see candle colors.
Purple = 6 buy signals
Teal = 5 buy signals
Navy = 4 buy signals
Lime = 3 buy signals
Green = 2 buy signals
Pale Green = 1 Buy signal
White = neutral
Gray = 1 sell signal
Yellow = 2 sell signals
Orange = 3 sell signals
Red = 4 sell signals
Firebrick = 5 sell signals
Black = 6 sell signals
Parabolic SAR calculated as .02, .02, .2. Traditional Buy/Sell. Green/Red Dots.
Bollinger Band calculated as 20, 1. Buy/Sell when above or below band. Aqua filled band.
MACD calculated with emas 12, 26, 9. Traditional MACD/Signal cross Buy/Sell. Filled Blue/Orange band.
RSI length 14. Traditional Buy/Sell below 30 and above 70. Green/Yellow/Red line below price.
ADX/DI len 14. Traditional crossover Buy/Sell. Filled Lime/Green above price.
Stochastic 14/3/3. Traditional 20/80 Buy/Sell. Filled teal/orange above price.

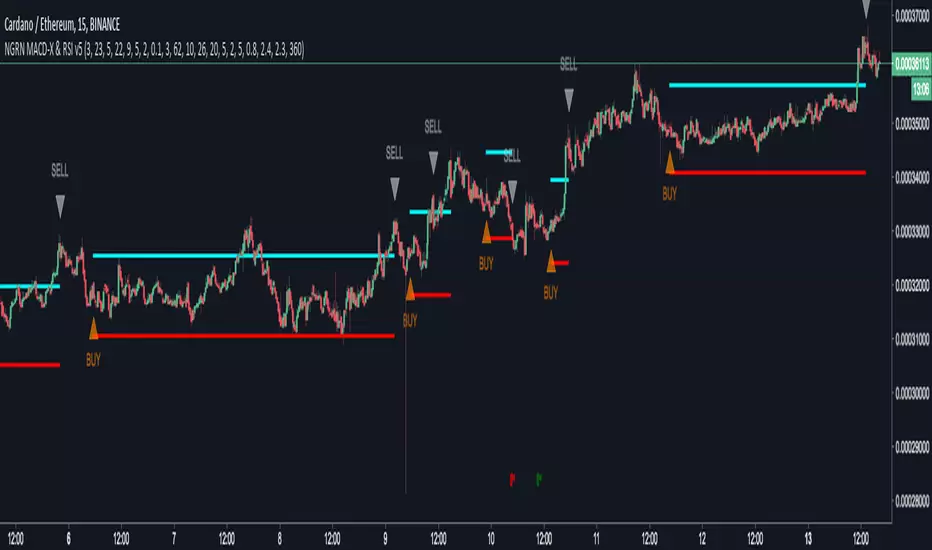
NGRN MACD-X & RSI v5MACD-X, RSI & Volume Indicator & Alerts Study - Version 5
Overview
This study and it's associated strategy were modeled after the famous Philakone described algorithms on his now defunct instructional video series.
This indicator allows for full customisation of parameters and interaction between three indicators that allow users to shape their trading methods to their desired goals.
This associated strategy also allows users to backtest the study alerts script and find the best settings towards that end.
MACD + RSI + VOLUME - are of the most powerful and widely usded indicators, MACD/Histogram crosses, coupled with RSI & Volume increases/decreases will detects areas of deeply oversold / overbought and buys/sells on the reversal
Features
Full customisation - All parameters are open for customising to allow the trader to build their own strategy and adapt from market to market.
Clean/Simple UI - Facilitating ease of use.
Enable Buying OR Selling, - or have them both active at the same time.
Toggle off and on ALTERNATING Buy and Sell feature (pyramiding) - to allow for consecutive DCA style buys or SCALING out of an entry (partial sell).
Customizable Stop-Loss plot - to enable users to create a STOP-LOSS alert option or other alert(s) based on the plot location. See settings screenshot.
Toggle Auto Stop-Loss sell option - to enable users choose whether or not to automatically issue a sell signal when close crosses stop loss plot, or choose to toggle off if not profitable.
Customizable Take-Profit plot - to enable users to create a TAKE-PROFIT alert option or other alert(s) based on the plot location.
Study and associated Strategy - to use the TradingView ‘Strategy Tester’ back-testing features to find the best alert settings for specific coins in bear, bull and sideways markets.
Changes Version 5
Added STOP-LOSS time-out period where users may specify a duration of trading pause time after a stop-loss has been triggered. A value of zero disables the feature. Time out start is indicated by a red flag icon and resumption is indicated with a green flag.
Settings
SCREENSHOT LINKS:
BUY SETTINGS: prntscr.com
SELL SETTINGS: prntscr.com
Access
For a 4 DAYS TRAIL, sign up as an Explorer subscriber @ Patreon page: www.patreon.com
Full Access is 0.25 ETH , one time fee for LIFETIME access to the STUDY indicator, STRATEGY and future updates as well as support and SETTINGS for various markets on the Binance Exchange.
NGRN MACD-X & RSI v4MACD-X, RSI & Volume Indicator & Alerts Study - Version 4
Overview
This study and it's associated strategy were modeled after the famous Philakone described algorithms on his now defunct instructional video series.
This indicator allows for full customisation of parameters and interaction between three indicators that allow users to shape their trading methods to their desired goals.
This associated strategy also allows users to backtest the study alerts script and find the best settings towards that end.
MACD + RSI + VOLUME - are of the most powerful and widely usded indicators, MACD/Histogram crosses, coupled with RSI & Volume increases/decreases will detects areas of deeply oversold / overbought and buys/sells on the reversal
Features
Full customisation - All parameters are open for customising to allow the trader to build their own strategy and adapt from market to market.
Clean/Simple UI - Facilitating ease of use.
Enable Buying OR Selling, - or have them both active at the same time.
Toggle off and on ALTERNATING Buy and Sell feature (pyramiding) - to allow for consecutive DCA style buys or SCALING out of an entry (partial sell).
Customizable Stop-Loss plot - to enable users to create a STOP-LOSS alert option or other alert(s) based on the plot location. See settings screenshot.
Toggle Auto Stop-Loss sell option - to enable users choose whether or not to automatically issue a sell signal when close crosses stop loss plot, or choose to toggle off if not profitable.
Customizable Take-Profit plot - to enable users to create a TAKE-PROFIT alert option or other alert(s) based on the plot location.
Study and associated Strategy - to use the TradingView ‘Strategy Tester’ back-testing features to find the best alert settings for specific coins in bear, bull and sideways markets.
Changes Version 4
Improved STOP-LOSS plot draw (red line).
Added the option to automatically sell when stop-loss cross triggered or have the option disabled, in the event a better profit can be achieved.
Added new TAKE-PROFIT plot (aqua line) to visually guide users where to place the TAKE-PROFIT parameter as well as give users options to create alerts based on the TAKE-PROFIT plot.
Access
Full Access is 0.1 ETH , one time fee for LIFETIME access to the STUDY indicator, STRATEGY and future updates as well as support and SETTINGS for various markets on the Binance Exchange.
Settings
SCREENSHOT LINKS:
BUY SETTINGS: prntscr.com
SELL SETTINGS: prntscr.com

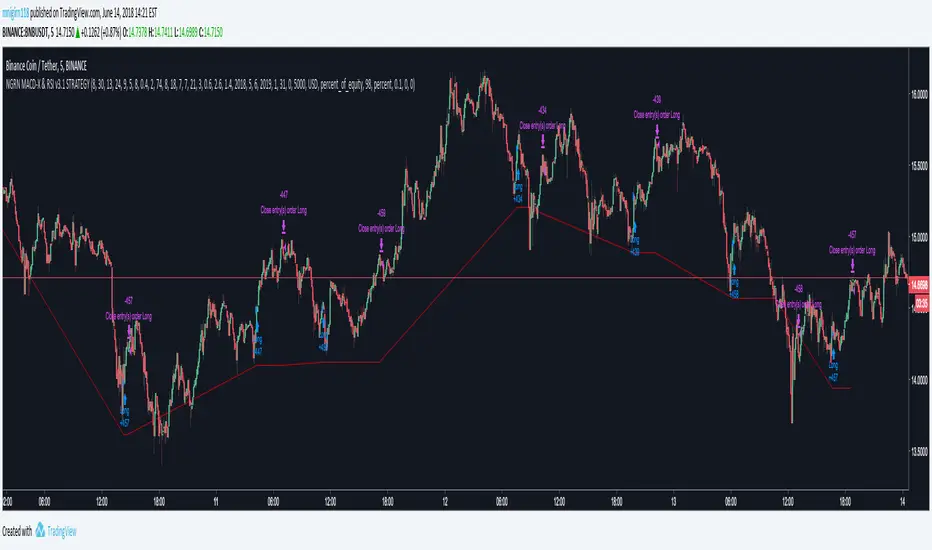
NGRN MACD-X & RSI v4 STRATEGYMACD-X, RSI & Volume Indicator Strategy - Version 4
Overview
This strategy and it's associated study were modeled after the famous Philakone described algorithms on his now defunct instructional video series.
This indicator allows for full customisation of parameters and interaction between three indicators that allow users to shape their trading methods to their desired goals. This associated strategy also allows users to backtest the study alerts script and find the best settings towards that end.
MACD + RSI + VOLUME - are of the most powerful and widely usded indicators, MACD/Histogram crosses, coupled with RSI & Volume increases/decreases will detects areas of deeply oversold / overbought and buys/sells on the reversal
Features
Full customisation - All parameters are open for customising to allow the trader to build their own strategy and adapt from market to market.
Clean/Simple UI - Facilitating ease of use.
Enable Buying OR Selling, - or have them both active at the same time.
Toggle off and on ALTERNATING Buy and Sell feature (pyramiding) - to allow for consecutive DCA style buys or SCALING out of an entry (partial sell).
Customizable Stop-Loss plot - to enable users to create a STOP-LOSS alert option or other alert(s) based on the plot location.
Toggle Auto Stop-Loss sell option - to enable users choose whether or not to automatically issue a sell signal when close crosses stop loss plot, or choose to toggle off if not profitable.
Customizable Take-Profit plot - to enable users to create a TAKE-PROFIT alert option or other alert(s) based on the plot location.
Study and associated Strategy - to use the TradingView ‘Strategy Tester’ back-testing features to find the best alert settings for specific coins in bear, bull and sideways markets.
Changes Version 4
Improved STOP-LOSS plot draw.
Added the option to automatically sell when stop-loss cross triggered or have the option disabled, in the event a better profit can be achieved.
Added new TAKE-PROFIT plot (aqua line) to visually guide users where to place the TAKE-PROFIT parameter as well as give users options to create alerts based on the TAKE-PROFIT plot.
Access
Full Access is 0.1 ETH , one time fee for LIFETIME access to the STUDY indicator, STRATEGY and future updates as well as support and SETTINGS for various markets on the Binance Exchange.
Settings
SCREENSHOT LINKS:
BUY SETTINGS: prntscr.com
SELL SETTINGS: prntscr.com

CryptogramTR with OPEN CODEIndicator is obtained by importing RSI(14) into HULL moving average source with 2 different periods, as one is long period and the other is short.
When green line (short period) cross upward the red line (long period) , this is a BUY; vice versa it is a SELL.
When HMA Short Period is set to 1 (one), yielding line is absolutely the same line of RSI (14). You can change it into 8(eight) preferably.
İndikatör, RSI(14) indikatörünün, hull hareketli ortalamasının kod kaynağı olarak atanması ile elde edilmiştir. Uzun ve kısa olmak üzere 2 ayrı periyot kullanılmıştır.
Yeşil çizgi yani kısa periyotlu çizgi, kırmızı yani uzun periyotlu olanı yukarı keserse AL, tersi durum SAT olarak düşünülmelidir.
Hull Kısa Periyodu 1 iken oluşan yeşil çizgi, RSI(14) indikatörünü vermektedir. Kısa periyot olarak tercihinize göre bu değeri 8 olarak da kullanabilirsiniz.

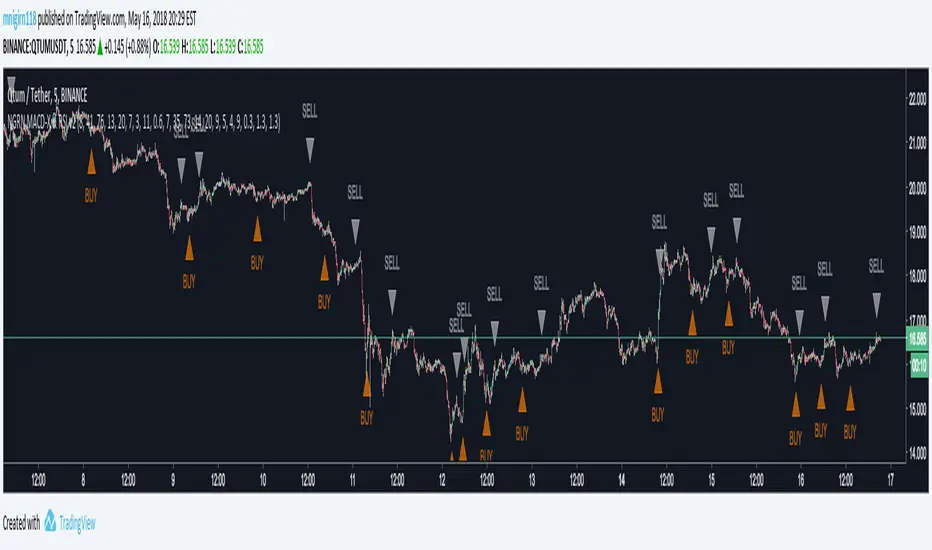
NGRN MACD-X & RSI v3.1 MACD-X, RSI & Volume Indicator & Alerts Study - Version 3.1
Overview
This study and it's associated strategy were modeled after the famous Philakone described algorithms on his now defunct instructional video series.
This indicator allows for full customisation of parameters and interaction between three indicators that allow users to shape their trading methods to their desired goals.
This associated strategy also allows users to backtest the study alerts script and find the best settings towards that end.
MACD + RSI + VOLUME - are of the most powerful and widely usded indicators, MACD/Histogram crosses, coupled with RSI & Volume increases/decreases will detects areas of deeply oversold / overbought and buys/sells on the reversal
Features
Full customisation - All parameters are open for customising to allow the trader to build their own strategy and adapt from market to market.
Clean/Simple UI - Facilitating ease of use.
Enable Buying or Selling, - or have them both active at the same time.
Toggle off and on ALTERNATING Buy and Sell feature (pyramiding) - to allow for consecutive DOLLAR COST AVERAGING style buys or SCALING out of an entry (partial sell).
Customizable Stop-Loss plot - to enable users to create a STOP-LOSS alert option or other alert(s) based on the plot location. See settings screenshot.
Study and associated Strategy - to use the TradingView ‘Strategy Tester’ back-testing features to find the best alert settings for specific coins in bear, bull and sideways markets.
Ideal for use with the Autoview trading bot
Changes Version 3.1
UI consolidates reduntant script inputs making the script easier to use.
Fixes STOP-LOSS algorithm.
Adds a STOP-LOSS Plot (red line) to enable users to create a STOP-LOSS alert option or other alert(s) based on the plot location. See settings screenshot.
Access
Full Access is 0.1 ETH , one time fee for LIFETIME access to the STUDY indicator, STRATEGY and future updates as well as support and SETTINGS for various markets on the Binance Exchange.
Settings
BUY SETTINGS: prntscr.com
SELL SETTINGS: prntscr.com
STOP-LOSS SETTINGS: prntscr.com

NGRN MACD-X & RSI v3.1 STRATEGYMACD-X, RSI & Volume Indicator Strategy - Version 3.1
Overview
This strategy and it's associated study were modeled after the famous Philakone described algorithms on his now defunct instructional video series.
This indicator allows for full customisation of parameters and interaction between three indicators that allow users to shape their trading methods to their desired goals. This associated strategy also allows users to backtest the study alerts script and find the best settings towards that end.
MACD + RSI + VOLUME - are of the most powerful and widely usded indicators, MACD/Histogram crosses, coupled with RSI & Volume increases/decreases will detects areas of deeply oversold / overbought and buys/sells on the reversal
Features
Full customisation - All parameters are open for customising to allow the trader to build their own strategy and adapt from market to market.
Clean/Simple UI - Facilitating ease of use.
Enable Buying or Selling, - or have them both active at the same time.
Toggle off and on ALTERNATING Buy and Sell feature (pyramiding) - to allow for consecutive dollar cost averaging style buys or SCALING out of an entry (partial sell).
Customizable Stop-Loss plot - to enable users to create a STOP-LOSS alert option or other alert(s) based on the plot location. See settings screenshot.
Study and associated Strategy - to use the TradingView ‘Strategy Tester’ back-testing features to find the best alert settings for specific coins in bear, bull and sideways markets.
Changes Version 3.1
UI consolidates reduntant script inputs making the script easier to use.
Fixes STOP-LOSS algorithm.
Adds a STOP-LOSS Plot (red line) to enable users to create a STOP-LOSS alert option or other alert(s) based on the plot location. See settings screenshot.
Access
Full Access is 0.1 ETH , one time fee for LIFETIME access to the STUDY indicator, STRATEGY and future updates as well as support and SETTINGS for various markets on the Binance Exchange.
Settings
BUY SETTINGS: prntscr.com
SELL SETTINGS: prntscr.com
STOP-LOSS SETTINGS : prntscr.com
NGRN MACD-X & RSI v2 StudyMACD-X, RSI & Volume Indicator Study - Version 2.0
Overview
This study and it's associated strategy were modeled after the famous Philakone described algorithms on his now defunct instructional video series.
This indicator allows for full customisation of parameters and interaction between three indicators that allow users to shape their trading methods to their desired goals.
This associated strategy also allows users to backtest the study alerts script and find the best settings towards that end.
MACD + RSI + VOLUME - are of the most powerful and widely usded indicators, MACD/Histogram crosses, coupled with RSI & Volume increases/decreases will detects areas of deeply oversold / overbought and buys/sells on the reversal
Features
Full customisation - All parameters are open for customising to allow the trader to build their own strategy and adapt from market to market.
Toggle Buying and Selling, or have them both active at the same time.
Toggle off and on ALTERNATING Buy and Sell feature to allow for consecutive DCA style buys or SCALING out of an entry (partial sell).
Access
Full Access is 0.07 ETH, one time fee for full unlimited access to the indicator, strategy and future updates as well as support and SETTINGS for various markets on the Binance Exchange (currently only USDT)
NGRN MACD-X & RSI v2 STRATEGYMACD-X, RSI & Volume Indicator Strategy - Version 2.0
Overview
This strategy and it's associated study were modeled after the famous Philakone described algorithms on his now defunct instructional video series.
This indicator allows for full customisation of parameters and interaction between three indicators that allow users to shape their trading methods to their desired goals.
This associated strategy also allows users to backtest the study alerts script and find the best settings towards that end.
MACD + RSI + VOLUME - are of the most powerful and widely usded indicators, MACD/Histogram crosses, coupled with RSI & Volume increases/decreases will detects areas of deeply oversold / overbought and buys/sells on the reversal
Features
Full customisation - All parameters are open for customising to allow the trader to build their own strategy and adapt from market to market.
Toggle Buying and Selling, or have them both active at the same time.
Toggle off and on ALTERNATING Buy and Sell feature to allow for consecutive DCA style buys or SCALING out of an entry (partial sell).
Access
Full Access is 0.07 ETH, one time fee for full unlimited access to the indicator, strategy and future updates as well as support and SETTINGS for various markets on the Binance Exchange (currently only USDT)

XPloRR MA-Trailing-Stop StrategyXPloRR MA-Trailing-Stop Strategy
Long term MA-Trailing-Stop strategy with Adjustable Signal Strength to beat Buy&Hold strategy
None of the strategies that I tested can beat the long term Buy&Hold strategy. That's the reason why I wrote this strategy.
Purpose: beat Buy&Hold strategy with around 10 trades. 100% capitalize sold trade into new trade.
My buy strategy is triggered by the fast buy EMA (blue) crossing over the slow buy SMA curve (orange) and the fast buy EMA has a certain up strength.
My sell strategy is triggered by either one of these conditions:
the EMA(6) of the close value is crossing under the trailing stop value (green) or
the fast sell EMA (navy) is crossing under the slow sell SMA curve (red) and the fast sell EMA has a certain down strength.
The trailing stop value (green) is set to a multiple of the ATR(15) value.
ATR(15) is the SMA(15) value of the difference between the high and low values.
The scripts shows a lot of graphical information:
The close value is shown in light-green. When the close value is lower then the buy value, the close value is shown in light-red. This way it is possible to evaluate the virtual losses during the trade.
the trailing stop value is shown in dark-green. When the sell value is lower then the buy value, the last color of the trade will be red (best viewed when zoomed)(in the example, there are 2 trades that end in gain and 2 in loss (red line at end))
the EMA and SMA values for both buy and sell signals are shown as a line
the buy and sell(close) signals are labeled in blue
How to use this strategy?
Every stock has it's own "DNA", so first thing to do is tune the right parameters to get the best strategy values voor EMA , SMA, Strength for both buy and sell and the Trailing Stop (#ATR).
Look in the strategy tester overview to optimize the values Percent Profitable and Net Profit (using the strategy settings icon, you can increase/decrease the parameters)
Then keep using these parameters for future buy/sell signals only for that particular stock.
Do the same for other stocks.
Important : optimizing these parameters is no guarantee for future winning trades!
Here are the parameters:
Fast EMA Buy: buy trigger when Fast EMA Buy crosses over the Slow SMA Buy value (use values between 10-20)
Slow SMA Buy: buy trigger when Fast EMA Buy crosses over the Slow SMA Buy value (use values between 30-100)
Minimum Buy Strength: minimum upward trend value of the Fast SMA Buy value (directional coefficient)(use values between 0-120)
Fast EMA Sell: sell trigger when Fast EMA Sell crosses under the Slow SMA Sell value (use values between 10-20)
Slow SMA Sell: sell trigger when Fast EMA Sell crosses under the Slow SMA Sell value (use values between 30-100)
Minimum Sell Strength: minimum downward trend value of the Fast SMA Sell value (directional coefficient)(use values between 0-120)
Trailing Stop (#ATR): the trailing stop value as a multiple of the ATR(15) value (use values between 2-20)
Example parameters for different stocks (Start capital: 1000, Order=100% of equity, Period 1/1/2005 to now) compared to the Buy&Hold Strategy(=do nothing):
BEKB(Bekaert): EMA-Buy=12, SMA-Buy=44, Strength-Buy=65, EMA-Sell=12, SMA-Sell=55, Strength-Sell=120, Stop#ATR=20
NetProfit: 996%, #Trades: 6, %Profitable: 83%, Buy&HoldProfit: 78%
BAR(Barco): EMA-Buy=16, SMA-Buy=80, Strength-Buy=44, EMA-Sell=12, SMA-Sell=45, Strength-Sell=82, Stop#ATR=9
NetProfit: 385%, #Trades: 7, %Profitable: 71%, Buy&HoldProfit: 55%
AAPL(Apple): EMA-Buy=12, SMA-Buy=45, Strength-Buy=40, EMA-Sell=19, SMA-Sell=45, Strength-Sell=106, Stop#ATR=8
NetProfit: 6900%, #Trades: 7, %Profitable: 71%, Buy&HoldProfit: 2938%
TNET(Telenet): EMA-Buy=12, SMA-Buy=45, Strength-Buy=27, EMA-Sell=19, SMA-Sell=45, Strength-Sell=70, Stop#ATR=14
NetProfit: 129%, #Trade

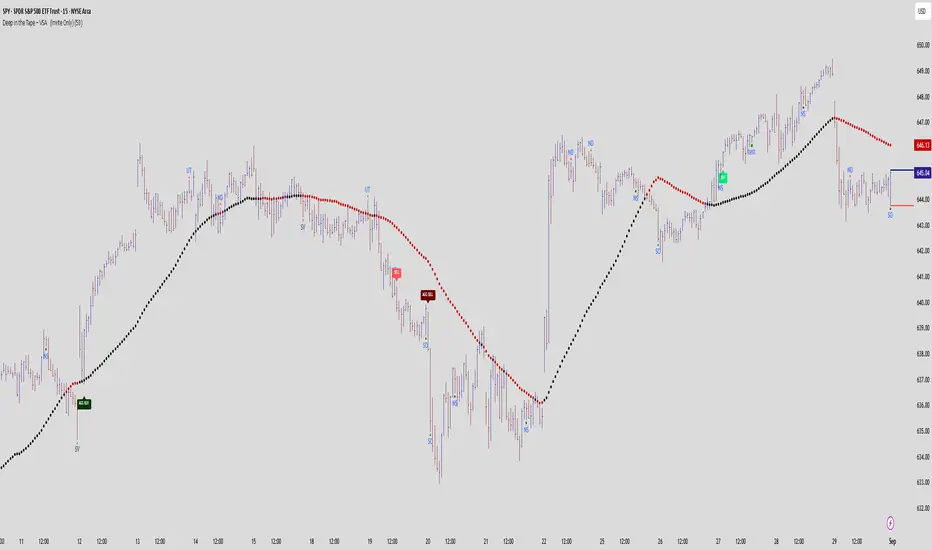
Deep in the Tape – VSA (Invite Only)Deep in the Tape – VSA (Invite-Only)
Quick Start
This invite-only indicator is built on Tom Williams’ Volume Spread Analysis (VSA). It highlights professional activity through classical VSA events and adds labels for confirmations, aggressive signals, and failures. The goal is to help traders study background strength/weakness, follow-through, and traps directly on the chart.
What It Shows
VSA Events: Stopping Volume, Selling Climax, Shakeout, Buying Climax, Upthrust, Supply Coming In, No Demand, No Supply, Confirmed Test Bars, End of Rising Market.
Labels:
BUY / SELL – show when classical confirmations appear (e.g., Test/NS after strength, ND after weakness).
AGG BUY / AGG SELL – highlight aggressive early entries when supply/demand is quickly absorbed or confirmed.
FAIL / TEST FAIL – show failed VSA setups where effort is not confirmed, helping traders recognize traps.
Context Tools:
High/low lines from ultra-high-volume trigger bars projected forward.
Optional high-volume cluster zones to mark potential accumulation/distribution.
Optional moving average for background context (not a signal generator).
How to Use It :
Read the Background
Look for ultra-high-volume events that mark professional activity: SC, SV, SO for strength; UT, BC, Supply Coming In for weakness.
Watch for the Response
After strength → look for Tests or No Supply to confirm demand, often labeled as BUY.
After weakness → watch for No Demand or UT follow-through, labeled as SELL.
Best Practice with Context
Bullish setups are best taken above the trigger levels and above the MA, showing demand in control.
Bearish setups are best taken below the trigger levels and below the MA, confirming supply pressure.
Study Failures and Aggressive Signals
Aggressive labels show when the market reacts quickly, confirming activity before a classical test.
Failure labels show when expected follow-through breaks down, revealing traps or absorption. These are highly educational in tape-reading.
Alerts: Ready-to-use alert conditions for all confirmations, aggressive signals, and failures, allowing real-time notifications.
Customization:
Users can toggle individual signals (e.g., Stopping Volume, No Demand, Tests, Aggressive Entries, Failure labels) on or off, tailoring the display to their preferred VSA study style.
Use Projected Levels & Clusters
Trigger levels and cluster zones provide natural S/R where professional money often reappears. Watching price response around these zones is key.
Why It’s Original
This script is not a mashup of indicators. Every condition is coded around VSA principles—spread, volume, wick proportions, close location, and context. Labels are mapped directly to Tom Williams’ methodology of background + test + confirmation. Clusters and projected levels extend the same VSA logic to make professional activity visible in real time.
Disclaimer
This script is for educational purposes only and does not constitute financial advice. Trading and investing involve risk. Always do your own analysis and risk management.
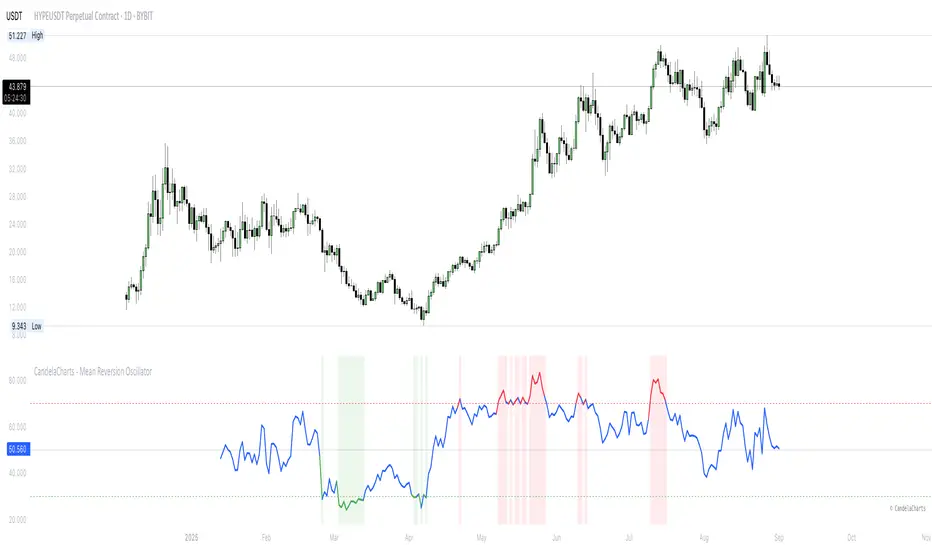
CandelaCharts - Mean Reversion Oscillator 📝 Overview
The Mean Reversion Oscillator (MRO) is a bounded 0–100 indicator that shows how far the price has deviated from its statistical mean. Normalizing deviations into a consistent scale helps traders spot overbought/oversold conditions, potential mean reversion setups, and momentum shifts around a moving average.
📦 Features
Bounded scale (0–100) for easy recognition of stretched conditions.
Customizable MA & StdDev periods for different trading horizons.
Dynamic coloring: Red = Overbought, Green = Oversold, Blue = Neutral
Visual aids: Background shading in OB/OS zones + 50 midline.
⚙️ Settings
MA Length – Period for the moving average baseline.
StdDev Length – Standard deviation window. Tip: match the MA length for smoother results.
Overbought Level – Threshold for stretched highs.
Oversold Level – Threshold for stretched lows.
⚡️ Showcase
Overbought/Oversold Zones
Divergences
📒 Usage
The Mean Reversion Oscillator (MRO) is best used as a context tool, not as a standalone buy/sell signal generator. Its primary purpose is to tell you when the price is statistically stretched relative to its average, so you can anticipate a potential return toward the mean.
Add to chart – Paste the script in TradingView and load it in a separate pane.
Set MA Length – Use 20–50 for intraday, 100–200 for swing/position trading.
Match StdDev Length – Keep it close to the MA Length to avoid distortion (e.g., MA 200 → StdDev 200).
Interpret readings:
>70 (Overbought) – Price stretched high, reversion or slowdown likely.
<30 (Oversold) – Price stretched low, bounce potential.
50 (Midline) – Neutral, momentum shift point.
Use with confluence – Strongest signals occur when MRO extremes align with S/R levels, trend filters, or volume cues.
Adjust thresholds – 70/30 is balanced; 80/20 gives fewer but stronger signals, 60/40 gives more but weaker ones.
Stay trend-aware – In strong trends, OB/OS can persist. Always check higher timeframe bias before fading moves.
🚨 Alerts
The indicator does not provide any alerts!
⚠️ Disclaimer
These tools are exclusively available on the TradingView platform.
Our charting tools are intended solely for informational and educational purposes and should not be regarded as financial, investment, or trading advice. They are not designed to predict market movements or offer specific recommendations. Users should be aware that past performance is not indicative of future results and should not rely on these tools for financial decisions. By using these charting tools, the purchaser agrees that the seller and creator hold no responsibility for any decisions made based on information provided by the tools. The purchaser assumes full responsibility and liability for any actions taken and their consequences, including potential financial losses or investment outcomes that may result from the use of these products.
By purchasing, the customer acknowledges and accepts that neither the seller nor the creator is liable for any undesired outcomes stemming from the development, sale, or use of these products. Additionally, the purchaser agrees to indemnify the seller from any liability. If invited through the Friends and Family Program, the purchaser understands that any provided discount code applies only to the initial purchase of Candela's subscription. The purchaser is responsible for canceling or requesting cancellation of their subscription if they choose not to continue at the full retail price. In the event the purchaser no longer wishes to use the products, they must unsubscribe from the membership service, if applicable.
We do not offer reimbursements, refunds, or chargebacks. Once these Terms are accepted at the time of purchase, no reimbursements, refunds, or chargebacks will be issued under any circumstances.
By continuing to use these charting tools, the user confirms their understanding and acceptance of these Terms as outlined in this disclaimer.
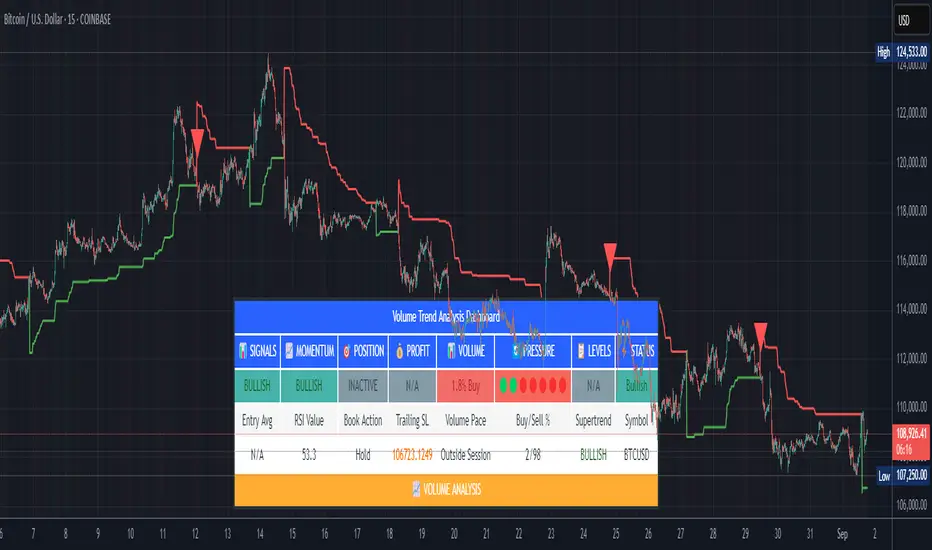
Volume Trend AnalysisStudy Material for Volume Trend Analysis Dashboard
1. Introduction
This script is a complete volume-based technical analysis dashboard designed in TradingView, created under the guidelines of TradingView and aiTrendview. It combines multiple indicators—Volume, RSI, Supertrend, Buy/Sell Pressure, and Momentum—into a single visual dashboard.
The purpose is education and market observation, not guaranteed profits. Students using this tool should focus on understanding patterns, signals, and probabilities rather than treating them as fixed rules.
________________________________________
2. Core Components and Indicators
🔹 Volume Analysis
• Volume shows the number of shares/contracts traded in a specific period.
• The script compares today’s volume with historical averages (e.g., 20-day average).
• This helps identify whether trading activity is higher or lower than usual.
• Learning use: A student can track if high volume confirms a price breakout or if low volume suggests weak conviction.
• Combination:
o High price rise + High volume → Strong bullish move.
o Price rise + Low volume → Weak rally, may fail.
o Price fall + High volume → Strong selling pressure.
o Price fall + Low volume → Weak decline, may reverse.
________________________________________
🔹 RSI (Relative Strength Index)
• RSI measures momentum (0–100 scale).
• Above 70 = Overbought (possible selling zone).
• Below 30 = Oversold (possible buying zone).
• Around 50 = Neutral, sideways market.
• Learning use: Combine with volume—RSI near extremes with high volume often marks turning points.
• Combination:
o RSI < 30 + High buy pressure volume = Strong bounce probability.
o RSI > 70 + High sell pressure volume = Risk of reversal downward.
________________________________________
🔹 Supertrend
• Supertrend uses volatility (ATR) to show support/resistance bands.
• Price above = Bullish trend.
• Price below = Bearish trend.
• Learning use: New students can treat it as a dynamic stop-loss and trailing tool.
• Combination:
o Price > Supertrend + RSI > 50 + High buy volume = Safe bullish trend.
o Price < Supertrend + RSI < 50 + High sell volume = Safe bearish trend.
________________________________________
🔹 Buy/Sell Pressure
• The indicator splits volume into buying vs. selling portions based on price action.
• Shows % of buying volume vs. selling volume.
• Learning use: Students can visualize whether bulls or bears are dominating.
• Combination:
o Buying > 65% → Bulls stronger.
o Selling > 65% → Bears stronger.
o Balanced → Market indecisive (range-bound).
________________________________________
🔹 Momentum & Signal Status
• Momentum combines RSI and Supertrend to classify market as Bullish, Bearish, or Neutral.
• Buy/Sell signals are triggered on crossovers of price with Supertrend along with RSI conditions.
• Learning use: Beginners should not blindly trade these signals but track how often they succeed/fail under different market conditions.
• Combination:
o Bullish Momentum + Buy Signal + High Volume = Strong entry setup.
o Bearish Momentum + Sell Signal + High Volume = Strong short setup.
________________________________________
🔹 Volume Pace
• Compares current intraday volume with expected average progress.
• Above pace = Traders active earlier than usual.
• Below pace = Weak interest in current session.
• Learning use: Beginners can track whether moves are backed by real activity or just price manipulation.
• Combination:
o Above pace + Bullish signals = Reliable rally.
o Below pace + Bullish signals = Weak rally, avoid.
________________________________________
3. How to Use the Dashboard
• The dashboard consolidates all indicators into a simple table: Signals, Momentum, Position, Profit, Volume, Pressure, Levels, and Status.
• It helps beginners see different aspects of market condition at one glance.
• Instead of jumping between multiple charts, everything is available in one panel.
• Students can use this to practice observation, backtest signals, and record outcomes.
________________________________________
4. Educational Guidelines
1. Paper Trade First: Always test on virtual trading accounts before real money.
2. Record Outcomes: Note how each signal works in trending vs. sideways markets.
3. Combine with Chart Reading: This is not standalone—students must learn candlestick patterns, support/resistance, and fundamentals.
4. Avoid Overtrading: Just because a dashboard flashes “BUY” doesn’t mean to enter blindly.
5. Adapt Timeframes: Learn the difference between intraday vs. daily signals. Shorter timeframes = more noise.
________________________________________
5. Common Beginner Mistakes
• Blind Trading: Treating BUY/SELL signals as automatic entry/exit without analysis.
• Ignoring Volume: Not checking whether signals are backed by strong or weak volume.
• Overconfidence: Assuming 100% accuracy—no indicator is perfect.
• Misusing Alerts: Alerts help monitoring but don’t guarantee profitability.
________________________________________
6. Disclaimer
This indicator is created strictly for educational and learning purposes under TradingView and aiTrendview guidelines.
• It is not financial advice and should not be treated as a guaranteed profit-making tool.
• Past performance does not guarantee future results.
• Misuse of this indicator for blind speculation can result in financial loss.
• Always use it with proper risk management and independent judgment.
• For real trading decisions, consult a certified financial advisor.
________________________________________
✅ By studying this dashboard, students gain exposure to:
• How multiple indicators interact.
• How volume confirms or rejects price moves.
• How to build discipline by observing signals, not chasing them.
This makes the tool a training ground for market observation rather than a shortcut to quick profits.
Moon Scalper v3 + VSAMoon Scalper v3 is a high-precision scalping indicator optimized for the 15-minute chart. It delivers clean buy/sell signals with TP1 (1:1 risk-reward) exits using layered confirmations:
• **Volatility Bands** — SMA + multiplier detect expansion zones
• **EMA Filter (200)** — ensures trades align with trend
• **RSI Range Filter** — avoids extreme overbought/oversold traps (buy: 52–62, sell: 38–48)
• **Volume Spike Filter** — filters for institutional activity (vol > 1.4×SMA)
• **VSA Confirmation** — requires wide-spread, high-volume bars with reclaim (volume × 1.4, spread × 1.5, reclaim 50%)
**Usage Notes:**
Best used on 15m timeframe for liquid pairs (e.g., BTCUSDT, ETHUSDT). Signals appear as “BUY” / “SELL” labels on chart. Defaults yield high TP1 hit rate; use only during active sessions (e.g., London/NY) for best accuracy.
**Disclaimer:**
This indicator is for educational purposes only. Past performance is not a guarantee of future results. Always backtest before live trading and manage risk responsibly.

Advanced RSI-ADX-Bollinger Market Overview DashboardStudy Material: Advanced RSI–ADX–Bollinger Market Overview Dashboard
This dashboard is a comprehensive trading tool designed to combine three powerful technical analysis methods—RSI (Relative Strength Index), ADX (Average Directional Index), and Bollinger Bands—into one unified system with live table output and progress indicators. It aims to provide a complete market snapshot at a glance, helping traders monitor momentum, volatility, trend, and market signals.
________________________________________
🔹 Core Concepts Used
1. RSI (Relative Strength Index)
• RSI measures market momentum by comparing price gains and losses.
• A high RSI indicates overbought conditions (possible reversal or sell zone).
• A low RSI indicates oversold conditions (possible reversal or buy zone).
• In this dashboard, RSI is also represented with progress bars to show how far the current value is moving toward extreme zones.
2. ADX (Average Directional Index)
• ADX is used to gauge the strength of a trend.
• When ADX rises above a threshold, it signals a strong trend (whether bullish or bearish).
• The system checks when ADX momentum crosses above its threshold to confirm whether a signal has strong backing.
3. Bollinger Bands
• Bollinger Bands measure volatility around a moving average.
• The upper band indicates potential overbought pressure, while the lower band shows oversold pressure.
• Expansion of the bands signals rising volatility, contraction shows calming markets.
• This tool also assigns a BB Trend Label: Expand ↑ (bullish), Contract ↓ (bearish), or Neutral →.
________________________________________
🔹 What This Dashboard Tracks
1. Signal Generation
o BUY Signal: RSI oversold + price near lower Bollinger Band + ADX strength confirmation.
o SELL Signal: RSI overbought + price near upper Bollinger Band + ADX strength confirmation.
o Labels are plotted on the chart to indicate BUY or SELL points.
2. Trend Direction & Strength
o The script analyzes short- and medium-term moving averages to decide whether the market is Bullish, Bearish, or Flat.
o An arrow symbol (↑, ↓, →) is shown to highlight the trend.
3. Signal Performance Tracking
o Once a BUY or SELL signal is active, the dashboard tracks:
Maximum profit reached
Maximum loss faced
Whether the signal is still running or closed
o This gives the trader performance feedback on past and ongoing signals.
4. Volume Analysis
o Volume is split into Buy Volume (candles closing higher) and Sell Volume (candles closing lower).
o This provides insight into who is in control of the market—buyers or sellers.
5. Comprehensive Data Table
o A professional table is displayed directly on the chart showing:
RSI Value
ADX Strength
Buy/Sell Volumes
Trend Direction
Bollinger Band Trend
Previous Signal Performance (Max Profit / Max Loss)
Current Signal Performance (Max Profit / Max Loss)
Symbol Name
o Each metric is color-coded for instant decision-making.
6. Progress Indicators
o RSI Progress Bar (0–100 scale).
o ADX Progress Bar (0–50 scale).
o Bollinger Band Expansion/Contraction progress.
o Signal profit/loss progress visualization.
7. Market Status Summary
o The dashboard issues a status label such as:
🔴 SELL ACTIVE
🔵 BUY ACTIVE
🟢 BULL MARKET
🔴 BEAR MARKET
🟡 NEUTRAL
________________________________________
🔹 Practical Use Case
This dashboard is ideal for traders who want a consolidated decision-making tool. Instead of monitoring RSI, ADX, and Bollinger Bands separately, the system automatically combines them and shows signals, trends, volumes, and performance in one view.
It can be applied to:
• Intraday Trading (short-term moves with high volatility).
• Swing Trading (holding positions for days to weeks).
• Trend Confirmation (identifying when to stay in or exit trades).
________________________________________
⚠️ Strict Disclaimer (aiTrendview Policy)
• This script is a research and educational tool only.
• It does NOT guarantee profits and must not be used as a sole decision-making system.
• Past performance tracking inside the dashboard is informational and does not predict future outcomes.
• Trading involves significant financial risk, including potential loss of all capital.
• Users are fully responsible for their own trading decisions.
________________________________________
🚫 Misuse Policy (aiTrendview Standard)
• Do not misuse this tool for false claims of guaranteed profits.
• Redistribution, resale, or repackaging under another name is strictly prohibited without aiTrendview permission.
• This tool is intended to support disciplined trading practices, not reckless speculation.
• aiTrendview does not support gambling-style use or over-leveraging based on this script.
________________________________________
👉 In short: This system is a professional decision-support tool that integrates RSI, ADX, and Bollinger Bands into one dashboard with signals, performance tracking, and progress visualization. It helps traders see the bigger picture of market health—but the responsibility for action remains with the trader.
________________________________________

EMA Oscillator [Alpha Extract]A precision mean reversion analysis tool that combines advanced Z-score methodology with dual threshold systems to identify extreme price deviations from trend equilibrium. Utilizing sophisticated statistical normalization and adaptive percentage-based thresholds, this indicator provides high-probability reversal signals based on standard deviation analysis and dynamic range calculations with institutional-grade accuracy for systematic counter-trend trading opportunities.
🔶 Advanced Statistical Normalization
Calculates normalized distance between price and exponential moving average using rolling standard deviation methodology for consistent interpretation across timeframes. The system applies Z-score transformation to quantify price displacement significance, ensuring statistical validity regardless of market volatility conditions.
// Core EMA and Oscillator Calculation
ema_values = ta.ema(close, ema_period)
oscillator_values = close - ema_values
rolling_std = ta.stdev(oscillator_values, ema_period)
z_score = oscillator_values / rolling_std
🔶 Dual Threshold System
Implements both statistical significance thresholds (±1σ, ±2σ, ±3σ) and percentage-based dynamic thresholds calculated from recent oscillator range extremes. This hybrid approach ensures consistent probability-based signals while adapting to varying market volatility regimes and maintaining signal relevance during structural market changes.
// Statistical Thresholds
mild_threshold = 1.0 // ±1σ (68% confidence)
moderate_threshold = 2.0 // ±2σ (95% confidence)
extreme_threshold = 3.0 // ±3σ (99.7% confidence)
// Percentage-Based Dynamic Thresholds
osc_high = ta.highest(math.abs(z_score), lookback_period)
mild_pct_thresh = osc_high * (mild_pct / 100.0)
moderate_pct_thresh = osc_high * (moderate_pct / 100.0)
extreme_pct_thresh = osc_high * (extreme_pct / 100.0)
🔶 Signal Generation Framework
Triggers buy/sell alerts when Z-score crosses extreme threshold boundaries, indicating statistically significant price deviations with high mean reversion probability. The system generates continuation signals at moderate levels and reversal signals at extreme boundaries with comprehensive alert integration.
// Extreme Signal Detection
sell_signal = ta.crossover(z_score, selected_extreme)
buy_signal = ta.crossunder(z_score, -selected_extreme)
// Dynamic Color Coding
signal_color = z_score >= selected_extreme ? #ff0303 : // Extremely Overbought
z_score >= selected_moderate ? #ff6a6a : // Overbought
z_score >= selected_mild ? #b86456 : // Mildly Overbought
z_score > -selected_mild ? #a1a1a1 : // Neutral
z_score > -selected_moderate ? #01b844 : // Mildly Oversold
z_score > -selected_extreme ? #00ff66 : // Oversold
#00ff66 // Extremely Oversold
🔶 Visual Structure Analysis
Provides a six-tier color gradient system with dynamic background zones indicating mild, moderate, and extreme conditions. The histogram visualization displays Z-score intensity with threshold reference lines and zero-line equilibrium context for precise mean reversion timing.
snapshot
4H
1D
🔶 Adaptive Threshold Selection
Features intelligent threshold switching between statistical significance levels and percentage-based dynamic ranges. The percentage system automatically adjusts to current volatility conditions using configurable lookback periods, while statistical thresholds maintain consistent probability-based signal generation across market cycles.
🔶 Performance Optimization
Utilizes efficient rolling calculations with configurable EMA periods and threshold parameters for optimal performance across all timeframes. The system includes comprehensive alert functionality with customizable notification preferences and visual signal overlay options.
🔶 Market Oscillator Interpretation
Z-score > +3σ indicates statistically significant overbought conditions with high reversal probability, while Z-score < -3σ signals extreme oversold levels suitable for counter-trend entries. Moderate thresholds (±2σ) capture 95% of normal price distributions, making breaches statistically significant for systematic trading approaches.
snapshot
🔶 Intelligent Signal Management
Automatic signal filtering prevents false alerts through extreme threshold crossover requirements, while maintaining sensitivity to genuine statistical deviations. The dual threshold system provides both conservative statistical approaches and adaptive market condition responses for varying trading styles.
Why Choose EMA Oscillator ?
This indicator provides traders with statistically-grounded mean reversion analysis through sophisticated Z-score normalization methodology. By combining traditional statistical significance thresholds with adaptive percentage-based extremes, it maintains effectiveness across varying market conditions while delivering high-probability reversal signals based on quantifiable price displacement from trend equilibrium, enabling systematic counter-trend trading approaches with defined statistical confidence levels and comprehensive risk management parameters.

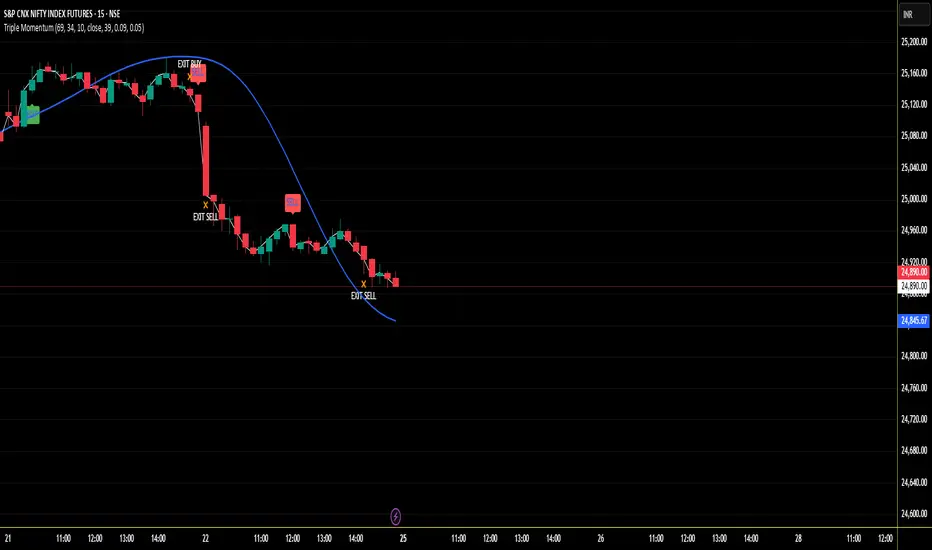
Triple Momentum Indicator ALERT CODE (opt & fut )Nifty and Bank 🚀High Accuracy Triple Momentum Strategy - no repainting HIGH WINRATE
This system is designed for job holders who want to invest and trade using a proven, back tested strategy without needing to sit in front of charts all day.
📢 Need auto-trade alerts?
its an dedicated **indicator version with real-time BUY/SELL/EXIT alerts**
Strategy code review
📊 Results:
Historical Win Rate: 90.0% (314/349 signals)
Study Period: 1 Year on NIFTY Futures
Educational Return: 81.4% annualized
Max Drawdown: ₹49,132.50
📊 Optimized Parameters:
"This strategy achieves 90% win rate on NIFTY Futures using optimized settings:
📈PARAM A: 69
📉PARAM B: 34
⚡PARAM C : 10
🎯 Source: Close
📊PARAM D: 39
🔴 Use Live Bar Signals: Enabled (may repaint)
💰 Long Profit %: 0.09
💸 Short Profit %: 0.05
🔎 Clean BUY / SELL / EXIT logic, optimized for high-probability trades
📧 Educational Access:
Send TradingView message for access.
📌 **Important Notes:**
- 🧪 This tool has been **extensively tested**, and results shown are from actual backtests on TradingView
🔒 Access is invite-only for quality control
@How to Create Alerts in TradingView (Step by Step)
Add the Indicator to Your Chart
Open your chart in TradingView.
Add your custom indicator (from Pine Script) to the chart.
Set Your Indicator Parameters@
Click on the indicator’s name in the chart or in the “Indicators” list.
Click the gear/settings icon.
Enter the suggested parameters (Long Length: 69, Short Length: 34, etc.), then click OK.
Open the Alert Creation Window
Click the Alerts (clock/bell) icon at the top of the TradingView interface.
Or right-click on the chart and select “Add Alert”.
Configure Each Alert
In the “Condition” dropdown, select your indicator.
Choose the specific alert condition (e.g., Buy Alert, Sell Alert, Exit Buy Alert, Exit Sell Alert) from the list.
Set the “Options” to Once per bar close.
(Optional) Enter your webhook URL if you want alerts to be sent to another app or bot.
In the Message box, enter the JSON format for automation:
For Buy: {"SYMBOL":"{{ticker}}","ACTION":"BUY","PRICE":{{close}}}
For Sell: {"SYMBOL":"{{ticker}}","ACTION":"SELL","PRICE":{{close}}}
For Buy Exit: {"SYMBOL":"{{ticker}}","ACTION":"BUY_EXIT","PRICE":{{close}}}
For Sell Exit: {"SYMBOL":"{{ticker}}","ACTION":"SELL_EXIT","PRICE":{{close}}}
Save the Alert
Click Create to save your alert.
Repeat
Repeat steps (Buy, Sell, Buy Exit, Sell Exit).
Manage Alerts
You can edit, remove, or pause alerts any time in the “Alerts” panel at the bottom of TradingView.
⚠️ Disclaimer:
Shared for learning and research purposes only. Not financial advice. Past educational results don't guarantee future outcomes. Trading involves risk of loss. We are not SEBI registered.
#MomentumStrategy #TradingEducation #InviteOnly #NIFTYFutures #AlgoTrading #EducationalStrategy #NIFTYOptions
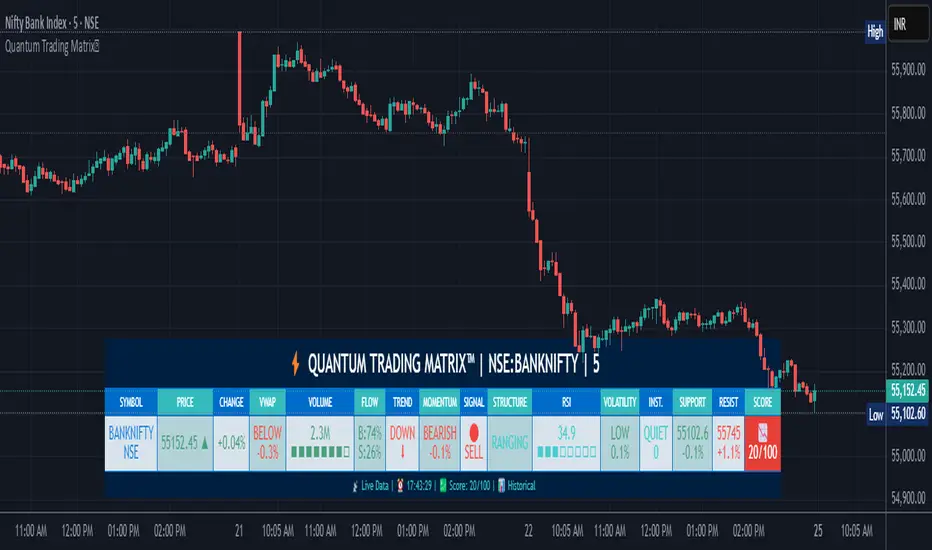
Quantum Trading MatrixThe Quantum Trading Matrix is a sophisticated Pine Script indicator designed for TradingView that offers a comprehensive trading dashboard by combining multiple market analysis techniques in one interface. The indicator integrates price action, volume, momentum, trend detection, institutional activity, and technical oscillators to provide traders a unified perspective on the market.
At its core, the script uses fundamental market data like price (open, high, low, close) and volume to calculate various metrics. The VWAP (Volume Weighted Average Price) is a key element that helps traders understand if the price is trading above or below the average price weighted by volume, indicating market strength or weakness. The distance of the current price from the VWAP is computed as a percentage to signal how far the price has diverged from this benchmark.
Momentum is measured through a "Quantum Momentum Oscillator" derived from the difference between fast and slow exponential moving averages of price. Positive momentum signals bullish conditions while negative momentum signals bearish ones. Volume flow analysis breaks down buying versus selling pressure on each bar by observing where the close price lies within the daily range combined with volume, generating an order flow ratio. This aids in identifying if buyers or sellers dominate the market at a given time.
Trend detection involves calculating EMAs of different lengths (8, 21, and 50) and aggregating their relationships into a trend score. Scores range from strong uptrend to downtrend, providing a clear directional bias. Institutional activity is inferred by detecting volume spikes significantly above the average volume, suggesting large players might be active. A dark pool estimate provides an approximate volume figure representing hidden or off-exchange trading.
The script also identifies market structure by detecting pivot highs and lows which act as resistance and support levels, respectively. These levels offer valuable insight into potential price reversals or breakouts. The RSI (Relative Strength Index) is incorporated, including a basic divergence detection to suggest potential bull or bear reversals. Volatility is measured using the Average True Range (ATR), classifying the current volatility from low to extreme, helping traders gauge the risk environment.
All these metrics are combined into a scoring system that awards points for positive indications such as price above VWAP, positive order flow, bullish momentum, and an uptrend in EMAs. The overall score ranges from 0 to 100 and is interpreted visually with emojis: a rocket for strong bullish setups, a chart up emoji for positive bias, a balanced scale for neutral, and a chart down emoji for bearish conditions.
The indicator issues alerts based on the combination of these signals, including bullish and bearish setups when multiple criteria align favorably, volume spike alerts when abnormal volume events occur, and institutional activity alerts for high volume surges.
To use this indicator effectively, traders should first assess the trend direction indicated by the EMA-based scoring. Positive momentum and price trading above the VWAP confirm bullish bias, while the opposite suggests bearishness. Volume flow and institutional activity provide additional confirmation. Support and resistance levels derived from pivots help in planning entries and exits. The RSI and volatility readings inform traders of potential overbought or oversold conditions and market risk levels. Alerts provide timely notifications to act on significant setups.
The indicator is highly customizable, allowing users to adjust the dashboard's position, size, and color theme to suit personal preferences. Parameters such as the momentum period, volume profile bars, trend multiplier, and signal sensitivity can be fine-tuned to adapt to different markets and trading styles.
This tool requires foundational knowledge of key technical concepts such as EMAs, VWAP, ATR, RSI, and volume analysis for best utilization. For traders interested in expanding their understanding, recommended resources include the TradingView Pine Script manual, technical analysis books by John J. Murphy and Dr. Alexander Elder, and practical video tutorials focusing on volume spread analysis and institutional order flow.
Overall, the Quantum Trading Matrix™ serves as a powerful control panel for active traders, providing a multi-dimensional view of the market through combined technical indicators, helping to identify high probability trade setups and manage risk effectively.
________________________________________
⚠️ Warning:
• Trading financial markets involves substantial risk.
• You can lose more money than you invest.
• Past performance of indicators does not guarantee future results.
• This script must not be copied, resold, or republished without authorization from aiTrendview.
By using this material or the code, you agree to take full responsibility for your trading decisions and acknowledge that this is not financial advice.
________________________________________
⚠️ Disclaimer and Warning (From aiTrendview)
This Dynamic Trading Dashboard is created strictly for educational and research purposes on the TradingView platform. It does not provide financial advice, buy/sell recommendations, or guaranteed returns. Any use of this tool in live trading is completely at the user’s own risk. Markets are inherently risky; losses can exceed initial investment.
The intellectual property of this script and its methodology belongs to aiTrendview. Unauthorized reproduction, modification, or redistribution of this code is strictly prohibited. By using this study material or the script, you acknowledge personal responsibility for any trading outcomes. Always consult professional financial advisors before making investment decisions.
Imbalance No SL📊 Strategy Name: Imbalance No SL
This strategy specially trades on price jumps (true imbalances) in the market, takes advantage of momentum only, and as soon as the opposite signal and profit is received, the trade is closed immediately.
Imbalance No SL strategy specially generates buy and sell signals based on "Imbalance" logic, without any fixed Stop Loss.
🔍 Core Logic
Imbalance Detection
Bullish Imbalance : When the low of the current candle is above the high of the previous candle.
(i.e. a jump type gap occurred in the market – demand is high, price went straight up)
Bearish Imbalance : When the high of the current candle is below the low of the previous candle.
(i.e. the market suddenly fell down)
Creating Visual Box and Label on Signal:
As soon as bullish imbalance is found, green box & IMB BULL label is displayed on the chart.
Bearish has red box & IMB BEAR label.
Trade Entry Logic
BUY on Bullish Imbalance: If there is already a buy or neutral position, then a new “BUY” signal will fire.
SELL on Bearish Imbalance: If already in sell or neutral position, then new “SELL” signal will fire.
You can set quantity/lot size from ‘qty’ input field.
Trade Average Calculation
Buy/Sell maintains average price and their count (so that if averaging is done then correct P&L is calculated).
Trade Exit Logic (Profit Booking/Signal Reverse)
If your buy is going on and bearish imbalance is formed + price is above your average, then buy will be closed (profit condition).
If sell is going on and bullish imbalance is formed + price is below average, then sell will be closed.
Chart Cleaning/Management
Only keep the label and box of the latest signal on the chart, old boxes/labels are automatically deleted.
Alert
You can get alert on bullish or bearish signal (by using alert feature of TradingView).
✅ Simple Explanation for User
This strategy buys or sells directly at the gap (imbalance).
Whenever there is a clear signal of momentum in the market (breakout of the gap), then the trade entry takes place.
When there is an imbalance in the opposite direction and profit is made, the system closes the trade (closes).
There is no fixed stop-loss, risk management is handled by trade averaging/close.
You will know at every point on the visually chart that at which bar the buy, sell and exit took place.
⚠️ What to remember?
If the market is in trend then this script gives very good signals.
In choppy/sideways market, some loss trades can also come because there is no SL.
Big profit or big loss – both depend on the imbalance signal and market speed.

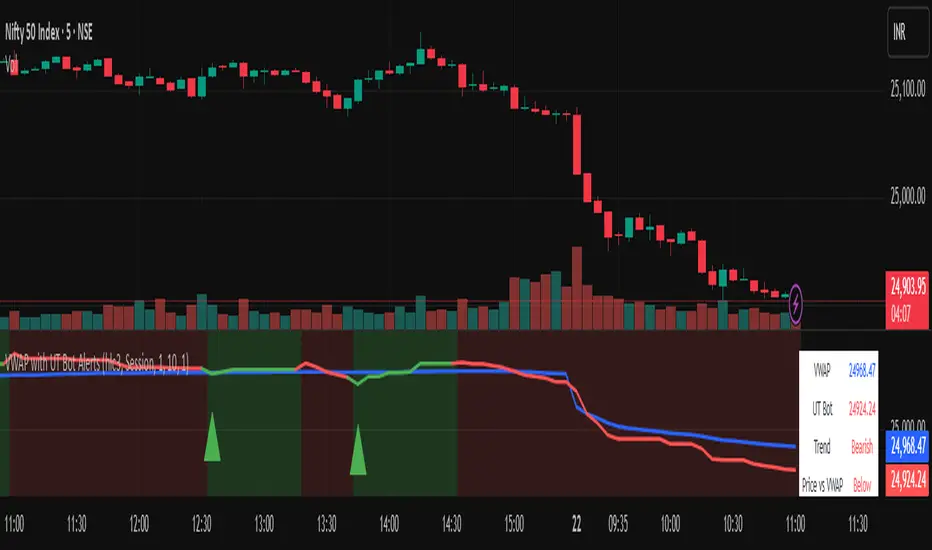
Vwapbot (VWAP + Ut Bot Alerts)Vwapbot (VWAP + Ut Bot Alerts) - Complete Guide
This Pine Script indicator combines two powerful trading tools: Volume Weighted Average Price (VWAP) and the UT Bot trend-following system. Here's a comprehensive breakdown:
What This Indicator Does
The indicator provides:
1. VWAP calculation with deviation bands
2. UT Bot trend signals with trailing stops
3. Combined confluence alerts when both indicators align
4. Visual information table showing current market conditions
Core Components
1. VWAP (Volume Weighted Average Price)
What it is: VWAP calculates the average price weighted by volume, giving more importance to high-volume periods.
Settings:
• VWAP Source: Price used for calculation (default: hlc3 - average of high, low, close)
• VWAP Anchor: Reset period (Session/Week/Month/Quarter/Year)
Usage:
• Price above VWAP = bullish bias
• Price below VWAP = bearish bias
• VWAP acts as dynamic support/resistance
2. VWAP Deviation Bands
What they show: Statistical boundaries around VWAP based on price volatility
Settings:
• Standard Deviation Multiplier: How far the bands extend (default: 1.0)
• Show Bands: Toggle visibility
Usage:
• Gray dashed lines: 1 standard deviation bands (normal price range)
• Red dotted lines: 2 standard deviation bands (extreme price levels)
• Price touching outer bands may indicate reversal opportunities
3. UT Bot (Ultimate Trend Bot)
What it does: Creates a trailing stop system that follows trends and signals reversals
Settings:
• Key Value: Sensitivity multiplier (1.0 = balanced, lower = more sensitive)
• ATR Period: Lookback period for volatility calculation (default: 10)
How it works:
• Uses ATR (Average True Range) to calculate dynamic support/resistance levels
• Green line = uptrend (trailing stop below price)
• Red line = downtrend (trailing stop above price)
4. UT Bot Alerts are integrated to the logic of Volume Profile i,e VWAP, the UT Bot Stop trailing line plot its data and change trends obtaining it's logic from the VWAP and Standard Deviation bands, thus it differs in it's logic of UT Bot alerts from other indicators.
Visual Elements
On-Chart Displays:
1. Blue line: VWAP
2. Gray lines: 1st deviation bands
3. Red lines: 2nd deviation bands
4. Green/Red thick line: UT Bot trailing stop
5. Green triangles up: Buy signals
6. Red triangles down: Sell signals
7. Background color: Light green (bullish) / Light red (bearish)
Information Table (Top Right):
• VWAP: Current VWAP value
• UT Bot: Current trailing stop level
• Trend: Bullish/Bearish status
• Price vs VWAP: Above/Below comparison
• Deviation: Percentage distance from VWAP
• Volume: Current bar volume
Trading Signals
Basic Signals:
1. UT Bot Buy: Green triangle when trend turns bullish
2. UT Bot Sell: Red triangle when trend turns bearish
3. VWAP Cross Above: Price crosses above VWAP
4. VWAP Cross Below: Price crosses below VWAP
Confluence Signals :
1. Bullish Confluence: UT Bot buy signal + Price above VWAP
2. Bearish Confluence: UT Bot sell signal + Price below VWAP
How to Use This Indicator
For Trend Following:
1. Enter long when you get a bullish confluence signal
2. Enter short when you get a bearish confluence signal
3. Exit when the UT Bot trend changes color
For Mean Reversion:
1. Look for reversals when price hits the 2nd deviation bands
2. Confirm with UT Bot signals
3. Target return to VWAP
For Support/Resistance:
1. Use VWAP as dynamic support in uptrends, resistance in downtrends
2. Watch for bounces at deviation bands
3. Confirm direction with UT Bot trend color
Best Practices
Timeframes:
• Intraday: Use Session VWAP anchor
• Swing trading: Use Weekly/Monthly anchors
• Position trading: Use Monthly/Quarterly anchors
Risk Management:
• Stop loss: Below/above the UT Bot trailing stop
• Position sizing: Smaller positions when price is at extreme deviation bands
• Confluence: Wait for both VWAP and UT Bot alignment for strongest signals
Market Conditions:
• Trending markets: Focus on UT Bot signals and VWAP direction bias
• Ranging markets: Use deviation bands for entry/exit points
• High volume periods: VWAP becomes more significant
Alert System
The indicator provides 6 types of alerts:
1. UT Bot buy/sell signals
2. VWAP crossover alerts
3. Confluence alerts (most important)
Set up alerts for confluence signals to catch the highest probability setups when both indicators align.
This indicator works best when combined with proper risk management and used in conjunction with market structure analysis. The confluence signals provide the highest probability entries, while the individual components help with market.
Advice from the publisher:
For using with Indices e.g NIFTY 50, BANKNIFTY etc. use parameters:
UT BOT Key Value : 1
UT BOT ATR Period : 10
Standard Deviation Multiplier : 1 {Default}
For using with commodities e.g NATURALGAS, CRUDEOIL etc. use parameters:
UT BOT Key Value : 2
UT BOT ATR Period : 7
Standard Deviation Multiplier : 1 {Default}
Advanced Volume Profile Pro Delta + POC + VAH/VAL# Advanced Volume Profile Pro - Delta + POC + VAH/VAL Analysis System
## WHAT THIS SCRIPT DOES
This script creates a comprehensive volume profile analysis system that combines traditional volume-at-price distribution with delta volume calculations, Point of Control (POC) identification, and Value Area (VAH/VAL) analysis. Unlike standard volume indicators that show only total volume over time, this script analyzes volume distribution across price levels and estimates buying vs selling pressure using multiple calculation methods to provide deeper market structure insights.
## WHY THIS COMBINATION IS ORIGINAL AND USEFUL
**The Problem Solved:** Traditional volume indicators show when volume occurs but not where price finds acceptance or rejection. Standalone volume profiles lack directional bias information, while basic delta calculations don't provide structural context. Traders need to understand both volume distribution AND directional sentiment at key price levels.
**The Solution:** This script implements an integrated approach that:
- Maps volume distribution across price levels using configurable row density
- Estimates delta (buying vs selling pressure) using three different methodologies
- Identifies Point of Control (highest volume price level) for key support/resistance
- Calculates Value Area boundaries where 70% of volume traded
- Provides real-time alerts for key level interactions and volume imbalances
**Unique Features:**
1. **Developing POC Visualization**: Real-time tracking of Point of Control migration throughout the session via blue dotted trail, revealing institutional accumulation/distribution patterns before they complete
2. **Multi-Method Delta Calculation**: Price Action-based, Bid/Ask estimation, and Cumulative methods for different market conditions
3. **Adaptive Timeframe System**: Auto-adjusts calculation parameters based on chart timeframe for optimal performance
4. **Flexible Profile Types**: N Bars Back (precise control), Days Back (calendar-based), and Session-based analysis modes
5. **Advanced Imbalance Detection**: Identifies and highlights significant buying/selling imbalances with configurable thresholds
6. **Comprehensive Alert System**: Monitors POC touches, Value Area entry/exit, and major volume imbalances
## HOW THE SCRIPT WORKS TECHNICALLY
### Core Volume Profile Methodology:
**1. Price Level Distribution:**
- Divides price range into user-defined rows (10-50 configurable)
- Calculates row height: `(Highest Price - Lowest Price) / Number of Rows`
- Distributes each bar's volume across price levels it touched proportionally
**2. Delta Volume Calculation Methods:**
**Price Action Method:**
```
Price Range = High - Low
Buy Pressure = (Close - Low) / Price Range
Sell Pressure = (High - Close) / Price Range
Buy Volume = Total Volume × Buy Pressure
Sell Volume = Total Volume × Sell Pressure
Delta = Buy Volume - Sell Volume
```
**Bid/Ask Estimation Method:**
```
Average Price = (High + Low + Close) / 3
Buy Volume = Close > Average ? Volume × 0.6 : Volume × 0.4
Sell Volume = Total Volume - Buy Volume
```
**Cumulative Method:**
```
Buy Volume = Close > Open ? Volume : Volume × 0.3
Sell Volume = Close ≤ Open ? Volume : Volume × 0.3
```
**3. Point of Control (POC) Identification:**
- Scans all price levels to find maximum volume concentration
- POC represents the price level with highest trading activity
- Acts as significant support/resistance level
- **Developing POC Feature**: Tracks POC evolution in real-time via blue dotted trail, showing how institutional interest migrates throughout the session. Upward POC migration indicates accumulation patterns, downward migration suggests distribution, providing early trend signals before price confirmation.
**4. Value Area Calculation:**
- Starts from POC and expands up/down to encompass 70% of total volume
- VAH (Value Area High): Upper boundary of value area
- VAL (Value Area Low): Lower boundary of value area
- Expansion algorithm prioritizes direction with higher volume
**5. Adaptive Range Selection:**
Based on profile type and timeframe optimization:
- **N Bars Back**: Fixed lookback period with performance optimization (20-500 bars)
- **Days Back**: Calendar-based analysis with automatic timeframe adjustment (1-365 days)
- **Session**: Current trading session or custom session times
### Performance Optimization Features:
- **Sampling Algorithm**: Reduces calculation load on large datasets while maintaining accuracy
- **Memory Management**: Clears previous drawings to prevent performance degradation
- **Safety Constraints**: Prevents excessive memory usage with configurable limits
## HOW TO USE THIS SCRIPT
### Initial Setup:
1. **Profile Configuration**: Select profile type based on trading style:
- N Bars Back: Precise control over data range
- Days Back: Intuitive calendar-based analysis
- Session: Real-time session development
2. **Row Density**: Set number of rows (30 default) - more rows = higher resolution, slower performance
3. **Delta Method**: Choose calculation method based on market type:
- Price Action: Best for trending markets
- Bid/Ask Estimate: Good for ranging markets
- Cumulative: Smoothed approach for volatile markets
4. **Visual Settings**: Configure colors, position (left/right), and display options
### Reading the Profile:
**Volume Bars:**
- **Length**: Represents relative volume at that price level
- **Color**: Green = net buying pressure, Red = net selling pressure
- **Intensity**: Darker colors indicate volume imbalances above threshold
**Key Levels:**
- **POC (Blue Line)**: Highest volume price - major support/resistance
- **VAH (Purple Dashed)**: Value Area High - upper boundary of fair value
- **VAL (Orange Dashed)**: Value Area Low - lower boundary of fair value
- **Value Area Fill**: Shaded region showing main trading range
**Developing POC Trail:**
- **Blue Dotted Lines**: Show real-time POC evolution throughout the session
- **Migration Patterns**: Upward trail indicates bullish accumulation, downward trail suggests bearish distribution
- **Early Signals**: POC movement often precedes price movement, providing advance warning of institutional activity
- **Institutional Footprints**: Reveals where smart money concentrated volume before final POC establishment
### Trading Applications:
**Support/Resistance Analysis:**
- POC acts as magnetic price level - expect reactions
- VAH/VAL provide intermediate support/resistance levels
- Profile edges show areas of low volume acceptance
**Developing POC Analysis:**
- **Upward Migration**: POC moving higher = institutional accumulation, bullish bias
- **Downward Migration**: POC moving lower = institutional distribution, bearish bias
- **Stable POC**: Tight clustering = balanced market, range-bound conditions
- **Early Trend Detection**: POC direction change often precedes price breakouts
**Entry Strategies:**
- Buy at VAL with POC as target (in uptrends)
- Sell at VAH with POC as target (in downtrends)
- Breakout plays above/below profile extremes
**Volume Imbalance Trading:**
- Strong buying imbalance (>60% threshold) suggests continued upward pressure
- Strong selling imbalance suggests continued downward pressure
- Imbalances near key levels provide high-probability setups
**Multi-Timeframe Context:**
- Use higher timeframe profiles for major levels
- Lower timeframe profiles for precise entries
- Session profiles for intraday trading structure
## SCRIPT SETTINGS EXPLANATION
### Volume Profile Settings:
- **Profile Type**: Determines data range for calculation
- N Bars Back: Exact number of bars (20-500 range)
- Days Back: Calendar days with timeframe adaptation (1-365 days)
- Session: Trading session-based (intraday focus)
- **Number of Rows**: Profile resolution (10-50 range)
- **Profile Width**: Visual width as chart percentage (10-50%)
- **Value Area %**: Volume percentage for VA calculation (50-90%, 70% standard)
- **Auto-Adjust**: Automatically optimizes for different timeframes
### Delta Volume Settings:
- **Show Delta Volume**: Enable/disable delta calculations
- **Delta Calculation Method**: Choose methodology based on market conditions
- **Highlight Imbalances**: Visual emphasis for significant volume imbalances
- **Imbalance Threshold**: Percentage for imbalance detection (50-90%)
### Session Settings:
- **Session Type**: Daily, Weekly, Monthly, or Custom periods
- **Custom Session Time**: Define specific trading hours
- **Previous Sessions**: Number of historical sessions to display
### Days Back Settings:
- **Lookback Days**: Number of calendar days to analyze (1-365)
- **Automatic Calculation**: Script automatically converts days to bars based on timeframe:
- Intraday: Accounts for 6.5 trading hours per day
- Daily: 1 bar per day
- Weekly/Monthly: Proportional adjustment
### N Bars Back Settings:
- **Lookback Bars**: Exact number of bars to analyze (20-500)
- **Precise Control**: Best for systematic analysis and backtesting
### Visual Customization:
- **Colors**: Bullish (green), Bearish (red), and level colors
- **Profile Position**: Left or Right side of chart
- **Profile Offset**: Distance from current price action
- **Labels**: Show/hide level labels and values
- **Smooth Profile Bars**: Enhanced visual appearance
### Alert Configuration:
- **POC Touch**: Alerts when price interacts with Point of Control
- **VA Entry/Exit**: Alerts for Value Area boundary interactions
- **Major Imbalance**: Alerts for significant volume imbalances
## VISUAL FEATURES
### Profile Display:
- **Horizontal Bars**: Volume distribution across price levels
- **Color Coding**: Delta-based coloring for directional bias
- **Smooth Rendering**: Optional smoothing for cleaner appearance
- **Transparency**: Configurable opacity for chart readability
### Level Lines:
- **POC**: Solid blue line with optional label
- **VAH/VAL**: Dashed colored lines with value displays
- **Extension**: Lines extend across relevant time periods
- **Value Area Fill**: Optional shaded region between VAH/VAL
### Information Table:
- **Current Values**: Real-time POC, VAH, VAL prices
- **VA Range**: Value Area width calculation
- **Positioning**: Multiple table positions available
- **Text Sizing**: Adjustable for different screen sizes
## IMPORTANT USAGE NOTES
**Realistic Expectations:**
- Volume profile analysis provides structural context, not trading signals
- Delta calculations are estimations based on price action, not actual order flow
- Past volume distribution does not guarantee future price behavior
- Combine with other analysis methods for comprehensive market view
**Best Practices:**
- Use appropriate profile types for your trading style:
- Day Trading: Session or Days Back (1-5 days)
- Swing Trading: Days Back (10-30 days) or N Bars Back
- Position Trading: Days Back (60-180 days)
- Consider market context (trending vs ranging conditions)
- Verify key levels with additional technical analysis
- Monitor profile development for changing market structure
**Performance Considerations:**
- Higher row counts increase calculation complexity
- Large lookback periods may affect chart performance
- Auto-adjust feature optimizes for most use cases
- Consider using session profiles for intraday efficiency
**Limitations:**
- Delta calculations are estimations, not actual transaction data
- Profile accuracy depends on available price/volume history
- Effectiveness varies across different instruments and market conditions
- Requires understanding of volume profile concepts for optimal use
**Data Requirements:**
- Requires volume data for accurate calculations
- Works best on liquid instruments with consistent volume
- May be less effective on very low volume or exotic instruments
This script serves as a comprehensive volume analysis tool for traders who need detailed market structure information with integrated directional bias analysis and real-time POC development tracking for informed trading decisions.
