스크립트에서 "BTC"에 대해 찾기

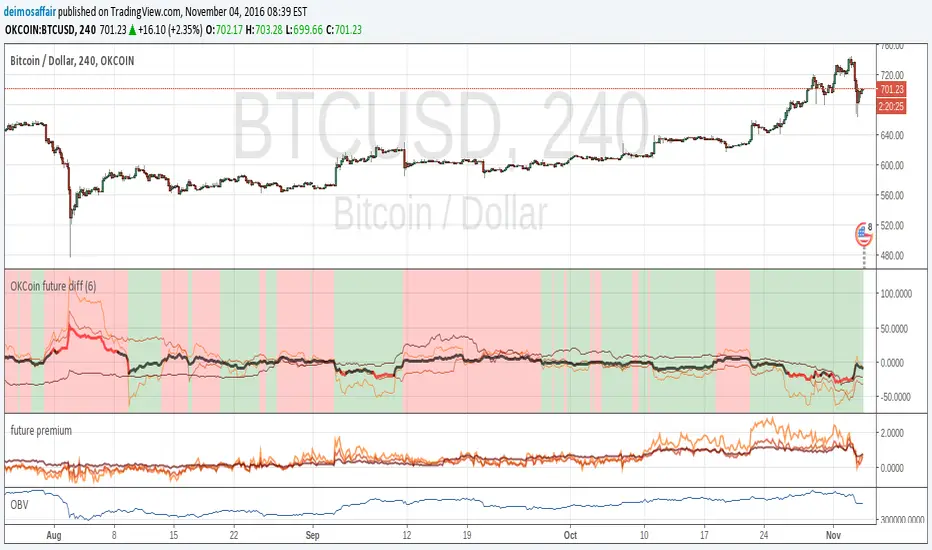
OKCoin future diffThis indicator checks the accuracy of okcoin futures against the current index. Example, check how the 1W future from 7 days ago matches the current spot value. The matches are on the 1W, 2W, 3M futures
The indicator bundles them together, makes a weighted average and shows it all.
the thin lines are the futures deltas for each of the futures(check the code to see the color of each).
the thick line is the compound indicator, the line is red when the value is too far off the spot price, black when it's <5%
background is green on "bullish", red for "bearish", take it as you want with many grains of salt :)
there is an input value (default = 1) to adjust time scales. the value is a multiplier for the number of periods in a day.
Example:
1D chart, input = 1
4h chart, input = 4h * 6 = 24h
using the incorrect adjustment for the wrong time scale, makes the indicator (even more) meaningless ;)
(CRISIS) aggregateBTCvol v0.2.4Aggregate multiple exchange volumes into single indicator
This update adds:
*Moving Average
*Add/change/disable to up 6 securities without touching code.
*Monochrome mode for dark themes.

BTC Volume Index 1.1 beta [Dia]Indicator calculates total volume across multiple bitcoin exchanges. The influence of each exchange can be adjusted seperately.
0 fee exchanges default to 50%
0 fee futures default to 10%
Define custom lookback periods for price breakout detection.
Look for low-volume price reversals in those candles immediately following high volume peaks. The lower the volume and the greater the open/close price difference of that 2nd candle is compared to the previous one, the higher the likelihood of a local top/bottom being in.
Note:
Bar highlighting is still experimental, future versions will include better filtering options.
Use for confirmation only, not as standalone trading system.


Session Trader - Optimal Hours📊 Overview
Never miss the best trading hours again! This indicator provides a comprehensive, real-time session tracker that shows you EXACTLY when to trade crypto and when to stay out of the market. Automatically converts all times to your local timezone, highlights the current active session, and shows what's coming next.
Perfect for crypto traders who want to maximize profits by trading during high-liquidity, high-volume sessions while avoiding choppy, low-liquidity periods that lead to losses.
✨ Key Features
🎯 Real-Time Session Tracking
LIVE indicator shows which session is currently active with bright highlighting
NEXT UP feature highlights the upcoming session when between trading periods
Smart header displays current status at a glance
Real-time countdown timers for every session (opens/closes)
📍 6 Critical Trading Sessions Covered
✅ BEST TRADING SESSIONS (Green):
London Open (07:00-09:00 UTC) - High volatility kickoff, institutional orders
London-NY Overlap (13:30-15:30 UTC) - THE BEST period! Maximum liquidity & volume
NY Momentum (15:30-18:00 UTC) - Strong trending moves, continuation plays
❌ AVOID TRADING SESSIONS (Red):
4. Pre-Asia Quiet (21:00-00:00 UTC) - Low liquidity, erratic moves, wide spreads
5. Asia Lunch (03:30-05:00 UTC) - Choppy markets, whipsaws, unreliable patterns
6. Post-US Drift (20:00-21:00 UTC) - Market slows, unpredictable behavior
🌍 Automatic Timezone Conversion
Times display in YOUR chart timezone - no manual conversion needed!
Works in Berlin, New York, Tokyo, Sydney, or anywhere in the world
Switch between 12-hour and 24-hour formats
🎨 Visual Clarity
Active TRADE sessions = Bright green background, impossible to miss
Active AVOID sessions = Bright red background, clear warning
NEXT UP session = Orange highlight when between sessions
Inactive sessions = Faded gray, stays out of your way
Color-coded status column with clear ✓ TRADE or ✗ AVOID indicators
⚙️ Fully Customizable
9 table positions (top-left, top-right, bottom-center, etc.)
6 text sizes (tiny to huge) for any screen size
Toggle individual sessions on/off
Show/hide descriptions for cleaner view
Custom colors for each session type
Countdown timer toggle
🔔 Built-In Alerts
Automatic alerts when TRADE sessions start
Alerts when AVOID sessions begin (so you don't enter bad conditions)
Customizable per session
📖 How To Use
Basic Setup:
Add indicator to any crypto chart (BTC, ETH, etc.)
Times automatically convert to your chart's timezone
Watch the header - shows current session or next upcoming
Look for bright colors:
🟢 Bright green = TRADE NOW
🔴 Bright red = AVOID NOW
🟠 Orange = NEXT UP (coming soon)
Trading Strategy:
Focus on GREEN sessions (London Open, London-NY Overlap, NY Momentum)
Avoid RED sessions (Pre-Asia Quiet, Asia Lunch, Post-US Drift)
Prepare for ORANGE sessions (next up - get ready!)
Use countdown timers to plan entries/exits perfectly
Pro Tips:
London-NY Overlap is the BEST - highest volume, tightest spreads, cleanest trends
First 30 minutes of London can have quick reversals - use caution
NY Momentum is perfect for riding trends with trailing stops
NEVER trade during Asia Lunch - choppy, unpredictable, costs you money
Post-US Drift looks tempting but often leads to whipsaws
🔧 Indicator Settings
Display Options:
Table Position: Choose from 9 positions on your chart
Text Size: Auto, Tiny, Small, Normal, Large, Huge
Time Format: 12-hour (AM/PM) or 24-hour format
Show Countdown: Toggle real-time countdown timers
Show Description: Toggle detailed session descriptions
Highlight Next Session: Orange highlight for upcoming session
Session Toggles:
Enable/disable any of the 6 sessions individually:
London Open
London-NY Overlap
NY Momentum
Pre-Asia Quiet
Asia Lunch
Post-US Drift
Color Customization:
Active TRADE session color (default: bright green)
Active AVOID session color (default: bright red)
NEXT UP session color (default: orange)
Inactive session color (default: faded gray)
Alerts:
Individual alert toggles for each session
Alerts fire when sessions start (not every bar)
Includes context in alert message
📊 Session Details
🟢 London Open (07:00-09:00 UTC)
Status: TRADE ✓
Characteristics:
London opens with high volatility as European traders enter
Major institutional orders create significant price movements
Perfect for breakout and trend-following strategies
Watch for quick reversals in first 30 minutes
Good liquidity and volume
🟢 London-NY Overlap (13:30-15:30 UTC)
Status: TRADE ✓
THE BEST TRADING PERIOD!
Maximum liquidity as London & NY markets overlap
Institutional volume peaks, creating clean trends
Reliable technical setups, tightest spreads
Best execution quality
Focus on momentum and breakout trades
🟢 NY Momentum (15:30-18:00 UTC)
Status: TRADE ✓
Characteristics:
Strong directional moves as US market dominates
Trending behavior ideal for position trades
Continuation patterns highly reliable
Major news impact is highest during this period
Use trailing stops to ride trends effectively
🔴 Pre-Asia Quiet (21:00-00:00 UTC)
Status: AVOID ✗
WARNING:
Pre-Asian session with minimal liquidity
Thin order books cause erratic price action
Fake breakouts and stop-hunting common
Wide spreads increase trading costs
High risk, low reward - wait for better conditions
🔴 Asia Lunch (03:30-05:00 UTC)
Status: AVOID ✗
WARNING:
Asian lunch break creates choppy, directionless markets
Low volume leads to whipsaws and false signals
Market makers widen spreads significantly
Technical patterns unreliable
Not worth the risk - take a break!
🔴 Post-US Drift (20:00-21:00 UTC)
Status: AVOID ✗
WARNING:
Post-US session as major markets close
Liquidity dries up, causing unpredictable moves
High slippage risk
Market enters consolidation before Asian open
Better to wait for next quality session
🎯 Who Is This For?
Perfect for:
✅ Crypto day traders who want to maximize profits by timing the markets
✅ Scalpers who need high liquidity and tight spreads
✅ Swing traders who want to enter during optimal conditions
✅ Beginners who need clear guidance on when to trade
✅ Anyone tired of choppy sessions that eat away profits
Ideal Markets:
Bitcoin (BTC/USD, BTC/USDT)
Ethereum (ETH/USD, ETH/USDT)
Major altcoins (SOL, XRP, ADA, etc.)
Any 24/7 crypto market
💡 Why Session Timing Matters
Trading crypto during low-liquidity sessions is one of the biggest mistakes traders make:
❌ Trading during bad sessions causes:
Wider spreads (higher costs per trade)
Choppy, unpredictable price action
Fake breakouts and stop-hunting
Poor trade execution and slippage
Emotional frustration and overtrading
✅ Trading during optimal sessions gives you:
Tight spreads (lower costs)
Clean, trending price action
Reliable technical patterns
Better execution quality
Higher win rates and confidence
The difference between a profitable trader and a losing trader is often WHEN they trade, not HOW they trade.
🚀 Technical Details
Version: Pine Script v6
Type: Overlay indicator (table display)
Repainting: Non-repainting (all times are fixed to session schedules)
Updates: Real-time on every bar
Performance: Lightweight, no lag
Compatibility: Works on any timeframe (1m to 1D+)
📈 Best Practices
Plan your trading schedule around GREEN sessions
Set alerts for session starts so you never miss opportunities
Use the countdown to prepare entries/exits in advance
Combine with your strategy - this indicator tells you WHEN, your strategy tells you WHAT
Respect the RED sessions - discipline is profit
Keep descriptions ON when learning, turn OFF for cleaner charts later
🔄 Updates & Support
This indicator is actively maintained. Future updates may include:
Session volume statistics
Historical session performance tracking
Additional regional sessions
More customization options

SUPERTREND VALIDADO ADX EMAS VWAP # Modular Trading System - SuperTrend + ADX + Multi-Filter Confirmation
## Overview
Professional modular trading system designed for trend-following strategies on 4H timeframes. Features a clean, mobile-optimized interface with customizable filters and real-time status monitoring.
## Core Features
### Validated Components (Backtested)
- **SuperTrend (ATR 10, Multiplier 3.0)**: Primary trend direction filter with visual fill
- **ADX >23**: Trend strength confirmation (14-period)
- Proven performance: 52.11% win rate, 3.162 profit factor over 4 years
### Additional Filters (Optional)
- **DI Spread >9**: Directional movement confirmation
- **Volume > EMA20**: Volume confirmation above 20-period average
- **EMA System**: 7/21/50 with dynamic coloring
- **VWAP**: Daily volume-weighted average price
### Visual Elements
- **SuperTrend Line**: Green (bullish) / Red (bearish) with background fill
- **EMA 7**: Yellow when ADX >23, White when ADX ≤23
- **EMA 21**: Green (price above) / Red (price below)
- **EMA 50**: Blue reference line
- **VWAP**: Orange line
- **PDH/PDL**: Previous day high/low levels
- **EMA Cross Signals**: Small dots marking 7/21 crossovers
### Smart Money Concepts
- Automatic Previous Day High (PDH) / Previous Day Low (PDL) tracking
- Horizontal lines extending from current price
- Clear labeling for support/resistance levels
## Status Dashboard
Compact 2-column table (top-right) shows:
```
FILTERS | STATUS
1. ADX >23 | 47.6 OK / 18.2 NO
2. DI Spread >9 | Bullish / Bearish
3. SuperTrend | Bullish / Bearish
4. Volume >EMA20 | 1.25x OK / 0.14x NO
─────────────────────────────
SIGNAL | BUY / SELL / WAIT
```
Color-coded backgrounds:
- Green: Condition met
- Red: Condition not met
- Yellow: Waiting for confirmation
## Signal Logic
### Entry Conditions
**LONG**: All active filters must align
- SuperTrend bullish (green)
- ADX >23
- DI+ > DI- (if DI Spread enabled)
- Volume > EMA20 (if Volume enabled)
- Price > EMA21 and EMA7 > EMA21 (if EMAs enabled)
**SHORT**: All active filters must align
- SuperTrend bearish (red)
- ADX >23
- DI- > DI+ (if DI Spread enabled)
- Volume > EMA20 (if Volume enabled)
- Price < EMA21 and EMA7 < EMA21 (if EMAs enabled)
### Exit Conditions
- SuperTrend direction change
- Clear "EXIT" markers on chart
### Position Management
- One position per trend (no pyramiding)
- Prevents multiple entries in same direction
- "WAIT" status when conditions partially met
## Settings & Customization
### Filters (Enable/Disable)
**Core Filters:**
- ✓ SuperTrend (VALIDATED)
- ✓ ADX >23 (VALIDATED)
**Additional Filters:**
- ⚠️ DI Spread >9 (EXPERIMENTAL)
- ⚠️ Volume > EMA20 (EXPERIMENTAL)
- ⚠️ EMAs 7/21/50 (EXPERIMENTAL)
**Visual:**
- Show EMA 7/21 Crosses (dots)
### Parameters
**SuperTrend:**
- ATR Period: 10 (default)
- ATR Multiplier: 3.0 (default)
**ADX/DI:**
- ADX Length: 14 (default)
- ADX Threshold: 23 (default)
- DI Spread Threshold: 9 (default)
**Volume:**
- Volume EMA: 20 (default)
**EMAs:**
- Fast EMA: 7 (default)
- Medium EMA: 21 (default)
- Slow EMA: 50 (default)
## Alerts
Pre-configured alerts for:
- Long Signal (BUY - Entry confirmed)
- Short Signal (SELL - Entry confirmed)
- Exit Long (EXIT LONG - SuperTrend changed)
- Exit Short (EXIT SHORT - SuperTrend changed)
- EMA Cross Up (EMA 7 crossed above EMA 21)
- EMA Cross Down (EMA 7 crossed below EMA 21)
## Best Practices
### Recommended Setup (Validated System)
```
Enable ONLY:
- SuperTrend: ON
- ADX >23: ON
- All other filters: OFF
```
### Testing New Filters
1. Enable experimental filters
2. Backtest thoroughly before live trading
3. Compare performance metrics
4. Validate with demo account first
### Timeframe
- Optimized for: 4H charts
- Tested on: Bitcoin/USDT
- Works on: Any trending instrument
## Risk Management
This indicator provides entry/exit signals but does NOT include:
- Stop loss levels
- Take profit targets
- Position sizing
Always use proper risk management:
- Maximum 1-2% risk per trade
- Use stop losses
- Follow your trading plan
## Performance Notes
**Validated Backtest Results (SuperTrend + ADX only):**
- Win Rate: 52.11%
- Profit Factor: 3.162
- Return: +45.46% (4 years)
- Tested Period: 2020-2024
- Instrument: BTC/USDT 4H
**Important:** Adding additional filters changes the system. Results may vary. Always backtest your specific configuration before live trading.
## Mobile Optimization
- Compact table design
- Clear color coding
- Minimal chart clutter
- Large signal text
- Optimized for small screens
## Use Cases
✅ **Ideal for:**
- Trend-following strategies
- Swing trading (4H timeframe)
- Clear market conditions
- Systematic traders
❌ **NOT ideal for:**
- Scalping (too slow)
- Range-bound markets
- Counter-trend strategies
- Lateral/choppy conditions
## Credits & Methodology
Based on proven technical analysis principles:
- SuperTrend (volatility-based trend following)
- ADX (trend strength measurement)
- Directional Indicators (DI+/DI-)
- Volume analysis
- EMA systems
**Designed for:** Disciplined execution over frequent trading
**Philosophy:** Quality setups > Quantity of trades
## Disclaimer
This indicator is for educational purposes only. Past performance does not guarantee future results. Always:
- Test on demo account first
- Use proper risk management
- Never risk more than you can afford to lose
- Consult a financial advisor
Trading involves substantial risk. This tool does not constitute financial advice.
---
## Version History
**v2.0 (Current)**
- Modular filter system
- 2-column compact status table
- EMA 7 dynamic coloring (yellow when ADX >23)
- EMA 50 + VWAP added
- PDH/PDL levels
- EMA cross markers
- Improved signal logic
- One position per trend
- Multiple alert conditions
---
**For support, updates, or feedback, contact the developer.**

DeltaFlow Matrix═════════════════─────────
DELTAFLOW MATRIX - COMPLETE GUIDE
For 1-Minute Scalping
═════════════════─────────
───────────────────────────────────────
📊 VISUAL ELEMENTS EXPLAINED (What You See on the Chart)
───────────────────────────────────────
🟦🟥 RED/GREEN BARS ON THE RIGHT = Delta Flow Direction
The horizontal bars extending right from your chart show WHO controlled the price at each level. Green = bulls won, Red = bears won. Longer bars = more volume traded at that price. Example: If BTC is at $100,000 and you see a massive green bar, that means buyers aggressively absorbed all sell orders at that exact price level.
📊 GRADIENT BACKGROUND (Heat Map) = Volume Intensity
The colored background behind the bars shows volume concentration. Darker/more opaque = heavy trading, lighter/transparent = light trading. Example: A dark background at $99,800 means that's where most traders are positioned - it's a "magnet price" where BTC keeps returning.
🟩 GREEN BOX WITH BORDER = POC (Point of Control)
This is THE most important price on your chart - where the absolute highest volume traded. This is where the majority of traders are stuck. Example: POC at $99,950 means most BTC holders bought/sold there. Price will be magnetically pulled back to test this level repeatedly.
⬜ WHITE DOTTED LINES = VA High and VA Low (Value Area)
These lines contain 70% of all trading volume. Think of them as "fair price boundaries." Example: VA High at $100,200, VA Low at $99,700 means BTC's "fair value range" is $99,700-$100,200. Breakouts above/below these lines are significant moves.
💜 MAGENTA BORDER ON BARS = MICRO-SR (Micro Support/Resistance)
These magenta-outlined bars mark high-frequency support/resistance zones where price repeatedly bounced. These are your scalping zones. Example: MICRO-SR at $99,975 means BTC touched this price multiple times in the last 100 bars - it's a critical battle line for 1-minute scalpers.
🟡 GOLD TEXT "BULL EXHAUST" / "BEAR EXHAUST" = Exhaustion Zones
When one side dominated the volume BUT the trend is dying. This is where the big money got tired. Example: "BULL EXHAUST" at $100,100 means buyers pushed hard but are running out of steam - expect a reversal or consolidation soon.
🔵 CYAN TEXT "FLOW SHIFT ↑" / "FLOW SHIFT ↓" = Institutional Reversal
This is the holy grail - when delta completely flipped from bearish to bullish (or vice versa) with increasing volume. This marks where institutions changed their position. Example: "FLOW SHIFT ↑" at $99,900 means selling pressure just turned into aggressive buying - the big players reversed direction.
🟠 ORANGE TEXT "FAILED SHIFT ↑" / "FAILED SHIFT ↓" = Failed Institutional Reversal
When a FLOW SHIFT appears but then gets rejected by the opposite side within 3-10 bars. This means institutions TRIED to reverse but couldn't - the other side is defending hard. Example: "FAILED SHIFT ↑" at $99,900 means bulls attempted to take control but bears defended and stopped the reversal - this is a bearish sign, price likely continues down.
🟢 GREEN "COILED" LABEL BELOW PRICE = Bullish Compression Setup
When price is compressed below VA Low with 5+ MICRO-SR resistance levels stacked overhead AND bullish momentum is building. This is a spring-loaded long setup - price is coiled under resistance ready to explode upward. Example: BTC at $99,700, VA Low at $100,000, 7 MICRO-SR levels stacked from $100,100-$100,400, and delta shows +45 with bullish flow → "COILED" appears. This means price is compressed like a spring with bullish pressure building - when it breaks, it will rip through all those overhead levels fast.
🔴 RED "COILED" LABEL ABOVE PRICE = Bearish Compression Setup
When price is extended above VA High with 5+ MICRO-SR support levels stacked below AND bearish momentum is building. This is a spring-loaded short setup - price is coiled above support ready to crash downward. Example: BTC at $100,500, VA High at $100,200, 6 MICRO-SR levels stacked from $100,000-$99,700, and delta shows -52 with bearish flow → "COILED" appears. This means price is compressed with bearish pressure building - when it breaks down, it will slice through all those support levels.
🔴🟢 "REJECT" LABEL = Failed Breakout / Rejection
When price enters a cluster zone (resistance or support) but shows opposite momentum - the breakout attempt failed. Example: Price pushed up into overhead resistance at $100,200 but delta turns bearish (-38) → "REJECT" appears in red above price. This means the breakout attempt was rejected, bulls who entered are trapped, expect reversal down.
⚠️ "WALL ↑" / "WALL ↓" = Resistance/Support Wall Alert
When 5+ MICRO-SR levels are stacked together creating a "wall" of resistance or support. These are significant barriers where price will likely stall or reverse. Example: "WALL ↑ 7x" means there are 7 MICRO-SR resistance levels stacked above current price - breaking through this will be very difficult without strong momentum and volume.
🔴🟢 "BULL ATTACK" / "BEAR ATTACK" = Aggressive Momentum
One side is attacking with both high delta AND increasing volume. This is active warfare. Example: "BEAR ATTACK" at $100,050 means sellers are aggressively dumping with rising volume - price is likely to drop fast.
🛡️ "BULL DEFENSE" / "BEAR DEFENSE" = Holding the Line
One side has high delta but volume is flat or decreasing - they're defending a level, not pushing. Example: "BULL DEFENSE" at $99,850 means buyers are absorbing sells to prevent BTC from dropping further, but they're not strong enough to push up yet.
⚖️ "EQUILIBRIUM" / "ROTATION" = Balanced Market
Bulls and bears are equally matched - perfect for range trading, terrible for breakout trades. Example: "EQUILIBRIUM" at $100,000 means the market is perfectly balanced here - trade the range, don't chase breakouts.
📈📉 "UP" / "DN" ARROWS = Volume Trend
Small green "UP" or red "DN" labels show if volume is increasing or decreasing at that price level over time. Example: "UP" at $99,900 means more traders are entering positions at this price compared to earlier - this level is becoming more important.
⇈⇊ DOUBLE ARROWS = Delta Momentum Acceleration
These show when delta is accelerating rapidly - not just strong, but GETTING STRONGER. Example: ⇈ at $100,050 means bullish delta isn't just high, it's accelerating - expect explosive upward movement.
🟢🔴 VELOCITY BANDS (Horizontal bars far right) = Volume Acceleration
Thin horizontal bars extending from the profile show how fast volume is building. Green = volume accelerating up, Red = volume accelerating down. Example: Green velocity band at $100,100 means volume is spiking at this level right now - action is heating up.
💜 "x3.8" LABEL ABOVE CANDLE = Volume Spike Signal
Magenta text showing volume multiplier. Example: "x3.2" above a BTC candle means this candle had 3.2 times the average volume - something big just happened (news, liquidation cascade, whale entry).
🟢🔴 THICK LINE AT VA HIGH/LOW = Breakout with Momentum
When BTC breaks the VA line, the line changes:
- Thin line (width 2) = Weak breakout (<30Δ momentum)
- Medium line (width 3) = Medium breakout (30-60Δ)
- Thick dashed line (width 4) = STRONG breakout (>60Δ) - THIS IS THE FLASH
The label also changes: "VA High 72Δ V✓ STRONG" = 72 delta momentum, volume confirmed, strong breakout.
🔵 CYAN DASHED LINE AT POC = POC Bounce Flash
A short cyan dashed line appears when BTC bounces off the POC with a bullish reversal candle. This is your highest-probability long entry - the POC "magnet" just pulled price back and bulls are responding.
───────────────────────────────────────────────
🧠 PATTERN COMBINATIONS = Market Psychology (What Traders Are Thinking)
───────────────────────────────────────────────
🚀 PATTERN 1: "The Nitro Boost" (Highest Win Rate)
WHAT YOU SEE: FLOW SHIFT ↑ appears below current price + only MICRO-SR (magenta) levels above + Volume Spike (x2.5+)
PSYCHOLOGY: Big money just reversed from selling to buying. Retail still thinks it's going down. All the nearby resistance levels are weak (just micro-levels). The explosion in volume means someone BIG just entered.
EXAMPLE: BTC at $99,900, FLOW SHIFT ↑ just appeared, above you see MICRO-SR at $100,000, $100,050, $100,100 with no major resistance. Volume spike shows x3.1. → Institutions flipped bullish and the path of least resistance is UP. These MICRO-SR levels will be blown through like paper.
TRADE: Long immediately, targets at each MICRO-SR level, stop below the FLOW SHIFT price.
💎 PATTERN 2: "The Wall" (Reversal Setup)
WHAT YOU SEE: BULL/BEAR EXHAUST at a price level + Price approaching POC from above/below + Delta momentum arrows (⇊) pointing opposite to price movement
PSYCHOLOGY: One side pushed too hard and ran out of gas right as they're approaching the most important price level (POC). Delta momentum is reversing. The "wall" of volume at POC will reject them.
EXAMPLE: BTC pushed from $99,800 to $100,200, now "BULL EXHAUST" appears at $100,200. POC is at $100,000. You see ⇊ (bearish delta acceleration). → Bulls exhausted themselves pushing up, POC will act as resistance, bears are accelerating. Price will get rejected back down.
TRADE: Short at current price, target is POC at $100,000, stop above the exhaust level.
⚔️ PATTERN 3: "The War Zone" (Stay Out)
WHAT YOU SEE: BULL ATTACK and BEAR ATTACK labels alternating rapidly + EQUILIBRIUM or ROTATION at current price + VA lines very close together
PSYCHOLOGY: Bulls and bears are in full battle mode, neither side is winning. The market is chopping violently in a tight range. This is where retail gets destroyed by whipsaw.
EXAMPLE: BTC bouncing between $99,900-$100,100. "BULL ATTACK" at $100,000, "BEAR ATTACK" at $100,050, "EQUILIBRIUM" at $100,025. VA High at $100,100, VA Low at $99,900. → Pure chaos. Both sides throwing punches, nobody winning.
TRADE: STAY OUT. Wait for exhaustion or flow shift. If you must trade, use very tight ranges (buy at VA Low, sell at VA High, 5-tick stops).
🎯 PATTERN 4: "The Breakout Confirmation" (High Confidence)
WHAT YOU SEE: VA breakout with STRONG label + Volume spike (x2.0+) + FLOW SHIFT in breakout direction + No major resistance for 50+ ticks
PSYCHOLOGY: Every signal is aligned. Price broke the fair value range WITH strong momentum, WITH volume confirmation, WITH institutional flow reversal. This is the "perfect storm" breakout.
EXAMPLE: BTC breaks VA High at $100,200. Label changes to "VA High 68Δ V✓ STRONG" (thick dashed line). Volume spike shows x2.8. FLOW SHIFT ↑ appears at $100,210. Next resistance is MICRO-SR at $100,400. → This is as good as it gets. Institutions are buying, retail FOMO is coming, momentum is strong.
TRADE: Long on the breakout, targets at +100 ticks ($100,300), +200 ticks ($100,400), trail stop below the breakout candle.
🛡️ PATTERN 5: "The Failed Breakout" (Fade Setup)
WHAT YOU SEE: VA breakout with WEAK label + No volume spike + DEFENSE label appears (opposite side) + Delta momentum arrows pointing back into VA
PSYCHOLOGY: Price tried to break out but without conviction. No volume = no big players interested. The defending side is holding the line. Breakout traders are about to get trapped.
EXAMPLE: BTC breaks VA High at $100,200. Label shows "VA High 23Δ WEAK" (thin line). No volume spike. "BEAR DEFENSE" appears at $100,220. You see ⇊ (bearish acceleration). → Weak breakout, bears defending, momentum reversing. Bull breakout traders are trapped.
TRADE: Short the failed breakout, target is back inside VA (POC at $100,000), stop above the high.
🧲 PATTERN 6: "The POC Magnet" (Mean Reversion)
WHAT YOU SEE: Price far from POC (100+ ticks away) + Volume decreasing (DN arrows) + No ATTACK or FLOW SHIFT labels + MICRO-SR levels between current price and POC
PSYCHOLOGY: Price overextended from the most important level. No new aggressive volume is coming in. Market is tired. Like a rubber band, price will snap back to POC where most traders are positioned.
EXAMPLE: BTC at $100,350, POC at $100,000 (350 ticks away). "DN" arrows showing volume declining. "ROTATION" at current price. MICRO-SR at $100,300, $100,200, $100,100. → Overextended, running out of steam, POC will pull it back.
TRADE: Short with targets at each MICRO-SR level on the way down to POC, final target at POC itself.
💥 PATTERN 7: "The Liquidation Cascade" (Momentum Continuation)
WHAT YOU SEE: Multiple consecutive candles with volume spikes (x2.5+) + ATTACK label same direction + Delta momentum arrows same direction (⇈ or ⇊) + Breaking through MICRO-SR levels without stopping
PSYCHOLOGY: Liquidations are triggering more liquidations. Stop losses are getting hit, triggering more stop losses. This is a cascade - it won't stop until hitting POC or VA boundary. Retail is getting destroyed, institutions are feasting.
EXAMPLE: BTC drops from $100,200. Candles show x2.7, x3.1, x2.9 volume spikes. "BEAR ATTACK" at every level. ⇊ arrows accelerating. MICRO-SR levels at $100,100, $100,000, $99,900 all getting destroyed. POC at $99,750. → Liquidation cascade in progress. Won't stop until POC.
TRADE: If you're in the direction, hold until POC. If not in, wait for POC to enter counter-trend. DO NOT try to catch this knife early.
🔄 PATTERN 8: "The Reversal Confirmation" (Highest Probability Entry)
WHAT YOU SEE: POC Bounce Flash (cyan dashed line) + FLOW SHIFT in new direction + Volume spike + Price bouncing off POC with bullish/bearish engulfing candle
PSYCHOLOGY: Price hit the most important level (POC) and institutions just reversed direction. This is THE signal. The magnet worked, price came back to POC, and big money is now pushing it the other way.
EXAMPLE: BTC drops to POC at $100,000. Cyan dashed POC bounce flash appears. Bullish engulfing candle. "FLOW SHIFT ↑" appears. Volume spike x2.6. → Perfect reversal setup at the most important price level with institutional confirmation.
TRADE: Long at POC, target next MICRO-SR or VA High, stop below POC. This is your highest win-rate setup.
🎪 PATTERN 9: "The Fake-Out Trap" (Avoid or Fade)
WHAT YOU SEE: FLOW SHIFT appears + No volume spike + EXHAUST label appears within 3-5 candles same direction + Delta momentum arrows reverse
PSYCHOLOGY: Someone tried to fake a reversal (maybe a whale painting the tape) but there's no real follow-through. The move exhausted immediately. Traders who followed the FLOW SHIFT are about to get trapped.
EXAMPLE: "FLOW SHIFT ↑" appears at $99,950. No volume spike. Within 3 candles, "BULL EXHAUST" appears at $100,000. ⇊ arrows appear. → False reversal, trap set, traders entering longs are getting baited.
TRADE: Fade it. Short when exhaust appears, target back below the fake FLOW SHIFT level.
🏆 PATTERN 10: "The Perfect Storm Long" (All Systems Go)
WHAT YOU SEE: Price above POC + FLOW SHIFT ↑ + VA Low breakout with STRONG + Volume spike + Only MICRO-SR resistance above + BULL ATTACK label + ⇈ acceleration
PSYCHOLOGY: Everything aligned bullish. Institutions buying, momentum strong, volume confirming, path clear. This is when retail FOMO kicks in and you get the biggest moves.
EXAMPLE: BTC at $100,100. POC at $100,000 (above POC ✓). "FLOW SHIFT ↑" at $100,050 ✓. "VA Low 71Δ V✓ STRONG" breakout ✓. Volume x3.4 ✓. MICRO-SR at $100,300, $100,500 (weak resistance) ✓. "BULL ATTACK" ✓. ⇈ arrows ✓. → Every single bullish signal firing. This is the setup you wait for all day.
TRADE: Long with size, targets at +200 ticks minimum, trail aggressively, stop only if FLOW SHIFT reverses.
🎯 PATTERN 11: "The Coiled Spring" (High Probability Breakout)
WHAT YOU SEE: "COILED" label appears + 5-8 MICRO-SR levels stacked in breakout direction + Delta +30 or higher (for long) / -30 or lower (for short) + Price compressed below VA Low (long) or above VA High (short)
PSYCHOLOGY: Price is compressed in a weak position with heavy resistance/support overhead, BUT institutions are building momentum in the direction of the breakout. When it breaks, all those clustered MICRO-SR levels will be blown through rapidly because the spring is loaded. This is the setup where you get 100-200 tick moves in minutes.
EXAMPLE: BTC at $99,650. VA Low at $100,000. "COILED" (green) appears below price. WALL ↑ 8x showing 8 MICRO-SR levels from $100,100-$100,800. Delta shows +47. FLOW SHIFT ↑ just appeared. → Price is coiled below massive resistance wall with strong bullish momentum building. When VA Low breaks, the spring releases and price will rip through all 8 resistance levels.
TRADE: Long when price breaks VA Low with volume confirmation, targets at each MICRO-SR cluster (+100, +200, +300 ticks), trail stop below breakout candle. This is your "moonshot" setup.
🛑 PATTERN 12: "The Failed Shift Trap" (Fade Setup)
WHAT YOU SEE: "FAILED SHIFT ↑" or "FAILED SHIFT ↓" appears + Strong opposite momentum (⇊ for failed bull shift, ⇈ for failed bear shift) + No volume spike + Price back in original range
PSYCHOLOGY: Institutions attempted a reversal but the other side defended hard and rejected it. Traders who followed the FLOW SHIFT are now trapped. The failed reversal confirms the original trend will continue - the defending side is in control.
EXAMPLE: BTC pushed from $100,200 to $99,900. "FLOW SHIFT ↓" appeared at $100,100 signaling bearish reversal. Within 5 bars, bulls defended at $99,850, pushing price back to $100,000. "FAILED SHIFT ↓" now appears at $100,100 with ⇈ (bullish acceleration). → Bears tried to reverse trend but failed. Bulls defended successfully. Original uptrend continues.
TRADE: Fade the failed shift. If "FAILED SHIFT ↓" appears, go long (bulls won the battle). If "FAILED SHIFT ↑" appears, go short (bears won). Target is back to the other side of the range.
⚠️ PATTERN 13: "The Wall Collision" (High Risk, High Reward)
WHAT YOU SEE: "WALL ↑" or "WALL ↓" with 6+ levels + Price approaching wall with strong momentum (ATTACK label) + Volume spike + Delta accelerating (⇈ or ⇊)
PSYCHOLOGY: Unstoppable force meeting immovable object. Price is charging at a massive wall of resistance/support with strong momentum. Either it breaks through explosively OR it gets rejected violently. This is binary - huge win or huge loss.
EXAMPLE: BTC at $100,050 with "BULL ATTACK" and ⇈ arrows. Volume x3.2. Approaching "WALL ↑ 9x" at $100,200-$100,600. POC at $100,300 (inside the wall). → Bulls charging at massive resistance wall with strong momentum. If they break through, it's explosive. If rejected, crash back down.
TRADE: ADVANCED ONLY. Wait for the collision. If price breaks through wall with FLOW SHIFT confirmation + volume spike, go long immediately with tight stop. If price gets REJECTED (bearish delta appears at wall), short immediately targeting POC. DO NOT enter before knowing the outcome.
🔄 PATTERN 14: "The Rejection Reversal" (Counter-Trend Entry)
WHAT YOU SEE: "REJECT" label appears + Price in cluster zone + Opposite side DEFENSE or ATTACK label appears + Delta momentum reverses (⇈ to ⇊ or vice versa)
PSYCHOLOGY: The breakout failed, trapped traders are exiting, and the opposite side is now attacking the weak hands. This creates fast moves back in the original direction.
EXAMPLE: BTC breaks VA High to $100,250. Weak volume, delta only +22. Enters overhead MICRO-SR cluster. "REJECT" appears in red. "BEAR DEFENSE" appears at $100,280. ⇊ arrows appear. → Breakout failed, bulls trapped, bears attacking. Price will reverse fast.
TRADE: Counter-trend entry in direction of REJECT. Short when "REJECT" appears with bearish confirmation, target is back to POC or VA Low. Stop above the rejection high. Fast scalp.
───────────────────────────────────────────────────────────────────────────────
⚡ QUICK REFERENCE CHEAT SHEET
───────────────────────────────────────────────────────────────────────────────
SAFEST ENTRIES (Highest Win Rate):
✅ POC Bounce Flash + FLOW SHIFT (Pattern 8)
✅ FLOW SHIFT + Only MICRO-SR above + Volume Spike (Pattern 1)
✅ Strong VA Breakout + Volume Spike + FLOW SHIFT (Pattern 4)
✅ COILED label + Multiple stacked MICRO-SR + Delta >30 (Pattern 11)
DANGER ZONES (Stay Out):
⛔ BULL ATTACK + BEAR ATTACK alternating (Pattern 3)
⛔ FLOW SHIFT + No volume + Quick exhaust (Pattern 9)
⛔ EQUILIBRIUM at current price with tight VA range
⛔ WALL collision without clear direction (Pattern 13 - wait for outcome)
FADE/REVERSAL SETUPS:
🔄 EXHAUST at price level + Approaching POC (Pattern 2)
🔄 Weak VA Breakout + DEFENSE opposite side (Pattern 5)
🔄 Price far from POC + Volume declining (Pattern 6)
🔄 FAILED SHIFT appears + Opposite momentum (Pattern 12)
🔄 REJECT label + Opposite ATTACK/DEFENSE (Pattern 14)
HOLD/MOMENTUM CONTINUATION:
🚀 Multiple volume spikes + ATTACK label + ⇈/⇊ arrows (Pattern 7)
🚀 All bullish/bearish signals aligned (Pattern 10)
🚀 COILED spring release through wall (Pattern 11)
═══════════════════════════════════════════════════════════
Remember: The indicator shows you WHERE the big money is (POC), WHAT they're doing (FLOW SHIFT), and HOW HARD they're doing it (volume spikes, momentum). Your job is to follow the big money, not fight them. When institutions shift, you shift. When they exhaust, you fade. When they're in a war, you stay out. Trade with the whales, not against them.
════════════════════════════════════════════════════════════
═══════════════════════════════════════════════════════════════════════════════
ENHANCED DELTA VOLUME PROFILE - TECHNICAL CALCULATIONS GUIDE
How Each Element is Actually Calculated
═══════════════════════════════════════════════════════════════════════════════
───────────────────────────────────────────────────────────────────────────────
🧮 CORE CALCULATIONS (The Math Behind What You See)
───────────────────────────────────────────────────────────────────────────────
📊 VOLUME BINS = Price range divided into 40 horizontal slices
The indicator takes the last 100 candles (configurable), finds the highest and lowest price touched, then divides that range into 40 equal "bins" (horizontal price levels). Each bin collects volume from candles that touched that price range. Example: BTC ranged from $99,500 to $100,500 in the last 100 bars. That's $1,000 range ÷ 40 bins = $25 per bin. Bin 1 = $99,500-$99,525, Bin 2 = $99,525-$99,550, etc.
🟦🟥 DELTA CALCULATION = (Bull Volume - Bear Volume) / Total Volume × 100
For each bin, the indicator separates bullish candles (close > open) from bearish candles (close < open). Delta = ((bull volume - bear volume) / total volume) × 100. This gives you a percentage from -100% (pure selling) to +100% (pure buying). Example: At $100,000, if 70 BTC was traded on green candles and 30 BTC on red candles, delta = ((70-30)/100) × 100 = 40% bullish.
🎨 GRADIENT COLOR = Delta converted to color spectrum
The delta percentage (-100 to +100) is mapped to a color gradient. -100% = pure bearish color (orange/red), 0% = neutral, +100% = pure bullish color (cyan/blue). The color you see on each bar directly represents the delta. Example: A bright cyan bar = high positive delta (strong buying), orange bar = high negative delta (strong selling), gray bar = balanced (delta near 0%).
🟩 POC (Point of Control) = Bin with the absolute highest total volume
The indicator sums up all volume in each of the 40 bins, then finds which bin has the most. That's your POC. Example: Bin 15 (around $100,000) collected 1,250 BTC of volume, which is more than any other bin. Bin 15 is your POC. This is where the most trading happened and where most traders are positioned.
⬜ VALUE AREA (VA) = The bins containing 70% of total volume, centered on POC
Starting from the POC, the indicator expands up and down, adding bins one at a time (choosing the bin with more volume each time) until it has captured 70% of all volume. The top of this range = VA High, bottom = VA Low. Example: POC at $100,000. Expanding out captures 70% of volume from $99,700 to $100,300. VA Low = $99,700, VA High = $100,300.
📈📉 VOLUME TREND = (Recent Volume - Old Volume) / Total Volume
The indicator splits your 100-bar lookback into three periods: Recent (last 15 bars), Mid (bars 15-30), and Older (last 15 bars of the 100). For each bin, it compares recent volume to older volume. If recent > older, trend is UP. If recent < older, trend is DOWN. Example: At $100,000, recent 15 bars had 80 BTC volume, older 15 bars had 40 BTC. Trend = (80-40)/(80+40) = 0.33 = UP. This shows volume is increasing at this level.
💜 MICRO-SR DETECTION = High volume (>60% of max) + High hits (>20% of max) + Active volume trend
A bin becomes MICRO-SR if: (1) Its volume is at least 60% of the highest-volume bin, (2) Price touched it frequently (at least 20% as many times as the most-touched bin), (3) Volume trend isn't flat (absolute trend > 0.05). Example: Bin at $99,975 has 750 BTC (75% of max), was hit 45 times (30% of max hits), volume trend = 0.08. = MICRO-SR (magenta border).
🟡 EXHAUSTION DETECTION = Extreme delta (>65%) + Declining volume trend (<-0.15) OR Extreme delta + Volume spike (>1.5× average)
Two ways to detect exhaustion: (1) One side dominated (delta > 65% or < -65%) BUT volume is decreasing (trend < -0.15), meaning participation is dropping. (2) Extreme delta WITH a huge volume spike (>1.5× average for that bin), meaning climactic volume. Example: At $100,200, delta = 72% bullish, but volume trend = -0.22 (declining). = BULL EXHAUST. Bulls won but are running out of steam.
🔵 FLOW SHIFT DETECTION = Delta changed sign (+ to - or - to +) + Delta change >40% + Volume trend increasing (>0.1)
Compares each bin's delta to the previous bin's delta. If delta flipped from negative to positive (or vice versa) by more than 40%, AND volume is increasing, = FLOW SHIFT. Example: Previous bin at $99,950 had -35% delta (bearish). Current bin at $100,000 has +45% delta (bullish). Change = 80% (flipped + exceeded 40%), volume trend = +0.15. = FLOW SHIFT ↑.
⇈⇊ DELTA MOMENTUM = Current delta - Average delta of last 3 bins
For each bin, the indicator looks at the previous 3 bins, calculates their average delta, then compares current delta to that average. If current delta is significantly higher/lower than the 3-bin average, momentum arrows appear. Example: Last 3 bins had deltas of 20%, 25%, 30% (average = 25%). Current bin delta = 55%. Momentum = 55 - 25 = +30 = ⇈ (strong bullish acceleration).
🟢🔴 VOLUME ACCELERATION = Rate of change of volume trend across three periods
Compares how volume changed from Old→Mid vs Mid→Recent. If Recent increased MORE than Mid did compared to Old, = positive acceleration. Formula: ((Recent-Mid) - (Mid-Old)) / |Mid-Old|. Example: Old=100, Mid=120, Recent=160. Mid increased by 20, Recent increased by 40. Acceleration = (40-20)/20 = 1.0 = strong acceleration (green velocity band).
⚖️ BALANCE SCORE = Combines volume balance, price range balance, and hit frequency
Three factors weighted equally: (1) How balanced is bull vs bear volume? (1 - |bull-bear|/total). (2) How tight is the price range? (1 - avgRange/maxRange). (3) How frequently was it hit? (hits/maxHits). Multiply these together. Score >0.7 = EQUILIBRIUM. Example: Volume is 55% bull / 45% bear = 0.9 balance. Range is tight = 0.8. Hit frequently = 0.85. Score = 0.9 × 0.8 × 0.85 = 0.61 = ROTATION.
📊 BULL/BEAR ATTACK/DEFENSE = Delta threshold (>60% or <-60%) + Volume trend direction
ATTACK = High delta (>60% either direction) + Volume trend increasing (>0.15). DEFENSE = High delta (>60% either direction) + Volume trend NOT increasing (≤0.15). Example: Delta = 68% bullish, volume trend = 0.22 = BULL ATTACK (buying with increasing volume). Delta = 68% bullish, volume trend = 0.05 = BULL DEFENSE (buying but volume not increasing).
───────────────────────────────────────────────────────────────────────────────
🎯 SIGNAL CALCULATIONS (The New Features)
───────────────────────────────────────────────────────────────────────────────
💜 VOLUME SPIKE = Current bar volume / 20-bar average volume
Takes the current candle's volume and divides it by the simple moving average of the last 20 candles' volume. If ratio >2.0 (configurable), spike detected. The label shows the exact multiplier. Example: Current candle = 450 BTC volume. 20-bar average = 140 BTC. Ratio = 450/140 = 3.21 = "x3.2" label appears in magenta above the candle.
🟢🔴 VA BREAKOUT MOMENTUM = POC bin's delta (absolute value)
When price breaks VA High or VA Low, the indicator looks at the POC bin's delta to measure momentum strength. Uses absolute value (ignore direction). <30 = WEAK, 30-60 = MED, >60 = STRONG. Line thickness and style change based on this. Example: BTC breaks VA High. POC bin delta = 72%. Momentum = 72 = STRONG. Line = width 4 (thick), dashed (flash effect), label shows "VA High 72Δ V✓ STRONG".
📊 BREAKOUT LINE THICKNESS = Momentum-based dynamic sizing
- Momentum <30: Line width = 2 (thin), solid line
- Momentum 30-60: Line width = 3 (medium), solid line
- Momentum >60: Line width = 4 (thick), dashed line (creates flash effect)
Example: Breakout with 45% momentum = width 3 solid line. Breakout with 75% momentum = width 4 dashed line (flashing).
✓ VOLUME CONFIRMATION = Current volume / 20-bar average >1.5
Checks if the breakout candle has strong volume. If current volume is at least 1.5× the 20-bar average, adds "V✓" to the label. Example: Breakout candle has 280 BTC volume, 20-bar average is 160 BTC. Ratio = 280/160 = 1.75 > 1.5 = "V✓" appears in label.
🔵 POC BOUNCE DETECTION = Price within 0.5 bin-step of POC + Bullish reversal candle + Previous candle was bearish
Three conditions must all be true: (1) Current close price is within half a bin's height from POC price. (2) Current candle is bullish (close > open). (3) Previous candle was bearish (close < open). If all true = POC bounce, cyan dashed flash line appears. Example: POC at $100,000, bin step = $25. Current close = $100,008 (within $12.50 of POC ✓). Current candle green ✓. Previous candle red ✓. = POC Bounce Flash.
───────────────────────────────────────────────────────────────────────────────
⚙️ TECHNICAL PARAMETERS (What You Can Adjust)
───────────────────────────────────────────────────────────────────────────────
🔢 LOOKBACK PERIOD (Default: 100 bars) = How much history to analyze
The number of candles backwards from current that get analyzed. More bars = more stable but slower to react. Fewer bars = more reactive but noisier. For 1-minute BTC scalping, 100 bars = last 100 minutes = 1 hour 40 minutes of data. Example: Setting to 50 bars makes it more reactive to recent action but less stable. Setting to 200 bars makes it smoother but slower to show new developments.
🎚️ NUMBER OF BINS (Default: 40) = Resolution of price levels
How many horizontal slices to divide the price range into. More bins = finer resolution but more noise. Fewer bins = smoother but less precise. 40 bins for 1-minute = good balance. Example: With $1,000 range, 40 bins = $25 per level. 20 bins would be $50 per level (less precise). 60 bins would be $16.67 per level (more precise but noisier).
📏 DISPLAY OFFSET (Default: 10 bars) = How far right the profile extends
How many bars to the right of current candle the volume profile displays. Purely visual - doesn't affect calculations. Example: Offset = 10 means the profile extends 10 bars to the right. Offset = 30 means it extends further right (more separation from candles).
📊 VOLUME TREND PERIOD (Default: 15 bars) = How many recent bars define "recent"
The number of bars considered "recent" vs "old" when calculating volume trends. Shorter = more sensitive to very recent changes. Longer = smoother trends. Example: 15 bars means "recent" = last 15 candles (last 15 minutes on 1m chart). Setting to 5 would make it hyper-reactive to the last 5 minutes. Setting to 30 would make it smoother.
🎯 EXHAUSTION THRESHOLD (Default: 65%) = How extreme delta must be for exhaustion
The minimum delta percentage to trigger exhaustion detection. Higher = more selective (only extreme cases). Lower = more signals but more false positives. Example: 65% means delta must be >65% or <-65% to qualify. Setting to 75% would only catch the most extreme exhaustion. Setting to 55% would catch more cases.
💜 MICRO-LEVEL THRESHOLD (Default: 60%) = How strong a level must be for MICRO-SR
The minimum volume percentage (relative to max) required for MICRO-SR detection. Higher = fewer, stronger levels. Lower = more levels but weaker. Example: 60% means bin must have at least 60% of the max bin's volume. Setting to 70% would show only the strongest levels. Setting to 50% would show more levels.
⚡ DELTA MOMENTUM PERIOD (Default: 3 bars) = How many bins to average for momentum
How many previous bins to average when calculating delta momentum. Shorter = more sensitive acceleration signals. Longer = smoother, less noisy. Example: 3 bins means compares current to average of last 3. Setting to 5 would smooth out momentum detection. Setting to 2 would make it more reactive.
🌊 FLOW SHIFT SENSITIVITY (Default: 40%) = Minimum delta change for flow shift
How much delta must change between consecutive bins to trigger FLOW SHIFT. Lower = more flow shift signals (more sensitive). Higher = fewer, stronger signals. Example: 40% means delta must flip by at least 40% (e.g., from -20% to +20% or from +10% to -30%). Setting to 60% would only catch major reversals. Setting to 25% would catch smaller shifts.
💥 VOLUME SPIKE THRESHOLD (Default: 2.0x) = Multiplier to trigger spike signal
How many times above average volume must be to show the spike label. Higher = fewer spikes shown (only extreme). Lower = more spikes shown. Example: 2.0× means current volume must be at least double the 20-bar average. Setting to 3.0× would only show massive spikes. Setting to 1.5× would show more moderate spikes.
🚀 BREAKOUT MOMENTUM MINIMUM (Default: 20%) = Minimum delta for breakout signal
How much delta momentum required at POC for VA breakout to trigger. Higher = fewer breakout signals (more selective). Lower = more signals but more false positives. Example: 20% means POC delta must be at least 20% (or -20%) when price breaks VA. Setting to 30% would only show strong breakouts. Setting to 10% would show weaker breakouts too.
───────────────────────────────────────────────────────────────────────────────
🔬 ADVANCED TECHNICAL DETAILS
───────────────────────────────────────────────────────────────────────────────
📐 BIN POSITIONING = Price-to-bin mapping formula
For any price P, its bin index = floor((P - MinPrice) / BinStep). BinStep = (MaxPrice - MinPrice) / NumBins. Example: Range $99,000-$100,000, 40 bins. BinStep = $1,000/40 = $25. Price $99,550 → Bin 22: (99,550 - 99,000) / 25 = 22.
📊 VOLUME DISTRIBUTION = Proportional allocation across bins
When a candle spans multiple bins, its volume is distributed proportionally based on how much of the candle's range overlapped each bin. Example: Candle from $99,950 to $100,050 (range = $100) with 50 BTC volume. Bin 1 ($99,950-$99,975) gets 25% of range = 12.5 BTC. Bin 2 ($99,975-$100,000) gets 25% = 12.5 BTC. Bin 3 ($100,000-$100,025) gets 25% = 12.5 BTC. Bin 4 ($100,025-$100,050) gets 25% = 12.5 BTC.
🎨 COLOR GRADIENT MAPPING = Delta to RGB conversion
Delta percentage is normalized to 0-1 scale (from -100/+100 range), then mapped to RGB gradient. -100% (0.0) = Full bearish color RGB. 0% (0.5) = Neutral gray. +100% (1.0) = Full bullish color RGB. Example: Delta = 60% → Normalized = 0.8 → 80% towards full bullish color (bright cyan).
⚖️ BALANCE SCORE FORMULA = Weighted geometric mean
BalanceScore = (VolumeBalance^w) × (PriceBalance^w) × (HitBalance^w), where w=weight (default 1.0). VolumeBalance = 1 - |BullVol - BearVol|/TotalVol. PriceBalance = 1 - AvgRange/MaxRange. HitBalance = Hits/MaxHits. Example: Vol=0.9, Price=0.8, Hit=0.7 → Score = 0.9 × 0.8 × 0.7 = 0.504.
🔄 DELTA HISTORY TRACKING = Rolling array per bin
Each bin maintains an array of its last N delta values (where N = delta momentum period). When calculating momentum, current delta is compared to the average of this array. Example: Bin's delta history = . Average = 25%. Current = 55%. Momentum = 55 - 25 = 30.
📈 VOLUME VELOCITY = Second derivative of volume
Measures acceleration of volume change. Recent change = (Recent - Mid). Old change = (Mid - Old). Acceleration = (Recent change - Old change) / |Old change|. Positive = accelerating. Negative = decelerating. Example: Old=100, Mid=150, Recent=220. Recent change = 70. Old change = 50. Accel = (70-50)/50 = 0.4 = 40% acceleration.
🎯 VA EXPANSION ALGORITHM = Greedy breadth-first from POC
Start at POC bin. While accumulated volume < 70% of total: Look at bin above and bin below POC boundary. Choose whichever has more volume. Add that bin to VA. Repeat. Example: POC at bin 20. Bin 21 (above) has 80 BTC, Bin 19 (below) has 95 BTC. Add bin 19. Now VA = bins 19-20. Next: Bin 21 has 80, Bin 18 has 70. Add bin 21. VA = bins 19-21. Continue until 70% captured.
⏱️ REAL-TIME UPDATES = Recalculates on every new bar close
The entire profile recalculates when barstate.islast = true (current bar). All 40 bins are cleared and rebuilt from scratch using the last N candles. This ensures the profile is always accurate to the current market state. Example: On 1-minute chart, the profile fully recalculates every 60 seconds when the new candle opens.
🎨 RENDERING OPTIMIZATION = 500-bar future limit management
TradingView limits drawing objects to 500 bars into the future. The indicator calculates safe offsets: maxFutureBar = bar_index + 499, then caps all box/line/label positions to stay under this limit. Example: Current bar_index = 1000. Max future = 1499. Display offset wanted = 200. Safe offset = min(200, 400 - 100) = min(200, 300) = 200 ✓ safe.
───────────────────────────────────────────────────────────────────────────────
💡 INTERPRETATION TIPS
───────────────────────────────────────────────────────────────────────────────
🔢 Understanding Percentages:
- Delta 0-30%: Weak bias, essentially balanced
- Delta 30-60%: Moderate bias, one side has control
- Delta 60-85%: Strong bias, one side dominated
- Delta 85-100%: Extreme bias, one-sided market (exhaustion likely)
📊 Volume Trend Interpretation:
- Trend -1.0 to -0.3: Strong decline in participation
- Trend -0.3 to -0.1: Moderate decline
- Trend -0.1 to +0.1: Stable/flat volume
- Trend +0.1 to +0.3: Moderate increase
- Trend +0.3 to +1.0: Strong increase in participation
🎯 Balance Score Ranges:
- 0.0-0.3: Heavily imbalanced, strong directional bias
- 0.3-0.5: Moderate imbalance, rotation forming
- 0.5-0.7: Balanced rotation zone
- 0.7-1.0: Perfect equilibrium, range-bound
⚡ Momentum Thresholds:
- <10: Negligible momentum change
- 10-20: Moderate acceleration
- 20-40: Strong acceleration (arrow appears)
- >40: Extreme acceleration (very rare, very significant)
═══════════════════════════════════════════════════════════════════════════════
Understanding these calculations helps you know WHY the indicator is showing what it's showing. When you see "FLOW SHIFT ↑", you now know it calculated a >40% delta flip with increasing volume. When you see MICRO-SR, you know that level has >60% of max volume, >20% of max hits, and active participation. When you see ⇈, you know delta jumped significantly above its 3-bin average. Use this knowledge to trust the signals and understand their strength.
═══════════════════════════════════════════════════════════════════════════════

Crypto Correlation Oscillator# Crypto Correlation Oscillator
**Companion indicator for Tri-Align Crypto Trend**
## Overview
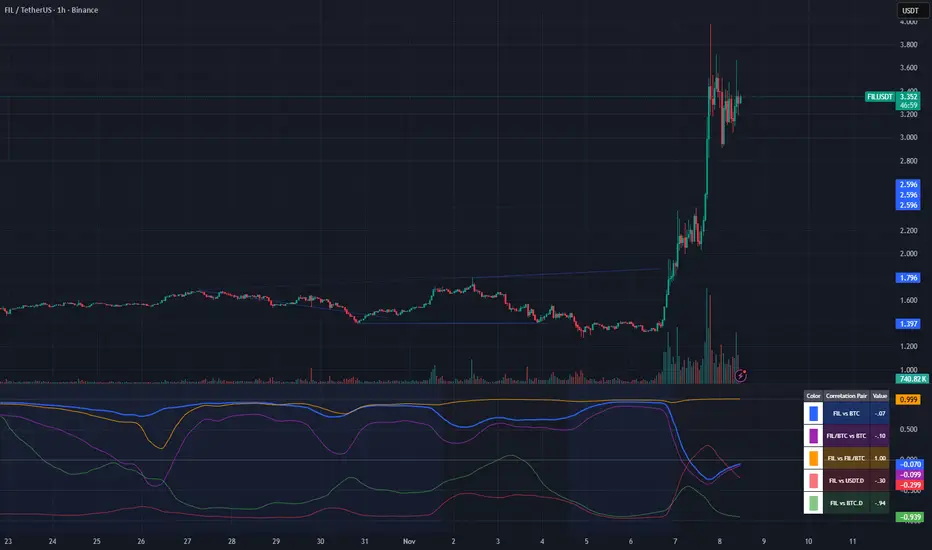
The Crypto Correlation Oscillator helps you identify **alpha opportunities** and **market regime changes** by showing how closely your coin follows Bitcoin and other assets over time. It displays rolling correlations as an oscillator in a separate pane below your price chart.
## What It Does
This indicator calculates **Pearson correlations** between different trading pairs on a rolling window (default: 100 bars). Correlations range from **-1.0** (perfect inverse relationship) to **+1.0** (perfect positive relationship), with **0** meaning no correlation.
### The 5 Correlation Lines
1. **Blue (thick line) - Coin vs BTC**: The most important metric
- **High correlation (>0.7)**: Your coin is just following BTC - no independent movement
- **Low correlation (<0.3)**: Your coin has **alpha** - it's moving independently from BTC
- **Negative correlation**: Your coin moves opposite to BTC (rare but powerful)
2. **Purple - Coin/BTC vs BTC**: Inverse relationship check
- **Negative values**: When BTC rises, your coin weakens relative to BTC
- **Positive values**: When BTC rises, your coin strengthens against BTC
3. **Orange - Coin vs Coin/BTC**: Structural consistency check
- Shows how well the Coin/USDT and Coin/BTC pairs maintain their mathematical relationship
- Unusual values can indicate liquidity issues or market inefficiencies
4. **Light Red - Coin vs USDT.D** (optional): Stablecoin dominance correlation
- Shows how your coin correlates with USDT dominance
- Useful for understanding flight-to-safety dynamics
5. **Light Green - Coin vs BTC.D** (optional): Bitcoin dominance correlation
- Shows how your coin correlates with BTC dominance
- Helps identify altcoin season vs BTC dominance cycles
## How to Read It
### Finding Alpha Opportunities
- **Low blue line (<0.3)**: Your coin is decoupled from BTC → potential alpha
- **Blue line dropping**: Coin is gaining independence from BTC
- **Blue line spiking to >0.9**: Coin is a "BTC clone" with no independent movement
### Regime Change Detection
- **Blue line crossing 0.5**: Major shift in correlation behavior
- **Purple line turning negative**: Coin starting to weaken when BTC rises (warning sign)
- **Sharp correlation changes**: Market structure is shifting - adjust strategy
### Visual Zones
- **Blue background**: High correlation zone (>0.7) - coin just following BTC
- **Red background**: Inverse correlation zone (<-0.5) - coin moving opposite to BTC
### Reference Lines
- **+1.0 / -1.0**: Perfect correlation boundaries (dotted gray)
- **+0.5 / -0.5**: Moderate correlation thresholds (dotted gray)
- **0.0**: Zero correlation line (solid gray)
## Dynamic Legend
The legend table (top-right) automatically shows the actual symbol names based on your chart:
- **Example on SOLUSDT**: Shows "SOL vs BTC", "SOL/BTC vs BTC", "SOL vs SOL/BTC", etc.
- **Color boxes**: Match the plot colors for easy identification
- **Live values**: Current correlation numbers update in real-time
- **Tooltips**: Hover over labels for interpretation guidance
## Configuration
### Key Inputs
- **Correlation Lookback** (default: 100): Number of bars for rolling correlation window
- Shorter = more reactive, noisier
- Longer = smoother, slower to detect changes
- **Correlation Smoothing** (default: 5): EMA smoothing period for raw correlations
- Reduces noise while preserving trends
- **Symbol Detection**: Auto-detects symbols from your chart, or use manual overrides
- **Dominance Pairs**: Toggle USDT.D and BTC.D correlations on/off
## Usage Tips
1. **Combine with main Tri-Align indicator**: Use correlation for context, Tri-Align for entry/exit signals
2. **Watch for divergences**: Correlation changing while price moves in sync can signal upcoming shift
3. **Adjust lookback period**: Use shorter (50-70) for day trading, longer (150-200) for position trading
4. **Focus on the blue line**: It's your primary alpha indicator
## Technical Details
- **Calculation**: Pearson correlation coefficient with EMA smoothing
- **Data source**: Close prices from `request.security()` (multi-timeframe capable)
- **Update frequency**: Every bar on your selected timeframe
- **Overlay**: False (displays in separate pane)
## Quick Interpretation Guide
| Blue Line Value | Interpretation | Action |
|----------------|----------------|--------|
| > 0.9 | Coin is a BTC clone | Avoid - no alpha opportunity |
| 0.7 - 0.9 | High correlation | Standard altcoin behavior |
| 0.3 - 0.7 | Moderate correlation | Some independence emerging |
| < 0.3 | Low correlation | **Strong alpha opportunity** |
| < 0 | Inverse correlation | Rare - potential hedge asset |
| Purple Line | Interpretation |
|-------------|----------------|
| Strongly negative | Coin weakens when BTC rises - risky |
| Near zero | Coin/BTC pair moves independently of BTC |
| Positive | Coin strengthens with BTC - ideal |
## Version History
### v1.0 (Initial Release)
- Pearson correlation calculation with configurable lookback
- 5 correlation pairs: Coin vs BTC, Coin/BTC vs BTC, Coin vs Coin/BTC, USDT.D, BTC.D
- EMA smoothing to reduce noise
- Visual zones for high/inverse correlation
- Dynamic legend with symbol name extraction
- Auto-symbol detection matching main Tri-Align indicator
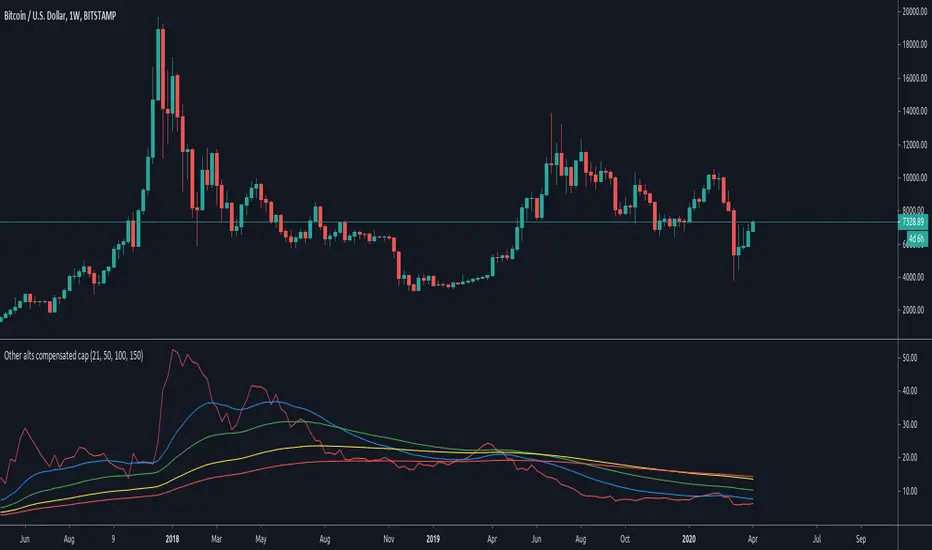
Other alts compensated capitalization [Peregringlk]DISCLAIMER: I'm not a native English speaker, so let me know please about mistakes in my wording.
Introduction
==========
This indicator (the middle one in the image) shows how the "others altcoins" (all altcoins except coins with high capitalization) are adding own value to its capitalization by removing BTC price changes. By "own value" I mean USD value gaining by actual buys in BTC markets beyong arbitrage effects of BTC price changes.
The main idea is that, if bitcoin has increased is value by 20%, and the other altcoins has increased its capitalization by 30%, the chart will only plot an increased of 10%. In other words, it will show its increased capitalization measured in BTC (the combined altcoin/BTC market is uptrending). Its purpose is to try to identify altseasons. A bit more concisely, the graph will only grow when both USD and BTC capitalization are growing. If any of them are going down, the graph will go down as well.
Rationale
========
- Altseasons are characterized by an incresed in BTC value of almost every altcoin during some period of time, although not all at once, but distributed over the altseason. For example, in the crazy altseason of Dec17/Jan18, almost every (low capitalized) altcoin increased its BTC value by a minimum of +300%, some at the beginning of the season, some at the end.
- When this happens, BTC loss capitalization dominance, but this also can happen if BTC is downtrending while altcoins are being bought in BTC markets but its USD value doesn't change too much. This happens when altcoins are uptrending in BTC price, but there are actually no gain of USD value because the BTC gain in value is not enough to compensate the BTC fall in price. Since BTC is losing USD price, but altcoins are not, dominance falls. So, looking at BTC dominance is not enough to spot possible beginnings of altseasons, because of arbitrage of other effects.
- The "big altcoins" are removed from the counting because one single big capitalized altcoin that grows, let's say, a 20%, will have an observable effect on the total altcoin capitalization, even if the rest of the altcoins are stagnated in price. For example, at today's date (8th April 2020), Ethereum by itself has the 23.89% of the total altcoins capitalization. A +10% in Ethereum price will increase the total altcoin capitalization by a +2.38%. I wanted to remove that effect to focus on generalized price changes of all altcoins. Remember that there are only 9 big altcoins 9 coins representing the 71% of the alts capitalization, while there are exists more than 5000 altcoins in total.
- Another key factor is that I want to focus on what happens in alt/BTC markets, because almost every altcoin can be traded against BTC, and most of them can only be traded against BTC. However, big altcoins can usually be traded against USD or other alt coins or fiat currencies as well. Removing the big alts from the equation helps (just a bit) to simplify the interpretation of the chart because arbitrage effects of those "impactfull" alts are limited (although not removed, because arbitrage also happens cross-markets).
- There are situations where BTC price is going up, alts USD capitalization is going up as well, but alts BTC capitalization is going down because altcoins are being sold in BTC markets, it just happens that the speed of the selling is not high enough as to compensated the increased in BTC price. That makes the USD capitalization grows, while alts are really being dumped in BTC markets. I wanted to reflect that effect as well by making sure that the graph is growing only when both USD and BTC capitalization of alts are growing.
Interpretation
============
If you want, you can see this chart as if plotting the Other alts capitalization as if priced against a fictional coin FCOIN, that start by having a price of 1, that combines the up and downs of both BTC price and alts USD capitalization in a very conservative way: if FCOIN price goes up, means that the other alts are gained USD value but only when they have overcome BTC price changes. Otherwise, it goes down.
If this fictional FCOIN has went up during some days straight with a total gain of maybe, greater than 10%, we are maybe in front of the start of an altseason. Sometimes, maybe (it requires some more years to extract a theory out of here), it can be used as proxy of the BTC near future (trend changes or continuations): if this FCOIN goes up, while BTC is doing nothing relevant or even is going down, it could signal that "people" is getting prepared and a generalized altcoin accumulation process has started, because of a combined people's assumption that BTC will start to have an stable uptrend, or will continue the current trend soon. There's some matches in the past about that, but there are also false positives, as usual.
Additionally, four customizable EMAs are added to the script, by default 21, 50, 100 and 150.
Definitions
=========
- Let's call `altcap_btc` the altcoin capitalization in USD, divided by BTC price. In other words, `altcap_btc` is the capitalization in terms of BTC.
- Let's call `x` the BTC price change rate as `btc_price_current_candle / btc_price_previous_candle`. So, if BTC has grown a +20%, `x = 1.20`, and if BTC has gone down a -20%, `x = 0.80`.
- Let's call `y` the `altcap_btc` price change rate, calculated as before but for `altcap_btc`.
- For pure math equivalence, `x * y` is thus the USD capitalization change rate.
Calculation
=========
For plotting the graph, for each candle, I choose a change rate, and then I plot the total accumulated change rate as by `ch0 * ch1 * ch2 * .... * ch_today`, where each `chX` is the choosen change rate of each candle since the beginning of the chart. So, if the "alts compensated value" has grown yesterday +20% and today's -10%, `1.20 * 0.9 = 1.08`, which means that in two days the compensated value has grown an 8% in total.
- If `x * y > 1` (USD cap is growing), I take `y` as change rate (alt/btc change rate).
- If both `x` and `y` are `> 1`, then the graph grows because I'm taking `y`.
- If `x > 1` and `y < 1`, the graph goes down because I'm taking `y`, reflecting the BTC markets are dumping.
- If `x < 1` and `y > 1`, the graph goes up because I'm taking `y`, reflecting the BTC markets are pumping so much that it overcomes the btc fall.
- `x < 1` and `y < 1` is impossible here because `x * y` must be `> 1` by precondition.
- If `x * y < 1` (USD cap is going down), I take `y` or `x * y` depending on the individual change rates:
- If `x` and `y` go in different directions (one up and the other down), I take `x * y` to reflect that USD capitalization has gone down. I don't take `y` here because it could be `> 1`, and I don't want to make the graph grow if alts are lossing USD value. Also, if `y < 1` and I take `y` the graph will go down faster than USD capitalization and I want to show that "alts compensated value is gown down slower than BTC because some boughts are happening". I don't take `x` either here for the same reasons.
- If both `x` and `y` are `< 1`, I take `y`, because otherwise the graph would be less than 0.000001 today after two years of bleeding, making literally impossible to see if alts "grow tomorrow".
- `x > 1` and `y > 1` is impossible here because `x * y` must be `< 1` by precondition.
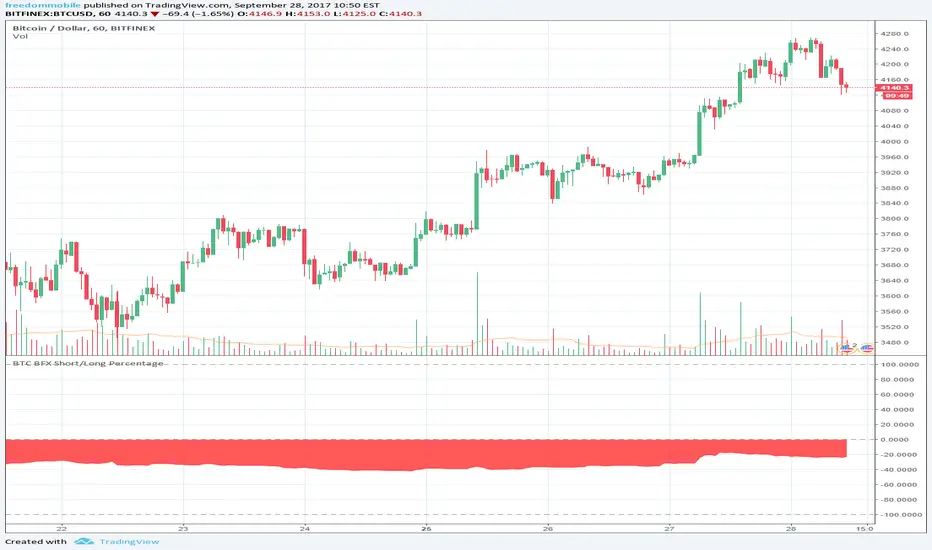
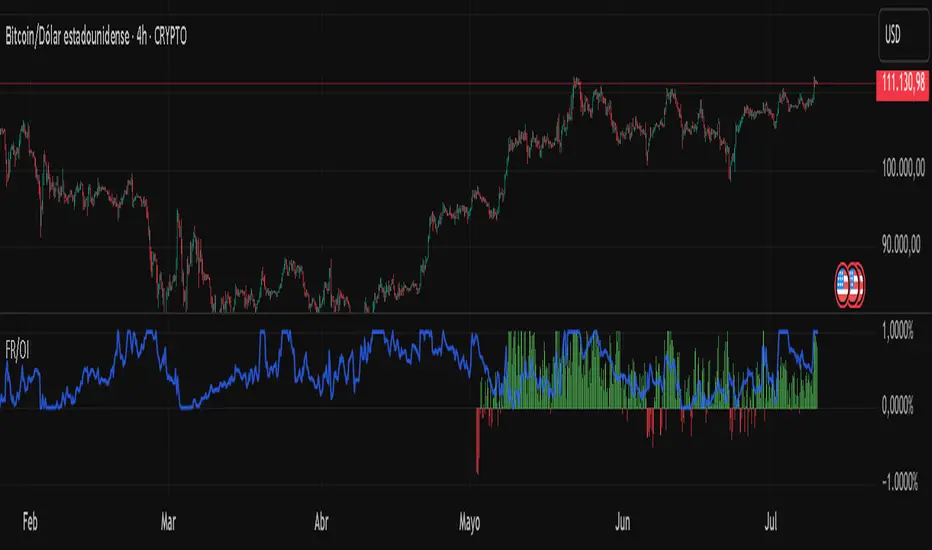
Fundig Rate OI# 🚀 Bitcoin Funding Rate + Open Interest Indicator - PineScript v6
## 📋 Summary
I've developed a **Bitcoin-specific** indicator that combines **Funding Rate** with **normalized Open Interest** for advanced futures analysis. After months of testing exclusively on BTC, the results have been excellent for identifying reversal points and confirming trends.
---
## 🎯 Why Bitcoin Only?
**Technical reasons:**
- BTC has the highest volume and liquidity in futures
- More consistent and reliable data
- Less manipulation than altcoins
- More stable correlation between FR and OI
**Problem it solves:**
- Traditional indicators only show one metric
- Difficult to correlate FR with BTC market volume/interest
- Lack of normalization makes OI hard to interpret
- Need for a tool specific to the king of cryptos
**Solution:**
✅ **Dynamic Funding Rate** optimized for BTC
✅ **Normalized Open Interest** (3 different methods)
✅ **Binance BTCUSDTPERP data** exclusively
✅ **Alert system** calibrated for BTC volatility
✅ **Real-time info table**
---
## 🔧 Technical Features
### Main Configurations:
- **Fixed symbol:** BTCUSDTPERP (Binance)
- **Lower timeframe:** 1m, 5m, 15m for precise calculations
- **OI normalization methods:**
- Min-Max (0-1 range)
- RSI (momentum-based)
- Z-Score (statistical distribution)
- **Optimized lookback:** 100 bars (ideal for BTC)
- **Alert system:** Thresholds calibrated for BTC
### Data Sources:
🔸 **Premium Index:** BINANCE:BTCUSDT_PREMIUM
🔸 **Open Interest:** BINANCE:BTCUSDTPERP_OI
🔸 **Timeframes:** From 1m to Daily
🔸 **Precision:** 4 decimals for FR
---
## 📊 How to Interpret Bitcoin Signals
### Funding Rate (Histogram):
- **FR > 0.1%:** BTC longs paying high → Possible short
- **FR < -0.1%:** BTC shorts paying high → Possible long
- **FR extreme (>0.5%):** High probability of BTC reversal
- **FR neutral (±0.05%):** Balanced market
### Open Interest (Blue line):
- **OI > 0.8 + high FR:** Many BTC longs trapped → Bearish
- **OI < 0.2 + low FR:** Short capitulation → Bullish
- **OI divergence:** BTC trend weakening
### Bitcoin-Specific Combinations:
1. **FR > 0.3% + OI > 0.85:** Imminent bearish reversal
2. **FR < -0.2% + OI < 0.15:** Probable bullish reversal
3. **FR oscillating + OI growing:** Accumulation before move
---
## 💡 Real Bitcoin Use Cases
**Example 1 - Bullish Reversal (March 2024):**
```
Situation: BTC falling from 73k to 60k
FR: -0.18% (shorts paying high premium)
OI: 0.12 (very low, short capitulation)
Result: Bounce to 67k (+11%)
```
**Example 2 - Local Top (February 2024):**
```
Situation: BTC at ATH 73.8k
FR: +0.42% (desperate longs paying)
OI: 0.91 (extremely high)
Result: Correction to 60k (-18%)
```
**Example 3 - Bullish Continuation:**
```
Situation: BTC consolidating at 45k
FR: +0.05% (neutral)
OI: 0.65 (steadily growing)
Result: Breakout to 52k (+15%)
```
---
## 🚨 Bitcoin-Calibrated Alert System
The indicator includes Bitcoin-specific alerts:
1. **BTC FR Spike Up:** FR > 0.15% (adjusted to BTC volatility)
2. **BTC FR Spike Down:** FR < -0.15%
3. **BTC OI Extreme High:** Normalized OI > 0.88
4. **BTC OI Extreme Low:** Normalized OI < 0.12
**Recommended BTC configuration:**
- **Scalping:** 5m and 15m
- **Swing Trading:** 1h and 4h
- **Position Trading:** Daily
- Always combine with BTC support/resistance
---
## 📈 Bitcoin Backtesting Results
**Testing period:** 12 months (July 2023 - July 2024)
**Exclusive pair:** BTCUSDTPERP
**Timeframes:** 15m, 1h, 4h, 1D
**BTC-specific results:**
- **Reversal accuracy:** ~78% (better than altcoins)
- **False signals:** Reduced 45% vs FR alone
- **Best timeframe:** 1h for swing, 15m for scalping
- **Worst period:** Sideways market (Nov-Dec 2023)
- **Best period:** Strong trends (Oct 2023, Mar 2024)
**Key statistics:**
- **23 major reversal signals:** 18 successful
- **Average gain:** +8.3% per successful trade
- **Average loss:** -2.1% per failed trade
- **Risk/reward ratio:** 1:3.9
Major Crypto Relative Strength Portfolio System Majors RSPS - Relative Strength Portfolio System for Major Cryptocurrencies
Overview
Majors RSPS (Relative Strength Portfolio System) is an advanced portfolio allocation indicator that combines relative strength analysis, trend consensus, and macro risk factors to dynamically allocate capital across major cryptocurrency assets. The system leverages the NormalizedIndicators Library to evaluate both absolute trends and relative performance, creating an adaptive portfolio that automatically adjusts exposure based on market conditions.
This indicator is designed for portfolio managers, asset allocators, and systematic traders who want a data-driven approach to cryptocurrency portfolio construction with automatic rebalancing signals.
🎯 Core Concept
What is RSPS?
RSPS (Relative Strength Portfolio System) evaluates each asset on two key dimensions:
Relative Strength: How is the asset performing compared to other major cryptocurrencies?
Absolute Trend: Is the asset itself in a bullish trend?
Assets that show both strong relative performance AND positive absolute trends receive higher allocations. Weak performers are automatically filtered out, with capital reallocated to cash or stronger assets.
Dual-Layer Architecture
Layer 1: Majors Portfolio (Orange Zone)
Evaluates 14 major cryptocurrency assets
Calculates relative strength against all other majors
Applies trend filters to ensure absolute momentum
Dynamically allocates capital based on comparative strength
Layer 2: Cash/Risk Position (Navy Zone)
Evaluates macro risk factors and market conditions
Determines optimal cash allocation
Acts as a risk-off mechanism during adverse conditions
Provides downside protection through dynamic cash holdings
📊 Tracked Assets
Major Cryptocurrencies (14 Assets)
BTC - Bitcoin (Benchmark L1)
ETH - Ethereum (Smart Contract L1)
SOL - Solana (High-Performance L1)
SUI - Sui (Move-Based L1)
TRX - Tron (Payment-Focused L1)
BNB - Binance Coin (Exchange L1)
XRP - Ripple (Payment Network)
FTM - Fantom (DeFi L1)
CELO - Celo (Mobile-First L1)
TAO - Bittensor (AI Network)
HYPE - Hyperliquid (DeFi Exchange)
HBAR - Hedera (Enterprise L1)
ADA - Cardano (Research-Driven L1)
THETA - Theta (Video Network)
🔧 How It Works
Step 1: Relative Strength Calculation
For each asset, the system calculates relative strength by:
RSPS Score = Average of:
- Asset/BTC trend consensus
- Asset/ETH trend consensus
- Asset/SOL trend consensus
- Asset/SUI trend consensus
- ... (all 14 pairs)
- Asset's absolute trend consensus
Key Logic:
Each pair is evaluated using the eth_4d_cal() calibration from NormalizedIndicators
If an asset's absolute trend is extremely weak (≤ 0.1), it receives a penalty score (-0.5)
Otherwise, it gets the average of all its relative strength comparisons
Step 2: Trend Filtering
Assets must pass a trend filter to receive allocation:
Trend Score = Average of:
- Asset/BTC trend (filtered for positivity)
- Asset/ETH trend (filtered for positivity)
- Asset's absolute trend (filtered for positivity)
Only positive values contribute to the trend score, ensuring bearish assets don't receive allocation.
Step 3: Portfolio Allocation
Capital is allocated proportionally based on filtered RSPS scores:
Asset Allocation % = (Asset's Filtered RSPS Score / Sum of All Filtered Scores) × Main Portfolio %
Example:
SOL filtered score: 0.6
BTC filtered score: 0.4
All others: 0
Total: 1.0
SOL receives: (0.6 / 1.0) × Main% = 60% of main portfolio
BTC receives: (0.4 / 1.0) × Main% = 40% of main portfolio
Step 4: Cash/Risk Allocation
The system evaluates macro conditions across 6 factors:
Inverse Major Crypto Trends (40% weight)
When BTC, ETH, SOL, SUI, DOGE, etc. trend down → Cash allocation increases
Evaluates total market cap trends (TOTAL, TOTAL2, OTHERS)
Stablecoin Dominance (10% weight)
USDC dominance vs. major crypto dominances
Higher stablecoin dominance → Higher cash allocation
MVRV Ratios (10% weight)
BTC and ETH Market Value to Realized Value
High MVRV (overvaluation) → Higher cash allocation
BTC/ETH Ratio (15% weight)
Relative performance between two market leaders
Indicates market phase (BTC dominance vs. alt season)
Active Address Ratios (5% weight)
USDC active addresses vs. BTC/ETH active addresses
Network activity comparison
Macro Indicators (15% weight)
Global currency circulation (USD, EUR, CNY, JPY)
Treasury yield curve (10Y-2Y)
High yield spreads
Central bank balance sheets and money supply
Cash Allocation Formula:
Cash % = (Sum of Risk Factors × 0.5) / (Risk Factors + Majors TPI)
When risk factors are elevated, cash allocation increases, reducing exposure to volatile assets.
📈 Visual Components
Orange Zone (Majors Portfolio)
Fill: Light orange area showing aggregate portfolio strength
Line: Average trend power index (TPI) of allocated assets
Baseline: 0 level (neutral)
Interpretation:
Above 0: Bullish allocation environment
Rising: Strengthening portfolio momentum
Falling: Weakening portfolio momentum
Below 0: No allocation (100% cash)
Navy Zone (Cash Position)
Fill: Navy blue area showing cash allocation strength
Line: Risk-adjusted cash allocation signal
Baseline: 0 level
Interpretation:
Higher navy zone: Elevated risk-off signal → More cash
Lower navy zone: Risk-on environment → Less cash
Zero: No cash allocation (100% invested)
Performance Line (Orange/Blue)
Orange: Main portfolio allocation dominant (risk-on mode)
Blue: Cash allocation dominant (risk-off mode)
Tracks: Cumulative portfolio returns with dynamic rebalancing
Allocation Table (Bottom Left)
Shows real-time portfolio composition:
ColumnDescriptionAssetCryptocurrency nameRSPS ValuePercentage allocation (of main portfolio)CashDollar amount (if enabled)
Color Coding:
Orange: Active allocation
Gray: Weak signal (borderline)
Blue: Cash position
Missing: No allocation (filtered out)
⚙️ Settings & Configuration
Required Setup
Chart Symbol
MUST USE: INDEX:BTCUSD or similar major crypto index
Recommended Timeframe: 1D (Daily) or 4D (4-Day)
Why: System needs price data for all 14 majors, BTC provides stable reference
Hide Chart Candles
For clean visualization:
Right-click on chart
Select "Hide Symbol" or set candle opacity to 0
This allows the indicator fills and table to be clearly visible
User Inputs
plot_table (Default: true)
Enable/disable the allocation table
Set to false if you only want the visual zones
use_cash (Default: false)
Enable portfolio dollar value calculations
Shows actual dollar allocations per asset
cash (Default: 100)
Total portfolio size in dollars/currency units
Used when use_cash is enabled
Example: Set to 10000 for a $10,000 portfolio
💡 Interpretation Guide
Entry Signals
Strong Allocation Signal:
✓ Orange zone elevated (> 0.3)
✓ Navy zone low (< 0.2)
✓ Performance line orange
✓ Multiple assets in allocation table
→ Action: Deploy capital to allocated assets per table percentages
Risk-Off Signal:
✓ Orange zone near zero
✓ Navy zone elevated (> 0.4)
✓ Performance line blue
✓ Few or no assets in table (high cash %)
→ Action: Reduce exposure, increase cash holdings
Rebalancing Triggers
Monitor the allocation table for changes:
New assets appearing: Add to portfolio
Assets disappearing: Remove from portfolio
Percentage changes: Rebalance existing positions
Cash % changes: Adjust overall exposure
Market Regime Detection
Risk-On (Bull Market):
Orange zone high and rising
Navy zone minimal
Many assets allocated (8-12)
High individual allocations (15-30% each)
Risk-Off (Bear Market):
Orange zone near zero or negative
Navy zone elevated
Few assets allocated (0-3)
Cash allocation dominant (70-100%)
Transition Phase:
Both zones moderate
Medium number of assets (4-7)
Balanced cash/asset allocation (40-60%)
🎯 Trading Strategies
Strategy 1: Pure RSPS Following
1. Check allocation table daily
2. Rebalance portfolio to match percentages
3. Follow cash allocation strictly
4. Review weekly, act on significant changes (>5%)
Best For: Systematic portfolio managers, passive allocators
Strategy 2: Threshold-Based
Entry Rules:
- Orange zone > 0.4 AND Navy zone < 0.3
- At least 5 assets in allocation table
- Total non-cash allocation > 60%
Exit Rules:
- Orange zone < 0.1 OR Navy zone > 0.5
- Fewer than 3 assets allocated
- Cash allocation > 70%
Best For: Active traders wanting clear rules
Strategy 3: Relative Strength Overlay
1. Use RSPS for broad allocation framework
2. Within allocated assets, overweight top 3 performers
3. Scale position sizes by RSPS score
4. Use individual asset charts for entry/exit timing
Best For: Discretionary traders with portfolio focus
Strategy 4: Risk-Adjusted Position Sizing
For each allocated asset:
Position Size = Base Position × (Asset's RSPS Score / Max RSPS Score) × (1 - Cash Allocation)
Example:
- $10,000 portfolio
- SOL RSPS: 0.6 (highest)
- BTC RSPS: 0.4
- Cash allocation: 30%
SOL Size = $10,000 × (0.6/0.6) × (1-0.30) = $7,000
BTC Size = $10,000 × (0.4/0.6) × (1-0.30) = $4,667
Cash = $10,000 × 0.30 = $3,000
Best For: Risk-conscious allocators
📊 Advanced Usage
Multi-Timeframe Confirmation
Use on multiple timeframes for robust signals:
1D Chart: Tactical allocation (daily rebalancing)
4D Chart: Strategic allocation (weekly review)
Strong Confirmation:
- Both timeframes show same top 3 assets
- Both show similar cash allocation levels
- Orange zones aligned on both
Weak/Conflicting:
- Different top performers
- Diverging cash allocations
→ Wait for alignment or use shorter timeframe
Sector Rotation Analysis
Group assets by type and watch rotation:
L1 Dominance: BTC, ETH, SOL, SUI, ADA high → Layer 1 season
Alt L1s: TRX, FTM, CELO rising → Alternative platform season
Specialized: TAO, THETA, HYPE strong → Niche narrative season
Payment/Stable: XRP, BNB allocation → Risk reduction phase
Divergence Trading
Bullish Divergence:
Navy zone declining (less risk-off)
Orange zone flat or slightly rising
Few assets still allocated but strengthening
→ Early accumulation signal
Bearish Divergence:
Orange zone declining
Navy zone rising
Asset count decreasing in table
→ Distribution/exit signal
Performance Tracking
The performance line (overlay) shows cumulative strategy returns:
Compare to BTC/ETH: Is RSPS outperforming?
Drawdown analysis: How deep are pullbacks?
Correlation: Does it track market or provide diversification?
🔬 Technical Details
Data Sources
Price Data:
COINEX: Primary exchange for alt data
CRYPTO: Alternative price feeds
INDEX: Aggregated index prices (recommended for BTC)
Macro Data:
Dominance metrics (SUI.D, BTC.D, etc.)
MVRV ratios (on-chain valuation)
Active addresses (network activity)
Global money supply and macro indicators
Calculation Methodology
RSPS Scoring:
For each asset, calculate 14 relative trends (vs. all others)
Calculate asset's absolute trend
Average all 15 values
Apply penalty filter for extremely weak trends (≤ 0.1)
Trend Consensus:
Uses eth_4d_cal() from NormalizedIndicators library
Combines 8 normalized indicators per measurement
Returns value from -1 (bearish) to +1 (bullish)
Performance Calculation:
Daily Return = Σ(Asset ROC × Asset Allocation)
Cumulative Performance = Previous Perf × (1 + Daily Return / 100)
Assumes perfect rebalancing and no slippage (theoretical performance).
Filtering Logic
filter() function:
pinescriptfilter(input) => input >= 0 ? input : 0
This zero-floor filter ensures:
Only positive trend values contribute to allocation
Bearish assets receive 0 weight
No short positions or inverse allocations
Anti-Manipulation Safeguards
Null Handling:
All values wrapped in nz() to handle missing data
Prevents calculation errors from data gaps
Normalization:
Allocations always sum to 100%
Prevents over/under-allocation
Conditional Logic:
Assets need positive values on multiple metrics
Single metric cannot drive allocation alone
⚠️ Important Considerations
Required Timeframes
1D (Daily): Recommended for most users
4D (4-Day): More stable, fewer rebalances
Other timeframes: Use at your own discretion, may require recalibration
Data Requirements
Needs INDEX:BTCUSD or equivalent major crypto symbol
All 14 tracked assets must have available data
Macro indicators require specific TradingView data feeds
Rebalancing Frequency
System provides daily allocation updates
Practical rebalancing: Weekly or on significant changes (>10%)
Consider transaction costs and tax implications
Performance Notes
Theoretical returns: No slippage, fees, or execution delays
Backtest carefully: Validate on your specific market conditions
Past performance: Does not guarantee future results
Risk Warnings
⚠️ High Concentration Risk: May allocate heavily to 1-3 assets
⚠️ Volatility: Crypto markets are inherently volatile
⚠️ Liquidity: Some allocated assets may have lower liquidity
⚠️ Correlation: All assets correlated to BTC/ETH to some degree
⚠️ System Risk: Relies on continued availability of data feeds
Not Financial Advice
This indicator is a tool for analysis and research. It does not constitute:
Investment advice
Portfolio management services
Trading recommendations
Guaranteed returns
Always perform your own due diligence and risk assessment.
🎓 Use Cases
For Portfolio Managers
Systematic allocation framework
Objective rebalancing signals
Risk-adjusted exposure management
Performance tracking vs. benchmarks
For Active Traders
Identify strongest assets to focus trading on
Gauge overall market regime (risk-on/off)
Time entry/exit for portfolio shifts
Complement technical analysis with allocation data
For Institutional Allocators
Quantitative portfolio construction
Multi-asset exposure optimization
Drawdown management through cash allocation
Compliance-friendly systematic approach
For Researchers
Study relative strength dynamics in crypto markets
Analyze correlation between majors
Test macro factor impact on crypto allocations
Develop derived strategies and signals
🔧 Setup Checklist
✅ Chart Configuration
Set chart to INDEX:BTCUSD
Set timeframe to 1D or 4D
Hide chart candles for clean visualization
Add indicator from library
✅ Indicator Settings
Enable plot_table (see allocation table)
Set use_cash if tracking dollar amounts
Input your portfolio size in cash parameter
✅ Monitoring Setup
Bookmark chart for daily review
Set alerts for major allocation changes (optional)
Create spreadsheet to track allocations (optional)
Establish rebalancing schedule (weekly recommended)
✅ Validation
Verify all 14 assets appear in table (when allocated)
Check that percentages sum to ~100%
Confirm performance line is tracking
Test cash allocation calculation if enabled
📋 Quick Reference
Signal Interpretation
ConditionOrange ZoneNavy ZoneActionStrong BullHigh (>0.4)Low (<0.2)Full allocationModerate BullMid (0.2-0.4)Low-MidStandard allocationNeutralLow (0.1-0.2)Mid (0.3-0.4)Balanced allocationModerate BearVery Low (<0.1)Mid-HighReduce exposureStrong BearZero/NegativeHigh (>0.5)High cash/exit
Rebalancing Thresholds
Change TypeThresholdActionIndividual asset±5%Consider rebalanceIndividual asset±10%Strongly rebalanceCash allocation±10%Adjust exposureAsset entry/exitAnyAdd/remove position
Color Legend
Orange: Main portfolio strength/allocation
Navy: Cash/risk-off allocation
Blue text: Cash position in table
Orange text: Active asset allocation
Gray text: Weak/borderline allocation
White: Headers and labels
🚀 Getting Started
Beginner Path
Add indicator to INDEX:BTCUSD daily chart
Hide candles for clarity
Enable plot_table to see allocations
Check table daily, note top 3-5 assets
Start with small allocation, observe behavior
Gradually increase allocation as you gain confidence
Intermediate Path
Set up on both 1D and 4D charts
Enable use_cash with your portfolio size
Create tracking spreadsheet
Implement weekly rebalancing schedule
Monitor divergences between timeframes
Compare performance to buy-and-hold BTC
Advanced Path
Modify code to add/remove tracked assets
Adjust relative strength calculation methodology
Customize cash allocation factors and weights
Integrate with portfolio management platform
Develop algorithmic rebalancing system
Create alerts for specific allocation conditions
📖 Additional Resources
Related Indicators
NormalizedIndicators Library: Core calculation engine
Individual asset trend indicators for deeper analysis
Macro indicator dashboards for cash allocation factors
Complementary Analysis
On-chain metrics (MVRV, active addresses, etc.)
Order book liquidity for execution planning
Correlation matrices for diversification analysis
Volatility indicators for position sizing
Learning Materials
Study relative strength portfolio theory
Research tactical asset allocation strategies
Understand crypto market cycles and phases
Learn about risk management in volatile assets
🎯 Key Takeaways
✅ Systematic allocation across 14 major cryptocurrencies
✅ Dual-layer approach: Asset selection + Cash management
✅ Relative strength focused: Invests in comparatively strong assets
✅ Trend filtering: Only allocates to assets in positive trends
✅ Dynamic rebalancing: Automatically adjusts to market conditions
✅ Risk-managed: Increases cash during adverse conditions
✅ Transparent methodology: Clear calculation logic
✅ Practical visualization: Easy-to-read table and zones
✅ Performance tracking: See cumulative strategy returns
✅ Highly customizable: Adjust assets, weights, and factors
📋 License
This code is subject to the Mozilla Public License 2.0 at mozilla.org
Majors RSPS transforms complex multi-asset portfolio management into a systematic, data-driven process. By combining relative strength analysis with trend consensus and macro risk factors, it provides traders and portfolio managers with a robust framework for navigating cryptocurrency markets with discipline and objectivity.WiederholenClaude kann Fehler machen. Bitte überprüfen Sie die Antworten. Sonnet 4.5

CL Daily Bitcoin Volume (All exchange included, even Mt.GOX)This daily volume data contains collective total from
____________________________________________________
Historical:
BTC-e BTC/USD (From Q3 2011 to Q3 2016)
BTCChina BTC/CNY (From Q3 2011 to Q2 2017)
Coinsetter BTC/USD (From Q3 2014 to Q1 2016)
MtGox BTC/USD (From July 2010 - 2014 only))
OKcoin International BTC/USD (From Q3 2014 to Q2 2017)
____________________________________________________
Institutions:
CME Bitcoin Futures
Grayscale Bitcoin Trust OTC
____________________________________________________
Spot exchanges:
Bitfinex BTC/USD
Bitstamp BTC/USD
Coinbase BTC/USD
Coinbase BTC/EUR
Binance BTC/USDT
Binance BTC/USDC
Binance BTC/PAX
Gemini BTC/USD
itBit BTC/USD
Kraken BTC/EUR
Kraken BTC/USD
Huobi BTC/USDT
Korbit BTC/KRW
Bitflyer BTC/JPY
____________________________________________________
Others:
Bitmex

ZenAlgo - DominatorThis indicator provides a structured multi-ticker overview of market momentum and relative strength by analyzing short-term price behavior across selected assets in comparison with broader crypto dominance and Bitcoin/ETH performance.
Ticker and Market Data Handling
The script accepts up to 9 user-defined symbols (tickers) along with BTCUSD and ETHUSD. For each symbol:
It retrieves the current price.
It also requests the daily opening price from the "D" timeframe to compute intraday percentage change.
For BTC, ETH, and dominance (sum of BTC, USDT, and USDC dominance), daily change is calculated using this same method.
This comparison enables tracking relative performance from the daily open, which provides meaningful insight into intraday strength or weakness among different assets.
Dominance Logic
The indicator aggregates dominance data from BTC , USDT , and USDC using TradingView’s CRYPTOCAP indices. This combined dominance is used as a reference in directional and status calculations. ETH dominance is also analyzed independently.
Changes in dominance are used to infer whether market attention is shifting toward Bitcoin/stablecoins (typically indicating risk-off sentiment) or away from them (typically risk-on behavior, benefiting altcoins).
Price Direction Estimation
The script estimates directional bias using an EMA-based deviation technique:
A short EMA (user-defined lookback , default 4 bars) is calculated.
The current close is compared to the EMA to assess directional bias.
Recent candle changes are also inspected to confirm a consistent short-term trend (e.g., 3 consecutive higher closes for "up").
A small threshold is used to avoid classifying flat movements as trends.
This directionality logic is applied separately to:
The selected ticker's price
BTC price
Combined dominance
This allows the script to contextualize the movement of each asset within broader market conditions.
Market Status Evaluation
A custom function analyzes ETH and BTC dominance trends along with their relative strength to define the overall market regime:
Altseason is identified when BTC dominance is declining, ETH dominance rising, and ETH outperforms BTC.
BTC Season occurs when BTC dominance is rising, ETH dominance falling, and BTC outperforms ETH.
If neither condition is met, the state is Neutral .
This classification is shown alongside each ticker's row in the table and helps traders assess whether market conditions favor Bitcoin, Ethereum, or altcoins in general.
Ticker Status Classification
Each ticker is analyzed independently using the earlier directional logic. Its status is then determined as follows:
Full Bull : Ticker is trending up while dominance is declining or BTC is also rising.
Bullish : Ticker is trending up but not supported by broader bullish context.
Bearish : Ticker is trending down but without broader confirmation.
Full Bear : Ticker is trending down while dominance rises or BTC falls.
Neutral : No strong directional bias or conflicting context.
This classification reflects short-term momentum and macro alignment and is color-coded in the results table.
Table Display and Plotting
A configurable table is shown on the chart, which:
Displays the name and status of each selected ticker.
Optionally includes BTC, ETH, and market state.
Uses color-coding for intuitive interpretation.
Additionally, price changes from the daily open are plotted for each selected ticker, BTC, ETH, and combined dominance. These values are also labeled directly on the chart.
Labeling and UX Enhancements
Labels next to the current candle display price and percent change for each active ticker and for BTC, ETH, and combined dominance.
Labels update each bar, and old labels are deleted to avoid clutter.
Ticker names are dynamically shortened by stripping exchange prefixes.
How to Use This Indicator
This tool helps traders:
Spot early rotations between Bitcoin and altcoins.
Identify intraday momentum leaders or laggards.
Monitor which tickers align with or diverge from broader market trends.
Detect possible sentiment shifts based on dominance trends.
It is best used on lower to mid timeframes (15m–4h) to capture intraday to short-term shifts. Users should cross-reference with longer-term trend tools or structural indicators when making directional decisions.
Interpretation of Values
% Change : Measures intraday move from daily open. Strong positive/negative values may indicate breakouts or reversals.
Status : Describes directional strength relative to market conditions.
Market State : Gives a general bias toward BTC dominance, ETH strength, or altcoin momentum.
Limitations & Considerations
The indicator does not analyze liquidity or volume directly.
All logic is based on short-term movements and may produce false signals in ranging or low-volume environments.
Dominance calculations rely on external CRYPTOCAP indices, which may differ from exchange-specific flows.
Added Value Over Other Free Tools
Unlike basic % change tables or price overlays, this indicator:
Integrates dominance-based macro context into ticker evaluation.
Dynamically classifies market regimes (BTC season / Altseason).
Uses multi-factor logic to determine ticker bias, avoiding single-metric interpretation.
Displays consolidated information in a table and chart overlays for rapid assessment.

Triangular Arbitrage [Starbots]Triangular arbitrage in crypto refers to a trading strategy that exploits price discrepancies between three different cryptocurrencies or currency pairs on the same exchange.
The idea is to make a series of trades that ultimately result in a profit without the risk typically involved in trading. It works by taking advantage of the inefficiencies in the pricing of cryptocurrency pairs.
Here’s how it works:
Identify the Discrepancy: A trader finds a pricing mismatch between three cryptocurrencies. For example, they identify that the exchange rates between BTC/ETH, ETH/USDT, and BTC/USDT pairs are not aligned in a way that satisfies arbitrage-free conditions.
Three Trades:
Trade 1: Start with one cryptocurrency, say USDT (Tether).
Trade 2: Use USDT to buy ETH.
Trade 3: Use ETH to buy BTC.
Final Trade: Finally, convert the BTC back into USDT.
Profit: If the exchange rates between these pairs are out of sync, the trader can end up with more USDT (or the initial cryptocurrency) than they started with. This is because the temporary price inefficiency allowed them to buy low and sell high across different pairs.
Example:
Initial position: You have 10,000 USDT.
Step 1: You buy ETH with USDT (at a rate of 1 ETH = 2000 USDT), getting 5 ETH.
Step 2: You buy BTC with ETH (at a rate of 1 BTC = 2.5 ETH), getting 2 BTC.
Step 3: You sell BTC back for USDT (at a rate of 1 BTC = 5200 USDT), getting 10,400 USDT.
This results in a profit of 400 USDT after completing the cycle, assuming no fees or slippage.
Key Points:
Risk-Free (In Theory): In theory, triangular arbitrage is risk-free because you’re taking advantage of price discrepancies and not market trends.
High Speed Required: Since the inefficiencies in the crypto market are usually very short-lived, this strategy often requires bots or automated systems to execute trades quickly.
Fees and Slippage: In reality, exchange fees, trading volume, and slippage (the difference between the expected price and the actual execution price) can eat into profits and should be carefully considered.
Triangular arbitrage opportunities arise in crypto markets due to the high volatility and fragmentation across different trading pairs and exchanges.
________________________________________________________________
Recommended Binance pairs: DOGE/BTC, TRX/BTC, LINK/BTC, RUNE/BTC, FET/BTC, WIF/BTC,.. Make sure they have big daily volume when you swap them.
You typically have 30 seconds to 2 minutes to complete all three orders, but the main challenge is slippage, especially if the trading volume is low.
<>How to use indicator?
For example, open the DOGE/BTC chart on Binance and set the timeframe to 30 seconds or 1 minute.
In the first input, enter DOGE/USDT, the symbol that's on the left of your slash (DOGE/BTC), and in the second, enter BTC/USDT, the symbol that's on the right of your slash (DOGE/BTC).
Next, select the investment and commissions option.
Indicator will automatically calculate the discrepancies between these three different cryptocurrency pairs and show you when it's profitable to trade it on the chart.
Follow the indicator's suggested orders and capitalize on the price discrepancies between the three cryptocurrencies on the same exchange. This is how Triangular Arbitrage work.
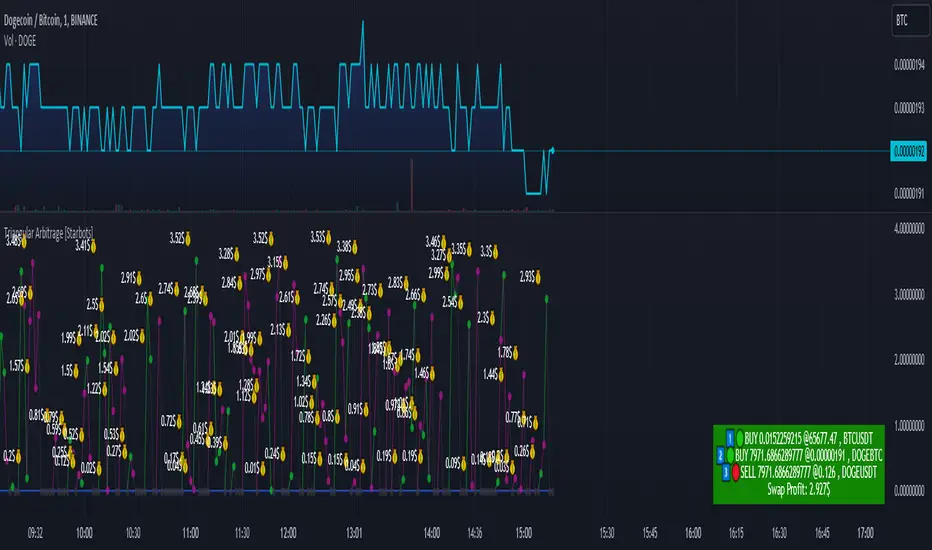
Cryptocurrency Market Sentiment v1.0Introduction:
Capable of observing the market sentiment of the cryptocurrency market
The relative status of BTC and altcoins
How it works:
1. The general uptrend process of the cryptocurrency market is BTC → ETH → high-cap altcoins → low-cap altcoins. When funds cannot push up BTC's market cap, funds gradually flow into smaller-cap altcoins until the upward trend ends.
2. Select ETH as the representative of altcoins, and understand the sentiment and current stage
3. Mathematical principle : divide the price of ETH by the price of BTC, and then apply it to the RSI formula .
How to use it:
1. Similar to the RSI indicator , when CMS enters the overbought zone, it represents an active altcoin market, a passionate market sentiment , and the end of the uptrend.
2. When CMS enters the oversold zone, it indicates the leading stage of BTC in the rising trend or the capital flow back to BTC in the declining process .
3. If CMS is at a low level, long positions should focus on altcoins, and short positions should focus on BTC, and vice versa.
----------------------------------------------------------------------------------------------------------
简单介绍:
能够观察加密市场市场情绪
BTC和寨币的相对状态
如何工作:
1、加密市场一般的上涨过程为 BTC → ETH → 大市值山寨 → 小市值山寨,当资金无法推动大市值的BTC上涨时,资金就会逐渐流向市值较小的山寨,直到一轮上涨结束。
2、选取ETH作为altcoins的代表,通过ETH与BTC的关系来了解加密市场的情绪和目前上涨的阶段。
3、数学原理:将ETH的价格/BTC的价格,随后将其带入RSI公式
如何使用:
1、与RSI指标类似,当cms进入超买时,代表寨币市场的活跃,市场情绪热烈,上涨进入尾声。
2、当cms进入超卖时,为上涨中BTC领涨的阶段或下降过程中资金回流BTC。
3、如果cms在低位,做多应关注altcoins,做空应关注btc,反之亦然。

FlowTrinity — Crypto Dominance Rotation IndexFlowTrinity — Crypto Dominance Rotation Index
(Tracks BTC / Stablecoin / Altcoin dominance flows with standardized oscillators)
⚪ Overview
FlowTrinity decomposes total crypto market structure into three capital-flow regimes — BTC dominance, Stablecoin dominance, and Altcoin dominance — each normalized into oscillator form. Additionally, a fourth histogram tracks Total Market Cap expansion/contraction relative to BTC+Stable capital, revealing underlying rotation pressure not visible in raw dominance charts.
Each component is standardized through SMA/STD normalization, producing smoothed 0–100 style oscillations that highlight overbought/oversold rotation extremes, risk-on/risk-off transitions, and capital cycle inflection zones.
⚪ Flow Components
Stablecoin Dominance Oscillator —White line
Measures the combined USDT + USDC share of market dominance.
High values indicate increased hedging behavior or sidelined capital.
Low values coincide with renewed risk appetite and capital deployment into crypto assets.
Altcoin Dominance Oscillator — Orange Line
Tracks the share of liquidity rotating into altcoins (Total – BTC – Stable).
Rising values indicate broad market expansion and speculative activity.
Falling values reflect flight-to-safety or concentration back into majors.
BTC Dominance Oscillator — Purple line(off by default
Normalized BTC dominance revealing transitions between Bitcoin-led markets and altcoin-led cycles. Useful for identifying BTC absorption phases vs. altcoins dispersion regimes.
Total–BTC–Stable MarketCap Difference Histogram — histogram
A normalized histogram of total market cap change minus BTC+Stable market cap change.
• Positive → altcoin segment expanding
• Negative → capital retreating into BTC or stables
Acts as a structural layer confirming or contradicting dominance-based signals.
Normalization Logic
All flows use SMA + standard deviation scaling (lookback 7 / smoothing 7), enabling consistent comparison across unrelated dominance and market-cap metrics.
⚪ Use Cases
• Identify shifts between BTC-led and alt-led markets
• Detect early signs of liquidity rotation
• If Stablecoin OSC is oversold, liquidity may soon rotate to BTC or Altcoins, signaling potential price moves.
• If Stablecoin OSC is overbought and Altcoin OSC is oversold, it can indicate an early buying opportunity in Altcoins.
• Watching these oscillator positions helps spot early market rotations and plan entries or exits.
snapshot
Disclaimer
This indicator is for educational and informational purposes only and does not constitute financial advice or investment guidance. Cryptocurrency trading involves significant risk; you are solely responsible for your trading decisions, based on your financial objectives and risk tolerance. The author assumes no liability for any losses arising from the use of this tool.

MARA / mNAV=1 (x)What it does
This script overlays two signals on the MARA chart:
mNAV=1 fair-value line — the MARA price implied by Bitcoin NAV:
mNAV1 = (BTC price × BTC holdings) / MARA shares
Premium/Discount ratio — how far MARA trades vs. its NAV fair value:
Ratio = Close / mNAV1 (1.00 = fair; >1 = premium; <1 = discount)
Inputs
Shares outstanding (default: 370,460,000)
BTC holdings (official or estimated; you can roll forward +25 BTC/day if you want)
BTC symbol used for pricing (e.g., BTCUSD, BTCUSDT, BTCUSDTPERP)
How to use
When Price < mNAV=1 and Ratio < 1.00 → MARA trades at a discount to BTC NAV (potential mean-reversion if BTC is stable).
When Price > mNAV=1 and Ratio > 1.00 → premium (premium often compresses during BTC chop/weakness).
Rule of thumb (with ~53k BTC and 370.46M shares): +$1,000 BTC ≈ +$0.14 on the mNAV=1 line.
Visuals
Blue line = mNAV=1 (fair value) plotted directly on the MARA chart.
Purple line = Ratio (×) on a separate right-hand scale centered around 1.00.
Optional shading: green when Ratio > 1.05 (+5% premium), red when Ratio < 0.95 (−5% discount).
Alerts (suggested)
Premium > +5%: Ratio > 1.05
Discount < −5%: Ratio < 0.95
Notes
This is a proxy for NAV parity; it assumes your BTC holdings input is correct (official last report or your estimate).
Choice of BTC symbol matters; use the feed that best matches your workflow (spot, perp, or index).
The ratio is most informative when BTC is range-bound; during fast BTC moves MARA can overshoot temporarily.
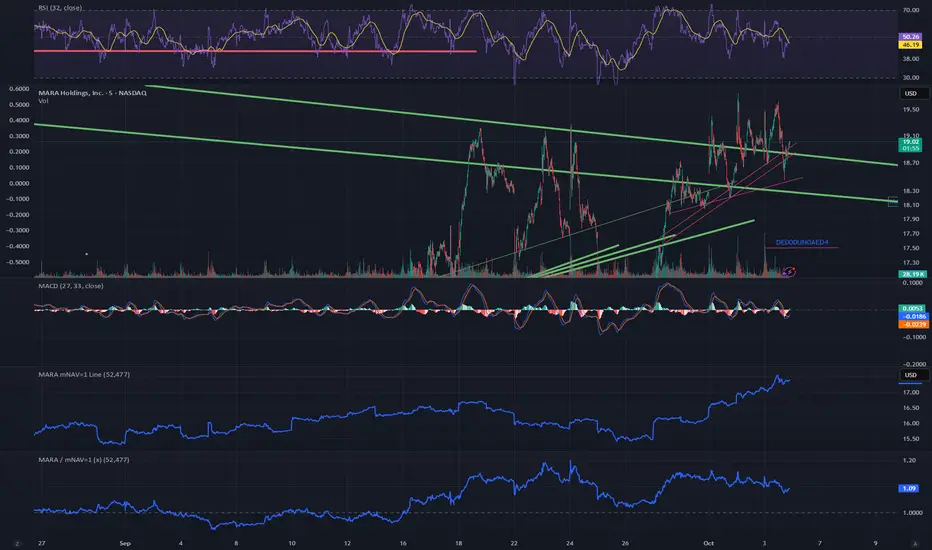
SOL Dashboard v6 — Investor / Swing / Scalp (VWAP, ATR, RS (SCP)
**SOL Dashboard v6 — Investor / Swing / Scalp (VWAP, ATR, RSI, BTC\Ð influence, noise-filters)**
**In short:** a universal indicator for SOLUSDT (Spot/Futures), combining three analysis horizons — Investor (D1), Swing (H1/H4), and Scalp (5m/3m/1m) — in a single script. It provides clean signals (arrows), a summary table of layer states, alerts, as well as a set of noise filters (VWAP/RSI/volume/EMA “gap”/candle body requirement/cooldown). Optional BTC/ETH trend influence filters are available. Suitable for both spot and futures.
---
### What the indicator does
**Investor (HTF, default D1):** market background. EMA(50/200) → defines long-term phase (BULL/BEAR/NEUTRAL).
**Swing (MTF, default H1):** medium-term direction. EMA(20/50) + weekly VWAP (option).
**Scalp (LTF, default 5m):** quick entries. EMA(9/21) → SCALP BUY/SELL arrows strictly at the crossover candle, plus filters.
---
### Visual elements
* EMA lines for each layer (toggled on/off).
* VWAP lines: daily (scalp filter) and weekly (swing filter).
* SCALP BUY / SCALP SELL arrows (optional).
* Table in the top-right corner: Investor/Swing/Scalp modes and hints (including BTC/ETH states if influence is enabled).
* (Optional) Debug label — shows which filter is blocking the signal (RSI/VWAP/GAP/BODY/VOL/AGREE/CD).
---
### Signals (arrow logic)
**Base trigger:** crossover(EMA Fast, EMA Slow) on bar close (default EMA9/21 for LTF).
Arrows appear only if confirmations are met:
1. EMA slope matches signal (both rising for BUY / both falling for SELL).
2. Candle closed on the “correct” side of both EMAs (above/below).
3. Noise filters (toggleable/configurable):
* VWAP (daily): BUY only above VWAP; SELL only below.
* RSI(14): BUY if RSI>50; SELL if RSI<50.
* EMA-Gap (%): minimum difference between Fast/Slow EMAs (avoids micro-crossovers in chop).
* Body ratio: minimum body-to-range ratio (filters out dojis/wicks).
* Volume filter: volume ≥ median over N bars (default 20).
* Cooldown: minimum bars between same-direction signals.
4. Trend agreement (optional): requires alignment with Swing and BTC/ETH Swing modes.
**Result:** an arrow appears at the crossover only if all active filters are satisfied.
---
### Alerts
* **SCALP BUY (filtered):** “ETH/SOL scalp BUY (cross-confirmed)”
* **SCALP SELL (filtered):** “ETH/SOL scalp SELL (cross-confirmed)”
* (Optional) EXIT signals (if included in your build): exit on opposite side of EMA25 or VWAP.
---
### BTC/ETH influence (optional)
* Toggleable trend filters:
* Script checks BTCUSDT and/or ETHUSDT Swing states (EMA20/50 on H1/H4).
* BUY only if BTC/ETH are in BULL and SOL(H1) is BULL.
* SELL only if all corresponding Swing modes are BEAR.
This increases accuracy in trending markets (can be disabled in chop if you want more entries).
---
### Recommended presets
**1) Conservative (cleaner, less noise):**
* LTF = 5m (or 3m); EMA 9/21
* VWAP daily: ON, RSI: ON
* minEmaGapPct: 0.12–0.14%
* minBodyRatio: 0.60–0.70
* cooldownBars: 7–10
* BTC/ETH agreement: ON
* confirmBars: 1 (or 0 in trends)
**2) Base (balanced):**
* LTF = 5m; EMA 9/21
* VWAP: ON, RSI: ON
* minEmaGapPct: 0.08–0.12%
* minBodyRatio: 0.55–0.65
* cooldownBars: 5–7
* BTC/ETH agreement: ON in trend / OFF in chop
* confirmBars: 0 (or 1 in chop)
**3) Aggressive (more entries):**
* LTF = 3m or 1m; EMA 7/14 (or 7/25 if enabled)
* VWAP: ON, RSI: ON
* minEmaGapPct: 0.06–0.08%
* minBodyRatio: 0.50
* cooldownBars: 3–5
* BTC/ETH agreement: OFF in chop
* confirmBars: 0 (or 1 if too many false signals)
---
### How to read the summary table
* **Investor (D1):** EMA50 vs EMA200 → BULL/BEAR/NEUTRAL.
* **Swing (H1/H4):** EMA20 vs EMA50 (+ W-VWAP) → trade direction.
* **Scalp (LTF):** EMA Fast vs EMA Slow → short-term phase.
* **BTC / ETH (Swing):** their states (if influence enabled).
👉 Alignment of Investor + Swing + Scalp in one direction = maximum trend strength.
👉 Disagreement = reduce position size / wait for confirmation.
---
### Practical application
* **Entries:** SCALP arrows in Swing direction (and optionally BTC/ETH) + above/below VWAP.
* **Stops:** recommended ATR(14, LTF) × 1.6–2.0 (or beyond EMA21/EMA25).
* **Targets:** at least 1.8–2.2 R, take 30–50% at +1R, leave remainder as trailing (EMA9/EMA25/VWAP).
* **Trend filter:** trade longs mainly when price > daily VWAP and Swing = BULL (and vice versa).
---
### Settings (key parameters)
* Independent TFs for Investor / Swing / Scalp.
* EMA Fast/Slow set separately for each layer.
* VWAP (Daily/Weekly) as toggleable filters.
* RSI filter (BUY >50 / SELL <50).
* Noise filters: EMA-Gap, Body ratio, Volume ≥ median, Cooldown.
* Trend agreement: BTC/ETH Swing + SOL Swing.
* Debug mode: shows which filter is blocking a signal.
---
### FAQ
**Why no arrows when “crossover is visible”?**
Because arrows are plotted on bar close only if all active filters (VWAP/RSI/GAP/BODY/VOL/AGREE/CD) are satisfied. Enable Debug to see which filter blocks the signal.
**When to enable BTC/ETH influence?**
In trending markets → ON (accuracy ↑). In chop, if you want more entries → OFF.
**Works on Spot/Futures?**
Yes. But remember: futures fees are charged on position notional, not margin — factor this into risk management.
---
### Disclaimer
This is a research tool. Not financial advice. Trading crypto assets and derivatives carries high risk (especially with leverage). Always use stop-losses and manage risk per trade.
---
\#SOL #SOLUSDT #Scalping #Swing #Investor #VWAP #EMA #RSI #ATR #Crypto #Futures #NoiseFilters #BTCInfluence #ETHInfluence #TrendFilter #TradingView

Multi-Asset Trend Background [SwissAlgo]Multi-Asset Trend Background
---------------------------------------------------------
Purpose
This indicator colors the chart background green (uptrend) or red (downtrend) to show the broad phases of a selected asset or ratio (for example SP500, or Gold), regardless of the current ticker on the chart (for example BTC).
The aim is not to generate signals, but to show when the selected asset (such as SP500 or Gold) was in a sustained uptrend or downtrend, so you can compare another chart (for example BTC) against that backdrop.
It helps frame price action in context, highlighting how macro drivers often align with or diverge from other markets.
From mid-2016 to late-2017, the SP500 was in a clear uptrend — Bitcoin rallied strongly in the same period, showing alignment between equities and crypto risk-taking.
When Gold trended higher, the SP500 often weakened, reflecting their tendency to move inversely in longer cycles.
As HYG/TLT turned down in early 2020, QQQ also struggled — illustrating how credit risk appetite is linked to equity performance.
During periods of DXY strength, Gold frequently showed the opposite trend, consistent with the historical dollar–gold relationship.
When RSP/SPY trended down, rallies in the S&P 500 were driven by a narrow group of large-cap stocks, while a rising ratio indicated broad market participation.
---------------------------------------------------------
Why it May Help You
Provides context for asset correlations.
Helps identify whether a chart is moving with or against its macro environment.
Useful for cycle mapping and historical study of market phases.
Filters noise and emphasizes established trends rather than short swings.
---------------------------------------------------------
How it Works
You select an asset or ratio from a dropdown.
The script calculates a mid-term moving average, then measures its slope, slope change, and slope acceleration to quantify the trend’s direction and consistency.
A longer-term moving average filter defines whether the long-term backdrop is bullish or bearish.
Background Coloring rules:
Green = slope strongly positive in line with long-term uptrend, or downtrend showing constructive reversal signs.
Red = slope strongly negative in line with long-term downtrend, or uptrend showing weakening slope.
No shading = neutral or mixed conditions.
This slope-based approach avoids the limitations of simple MA crosses, aiming to capture broad, consistent trend phases across different assets, with a mid/long-term view.
---------------------------------------------------------
Assets You Can Select
EQUITIES – good reference to gauge risk appetite in financial markets
SP500 = broad benchmark. Uptrend = strength in US equities signalling risk-on conditions; downtrend = weakness, risk-off market phase.
NASDAQ = tech and growth stocks. Uptrend = technology/growth leadership, risk appetite; downtrend = tech underperformance and fading risk appetite.
DOW = industrial and value stocks. Uptrend = industrial/value strength/economic strength; downtrend = weakness in traditional sectors and potential economic downturn.
RUSSELL2000 = small caps. Uptrend = typical in risk-on environments and FOMO; downtrend = small-cap underperformance, "flight to safety".
COMMODITIES – proxies for inflation, industry, and safe-haven demand.
GOLD = safe-haven. Uptrend = defensive demand rising/risk-off/inflation fears; downtrend = weaker demand for safety.
SILVER = partly industrial, partly safe-haven. Uptrend = stronger industrial cycle, or precious metals demand and risk appetite.
COPPER = industrial barometer. Uptrend = stronger industrial activity; downtrend = economic slowdown concerns.
CRUDE OIL = energy prices. Uptrend = rising energy/inflation pressures; downtrend = weaker demand or supply relief.
NATURAL GAS = volatile energy prices. Uptrend = higher energy costs and inflation pressure; downtrend = easing energy conditions.
BONDS / FX – monetary policy, credit, and risk appetite signals.
TLT = long-term US bonds. Uptrend = falling yields (bond demand)/flight to safety; downtrend = rising yields (risk on)
HYG = high-yield credit. Uptrend = strong credit appetite; downtrend = risk aversion in credit markets.
DXY = US dollar index. Uptrend = dollar strength (weaker EUR, GBP, SEK, etc); downtrend = dollar weakness.
USDJPY = carry trade proxy. Uptrend = stronger USD vs JPY (risk appetite); downtrend = JPY strength (risk-off).
CHFUSD = Swiss franc. Uptrend = franc strength (defensive flow); downtrend = franc weakness.
YIELD INVERSION = US10Y–US02Y. Uptrend = curve steepening; downtrend = inversion deepening (higher recession risk).
HOME BUILDERS = US housing sector. Uptrend = housing sector strength (risk on); downtrend = weakness (risk off).
EURUSD = euro vs dollar. Uptrend = euro strength (risk appetite); downtrend = euro weakness (risk aversion).
CRYPTO – digital asset benchmarks.
BITCOIN = digital gold. Uptrend = BTC strength; downtrend = BTC weakness.
CRYPTO_TOTAL = entire crypto market cap. Uptrend = broad crypto growth; downtrend = contraction.
CRYPTO_ALTS = altcoin market cap. Uptrend = altcoin expansion (often “alt season”); downtrend = contraction.
RATIOS – relative measures to extract macro signals.
COPPER/BTC = compares industrial cycle vs Bitcoin cycle. Uptrend = copper outperforming BTC; downtrend = BTC outperforming copper. Seems aligned with BTC macro tops and bottoms in the mid/long run.
RSP/SPY = market breadth (equal-weight vs cap-weighted). Uptrend = strong broad participation in market growth; downtrend = narrow leadership (fewer stocks leading the growth).
PCE/CPI = Fed’s inflation measure (PCE) vs consumer perceived inflation (CPI). Uptrend = PCE rising faster than CPI; downtrend = CPI running hotter than PCE. Fluctuates around 1; values above 1 may indicate hawkish Fed stands, values < 1 may indicate more dovish Fed stands.
HYG/TLT = credit vs bonds. Uptrend = risk appetite (high-yield outperforming long-term
treasury bonds); downtrend = risk aversion.
GOLD/SILVER = defensive vs cyclical metals. Uptrend = gold outperforming (risk-off tilt); downtrend = silver outperforming (risk-on tilt).
EURUSD/BTC = fiat vs crypto. Uptrend = EUR strengthening vs BTC; downtrend = BTC strengthening vs EUR. In general, the BTC trend is aligned EUR/USD trend.
---------------------------------------------------------
Limitations
Trend detection may lag by design to reduce noise.
Ratios rely on the availability and session rules of their components.
Background colors update on bar close; intra-bar values may differ.
Parameters are fixed and may not suit all assets equally.
---------------------------------------------------------
Disclaimer
This script is for educational and research purposes only. It does not provide financial advice or trade recommendations. Historical trend alignment does not guarantee future outcomes. Use with additional independent analysis.
