Optimized Keltner Channels SL/TP Strategy for BTCThis strategy is optimized for Bitcoin with the Keltner Channel Strategy, which is TradingView's built-in strategy. In the original Keltner Channel Strategy, it was difficult to predict the timing of entry because the Buy and Sell signals floated in the middle of the candle in real time. This strategy is convenient because if the bitcoin price hits the top or bottom of the Keltner Channel and closes the closing price, you can enter Buy or Sell at the next candle start price. In addition, this strategy provides Stop Loss and Take Profit functions to maximize profit.
_________________________________
Recommended settings are below.
- length: 9
- multiplier: 1
- source: close
- (v) Use EMA
- Bands Style: Average True Range
- ATR Length: 19
- Stop Loss (%): 20
- Take Profit (%) : 20
_________________________________
- length: 9
- multiplier: 1
- source: close
- (v) Use EMA
- Bands Style: Average True Range
- ATR Length: 18
- Stop Loss (%): 20
- Take Profit (%) : 5
_________________________________
▶ Usefulness and Originality
- Stop Loss and Take Profit functions are available
- Convenient Buy and Sell entry compared to the original Keltner Channel Strategy
- Optimized for BTCUSD market (maximizing profits)
___________________________________________
이 전략은 TradingView의 Built-in 전략인 Keltner Channel Strategy를 비트코인에 맞게 최적화되었습니다. 기존의 Keltner Channel Strategy는 Buy, Sell 신호가 캔들 중간에 실시간으로 떠서 진입 시점을 예측하기 어려운 불편함이 있었지만 이 전략은 비트코인 가격이 Keltner Channel 상단 혹은 하단을 찍고 종가를 마감하면 그 다음 캔들 시작가에서 Buy 혹은 Sell 진입이 가능하여 편리합니다. 또한, 이 전략은 Keltner Channel을 만나서 캔들을 마감한 가격 (bprice, sprice)을 시각적으로 plot을 제공하여 타점 및 차트를 보기에 편리하며 손절가 및 목표가를 지정한 백테스팅이 가능합니다.
스크립트에서 "BTC"에 대해 찾기

Crypto swing correlation RSI and SMAThis is a crypto swing strategy, designed for long term periods and correlated pairs with crypto market total(or other coins used as correlation, however I recommend total of crypto or btc)
Its components are:
RSI with a very length
Correlation candles
SMA 9
Rules for entry:
For long : RSI is above 51 level and going higher and close of the candle is above the SMA
For short :RSI is below 49 and going lower and close of the candle is below the SMA
Rules for exit:
We exit when we encountered an opposite condition than the entry one, or based on take profit/stop loss levels.
If you have any questions let me know !

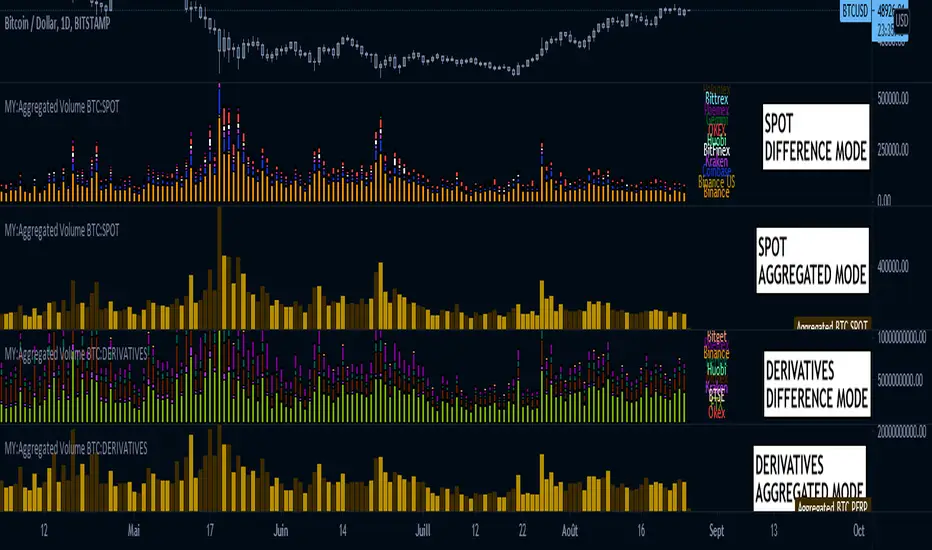
MY:Aggregated Volume BTC:DERIVATIVES█ MY Aggregated Volume BTC DERIVATIVES
This indicator shows a panel to display the Bitcoin Trading Volume of different exchanges. A lot of traders follow the default volume indicator provided by tradingview. This default indicator shows the volume for the current ticker (example BTCUSD:BITSTAMP), but each exchange has its own volume.
In a matter of visibility and accessibility, I've decided to aggregate the volume of almost all the Bitcoin exchanges (tickers) in tradingview.
This indicator helps identifying decreasing volume, where the volume comes from (spot or derivatives). A decreasing DERIVATIVES volume isn't a good sign as it shows a decrease in the buying pressure.
The panel has 1 main configuration : Display mode, showing Aggregated (all exchanges in one bar) or Difference (Stacked bar)
The other configuration Legend Item Gap and Legend X Gap is for when the difference mode is selected. It affects the position of the legend. Some might have smaller screens, bigger screens, viewport zoomed in etc.
Due to the number of exchanges, and pinescript limitations, I had to split the volume in 2 indicators, the SPOT volume, and the DERIVATIVES volume. The script in this page is specific to the DERIVATIVES volume. For the SPOT, please refer to my other available script.
Exchange list :
// OKEX:BTCUSDPERP
// OKEX:BTCUSDTPERP
// FTX:BTCPERP
// BTSE:BTCPFC
// KRAKEN:XBTUSDPERP
// BITMEX:XBTUSD
// HUOBI:BTCPERP
// DERIBIT:BTCPERP
// BINANCE:BTCPERP
// BINANCE:BTCUSDTPERP
// PHEMEX:BTCUSD
// BITGET:BTCUSDPERP
// BITGET:BTCUSDTPERP
MY:Aggregated Volume BTC:SPOT█ MY Aggregated Volume BTC SPOT
This indicator shows a panel to display the Bitcoin Trading Volume of different exchanges. A lot of traders follow the default volume indicator provided by tradingview. This default indicator shows the volume for the current ticker (example BTCUSD:BITSTAMP), but each exchange has its own volume.
In a matter of visibility and accessibility, I've decided to aggregate the volume of almost all the Bitcoin exchanges (tickers) in tradingview. Some have been commented out (Kucoin, FTX) due to high volume data which was hiding the other ones.
This indicator helps identifying decreasing volume, where the volume comes from (spot or derivatives). A decreasing SPOT volume isn't a good sign as it shows a decrease in the buying pressure.
The panel has 1 main configuration : Display mode, showing Aggregated (all exchanges in one bar) or Difference (Stacked bar)
The other configuration Legend Item Gap and Legend X Gap is for when the difference mode is selected. It affects the position of the legend. Some might have smaller screens, bigger screens, viewport zoomed in etc.
Due to the number of exchanges, and pinescript limitations, I had to split the volume in 2 indicators, the SPOT volume, and the DERIVATIVES volume. The script in this page is specific to the SPOT volume. For the DERIVATIVES, please refer to my other available script.
Exchange list :
// BINANCE:BTCUSD
// BINANCE:BTCUSDT
// BINANCE:BTCEUR
// COINBASE:BTCUSD
// COINBASE:BTCUSDT
// COINBASE:BTCEUR
// KRAKEN:XBTUSD
// KRAKEN:XBTUSDT
// KRAKEN:XBTEUR
// BITFINEX:BTCUSD
// BITFINEX:BTCEUR
// HUOBI:BTCUSDT
// HUOBI:BTCUSDC
// OKEX:BTCUSDT
// FTX:BTCUSD DISABLED FOR NOW, TO MUCH VOLUME
// FTX:BTCUSDT DISABLED FOR NOW, TO MUCH VOLUME
// KUCOIN:BTCUSDT DISABLED FOR NOW, TO MUCH VOLUME
// KUCOIN:BTCUSDC DISABLED FOR NOW, TO MUCH VOLUME
// GEMINI:BTCUSD
// GEMINI:BTCEUR
// PHEMEX:BTCUSDT
// BITTREX:BTCUSD
// BITTREX:BTCUSDT
// BITTREX:BTCEUR

PI_GRM Bitcoin Golden Ratio Multipier [wozdux]Golden Ratio Multiplier
Formula GRM=MA350(BTC USD) * (1.6;2;3;5;8;13;21)
The multiplier examines medium-and long-term time cycles.
For this, a multiple of 350 MA is used to determine the areas of potential resistance.
Additionally, fibo levels from the main line.
version 2021 year modification

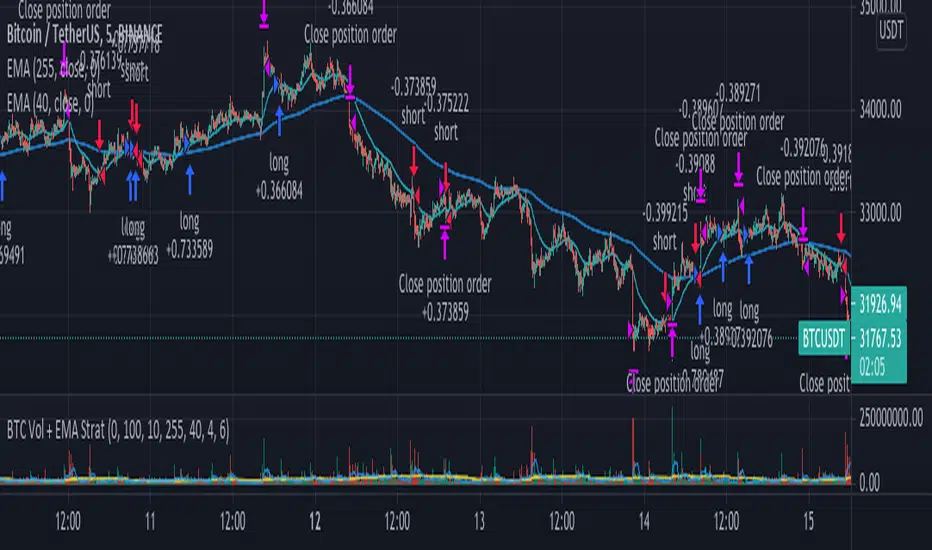
Aggregate BTC Volume + EMA Strat// This strategy buys when the price crosses the Fast EMA. It can go long only
// when the price is above the slow EMA and short when is below. The exit
// is determined by volume spikes, when the volume is greater than the Volume
// MA multiplied by the assigned input multiplier. Thanks to MartinShkreli
// for the Aggregated BTC volume. There is also a Maximum Loss filter which
// should be modified depending on the traded market.
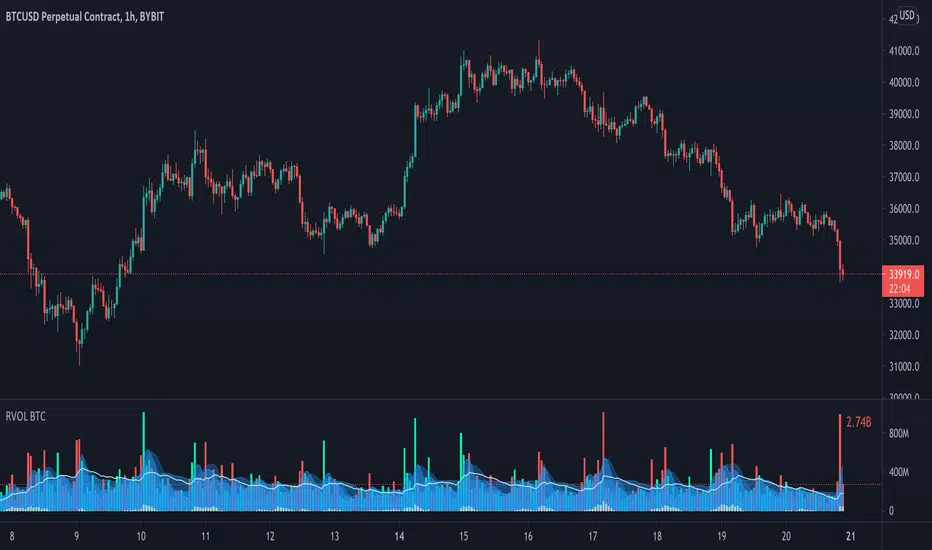
Relative Volume - BITCOINRelative Volume indicator that pulls data from 9 different Bitcoin exchanges. Please note that this indicator only works with BTC and will not use data from your current chart.
Includes the following exchanges:
BYBIT:BTCUSD
BITFINEX:BTCUSD
BITSTAMP:BTCUSD
INDEX:BTCUSD
COINBASE:BTCUSD
FTX:BTCUSD
PHEMEX:BTCUSD
BITTREX:BTCUSD
POLONIEX:BTCUSDT
Hunt Bitcoin CoT Buy/Sell signalWhy Bother another CoT signal?
Its different & focused on the Insider's.
Performance -
This Indicator provided a
1. Signal 1 = 26th March 2019 = SUPER LONG at $4,500 that saw a near $14,000 run up
2. Signal 2 = 18th & 24th June 2019 = SHORT at the second & final level $11,700 after repeated attempts & failure in the $13K range, the mini Echo Bitcoin Bull of 2019
3. Signal 3 = 17th December 2019 = LONG $6,900, Bitcoin rallied to Mid $10,500's
4. Signal 4 = 18th Feb 2020 = SUPER SHORT from $9,700's to a final extreme Low of $3,000, calling the CV-19 collapse
5. Signal 5 = 17th March 2020 = LONG from $5,400 no closure point yet
6. Signal 6 = 29th June 2020 = SUPER LONG reiterate from $10,700 no closure sell signal yet
7. Signal 7 = 17th May 2020 = LONG another accumulate LONG with no sell signal yet generated at Post H&S's low of $33,000
Note - This indicator only commences March 2019, as Bitcoin futures were a recent introduction and needed to settle for 6 months in both use and data, no signals were meaningful prior & data was light.
What is Provided. - Please note the need to also add the Hunt Bitcoin Historical Volatility Indicator for full understanding.
We provide 3 things with the 3 indicators.
'Insider' indications from Largest players in the futures market.
1. Bitcoin Macro Buy Signals.
a) The Bitcoin Commitment of Traders results see us focus solely on Largest 4 Short Open Interest & Largest 4 Long Open Interest aspects of the CoT Release data.
When the difference - is tight, a kind of pinch, these have been great Buy signals in Bitcoin.
We call this difference the Delta & When Delta is 5% or less Bitcoin is a Buy.
2. Bitcoin Macro Sells.
a) A sell signal is Triggered in Bitcoin at any point the Largest 4 short OI > or = to 70
3. AMPLIFIER Trade signals 'Super' Longs or Shorts -
Extreme low volatility events leads to highly impulsive & volatile subsequent moves, if either of 1 or 2 above occur, combined with extreme low volatility
a 'Super Long' or 'SUPER SELL' is generated. In the case of the short side, given Bitcoins general expansive and MACRO Bull trend since inception, we seek an additional component
that is an extreme differential/Delta reading between 4 biggest Longs & Shorts OI.
Namely CoT Delta also must be > 47.5%
We also have a Cautionary level, where it is not necessarily a good idea to accumulate Bitcon, as a better opportunity lower may avail itself, see conditions below.
So the required logic explicitly stated below for all Signals.
1. Long - Hunt Bitcoin CoT Delta < or = 5
2. SUPER Long - Hunt Bitcoin CoT Delta < or = 5; and 2 Day Historical Bitcoin Volatility = or < 20
3. Short - Largest 4 Sellers OI = or > 70
4. SUPER Short - Largest 4 Sellers OI = or > 70; AND..
Hunt Bitcoin CoT Delta = or > 47.5 AND 2 Day Historical BTC Volatility = or < 20
5. Caution - Largest 4 Sellers OI = or > 67.5 AND Hunt Bitcoin CoT Delta = or > 45
WARNING SEE Notes Below
Note 1 - = Largest 4 Open Interest Shorts
Note 2 - = Largest 4 Open Interest Longs
Note 3 - = Hunt Cot Delta = (Largest 4 sellers OI) -( Largest 4 Buyers OI)
Caution = Avoid new Bitcoin Accumulation Right Now, A sell signal might follow Enter on next Long
Note 4 - The Hunt Bitcoin COT Delta signal is a Largest 'Insider' Tracking tool based on a segment of Commitment of Traders data on Bitcoin Futures, released once a week on a Friday.
It is a Macro Timeframe signal , and should not be used for Day trading and Short Timeframe analysis , Entries may be optimised after a Hunt Bitcoin CoT Signal is generated by separate shorter Timeframe analysis.
Note 5 - The Historical Bitcoin Volatility is an additional 'Amplifier' component to the 'Hunt Bitcoin Cot Delta' Insider Signal
Note 6 - The Historical Bitcoin Volatility criteria varies by timeframe, the above levels are those applying on a Two Day TF Chart, select this custom timeframe in Trading View.
if additional criteria are met for LONG & SHORT insider signals, they may become 'Super Longs/Shorts', see conditions box above.

GBTC PremiumThis script simply shows the premium (when positive) and discount (when negative) associated with GBTC as compared with its estimated NAV based on BTC underlying holdings. This will of course need to be updated frequently for accuracy, but it serves as a rough estimate for educational purposes.

Korea PremiumA simple indicator based on the percentage price difference between Korean crypto markets and western markets.
It currently shows the premium for BTC & ETH.
If it's positive (red) it means that the Korean market is trading at a premium.
Vice versa negative (blue) means the West is trading at a premium.
Because the Korean crypto market is so closed off (because of regulations) the premium sometimes gets really wild.
The Korean average is based on Bithumb & Korbit prices.
The index made for the west is based on Coinbase, Kraken and Bitstamp.
By default it uses closing prices for the calculation but you can change that.
You can also change the timeframe in the settings although it's probably best that you keep it at "same as chart".
It's free so you can just add it to your favourites and start using it.

Full CRYPTO pack macd, rsi, obv, ema alert versionThis is the indicator version of a simple, yet very efficient crypto strategy, adapted to 4h time frame, on big coins like ETH and BTC . However it can be adapted to other markets, timeframes etc
For this strategy I use a combination of a trend line , an oscillator, price action and volume .
This study has alert for both long and short entries/exit.
The rules are the next ones:
Long : we check that current candle is ascending and above the moving average, the macd is in positive range, rsi is below overbought level and volume is bigger than the moving avg of volume .
For short, we have the opposite long rules.
If you have any questions, please let me know !

MACD oscillator with EMA alert version 4HThis is the study/indicator alert version of the macd + ema strategy.
The strategy details are the following :
Is a simple, yet efficient strategy, which is made from a combination of an oscillator and a moving average.
Its setup for 4h candles with the current settings, however it can be adapted to other different timeframes.
It works nicely ,beating the buy and hold for both BTC and ETH over the last 3 years.
As well with some optimizations and modifications it can be adapted to futures market, indexes(NASDAQ, NIFTY etc), forex( GBPUSD ), stocks and so on.
Components:
MACD
EMA
Time condition
Long/short option
For long/exit short we enter when we are above the ema , histogram is positive and current candle is higher than previous.
For short /exit long , when close below ema , histo negative and current candles smaller than previous
If you have any questions please let me know !

MACD oscillator with EMA strategy 4H This is a simple, yet efficient strategy, which is made from a combination of an oscillator and a moving average.
Its setup for 4h candles with the current settings, however it can be adapted to other different timeframes.
It works nicely ,beating the buy and hold for both BTC and ETH over the last 3 years.
As well with some optimizations and modifications it can be adapted to futures market, indexes(NASDAQ,NIFTY etc), forex(GBPUSD), stocks and so on.
Components:
MACD
EMA
Time condition
Long/short option
For long/exit short we enter when we are above the ema, histogram is positive and current candle is higher than previous.
For short /exit long , when close below ema, histo negative and current candles smaller than previous
If you have any questions please let me know !

(IK) Stoch-60-15This strategy uses 60 minute and 15 minute stochastic data to determine entry and exit; it only executes long trades. I've only used this on BTC/USD, but I imagine the concepts employed should hold for any ticker
The script builds a simple Stochastic indicator for the current timeframe, and it also plots a single stochastic line for a higher resolution time frame. I've found good results trading on 15 minutes with a 60 minute higher resolution.
We enter a trade if the higher resolution stochastic is in an uptrend, if the current resolution stochastic is in an uptrend, and if the current stochastic value is less than 50.
We exit a trade when the current stochastic value crosses below 80 or the trailing stop loss is hit.
Stop loss is calculated with the input value, Stop Loss Percent. This value represents the percent of capital you're willing to lose before exiting a trade. A stop loss percent of 0.050 means your trade will exit if it falls 5% from the highest high since entering a trade. You will have at least 95% of your original capital left. There is no option to change a trailing stop loss to a set stop loss (in order to keep the code as simple as possible), however, you can turn it off by setting Stop Loss Percent to 1.
I tried to keep the script itself lightweight and very easy to understand, so it's not very customizable in regards to input options. You can change stochastic data, as well as the trailing stop percentage. The script can be adjusted to other timeframes, however this requires a small change in the code (details in script comments). Changing just the "Higher Resolution" input will not produce expected results
My hope is that by keeping it lightweight and simple, it will be easier for you to adjust to your specific needs, or work into a larger strategy.

Momentum Strategy (BTC/USDT; 1h) - MACD (with source code)Good morning traders.
It's been a while from my last publication of a strategy and today I want to share with you this small piece of script that showed quite interesting result across bitcoin and other altcoins.
The macd indicator is an indicator built on the difference between a fast moving average and a slow moving average: this difference is generally plottted with a blue line while the orange line is simply a moving average computed on this difference.
Usually this indicator is used in technical analysis for getting signals of buy and sell respectively when the macd crosses above or under its moving average: it means that the distance of the fast moving average (the most responsive one) from the slower one is getting lower than what it-used-to-be in the period considered: this could anticipate a cross of the two moving averages and you want to anticipate this potential trend reversal by opening a long position
Of course the workflow is specularly the same for opening short positions (or closing long positions)
What this strategy does is simply considering the moving average computed on macd and applying a linear regression on it: in this way, even though the signal can be sligthly delayed, you reduce noise plotting a smooth curve.
Then, it simply checks the maximums and the minimums of this curve detecting whenever the changes of the values start to be negative or positive, so it opens a short position (closes long) on the maximum on this curve and it opens a long position (closes short) on the minimum.
Of course, I set an option for using this strategy in a conventional way working on the crosses between macd and its moving average. Alternatively you can use this workflow if you prefer.
In conclusion, you can use a tons of moving averages: I made a function in pine in order to allw you to use any moving average you want for the two moving averages on which the macd is based or for the moving average computed on the macd
PLEASE, BE AWARE THAT THIS TRADING STRATEGY DOES NOT GUARANTEE ANY KIND OF SUCCESS IN ADVANCE. YOU ARE THE ONE AND ONLY RESPONSIBLE OF YOUR OWN DECISIONS, I DON'T TAKE ANY RESPONSIBILITY ASSOCIATED WITH THEM. IF YOU RUN THIS STRATEGY YOU ACCEPT THE POSSIBILITY OF LOOSING MONEY, ALL OF MY PUBBLICATIONS ARE SUPPOSED TO BE JUST FOR EDUCATIONAL PURPOSES.
IT IS AT YOUR OWN RISK WHETHER TO USE IT OR NOT
But if you make money out of this, please consider to buy me a beer 😜
Happy Trading!

[MAD] BTC Multiexchange_CandlesA script which volume weights 4 exchanges and paints the average candlebars of 4 major Crypto-Exchanges
Setup for BTC only but Ticker is changeable
configurable offset for comparison
feel free to modify

Flawless Victory Strategy - 15min BTC Machine Learning StrategyHello everyone, I am a heavy Python programmer bringing machine learning to TradingView. This 15 minute Bitcoin Long strategy was created using a machine learning library and 1 year of historical data in Python. Every parameter is hyper optimized to bring you the most profitable buy and sell signals for Bitcoin on the 15min chart. The historical Bitcoin data was gathered from Binance API, in case you want to know the best exchange to use this long strategy. It is a simple Bollinger Band and RSI strategy with two versions included in the tradingview settings. The first version has a Sharpe Ratio of 7.5 which is amazing, and the second version includes the best stop loss and take profit positions with a Sharpe Ratio of 2.5 . Let me talk a little bit more about how the strategy works. The buy signal is triggered when close price is less than lower Bollinger Band at Std Dev 1, and the RSI is greater than a certain value. The sell signal is triggered when close price is greater than upper Bollinger Band at Std Dev 1, and the RSI is greater than a certain value. What makes this strategy interesting is the parameters the Machine Learning library found when backtesting for the best Sharpe Ratio. I left my computer on for about 28 hours to fully backtest 5000 EPOCHS and get the results. I was able to create a great strategy that might be one of TradingView's best strategies out on the website today. I will continue to apply machine learning to all my strategies from here on forward. Please Let me know if you have any questions or certain strategies you would like me to hyper optimize for you. I'm always willing to create profitable strategies!
P.S. You can always pyramid this strategy for more gains! I just don't add pyramiding when creating my strategies because I want to show you the true win/loss ratio based buying one time and one selling one time. I feel like when creating a strategy that includes pyramiding right off the bat falsifies the win rate. This is my way of being transparent with you all. Have fun trading!

Automated Quarters Theory With BTC and ETHThis is based on "Automatic Quarters Theory Lines" by monzakaamera. Added calculations for BTC and ETH and fixed script to work on the weekends.

MA200W buy sell BTC ColoredA script to help you plan your entrances and exits with beautiful colors for BTC. It just helps to better highlight the gap between the start of the week and the end.
It only work on Weekly.
Info :
Blue ... you can wait, enjoy your life
Green is when you buy
Yellow when you enter bull market
Orange is when you begin to take care of next week
Red when you begin to sell low part
White, if while a week you see white you can sell bigs bags, if it end with White you can close majors positions
Warning White may not appear, if second week after first Red week is not White you can sell large position
Good luck and take a breath

Weighted derivatives premium BTCCan be extended with more derivative or spot pairs, see the comments in the code for instructions. Most importantly, the pairs need to be added to the respective arrays in the same order, so that the weights are applied to the correct pairs.

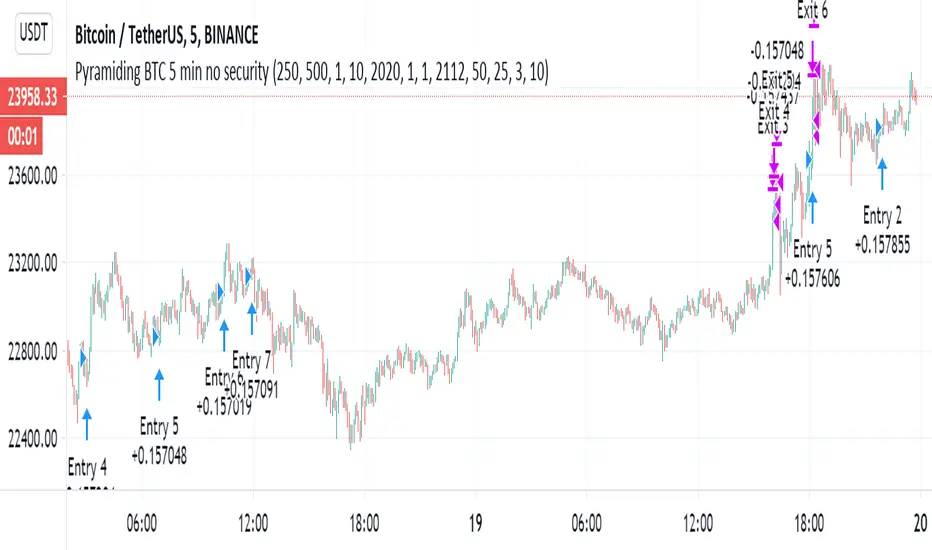
Pyramiding BTC 5 min no securitySince some say that the script with the security is repaint and the results too preety
i decided to run the same script without it. still the best is when security set to 1 min but without the difference not so much.
it just to show the concept of the strategy that based on linear regression cross hull as buy signal
and the the take profit target. so maybe now its also repaint?:)
based
Pyramiding BTC 5 minThe pyramide based on this script with his concent
the strategy is the same as BTC 15 script (look at my open scripts) there it without pyramide
you can use the filter if you wish
one trick if you want it to be more accurate (not mean more profit is to reverse the long and short in the filter ' just it will lose less)
about the strategy of pyrimde you can read in detail from the script of Coinrule
i modify only to have 5 step in the pyramide scheme on 20% of equity (seems more logical)
so let me me know what you think:)