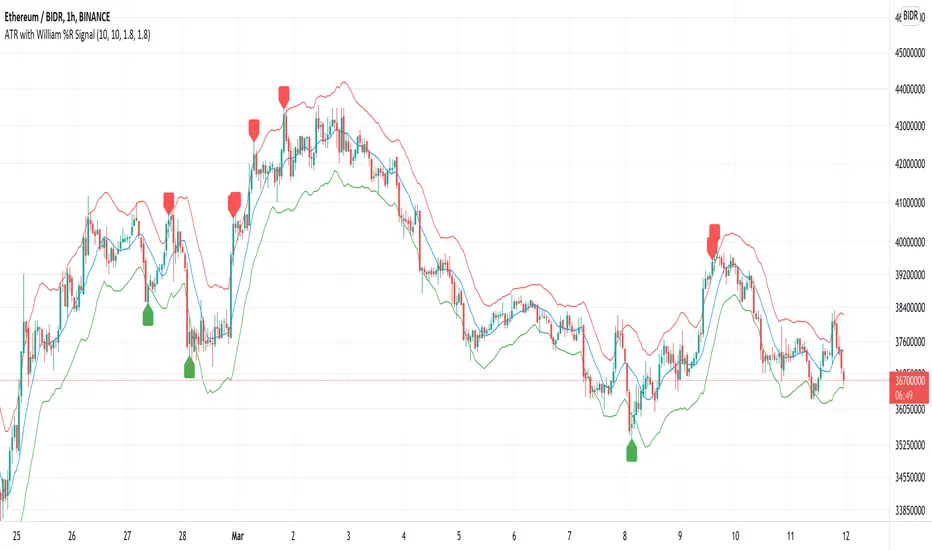
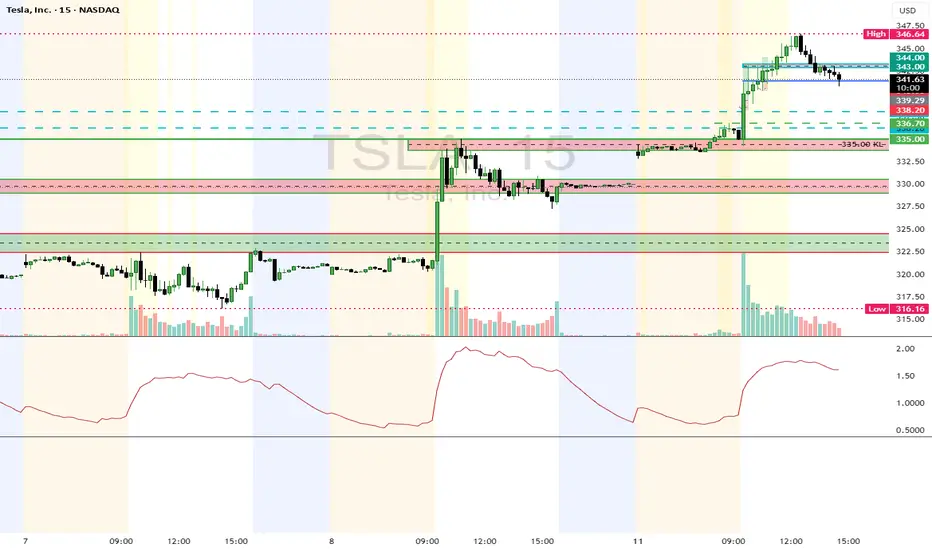
ATR STRUCTURESTATIC LINES SET BY ATR VALUES AND MULTIPLED OBSE$RVED EPERCENTAGES more of a tool I use for me then it is for anyone else.
스크립트에서 "ATR"에 대해 찾기
ATR Trailing Stop + HL2 VWAP + EMAsmain atr/ema script
use this to guage immediate trend on the 2m
use this to guage long term trend on thr 6h and one day charts.
Typicallly most accurate with futures.


ATR-BHEEM-NOCHANGE-CANDLESCandles remain normal — removed barcolor(barCol)
ATR trailing stop line still shows trend direction (green/red)
Optional buy/sell labels added only when trend flips
Clean and ready for intraday 1-min charts

ATR Trailing Stop Without tradepanel Open✅ Only plots ATR trailing stop line
✅ Only colors candles
✅ No trades / entries
✅ No “Strategy Tester” panel
✅ No arrows, markers, or trade lists

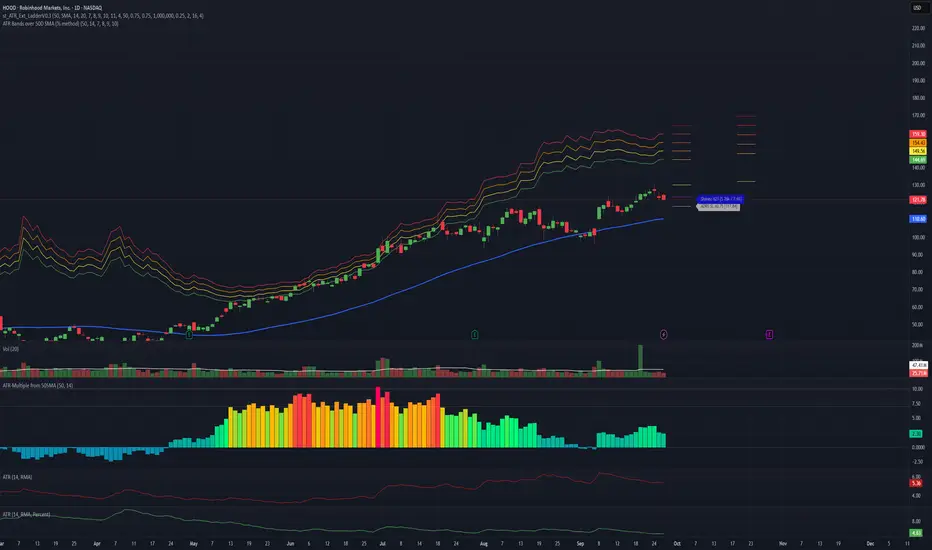
ATR Bands over 50D SMA (% method)Indicator that shows multiples of ATR% above the 50d SMA as bands on a chart, building off of
Jeff Sun 's methodology. You should tinker with the settings to chose your multiples, colors and which multiple lines to show. I don't know if the negative multiple lines have any use, so I turn mine off. Offered as is. I am not a programmer. Note the other indicators shown on the print screen are not mine.
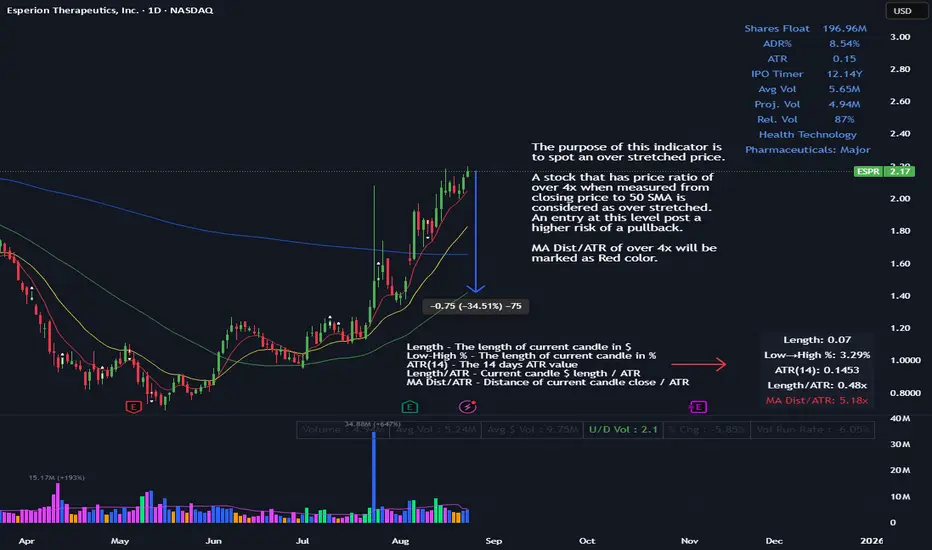
ATR Multiple from MAThe purpose of this indicator is to spot an over stretched price.
A stock that has price ratio of over 4x when measured from closing price to 50 SMA is considered as over stretched. An entry at this level post a higher risk of a pullback.
MA Dist/ATR of over 4x will be marked as Red color.
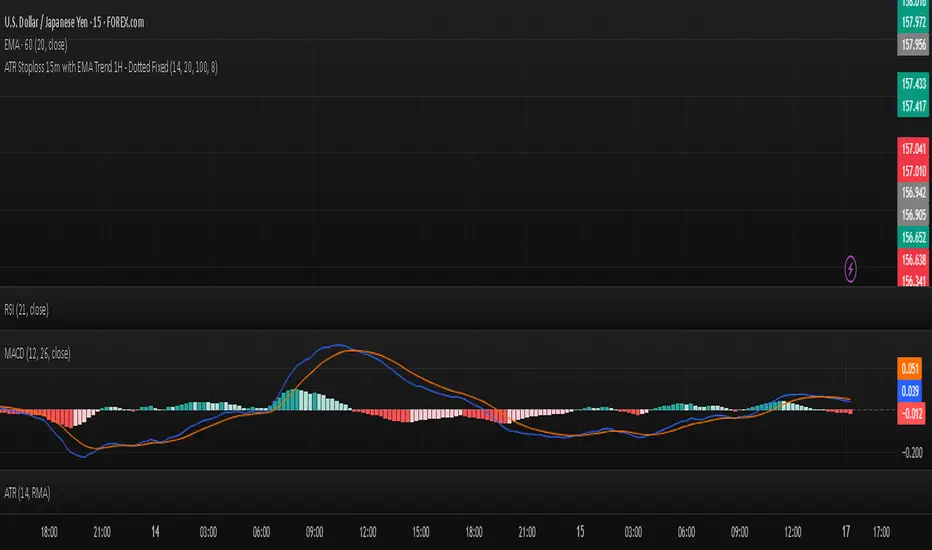
ATR Stoploss 15m with EMA Trend 1H - Dotted Fixeduse this as a basic ATR stoploss. It uses 100 and 20 EMA on 1hr to determine trend.
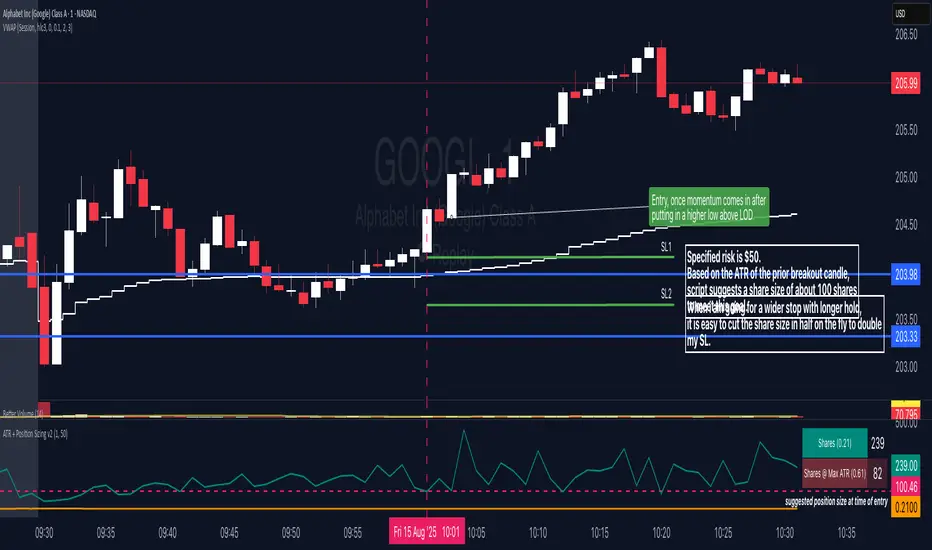
ATR + Position SizingThis is an equalized risk calculation for easy position sizing when trading multiple instruments at the open.
The formula is simple:
Position Size = $ Risk / X-period ATR
ATR Volatility Breakout - Daily (Minimal) - SyTheInvestorGuycolor-coded TradingView Pine Script that highlights the background green/red on days when these ATR breakout conditions
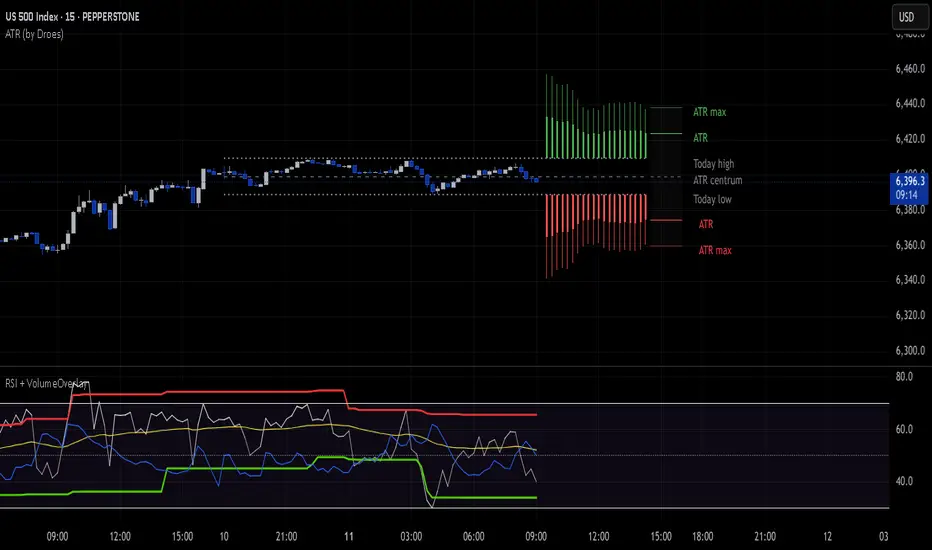
ATR Dynamische Candles 1.2 (by Droes)This script visualizes ATR values as candles to the right of the last candle at today's high and today's low.
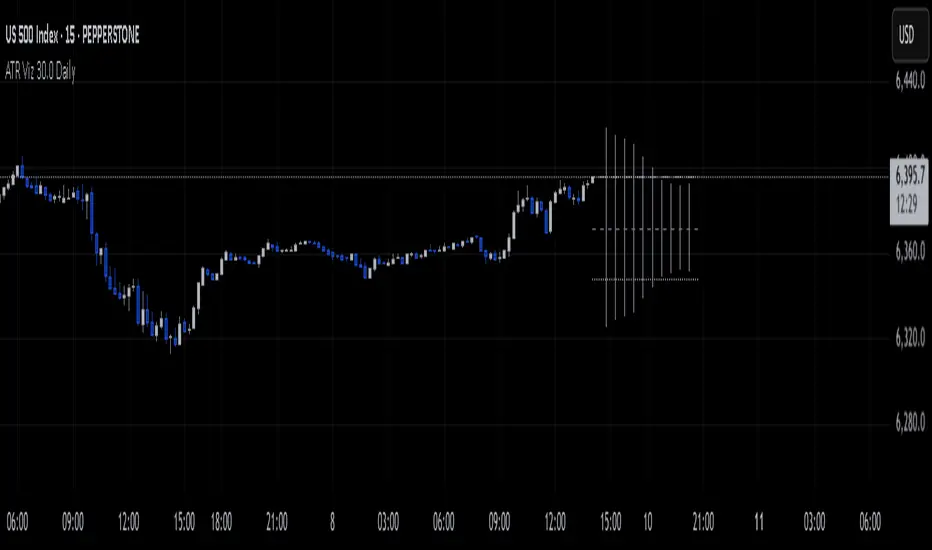
ATR Daily Viz V30.0This script visualizes ATR values as candles to the right of the last candle at today's high and low.
This is the first version.

ATR Daily Viz V30.0This script visualizes ATR values as candles to the right of the last candle at today's high and low.
This is the first version.
ATR % Oscillator - DolphinTradeBot1️⃣ Overview
🔸 This is a simplified version of ATR and TR that shows volatility as percentage changes , making it easier to compare two symbols.
🔸 The indicator compares the volatility of two different assets by calculating the percentage-based price ranges and their moving averages .
📌 This is especially useful for pair traders, as it helps identify which symbol is more volatile, allowing for strategic decisions based on relative movement rather than overall market direction.
2️⃣ How Is It Work?
🔸 For each symbol, it calculates the absolute percentage difference between either:
• Close and Open (net price change), or
• High and Low (daily price range).
🔸 The results are visualized as column bars — the taller the bar, the higher the volatility.
🔸 It also plots a moving average line (SMA) based on the selected range length.
📌 These calculations are independent of the chart you're on — they work purely based on the two selected symbols.
If no symbols are selected, it defaults to using the current chart's symbol.
3️⃣ How to Use It?
With this indicator, you can:
🔸 Compare the volatility between two assets.
🔸 Detect sudden volatility spikes that may signal upcoming momentum.
🔸 Support spread, arbitrage, or correlation-based strategies .
🔸 See which symbol is gaining market attention (a larger difference = more activity).
Example: Compare BTC vs ETH to see which one is dominating in terms of price action or volatility.
4️⃣⚙️ Settings
🔸 Symbol Settings
• Symbol-1 / Symbol-2: Choose the two assets to compare.
• Checkboxes: Enable/disable visibility for each symbol's data.
🔸 Calculation Settings
• Range Average: The number of bars used for the moving average.
• Calculation Source:
- Close-Open: Measures net price movement.
- High-Low: Measures total price range.

ATR 3x Multiplier StrategyBeta version
Volatility and Candle Spikes in Trading
Volatility
Volatility refers to the degree of variation in the price of a financial asset over time. It measures how much the price fluctuates and is often associated with risk and uncertainty in the market. High volatility means larger price swings, while low volatility indicates more stable price movements.
Key aspects of volatility:
Measured using indicators like Average True Range (ATR), Bollinger Bands, and Implied Volatility (IV).
Influenced by factors such as market news, economic events, and liquidity.
Higher volatility increases both risk and potential profit opportunities.
Candle Spikes
A candle spike (or wick) refers to a sudden price movement that forms a long shadow or wick on a candlestick chart. These spikes can indicate strong buying or selling pressure, liquidity hunts, or stop-loss triggers.
Types of candle spikes:
Bullish Spike (Long Lower Wick): Indicates buyers rejected lower prices, pushing the price higher.
Bearish Spike (Long Upper Wick): Suggests sellers rejected higher prices, pushing the price lower.
Stop-Loss Hunt: Market makers may trigger stop-losses by creating artificial spikes before reversing the price.
News-Induced Spikes: Economic data releases or unexpected events can cause sudden price jumps.
Understanding volatility and candle spikes can help traders manage risk, spot entry/exit points, and avoid false breakouts. 🚀📈

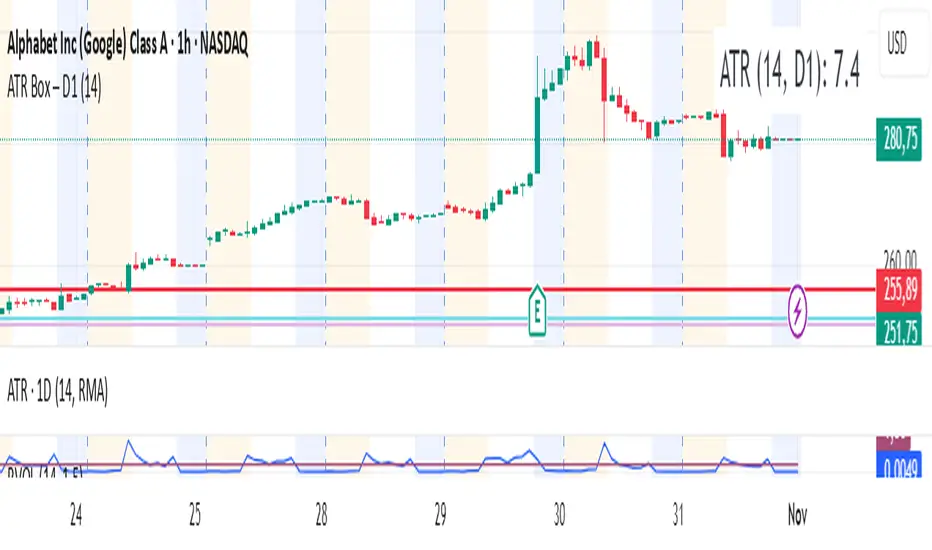
ATR Daily BandThis indicator draws an upper and lower band for each day. It uses the Average True Range calculation (with configurable lookback) and places the band at 1ATR above and 1ATR below the daily open.
I use this indicator as a simple gauge to tell how significant price movement is, and get a feel for the daily volatility. Due to the fractal nature of price action, it can be difficult to determine if a price movement is significant while zoomed in on a single intraday chart. Using this indicator, I can tell if the price action is approaching the ATR or if it's just staying within the band.
Strategies: Useful for both mean reversion and momentum strategies. It's up to you to decide how this metric will fit into your trading strategy. I currently use this indicator to look for mean reversion setups, but that is due to the current market conditions and my personal trading style.


ATR Trend FollowingThe script filters stocks on the basis of ATR. If the stock has moved above 7 times the ATR from the lows, the system generates buy signal and continues till the stock drops by 2 ATR. It is a good system in trending markets however in sideways consolidating markets, the system must be avoided. In trending markets it can generate good returns with significant Risk to Reward Ratio. Use it in confirmation with other trend depicting indicators is expected to generate better results.

ATR Range ProbabilityUse ATR for measure range probability reversal or target line calculate by close price +- %ATR
Default line and table show -100 to 100%, And the rest can add in setting tab max 200%
- This release measure base on TF D, Line and Table appear on TF D and lower
- Table show range %ATR ,data and difference form current price ,
- line price and text need to be update.

ATR khakestarIt gives you average atr in multi time frames and you can use it to measure moves in price legs.