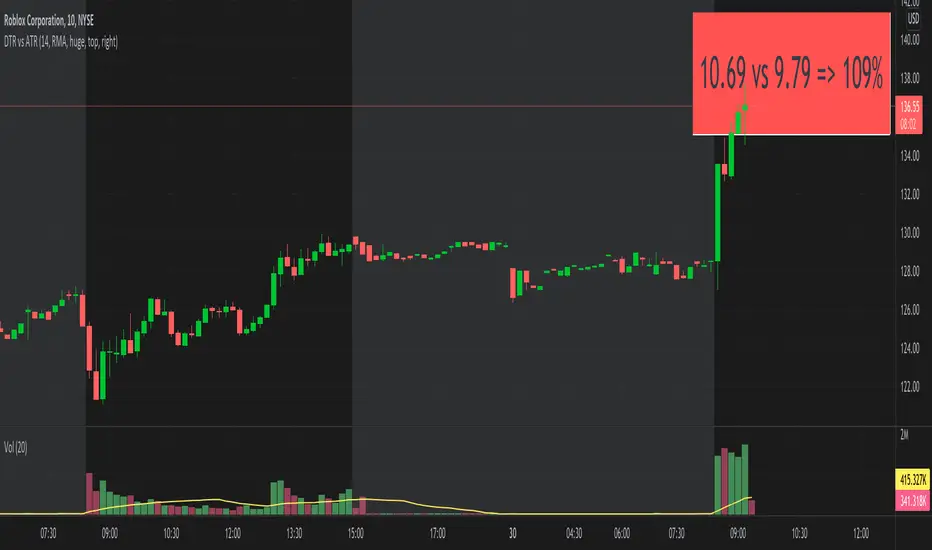
DTR vs ATRThis script shows DTR vs ATR (Today's True Range vs 14 days Avg True Range) along with percentage. The label automatically changes color based on percent value. <=70 is GREEN, >=90 is RED and between 70 & 90 is ORANGE.
The location of the script not stick to one place. There is no such a functionality to keep it static at one location (like top right corner). But I think that feature is coming soon. I may be wrong.
스크립트에서 "ATR"에 대해 찾기
Renko MTF - Traditional and ATRSomehow there aren't too many renko bars that have the traditional setting built-in so I put one up. This one has the option to choose between Traditional and ATR, the size number corresponds to the option that was chosen. And just in case if anyone wanted, I put up a multi-time frame option to choose the time frame the bars take place. D is for day, W is for week, flat numbers are in minutes, and leaving it blank looks at the current time frame the chart is in. The calculation comes from how Tradingview handles renko bars.
Renko bars don't paint a color unless the market moves a certain amount based on its settings. When the market moves up it turns green, if it moves down it turns red, simple color changes alone can say a lot. They're a good way to try to find trends somewhat objectively and seem to be a good way to eliminate time and can replace other time-based indicators that can whipsaw or lag. The bars have a tendency to repeat themselves so it's a good way to find trends. There aren't too many settings for the box size, most people either just choose 5, 10, 14, etc where as other indicators have many options that differ on different markets. The numbers can be chosen easily enough to pick a sweet spot with just a single input where other indicators such as MACD have multiple inputs to pick the right number that can make it difficult to choose from(although it won't be as precise as a MACD would sometimes but can be worth the objectiveness and consistency and same setting repeatability in different markets in my opinion). Some example strategies could be to use them as an alternative trailing stop, finding trends, a simple color change for entry and exit on top of other strategies, etc. It can do the job of many in an all in one price action type indicator(although not better all the time, it can come close enough). Despite all this, it does seem to depend on which time-frame it's being looked at, how TV does the calculation for it, and how one can use this with the lack of practical information on it out there.

Full strategy AllinOne with risk management MACD RSI PSAR ATR MAHey, I am glad to present you one of the strategies where I put a lot of time in it.
This strategy can be adapted to all type of timecharts like scalping, daytrading or swing.
The context is the next one :
First we have the ATR to calculate our TP/SL points. At the same time we have another rule once we enter(we enter based on % risk from total equity, in this example 1%, at the same time, lowest ammount for this example is 0.1 lots, but can be modified to 0.01), so we can exit both by tp/sl points, or by losing 1% of our equity or winning 1% of our total equity. It's dinamic.
The strategy is made from
Trend direction :
PSAR
First confirmation point :
Crossover between 10EMA and Bollinger bands middle point
Second confirmation
MACD histogram
Third confirmation
RSI overbought/oversold levels
For entries : we check trend with psar, then once ema cross bb middle point, we confirm together with rsi level for overbought/oversold and macd histogram ( > 0 or <0).
We exit, when we have opposite sign, like from buy to sell or sell to buy, or when we reach tp/sl points, or when we reach % basaed equity points.
It can be changed to be fixed lots, or fixed tp/sl , you just have to uncomment the size from entries, and tp/sl lines.
At the same time, it has the possibility if one desires, to trade only concrete forex session like european, asian and so on for intraday trading.
Hope you enjoy it.
Let me know how it goes.

Simple Moving Average - ATR Trailing StopThe old adage goes "Cut losers fast and let the winners run"
With this in mind, this will plot a dynamic trailing stop by subtracting any multiplier of the Average True Range (ATR) from the SMA of your choice.

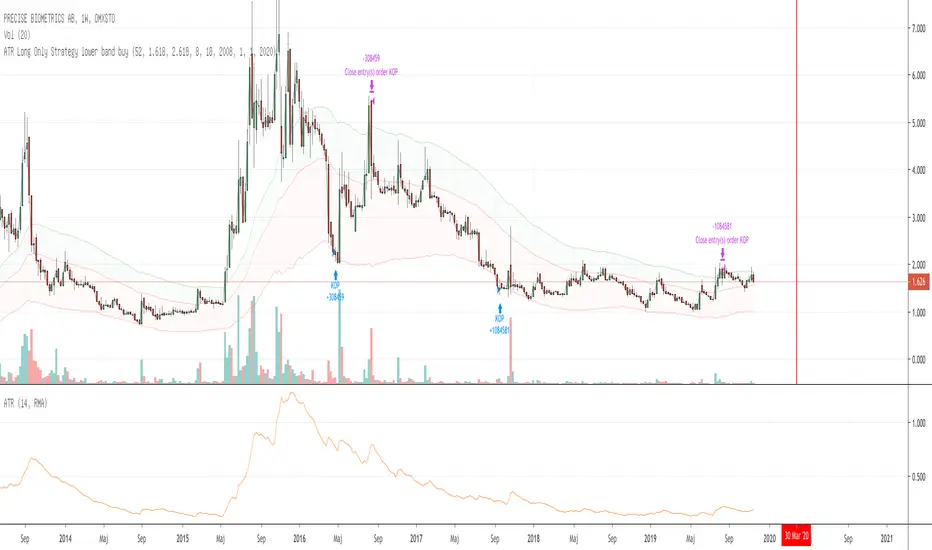
ATR Long Only Strategy lower band buyATR with ATR bands. Buy low band sell high band. Tested on weekly charts.
Alert-QuarryLake Indicator Map - ATR Trend Following Strategy A lot of times I don't like my chart crowding with indicators, thus the reason for creating this script for my strategy QuarryLake.
This script also comes with alert.
Below is the explanation for QuarryLake
I have also updated the script in version 4.
This strategy consists of 3 indicators that I found works quite well together.
Keltner Channel, Waddah Attah Explosion, and Volatility Stop.
You can find WAE here
KC Period = 200
KCATR = 5
Vstop Period = 3
Vstop Mult = 1.5
Long when close > KC, close > Vstop, WAE trendUp
Short when close < KC, close < Vstop, WAE trendDown
Works well on BTCUSD XBTUSD, as well as other major liquid Pair.
Feel free to follow me on Twitter @Lancelot_Auger for more free Alpha.
Please acknowledge my effort by like and follow.
And lastly,
Save Hong Kong, the revolution of our times.

RSI ATR ChannelDraws a channel based on ATR (Average True Range) and RSI. Detects band touches and colors the background appropriately.

Powerfull strategy MACD + RSI + Stoch buy on High exit on ATRMy strategy uses a combination of three indicators MACD Stochastic RSI .
The Idea is to buy when ( MACD > Signal and RSI > 50 and Stochastic > 50) occures at the same time the BUY STop we place on previous day HIGH
We exit on Take profit or Stop loss which is calculated by ATR (10) or on the opposite signal "Volatility breakout"
This strategy works well on stocks, commodities and cryptos especially during market breaking up after consolidation
The best results are on Daily charts , so its NOT a scalping strategy. But it can work also on 1H charts.
The strategy does not have any stops and profit targets, so we can take all the market can give us at the moment.
The exit point only when MACD goes under Signal
Its Preformance is significantly better with "buy stop on High.1" idea and exit on "volatility price breakout"
So, use it, trade it.
If it will help you to imprive your trading results, please donate me
BTC: 12kd1F8buWisUBdq27BBwRkUvzW7Ey3og5

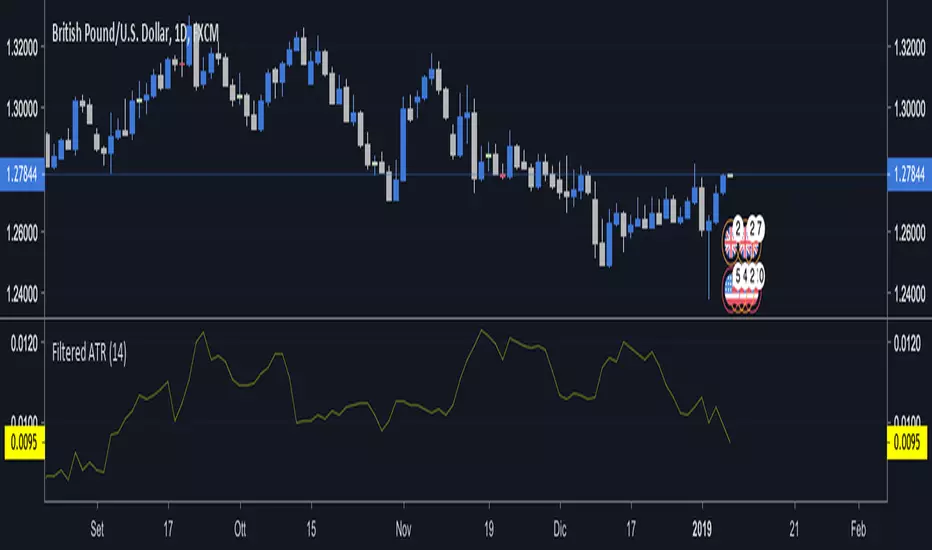
Filtered ATRThis script defines an average true range where extreme events are filtered out.
Extreme events are those bars with a true range larger than 3*sigma+average,
where average and standard deviation are estimated from the last 200 bars.
In this way the ATR is not altered by exceptional events (e.g. the flash crash of Jan 3rd 2019)
and can still be used safely for Stop Losses and Take Profits.
Hitting the like button is a free sign of gratitude, thanks.

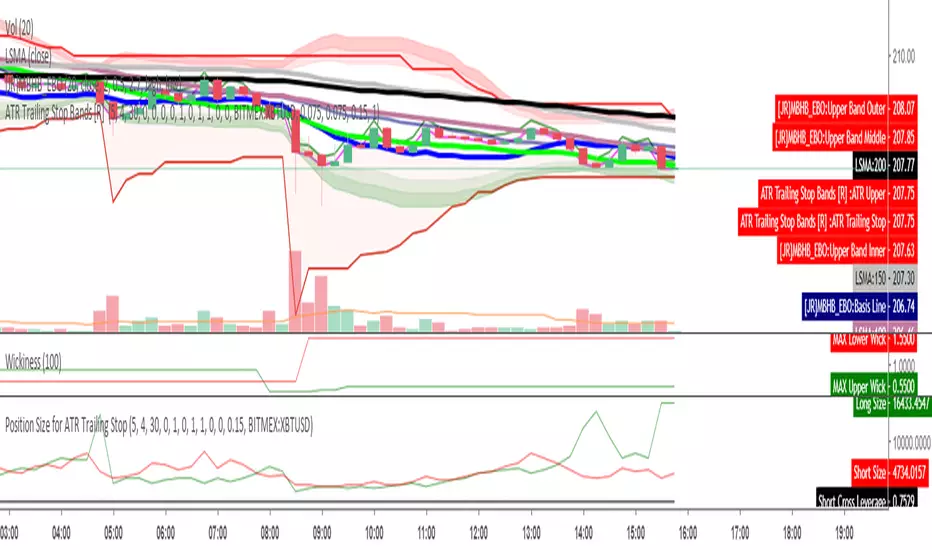
Position Size for ATR Trailing StopThis indicator will calculate your position size, short or long, based on the ATR Trailing Stop indicator of mine, and are needed to be used together. General risk management suggests risking just 1 percent of your equity and using low leverage.
CDC ATR Trailing Stop V1Based on the standard ATR trailing stop indicator.
A few minor tweaks as used in Chaloke.com's community

ET-ATR-Price-OverlayOverlays the Average True Range high/low over Price. Shifts between support and resistance levels (based on ATR-21) according to price trend and breaks.
Average true range: en.wikipedia.org
@EmpoweredTrader

[RS]Multiple ATR Analysis V1UPDATE:
• added a mean version of atr using fractional lengths (requested by IvanLabrie):
• uses slow length property for setup.
• added Average Dayly Range (ADR) (requested by IvanLabrie)
• uses fast length property for setup.
• added Average Weekly Range (AWR)
• uses fast length property for setup.
• added Average Monthly Range (AMR)
• uses fast length property for setup.
• added Average Yearly Range (AYR)
• uses fast length property for setup.

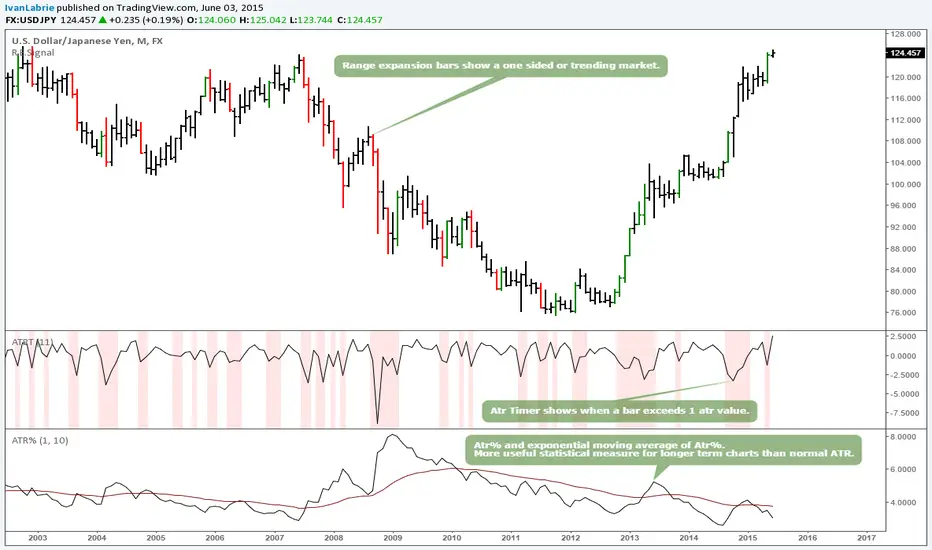
ATR%, ATR Timer and Range Expansion signalThese 3 indicators can be really useful.
The usage is fairly straightforward, if you understand price action, having an statistical edge like these provide can be useful.
Refer to Tim West's charts to learn more about range expansion bars.
The idea for the Atr% and Atr timer come from discussions I had with Yacine Kanoun, props to him for his contribution.
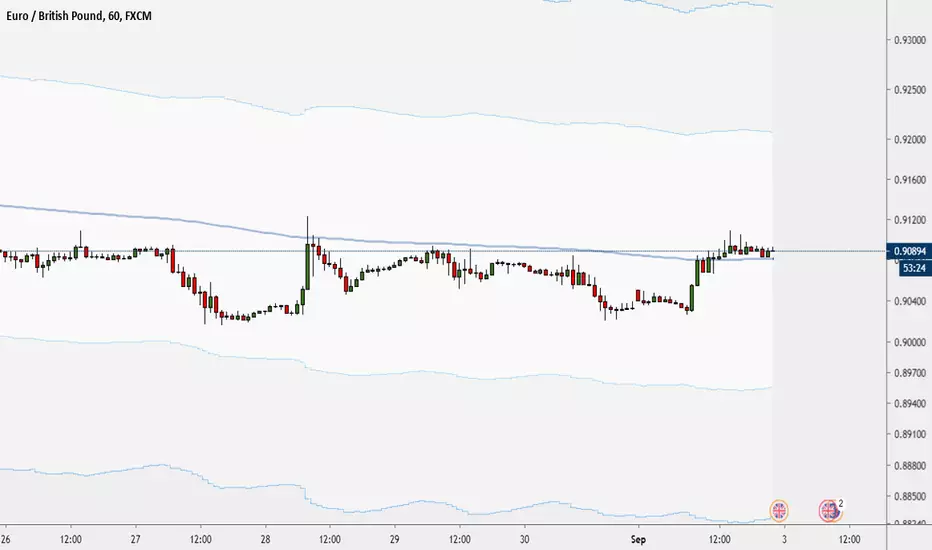
Keltner Channel with Custom ATRKeltner Channel EMA based. Use Custom ATR value.
Reversion to the mean band from TTM $400+
List of All my Indicators - www.tradingview.com

ATR Trailing Stop (EMA Filter) with Adjustable ShiftATR and ema plotted to visualize best stop losses for scalping.

ATR Volatility HistogramATR Volatility Histogram showing result as coloured histogram where Rising > Greenand Fallig < Red. Input can be varied in settings.

ATR Safe/Danger Volatility FilterATR Safe/Danger Volatility Filter colour coded on 50 ema red to show spikes

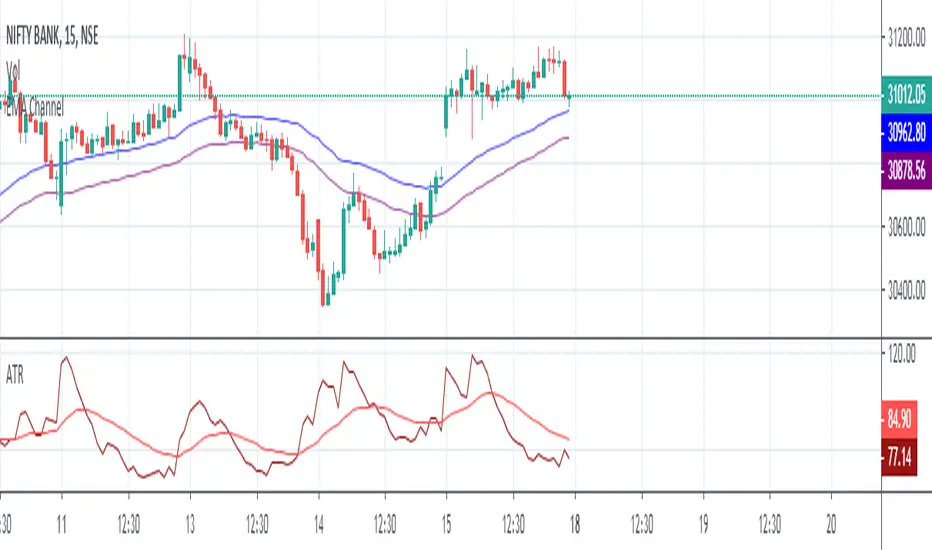
ATR with EMAATR is a very powerful indicator to understand volatility in market, using along with EMA gives you fair idea with is volatility is moving high and low.