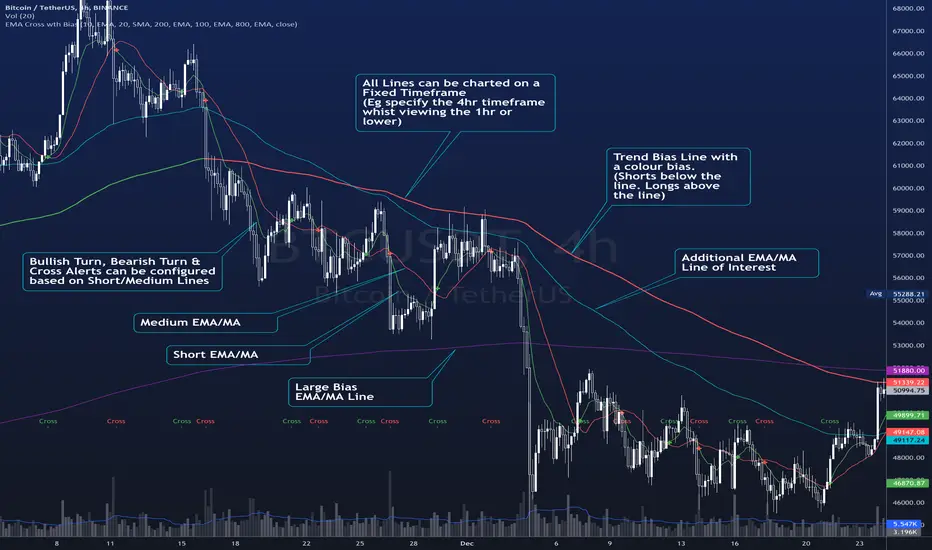
EMA Cross wth BiasThe Script plots 4 Moving averages.
1. Short Moving Average
2. Medium Moving Average
2. Trend Bias (Usually a much slower Moving Average) - Plots in Green when price action is above the line and Red for when price action is below the line.
3. Alerts are triggered when the short MA/ EMA turns. Can be used for Early Entry signals and Exits.
4. Alerts are triggered for Crosses of the Short and Medium MA
Each Moving average line can be confirmed to be a Simple MA or and EMA
스크립트에서 "3 ema"에 대해 찾기
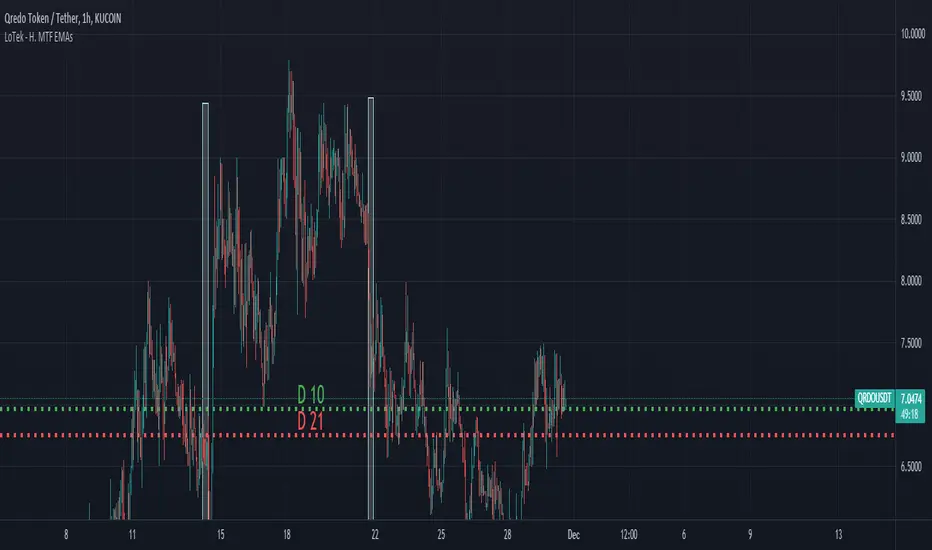
LoTek - Horizontal Multi Time-Frame EMAsThis script retrieves user definable EMA values from different timeframes and plots a Horizontal Line on the chart for the corresponding timeframe. Labels are switchable as well. This can help you identify an EMA squeeze on lower time frames quickly. In this image, I'm viewing QRDO on 1HR and can tell that the price is just above the D10.
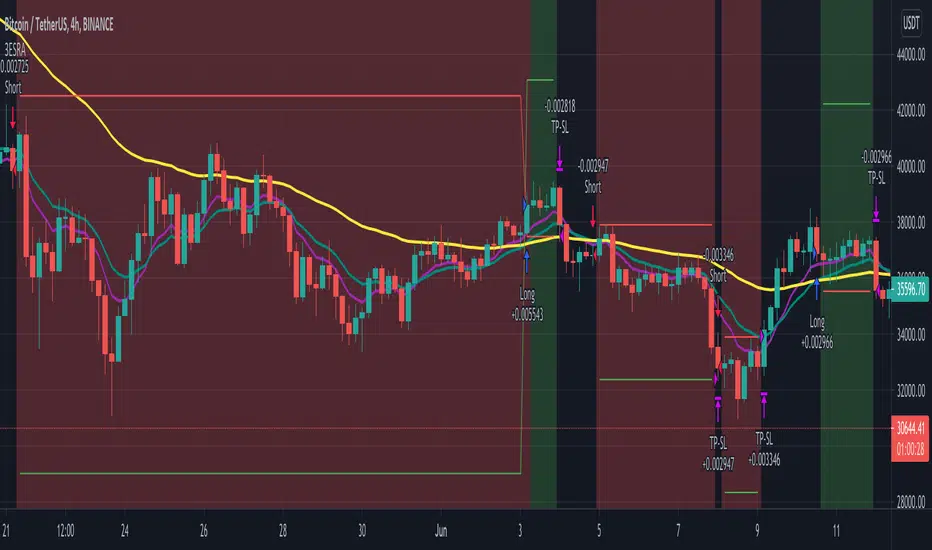
3 EMA + Stochastic RSI + ATR 3ESRA
v0.2a
Coded by Vaida Bogdan
3ESRA consists of a 3 EMA cross + a close above (for longs) the quickest EMA
or below (for shorts). Note that I've deactivated the RSI Cross Over/Under
(you can modify the code and activate it). The strategy also uses a stop loss
that's at 1 ATR distance from the entry price and a take profit that's at
4 times the ATR distance from the entry price.
crypto EMAs - @rlvsThere are lots of indicators to show EMAs.
This one is different because it shows EMAs 12 and 26 for the current timeframe, and, the same EMAs for the next timeframe.
Following this sequence: 1' -> 5' -> 15' -> 1h -> 4h -> 1d -> 1w -> 1 month
EMA RainbowBased on Ripsters EMA clouds, this :
adds an 6 section EMA rainbow to act as DYNAMIC support and resistance levels, that you never have to set manually
splits the 5-12 cloud into 2 parts, as opposed to using a 8-9 centerline. More visually pleasing and intuitive to use
When 300 cloud and 25 cloud are both bullish or bearish - look to take positions in that direction
Use 5 cloud to find pullbacks for entry points
When cloud is moving away (diverging) from other clouds - momentum is increasing
When cloud is increasing in diameter (expanding) - momentum is increasing
When cloud is moving towards other clouds (converging) - momentum is increasing
When cloud is decreasing in diameter (contracting) - momentum is increasing

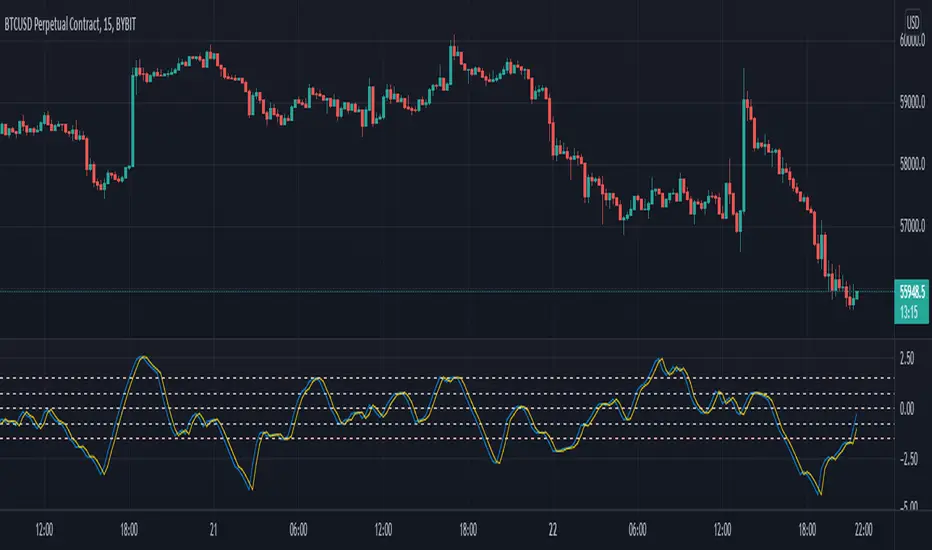
ema exhaustion (exa)The exa is an oscillator that combines fisher transform with distance from moving average and it is based on a theory that exhaustion can be derived from how far price is able to extend from a moving average, on average.
The fisher transform converts price into a gaussian normal distribution, also known as a bell curve {1}. A normal distribution is a type of probability distribution for a real-valued random variable {2}. Applying this method to the price of an asset can help to identify probabilities, but it will never identify certainties.
‘exa’ is an abbreviation for ema exhaustion. It can be used to identify when price is probable to revert to the mean but I prefer using it to confirm entries that are signaled following a reversion to the mean (aka buying the dip in bull markets). When price gets oversold into support, in a bull trend, then that can provide a good opportunity to enter long. However that isn’t necessarily the case when the same metrics indicate oversold conditions in a bear trend. In this situation the exa is best suited for identifying profit taking opportunities on shorts.
The default settings are a 9 lookback period and a 50 ema. By default signals will be derived from how far price is from the 50 ema relative to the probable distribution of the last 9 periods. If the exa is above 2, or below -2, then the price is in the 80th percentile of the prior 9 candles. Being outside of 3, or -3, represents the 90th percentile and 4, or -4, represents the 95th percentile.
Those ranges will never indicate a necessity of reverting to the mean, but they will indicate a higher and higher probability. I prefer to use this oscillator in combination with an indicator(s) that identifies the trend. When the oscillator reaches -2 in a bull trend then it can confirm long entry signals, whereas if it reaches +2 in a bull trend then it can be used to confirm signals to take profit.
Crossovers are especially significant because they indicate a shift in the tide. When the exa reaches 2 without crossing over then it is very much in a position to move to 3 or 4+. When it crosses above 2 then it is an indication that price is extended from the mean and exhausted.
This is certainly not a situation that implies price will revert to the mean, it simply provides confirmation.
The default settings are what I have been finding most effective personally, however that is mostly a function of the trend following tools that I use. The same principles should apply with all settings and I would encourage users to experiment with various lookback periods and emas.
{1} www.investopedia.com
{2} en.wikipedia.org
EMA Cross and MACD Signal CombinedThe rule is simple.
When MACD crosses up, it is supposed to give a buy signal. However, before entering into a Long position, there is a need for a confirmation. This confirmation can be from a down trendline breakout or from another indicator.
In this case, I've chosen the Exponential Moving Average Cross to be as the confirmation.
The Buy Signal will appear when there it fulfills the following conditions:-
i. The MACD line is above the Signal Line
ii. The fast EMA crosses the Slow EMA
The Sell signal will appears when the opposite of the above condition is met.
This indicator is meant for the Swing Trader whom would like to hold a position for a long time.

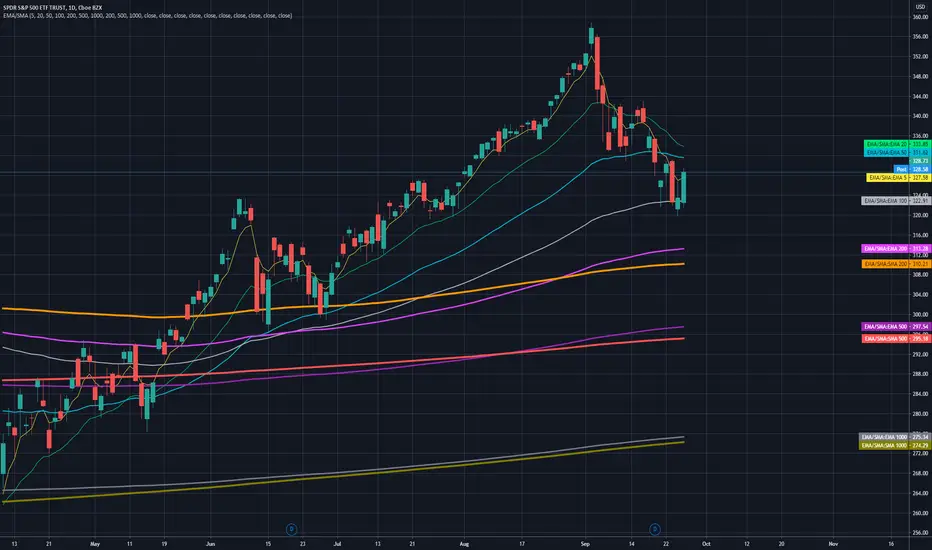
7 EMA 3 SMA with nameplatesScript provides 7 EMA (5 20 50 100 200 500 1000), 3 SMA (200 500 1000) with built-in nameplates for easier navigation. Different colors and widths from the start just to make your initial tuning a bit easier.
Based on Bubsan and Silkheat multicombo, heavily modified, but still huge kudos to guys for the base code.
Modifications: lengths adjusted, on-chart nameplates added, 2 EMA's added, SMA's reduced, static SMA's deleted.
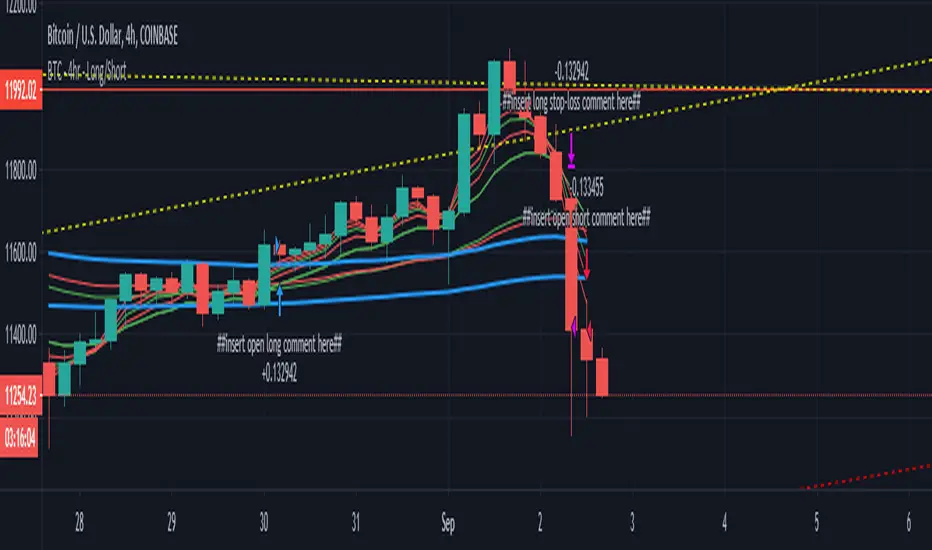
EMA crossover - BTC/USD 4hrThis is my first strategy script, and looking at other EMA crossover strategies, there wasn't anything that I have seen which allowed different EMAs to be used for each Enter/Exit signal
This uses a long term trend ling (one for Longs, one for shorts) to decide if we are in a bull bear market
• If in a bull market, then it will allow for the longs to be opened
• If in a bear market, then it will allow for the shorts to be opened
Comments and criticisms welcome
Multi EMA+SMAMulti EMA+SMA with default value of 20/50/200 ... User can change value and color as required... As ema and sma both has same value thats why only three lines are visible, changing value will reflect other Moving averages. Hope it will help my trader friends.
Love
Indyan...

[CP]6 EMA Multi Timeframe InceptionA collection of 6 EMAs.
Each EMA can be attached to a different timeframe and have a different offset.
Great for building strategies that combine EMAs from different timeframes.

EMA Slope - ValenteThis indicator will show you the EMA SLOPE as a HISTOGRAM.
Este indicador mostra a INCLINACAO da EMA como um HISTOGRAMA

EMA of Highs/Lows with 3 day lookback colour change, by CanUK101Forms a key part of a trend following trading system.
Shows a channel formed by 2 EMA lines that use the highs and lows as inputs.
The 3 day look-back changes the colour of the line to denote rising and falling EMA .

8 EMA & 5 SMA ComboA combination of 8 EMA & 5 SMA to use with more advanced MA strategies and de-cluttering of indicator list.
To identify lines, Color combination should be somewhat warmer/lighter to cooler/darker colors.
EMA have a thicker line than the SMA. Color pairs have lighter/darker in cases where there are slight variations (when using one over another).

Multiple EMAs with marked zones and custom timeframe supportThis script plots 10 exponential moving averages and marks the areas between them.
The lengths are Fibonacci numbers starting from 5 and ending with 377.
The colors indicate the length of the moving average, green for the shortest and purple for the longest.
The zones between consecutive EMA's (e.g. 5 and 8 ema ) are market according to the color of the greater one in value.
By default the script plots values for the current time frame, but supports custom time frames.
I'm releasing this script with an open visibility. Feel free to suggest improvements!
Enjoy,
s0ullight

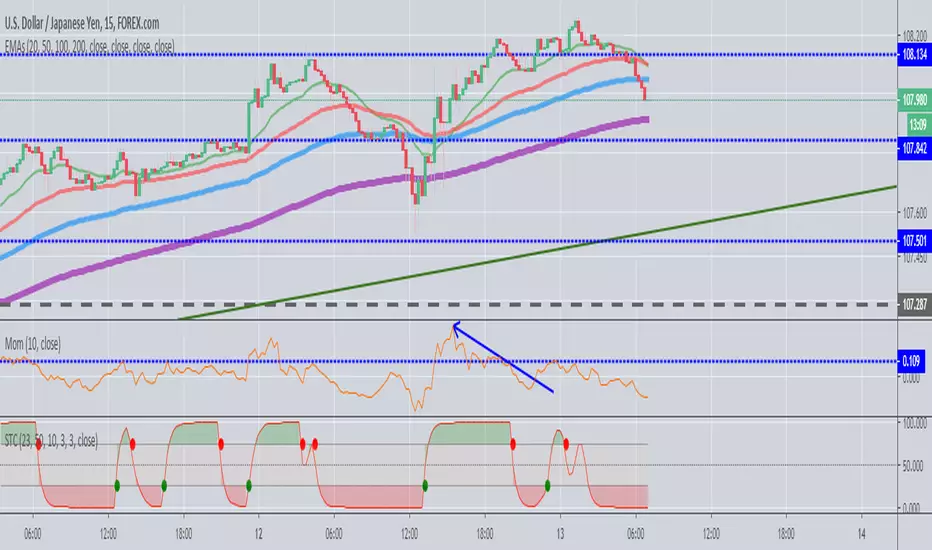
EMAs (20,50,100,200)Ability to plot EMAs (20,50,100,200) in single indicator and can be tweaked according to your trading style.
Multi EMA/SMA with Bollinger Bands Combo 1.0This script provides:
5 regular EMAs
5 regular SMAs
3 multiple time frame EMAs
3 multiple time frame SMAs
Bollinger Bands
All features can be turned on/off and customized regarding color, lines, etc.
Excellent for TradingView users with limited or free accounts.

6 EMAs + VWAP by Felipe FacchinIndicador personalizado com 6 EMAs + VWAP. Recomendo utilização do tema escuro e EMAs 50, 100 e 200.

QEMA - 9 EMAs (10, 20, 50 - 400) / CryptoprospaBy adding this one indicator to your chart, you save time and effort for the EMAs you want.
You can add this and then modify which ones you want visible in the settings.
It covers the 10, 20, 50, 100, 150, 200, 250, 300, 400 EMAs
Enjoy.
Cryptoprospa.

Nine Fibonacci EMAsAre you running short on available indicators in your chart?
Here you get 9 EMAs of the fibonacci sequence in one ;)
EMAs 8, 13, 21, 34, 55, 89, 144, 233 and 377.

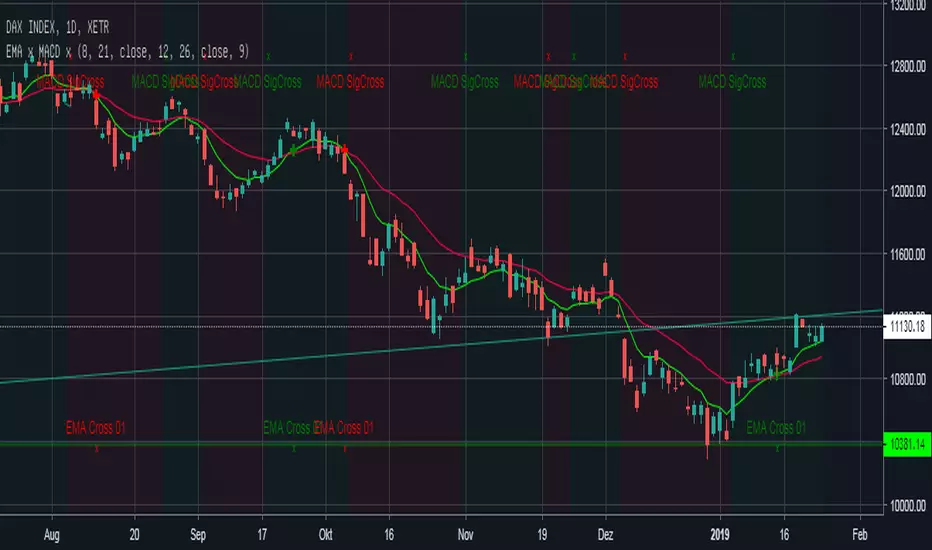
EMA Cross + MACD Signal Cross overlay Einfacher EMA-Cross Indikator mit Indikation der Crosses auf EMA-Linie und am Chart-Bottom +
MACD-Cross wird default an: location.top angezeigt zusätzlich zeigt die Hintergrundfarbe an ob der MACD über (grün) oder unter (rot) seinem Signal liegt.
Double EMA & ALMA StrategyThe ALMA (50 period) acts as the main trend filter, meaning that long positions are taken above the ALMA and short positions are taken below the ALMA. For instance, the 5 and 10 period exponential moving averages are added on the chart to give early signals to the trend.
Therefore, when the 5/10 EMA triggers a bullish crossover, long signals are taken when price is above the ALMA, likewise, when the 5/10 EMA triggers a bearish crossover, short signals are taken when price is below the ALMA.
Find out optimal values by trying. May not produce accurate results in horizontal markets. Thank you.

8/21/100 EMAsBecause we all want to keep our charts clean, I have saved my EMA's configuration in this script.
Follow the green & red background as the buy / sell signal. Always keep an eye on the EMA 100 too.
