Gap Gain Test V1.0 by @overratedtraderOddball indicators for entertainment purposes only. This is best used on daily chart.
Look at the 20 ALMA to gauge likelihood of stock following its up or down gap.
- if above the 20 ALMA , follow the gap direction
- if below the 20 ALMA , take counter trend trade
If stock gaps up AND closes higher than it opens, that gain % (close/open) is colored green and if stock gaps down and closes lower than it opens, that gain % (close/open) is colored green
Conversely if the stock gaps up BUT closes lower than it opens, red and if a stop gaps down but closes higher than it opens, red.
Enjoy and follow me on twitter @overratedtrader for more nonsensical and out-of-the-box ideas.
스크립트에서 "20年美元汇率"에 대해 찾기

Adaptive Donchian ChannelThis indicator adds a level of adaptivity to the simple Donchian Channel by adjusting the sensitivity (lookback periods) of the channel's upper and lower bounds based on the amount of time that has elapsed since the price has hit/expanded the channel boundaries. Comparing the results of this indicator to the standard Donchian Channel, the readier level of responsiveness may prove self-evident.
METHODOLOGY:
Specifically, the more recently the channel was expanded in one direction, the longer the lookback period grows in that direction. Conversely, if the channel has not been expanded in a given direction, the lookback period will contract so as to allow for a tighter channel.
For example, let the initial lookback period be 20 bars and let the factor argument be 0.1 (or 2 bars to start, as 20*0.1 = 2). Now say the current bar sets a new 20-period high. Then the lookback period for the upper bound is expanded by 2 bars to 22, and the lookback period for the lower bound is contracted by 2 bars to 18, thereby making it simultaneously harder to set new highs and easier to set new lows (and vice versa for hitting new lows). If neither a new high nor a new low is formed, both periods contract by the given factor.

TonyUX EMA Scalper - Buy / SellThis is a simple scalping strategy that works for all time frames... I have only tested it on FOREX
It works by checking if the price is currently in an uptrend and if it crosses the 20 EMA.
If it crosses the 20 EMA and its in and uptrend it will post a BUY SIGNAL.
If it crosses the 20 EMA and its in and down it will post a SELL SIGNAL.
The red line is the highest close of the previous 8 bars --- This is resistance
The green line is the lowest close of the previous 8 bars -- This is support

EMA_ConvergenceFirst I have to give kudos to my son who I asked to take a shot at creating this little indicator. Nice work son!
While trading, one of the things I look for is when price or certain EMA's approach another EMA. The example that I use on this 1 minute SPY chart is an 8 EMA and 20 EMA. I am looking for when the 8 and 20 are within' 3 cents of each other. Many times when they are getting close, price is approaching a top or bottom. I am looking for a candlestick reversal around that area. You may want to know when PRICE is near the 50 EMA: Use EMA 1 and 50 for that. Having it light up on top of the page, or elsewhere, makes it easier to look for the convergence when it occurs. If it lights up for a long period, price may be going sideways. I don't enter into a trade until the EMA starts separating, usually with another candlestick formation.
You are able to change the distance for convergence and two EMA's. Unfortunately you will have to adjust the convergence number up as you increase in time frames. This is designed to see when they are close, not when they cross.
The bars on top of this example are lit up purple due to the 8 and 20 EMA are within' 3 cents of each other.
If you want to overlay the price bars, instead of having it separate, just change overlay to "true"
Enjoy.

EMAs Personalizáveis (até 5)📘 Indicator Explanation – Customizable EMAs (up to 5)
This indicator was developed in Pine Script v6 to make it easier to visualize multiple Exponential Moving Averages (EMAs) on a single chart.
🔑 Main features:
Supports up to 5 different EMAs.
Ability to enable or disable each EMA individually.
Fully customizable period for each EMA.
Flexible color selection for better visual organization.
Adjustable line thickness to highlight the most relevant levels.
📌 How to use:
Open the indicator settings.
Select which EMAs you want to display (from 1 to 5).
Define the period (e.g., 20, 50, 100, 200, etc.).
Choose a color for each EMA.
Observe price behavior relative to the EMAs to identify:
Trends → price above long EMAs indicates bullish strength.
Reversals → EMA crossovers may signal a change in direction.
Dynamic support and resistance → EMAs often act as reaction zones for price.
💡 Practical example:
Short EMA (20) → shows short-term movement.
Mid-term EMA (50 or 100) → confirms trend direction.
Long EMA (200 or 500) → indicates the overall market trend.
👉 This indicator is flexible and can be used for scalping, swing trading, or position trading, depending on the chosen periods.
CMC Macro Regime PanelOverview (what it is):
A macro‑regime gate built entirely from TradingView-native symbols (CRYPTOCAP, FRED, DXY/VIX, HYG/LQD). It aggregates central‑bank liquidity (Fed balance sheet − RRP − Treasury General Account), USD strength, credit conditions, stablecoin flows/dominance, tech beta and BTC–NDX co‑move into one normalized score (CLRC). The panel outputs Risk‑ON/OFF regimes, an Early 3/5 pre‑signal, and an automatic BTC vs ETH vs ALTs preference. It is intentionally scoped to Daily & Weekly reads (no intraday timing). Publish with a clean chart and a clear description as per TradingView rules.
TradingView
Why we also use other TradingView screens (and why that is compliant)
This script pulls data via request.security() from official TV symbols only; users often want to open the raw series on separate charts to sanity‑check:
CRYPTOCAP indices: TOTAL, TOTAL2, TOTAL3 (market cap aggregates) and dominance tickers like BTC.D, USDT.D. Helpful for regime & rotation (ALTs vs BTC). TradingView provides definitions for crypto market cap and dominance symbols.
TradingView
+3
TradingView
+3
TradingView
+3
FRED releases: WALCL (Fed assets, weekly), RRPONTSYD (ON RRP, daily), WTREGEN (TGA, weekly), M2SL (M2, monthly). These are the official macro sources exposed on TV.
FRED
+3
FRED
+3
FRED
+3
Risk proxies: TVC:DXY (USD index), TVC:VIX (implied vol), AMEX:HYG/AMEX:LQD (credit), NASDAQ:NDX (tech beta), BINANCE:ETHBTC. VIX/NDX relationship is well-documented; VIX measures 30‑day expected S&P500 vol.
TradingView
+2
TradingView
+2
Compliance note: Using multiple screens is optional for users, but it explains/justifies how components work together (a requirement for public scripts). Keep publication chart clean; use extra screens only to illustrate in the description.
TradingView
How it works (high level)
Liquidity block (Weekly/Monthly)
Net Liquidity = WALCL − RRPONTSYD − WTREGEN (YoY z‑score). WALCL is weekly (as of Wednesday) via H.4.1; RRP is daily; TGA is a Fed liability series. M2 YoY is monthly.
FRED
+3
FRED
+3
FRED
+3
Risk conditions (Daily)
DXY 3‑month momentum (inverted), VIX level (inverted), Credit (HYG/LQD ratio or HY OAS). VIX is a 30‑day constant‑maturity implied vol index per Cboe methodology.
Cboe
+1
Crypto‑internal (Daily)
Stablecoins (USDT+USDC+DAI 30‑day log change), USDT dominance (20‑day, inverted), TOTAL3 (63‑day momentum). Dominance symbols on TV follow a documented formula.
TradingView
Beta & co‑move (Daily)
NDX 63‑day momentum, BTC↔NDX 90‑day correlation.
All components become z‑scores (optionally clipped), weighted, missing inputs drop and weights renormalize. We never use lookahead; we confirm on bar close to avoid repainting per Pine docs (barstate.isconfirmed, multi‑TF).
TradingView
+2
TradingView
+2
What you see on the chart
White line (CLRC) = macro regime score.
Background: Green = Risk‑ON, Red = Risk‑OFF, Teal = Early 3/5 (pre‑signal).
Table: shows each component’s z‑score and the Preference: BTC / ETH / ALTs / Mixed.
Signals & interpretation
Designed for Daily (1D) and Weekly (1W) only.
Regime gates (default Fast preset):
Enter ON: CLRC ≥ +0.8; Hold ON while ≥ +0.5.
Enter OFF: CLRC ≤ −1.0; Hold OFF while ≤ −0.5.
0 / ±1 reading: CLRC is a standardized composite.
~0 = neutral baseline (no macro edge).
≥ +1 = strong macro tailwind (≈ +1σ).
≤ −1 = strong headwind (≈ −1σ).
Early 3/5 (teal): a fast pre‑signal when at least 3 of 5 daily checks align: USDT.D↓, DXY↓, VIX↓, HYG/LQD↑, ETHBTC↑ or TOTAL3↑. It often precedes a full ON flip—use for pre‑positioning rather than full sizing.
BTC/ETH/ALTs selector (only when ON):
ALTs when BTC.D↓ and (ETHBTC↑ or TOTAL3↑) ⇒ rotate down the risk curve.
BTC when BTC.D↑ and ETHBTC↓ ⇒ keep it concentrated.
ETH when ETHBTC↑ while BTC.D flat/up ⇒ add ETH beta.
(Dominance mechanics are documented by TV.)
TradingView
Dissonance (incompatibility) rules — when to stand down
Use these overrides to avoid false comfort:
CLRC > +1 but USDT.D↑ and/or VIX spikes day‑over‑day → downgrade to Neutral; wait for USDT.D to stabilize and VIX to cool (VIX is a fear gauge of 30‑day expectation).
Cboe Global Markets
CLRC > +1 but DXY↑ sharply (USD squeeze) → size below normal; require DXY momentum to roll over.
CLRC < −1 but Early 3/5 = true two days in a row → start reducing underweights; look for ON flip within a few bars.
NetLiq improving (W) but credit (HYG/LQD) deteriorating (D) → treat as mixed regime; prefer BTC over ALTs.
How to use (step‑by‑step)
A. Read on Daily (1D) — main regime
Open CRYPTOCAP:TOTAL3, 1D (panel applied).
Wait for bar close (use alerts on confirmed bar). Pine docs recommend barstate.isconfirmed to avoid repainting on realtime bars.
TradingView
If ON, check Preference (BTC / ETH / ALTs).
Then drop to 4H on your trading pair for micro entries (this indicator itself is not for intraday timing).
B. Confirm weekly macro (1W) — once per week)
Review WALCL/RRP/TGA after the H.4.1 release on Thursdays ~4:30 pm ET. WALCL is “Weekly, as of Wednesday”; M2 is Monthly—so do not expect daily responsiveness from these.
Federal Reserve
+2
FRED
+2
Recommended check times (practical schedule)
Daily regime read: right after your chart’s daily close (confirmed bar). For consistent timing across crypto, many users set chart timezone to UTC and read ~00:05 UTC; you can change chart timezone in TV’s settings.
TradingView
In‑day monitoring: optional spot checks 16:00 & 20:00 UTC (DXY/VIX move during US hours), but act only after the daily bar confirms.
Weekly macro pass: Thu 21:30–22:30 UTC (after H.4.1 4:30 pm ET) or Fri after daily close, to let weekly FRED series propagate.
Federal Reserve
Limitations & data latency (be explicit)
Higher‑TF data & confirmation: FRED weekly/monthly series will not reflect intraday risk in crypto; we aggregate them for regime, not for entry timing.
Repainting 101: Realtime bars move until close. This script does not use lookahead and follows Pine guidance on multi‑TF series; still, always act on confirmed bars.
TradingView
+1
Public‑library compliance: Title EN‑only; description starts in EN; clean chart; justify component mash‑up; no lookahead; no unrealistic claims.
TradingView
Alerts you can use
“Macro Risk‑ON (entry)” — fires on ON flip (confirmed bar).
“Macro Risk‑OFF (entry)” — fires on OFF flip.
“Early 3/5” — fires when the teal pre‑signal appears (not a regime flip).
“Preference change” — BTC/ETH/ALTs toggles while ON.
Publish note: Alerts are fine; just avoid implying guaranteed accuracy/performance.
TradingView
Background research (why these inputs matter)
Liquidity → Crypto: Fed H.4.1 timing and series definitions (WALCL, RRP, TGA) formalize the “net liquidity” concept used here.
FRED
+3
Federal Reserve
+3
FRED
+3
Stablecoins ↔ Non‑stable crypto: empirical work shows bi‑directional causality between stablecoin market cap and non‑stable crypto cap; stablecoin growth co‑moves with broader crypto activity.
Global liquidity link: world liquidity positively relates to total crypto market cap; lagged effects are observed at monthly horizons.
VIX/Uncertainty effect: fear shocks impair BTC’s “safe haven” behavior; VIX is a meaningful risk‑off read.

Order Block Volumatic FVG StrategyInspired by: Volumatic Fair Value Gaps —
License: CC BY-NC-SA 4.0 (Creative Commons Attribution–NonCommercial–ShareAlike).
This script is a non-commercial derivative work that credits the original author and keeps the same license.
What this strategy does
This turns BigBeluga’s visual FVG concept into an entry/exit strategy. It scans bullish and bearish FVG boxes, measures how deep price has mitigated into a box (as a percentage), and opens a long/short when your mitigation threshold and filters are satisfied. Risk is managed with a fixed Stop Loss % and a Trailing Stop that activates only after a user-defined profit trigger.
Additions vs. the original indicator
✅ Strategy entries based on % mitigation into FVGs (long/short).
✅ Lower-TF volume split using upticks/downticks; fallback if LTF data is missing (distributes prior bar volume by close’s position in its H–L range) to avoid NaN/0.
✅ Per-FVG total volume filter (min/max) so you can skip weak boxes.
✅ Age filter (min bars since the FVG was created) to avoid fresh/immature boxes.
✅ Bull% / Bear% share filter (the 46%/53% numbers you see inside each FVG).
✅ Optional candle confirmation and cooldown between trades.
✅ Risk management: fixed SL % + Trailing Stop with a profit trigger (doesn’t trail until your trigger is reached).
✅ Pine v6 safety: no unsupported args, no indexof/clamp/when, reverse-index deletes, guards against zero/NaN.
How a trade is decided (logic overview)
Detect FVGs (same rules as the original visual logic).
For each FVG currently intersected by the bar, compute:
Mitigation % (how deep price has entered the box).
Bull%/Bear% split (internal volume share).
Total volume (printed on the box) from LTF aggregation or fallback.
Age (bars) since the box was created.
Apply your filters:
Mitigation ≥ Long/Short threshold.
Volume between your min and max (if enabled).
Age ≥ min bars (if enabled).
Bull% / Bear% within your limits (if enabled).
(Optional) the current candle must be in trade direction (confirm).
If multiple FVGs qualify on the same bar, the strategy uses the most recent one.
Enter long/short (no pyramiding).
Exit with:
Fixed Stop Loss %, and
Trailing Stop that only starts after price reaches your profit trigger %.
Input settings (quick guide)
Mitigation source: close or high/low. Use high/low for intrabar touches; close is stricter.
Mitigation % thresholds: minimal mitigation for Long and Short.
TOTAL Volume filter: skip FVGs with too little/too much total volume (per box).
Bull/Bear share filter: require, e.g., Long only if Bull% ≥ 50; avoid Short when Bull% is high (Short Bull% max).
Age filter (bars): e.g., ≥ 20–30 bars to avoid fresh boxes.
Confirm candle: require candle direction to match the trade.
Cooldown (bars): minimum bars between entries.
Risk:
Stop Loss % (fixed from entry price).
Activate trailing at +% profit (the trigger).
Trailing distance % (the trailing gap once active).
Lower-TF aggregation:
Auto: TF/Divisor → picks 1/3/5m automatically.
Fixed: choose 1/3/5/15m explicitly.
If LTF can’t be fetched, fallback allocates prior bar’s volume by its close position in the bar’s H–L.
Suggested starting presets (you should optimize per market)
Mitigation: 60–80% for both Long/Short.
Bull/Bear share:
Long: Bull% ≥ 50–70, Bear% ≤ 100.
Short: Bull% ≤ 60 (avoid shorting into strong support), Bear% ≥ 0–70 as you prefer.
Age: ≥ 20–30 bars.
Volume: pick a min that filters noise for your symbol/timeframe.
Risk: SL 4–6%, trailing trigger 1–2%, distance 1–2% (crypto example).
Set slippage/fees in Strategy Properties.
Notes, limitations & best practices
Data differences: The LTF split uses request.security_lower_tf. If the exchange/data feed has sparse LTF data, the fallback kicks in (it’s deliberate to avoid NaNs but is a heuristic).
Real-time vs backtest: The current bar can update until close; results on historical bars use closed data. Use “Bar Replay” to understand intrabar effects.
No pyramiding: Only one position at a time. Modify pyramiding in the header if you need scaling.
Assets: For spot/crypto, TradingView “volume” is exchange volume; in some markets it may be tick volume—interpret filters accordingly.
Risk disclosure: Past performance ≠ future results. Use appropriate position sizing and risk controls; this is not financial advice.
Credits
Visual FVG concept and original implementation: BigBeluga.
This derivative strategy adds entry/exit logic, volume/age/share filters, robust LTF handling, and risk management while preserving the original spirit.
License remains CC BY-NC-SA 4.0 (non-commercial, attribution required, share-alike).

Iron Condor Pro v6 – Full EngineIronCondor Engine v6.6 is a multi-mode options strategy tool for planning and managing iron condors, straddles, strangles, and butterflies. It supports both setup planning and live trade tracking with modeled delta, risk-based strike selection, IV rank estimation, and visual breach alerts.
Use Setup Mode to preview strike structures based on IV proxy, ATR, delta targeting, and risk tier (High/Mid/Low/Delta). Use Live Mode to track real trades, enter strike/premium data, and monitor live P&L, delta drift, and range status.
This script does not connect to live option chains. Volatility and delta are modeled using price history. All strikes and premiums must be confirmed using your broker before placing trades. Best used with strong support/resistance levels and high IV rank (30%+).
For educational purposes only.
Workflow Guide
Use this flow whether you're setting up on Sunday night or any day before placing a trade.
Step 0: Pre-Script Preparation
Before using the script:
Identify major support and resistance zones on your chart. Define the expected range or consolidation area. Use this context to help evaluate strike placement
1. Setup Phase (Pre-Trade Planning)
Step 1 – Load the Script
Add: IronCondor Engine v6.6 – Full Risk/Decay Edition to your chart
Step 2 – Set Mode = Setup
This enables planning mode, where the engine calculates strike combinations based on:
Your selected risk profile (High, Mid, Low, or Delta)
Historical volatility (20-day log return)
ATR (Average True Range)
Target short delta (adjustable)
Step 3 – Review Setup Table
Enable Show Setup Table to view calculated strikes and width by risk tier.
Adjust any of the following as needed:
Target Short Delta
Strike Interval ($)
Width multipliers (High/Mid/Low)
Risk tier under Auto-Feed Choice
Step 4 – Evaluate the Setup
Is the net credit at least 1.5–2.0x your max risk?
Are the short strikes clearly outside support/resistance zones?
Are the short deltas between 0.15 and 0.30?
Is the range wide enough to handle normal price movement?
Step 5 – Prep for Execution
Enable Auto-Feed Setup → Live to carry Setup strikes into Live mode
Or disable it if you prefer to manually enter strikes later
2. Trade Execution (Live Tracking Mode)
Step 1 – Place the Trade with Your Broker
Use your brokerage (TOS, Tasty, IBKR, etc.) to place the iron condor or other structure
Step 2 – Set Mode = Live
In Live mode:
If Auto-Feed is ON, the Setup strikes auto-populate
If Auto-Feed is OFF, manually enter:
Short and long strikes (Call and Put)
Premiums collected/paid per leg
Total net credit (Entry Credit)
Optional: Input current mid prices for each leg in the "Live Chain" section to track live mark-to-market P&L
Once all required fields are valid, the script activates:
Real-time profit/loss tracking
Max risk estimate
Delta monitoring on short legs
IV Rank estimate
Breach detection system
Chart visuals (if enabled)
3. Trade Management (During the Week)
While the trade is active, use the dashboard and visuals to monitor:
Key Metrics:
Unrealized P/L %
Mark-to-market value vs entry credit
Daily decay (theta)
Days until expiration
Breach status:
In Range
Near Breach
Breached
Alerts:
Price near short strike → suggests roll
Price breaches long strike → breach alert
50% or 75% profit → optional exit signal
Delta exceeds threshold → exposure may need adjustment
Management Tips:
At 50–75% profit: consider closing early
If price nears a short leg: roll, hedge, or manage
If nearing expiry: decide whether to hold or close
If IV collapses: may accelerate time decay or reduce exit value
4. End-of-Week or Expiration Management
If Profit Target Hit
Close early to reduce risk and lock gains
If Still Open Near Expiry
Close the position or
Hold through expiration only if you're fully prepared for pinning/gamma/assignment scenarios
Avoid holding open spreads over the weekend unless part of a defined strategy
Reference Notes
Strike Width
Defined as:
Width = Distance between Short and Long strike
Used for calculating max loss and breach visuals
Delta Guidelines
0.15–0.20 = safer, wider range, lower credit
0.25–0.30 = more aggressive, tighter range, higher credit
Use Target Short Delta input to adjust auto-selected strikes accordingly
Credit Example
Sell Call: $1.04
Sell Put: $0.23
Buy Call + Put wings: $0.14
Net Credit = $1.13 = $113 per contract (max profit)
This is the max profit if price stays between short strikes through expiration
IV Rank (Estimated)
This script does not use options chain IV data.
Instead, it calculates a volatility proxy:
ivRaw = ta.stdev(log returns, 20) * sqrt(252)
IV Rank is then calculated as the percentile of this value within the last 252 bars.
High IV Rank (30%–100%) → better premium-selling conditions
Low IV Rank (<30%) → lower edge for condors
Ideal to sell premium when IV Rank is above 30–50%
Disclosures and Limitations
This script is for educational use only
It does not connect to live option chains
All strikes, deltas, and premiums must be validated through your broker
Always confirm real-time IV, delta, and pricing before placing a trade

❄️ Lin Kuei Ice Storm Oscillator ❄️❄️ Lin Kuei Ice Storm Oscillator (LKISO) ❄️
What It Does
The Lin Kuei Ice Storm Oscillator combines RSI and Stochastic indicators to create a powerful momentum oscillator that shows market "temperature" - helping you identify optimal entry and exit points with crystal clarity.
🌡️ Thermal Zones
🔥 Melting Point (80-100) - SELL ZONE
Market is overheated and overbought
Look for short opportunities or exit long positions
⚖️ Balance Zone (40-60) - NEUTRAL
Market is in equilibrium
Wait for clear directional signals
🧊 Freezing Point (0-20) - BUY ZONE
Market is overcooled and oversold
Look for long opportunities or exit short positions
📈 Trading Positions
🗡️ Long Position (BUY)
You buy an asset expecting price to rise
Profit when price goes up, lose when price goes down
Example: Buy Bitcoin at $45,000, sell at $50,000 = $5,000 profit
🛡️ Short Position (SELL)
You sell an asset expecting price to fall
Profit when price goes down, lose when price goes up
Example: Short Bitcoin at $50,000, buy back at $45,000 = $5,000 profit
🥷 Trading Modes
Ninja Mode (Conservative)
Fewer signals, higher accuracy
Best for beginners
Warrior Mode (Balanced)
Moderate signals with momentum confirmation
Best for experienced traders
Grandmaster Mode (Aggressive)
Maximum signals, fastest entries
Best for professionals
🎯 Key Signals
BUY Signals
Ice Storm line crosses above 50 (center line)
Bounce from Freezing Point (20 level)
Ice Storm crosses above Frost Signal line
SELL Signals
Ice Storm line crosses below 50 (center line)
Reversal from Melting Point (80 level)
Ice Storm crosses below Frost Signal line
🎨 Visual Features
Dynamic Colors: Lines change color based on momentum intensity
Thermal Zones: Background colors show market temperature
Signal Ribbon: Green = bullish, Red = bearish
Real-time Dashboard: Shows current market condition and position
⚡ Best Practices
Use multiple confirmations - Don't trade on single signals
Respect thermal zones - Extreme readings often reverse
Choose your battle style based on experience level
Combine with proper risk management - Set stop losses
Works best on 1H-1D timeframes for swing trading
🚨 Quick Setup
Add indicator to chart
Choose your battle style (Ninja/Warrior/Grandmaster)
Enable thermal zones and signals
Wait for clear buy/sell signals
Trade with proper position sizing
The LKISO transforms market chaos into crystal-clear trading opportunities through the power of thermal analysis and momentum fusion.

❄️ Lin Kuei Systematic Edge ❄️# ❄️ Lin Kuei Systematic Edge - Complete Trading Indicator
## 🎯 **What is the Lin Kuei Systematic Edge?**
The Lin Kuei Systematic Edge is a professional-grade trading indicator designed to eliminate emotional trading and provide systematic, disciplined market analysis. Inspired by the ice-cold precision of systematic trading, this indicator combines multiple technical analysis components to deliver clear, actionable signals for both trending and volatile market conditions.
## 🗡️ **Core Components**
### **1. Dual-Blade System (Moving Averages)**
- **Fast Blade (Ice Blade)**: Quick-responding moving average for trend detection
- **Slow Blade (Frost Shield)**: Stable moving average for trend confirmation
- **Crossover Signals**: When fast blade crosses above slow blade = LONG signal | When fast blade crosses below slow blade = SHORT signal
### **2. Ice Zone (Volatility Bands)**
- **Upper Frost**: Resistance level based on volatility
- **Lower Frost**: Support level based on volatility
- **Dynamic Zones**: The area between frost levels shows market sentiment
- **Ice Multiplier**: Controls the width of the volatility bands (default: 2.215)
### **3. Market Regime Detection**
- **Bullish Regime**: Fast blade > Slow blade with positive momentum
- **Bearish Regime**: Fast blade < Slow blade with negative momentum
- **Consolidation**: Low momentum, sideways market movement
### **4. Volatility Filtering**
- **High Volatility Filter**: Blocks signals during chaotic market conditions
- **Signal Quality**: Only generates signals when market volatility is manageable
- **Systematic Discipline**: Prevents emotional trading during market storms
## 📊 **How to Read the Indicator**
### **Visual Elements:**
- **Cyan Ice Blade**: Fast-moving trend line with glow effect
- **Blue Frost Shield**: Slower trend line with aura
- **White Frost Barriers**: Support and resistance levels with colored glows
- **Dynamic Fill Zones**: Green tint (bullish) / Red tint (bearish) between barriers
- **Signal Triangles**: Green up-arrow (LONG) / Red down-arrow (SHORT)
### **Information Dashboard:**
The tactical table provides real-time market intelligence:
1. **🗡️ Momentum**: Percentage difference between fast and slow blades
- **Positive**: Bullish momentum (green)
- **Negative**: Bearish momentum (red)
- **Strength**: STRONG (>2% or <-2%) vs WEAK
2. **🌪️ Volatility**: Percentile ranking of current volatility
- **0-50%**: LOW (green) - Ideal for signals
- **50-80%**: HIGH (orange) - Caution advised
- **80-100%**: EXTREME (red) - Signals blocked
3. **📊 Position**: Price location within the ice zone
- **80-100%**: OVERBOUGHT (red) - Near resistance
- **0-20%**: OVERSOLD (green) - Near support
- **20-80%**: NEUTRAL (white) - Normal range
4. **⚔️ Regime**: Current market condition
- **BULL**: Uptrend active - STRIKE mode
- **BEAR**: Downtrend active - DEFEND mode
- **RANGE**: Sideways - WAIT mode
5. **🎯 Signal**: Latest signal status
- **BUY/SELL**: Active signal generated
- **NONE**: No current signal
- **ACTIVE/BLOCKED**: Signal availability status
6. **❄️ Ice Status**: Price relationship to frost barriers
- **FROZEN**: Below lower frost (oversold opportunity)
- **SOLID**: Within normal range
- **MELTING**: Above upper frost (overbought warning)
7. **🛡️ Defense**: Signal reliability assessment
- **STRONG**: Low volatility, high signal quality
- **WEAK**: High volatility, signals may be unreliable
## 🎯 **Trading Signals**
### **LONG Signals (Green Triangle Up)**
**Generated when:**
- Fast blade crosses ABOVE slow blade
- Momentum turns positive
- Volatility is NOT extreme (< 70th percentile)
**Interpretation:**
- Bullish momentum confirmed
- Trend reversal to upside
- Entry opportunity for long positions
### **SHORT Signals (Red Triangle Down)**
**Generated when:**
- Fast blade crosses BELOW slow blade
- Momentum turns negative
- Volatility is NOT extreme (< 70th percentile)
**Interpretation:**
- Bearish momentum confirmed
- Trend reversal to downside
- Entry opportunity for short positions
### **Signal Quality Assurance:**
- **Volatility Filter**: No signals during market chaos
- **Momentum Confirmation**: Requires actual trend change
- **Clean Presentation**: Optional L/S text labels for clarity
## 🧊 **Background Zones**
### **🔥 Melting Ice Zone (Green Background)**
- Price above upper frost + low volatility
- Potential overheating/overbought condition
- Caution: Possible reversal area
### **🧊 Deep Freeze Zone (Red Background)**
- Price below lower frost + low volatility
- Potential oversold/opportunity zone
- Watch for: Possible bounce/recovery
### **🌨️ Ice Blizzard (White Background)**
- High volatility detected
- Market chaos/uncertainty
- Action: Wait for clarity, no signals generated
## ⚙️ **Customizable Settings**
### **Blade Configuration:**
- **Blade Type**: SMA, EMA, WMA, VWMA, HMA, RMA
- **Fast Precision**: 1-100 periods (default: 40)
- **Slow Defense**: 1-200 periods (default: 55)
### **Volatility Control:**
- **Ice Multiplier**: 0.1+ (default: 2.215)
- **Controls**: Width of support/resistance zones
### **Alert System:**
- **Battle Alerts**: Enable/disable notifications
- **Signal Text**: Show/hide L/S labels on signals
## 🎖️ **Best Practices**
### **When to Use:**
- Trending markets with clear direction
- After consolidation periods
- When volatility is manageable
- For systematic, emotion-free trading
### **When to Avoid:**
- During extreme volatility (blizzard conditions)
- Major news events/announcements
- Very low timeframes with excessive noise
- Without proper risk management
### **Optimal Timeframes:**
- **15min - 1H**: Short-term trading
- **4H - 1D**: Medium-term analysis
- **1D+**: Long-term trend identification
## 🏆 **Scoring System**
### **Positive Scores (+):**
- **Momentum > 0**: Bullish trend strength
- **Volatility < 50%**: Stable, predictable conditions
- **Position 20-80%**: Normal, healthy price action
- **Regime = BULL**: Confirmed uptrend
- **Defense = STRONG**: High signal reliability
### **Negative Scores (-):**
- **Momentum < 0**: Bearish trend strength
- **Volatility > 70%**: Chaotic, unpredictable conditions
- **Position > 80% or < 20%**: Extreme overbought/oversold
- **Regime = BEAR**: Confirmed downtrend
- **Ice Status = MELTING**: Overheated conditions
### **Overall Assessment:**
The indicator provides a **holistic scoring system** where multiple positive factors align for high-confidence signals, while negative factors warn of risks or suggest defensive positioning.
---
## 🔮 **Summary**
The Lin Kuei Systematic Edge transforms emotional trading into disciplined, systematic analysis. By combining trend detection, volatility analysis, and market regime identification, it provides traders with the tools needed to navigate markets with ice-cold precision. The indicator's strength lies in its ability to filter out noise, prevent overtrading during volatile periods, and deliver clear, actionable signals when conditions are optimal.
**"In crypto winter, only the systematic survive. Precision over emotion."** ❄️

AI Trading Alerts v6 — SL/TP + Confidence + Panel (Fixed)Overview
This Pine Script is designed to identify high-probability trading opportunities in Forex, commodities, and crypto markets. It combines EMA trend filters, RSI, and Stochastic RSI, with automatic stop-loss (SL) & take-profit (TP) suggestions, and provides a confidence panel to quickly assess the trade setup strength.
It also includes TradingView alert conditions so you can set up notifications for Long/Short setups and EMA crosses.
⚙️ Features
EMA Trend Filter
Uses EMA 50, 100, 200 for trend confirmation.
Bull trend = EMA50 > EMA100 > EMA200
Bear trend = EMA50 < EMA100 < EMA200
RSI Filter
Bullish trades require RSI > 50
Bearish trades require RSI < 50
Stochastic RSI Filter
Prevents entries during overbought/oversold extremes.
Bullish entry only if %K and %D < 80
Bearish entry only if %K and %D > 20
EMA Proximity Check
Price must be near EMA50 (within ATR × adjustable multiplier).
Signals
Continuation Signals:
Long if all bullish conditions align.
Short if all bearish conditions align.
Cross Events:
Long Cross when price crosses above EMA50 in bull trend.
Short Cross when price crosses below EMA50 in bear trend.
Automatic SL/TP Suggestions
SL size adjusts depending on asset:
Gold/Silver (XAU/XAG): 5 pts
Bitcoin/Ethereum: 100 pts
FX pairs (default): 20 pts
TP = SL × Risk:Reward ratio (default 1:2).
Confidence Score (0–4)
Based on conditions met (trend, RSI, Stoch, EMA proximity).
Labels:
Strongest (4/4)
Strong (3/4)
Medium (2/4)
Low (1/4)
Visual Panel on Chart
Shows ✅/❌ for each condition (trend, RSI, Stoch, EMA proximity, signal now).
Confidence row with color-coded strength.
Alerts
Long Setup
Short Setup
Long Cross
Short Cross
🖥️ How to Use
1. Add the Script
Open TradingView → Pine Editor.
Paste the full script.
Click Add to chart.
Save as "AI Trading Alerts v6 — SL/TP + Confidence + Panel".
2. Configure Inputs
EMA Lengths: Default 50/100/200 (works well for swing trading).
RSI Length: 14 (standard).
Stochastic Length/K/D: Default 14/3/3.
Risk:Reward Ratio: Default 2.0 (can change to 1.5, 3.0, etc.).
EMA Proximity Threshold: Default 0.20 × ATR (adjust to be stricter/looser).
3. Read the Panel
Top-right of chart, you’ll see ✅ or ❌ for:
Trend → Are EMAs aligned?
RSI → Above 50 (bull) or below 50 (bear)?
Stoch OK → Not extreme?
Near EMA50 → Close enough to EMA50?
Above/Below OK → Price position vs. EMA50 matches trend?
Signal Now → Entry triggered?
Confidence row:
🟢 Green = Strongest
🟩 Light green = Strong
🟧 Orange = Medium
🟨 Yellow = Low
⬜ Gray = None
4. Alerts Setup
Go to TradingView Alerts (⏰ icon).
Choose the script under “Condition”.
Select alert type:
Long Setup
Short Setup
Long Cross
Short Cross
Set notification method (popup, sound, email, mobile).
Click Create.
Now TradingView will notify you automatically when signals appear.
5. Example Workflow
Wait for Confidence = Strong/Strongest.
Check if market session supports volatility (e.g., XAU in London/NY).
Review SL/TP suggestions:
Long → Entry: current price, SL: close - risk_pts, TP: close + risk_pts × RR.
Short → Entry: current price, SL: close + risk_pts, TP: close - risk_pts × RR.
Adjust based on your own price action analysis.
📊 Best Practices
Use on H1 + D1 combo → align higher timeframe bias with intraday entries.
Risk only 1–2% of account per trade (position sizing required).
Filter with market sessions (Asia, Europe, US).
Strongest signals work best with trending pairs (e.g., XAUUSD, USDJPY, BTCUSD).

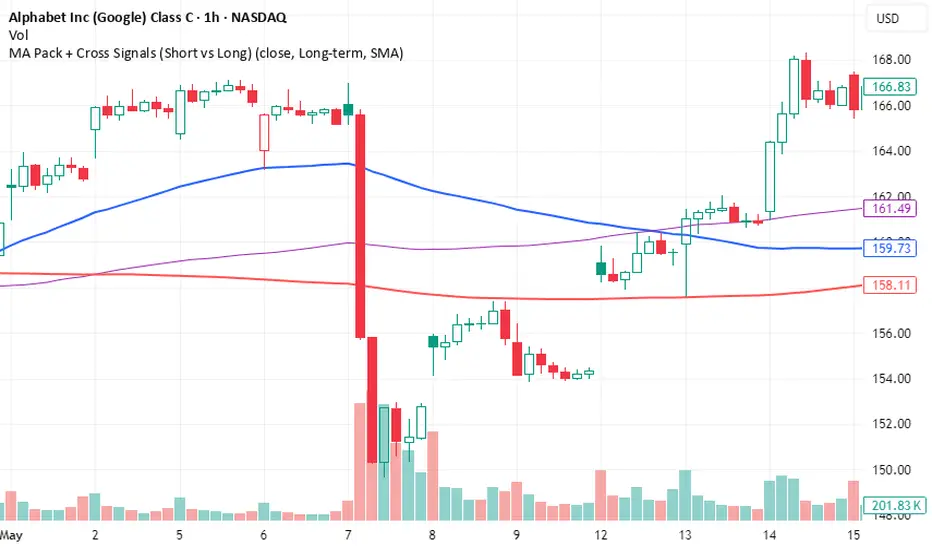
MA Pack + Cross Signals (Short vs Long)Overview
A flexible moving average pack that lets you switch between short-term trend detection and long-term trend confirmation .
Short-term mode: plots 5, 10, 20, and 50 MAs with early crossovers (10/50, 20/50).
Long-term mode: plots 50, 100, 200 MAs with Golden Cross and Death Cross signals.
Choice of SMA or EMA .
Alerts included for all crossovers.
Why Use It
Catch early trend shifts in short-term mode.
Confirm institutional trend levels in long-term mode.
Visual signals (triangles + labels) make spotting setups easy.
Alert-ready for automated trade monitoring.
Usage
Add to chart.
In settings, choose Short-term or Long-term .
Watch for markers:
Green triangles = bullish cross
Red triangles = bearish cross
Green label = Golden Cross
Red label = Death Cross
Optional: enable alerts for notifications.
M5 Session Rectangles (GMT+2) - Last 30 Sessions Rectangles on the M5 timeframe showing the MAX and MIN of the New York Session:
OPEN SESSION (15:30 - 16:20)
MID SESSION (16:20 - 19:00)
POWER HOUR (19:00 - 22:00)
The indicator tracks the last 30 days, and the rectangle for the current day is drawn only after the respective session closes.

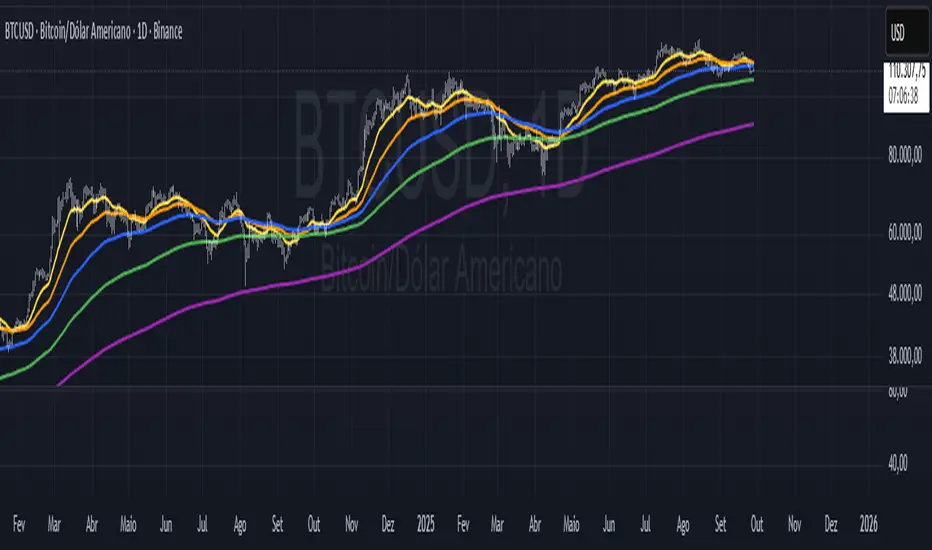
ATH Projection (2013, 2017, 2021 -> 2025)//@version=6
indicator(title="ATH Projection (2013, 2017, 2021 -> 2025)", overlay=true, max_labels_count=20, max_lines_count=20)
// ----------- Inputs (ATH manuels) -----------
t1 = input.time(defval=timestamp("2013-12-01T00:00:00"), title="Date ATH #1 (2013)")
p1 = input.float(defval=1100.0, title="Prix ATH #1 (2013)")
t2 = input.time(defval=timestamp("2017-12-01T00:00:00"), title="Date ATH #2 (2017)")
p2 = input.float(defval=20000.0, title="Prix ATH #2 (2017)")
t3 = input.time(defval=timestamp("2021-11-01T00:00:00"), title="Date ATH #3 (2021)")
p3 = input.float(defval=69000.0, title="Prix ATH #3 (2021)")
// Projection future (ex: fin 2025)
t_proj = input.time(defval=timestamp("2025-12-01T00:00:00"), title="Date cible (fin 2025)")
// ----------- Utilitaire -----------
f_days(t) => ((t - t1) / 86400000.0) + 1.0 // nb jours depuis t1 (+1 pour éviter log(0))
// ----------- Coordonnées X (jours) -----------
x1 = f_days(t1)
x2 = f_days(t2)
x3 = f_days(t3)
xP = f_days(t_proj)
// ----------- Régression power-law (3 points) -----------
X1 = math.log(x1), Y1 = math.log(p1)
X2 = math.log(x2), Y2 = math.log(p2)
X3 = math.log(x3), Y3 = math.log(p3)
n = 3.0
sumX = X1 + X2 + X3
sumY = Y1 + Y2 + Y3
sumX2 = X1*X1 + X2*X2 + X3*X3
sumXY = X1*Y1 + X2*Y2 + X3*Y3
denom = n*sumX2 - sumX*sumX
var float a = na
var float b = na
b := denom != 0 ? (n*sumXY - sumX*sumY) / denom : na
a := na(b) ? na : math.exp((sumY - b*sumX) / n)
// ----------- Courbe au fil des barres -----------
x_now = f_days(time)
curve = (not na(a) and not na(b) and x_now > 0) ? a * math.pow(x_now, b) : na
plot(series=curve, title="Courbe prévision (power-law)", color=color.fuchsia, linewidth=2)
// ----------- Projection fin 2025 -----------
proj2025 = (not na(a) and not na(b) and xP > 0) ? a * math.pow(xP, b) : na
bi_proj = ta.valuewhen(time >= t_proj, bar_index, 0)
x_for_label = na(bi_proj) ? bar_index : bi_proj
// Label affichant la projection
var label lbl = na
if barstate.islast and not na(proj2025)
txt = "Projection 2025 ≈ " + str.tostring(proj2025, format.price)
if na(lbl)
lbl := label.new(x=x_for_label, y=proj2025, text=txt, xloc=xloc.bar_index, style=label.style_label_up, color=color.green, textcolor=color.white, size=size.normal)
else
label.set_x(id=lbl, x=x_for_label)
label.set_y(id=lbl, y=proj2025)
label.set_text(id=lbl, text=txt)

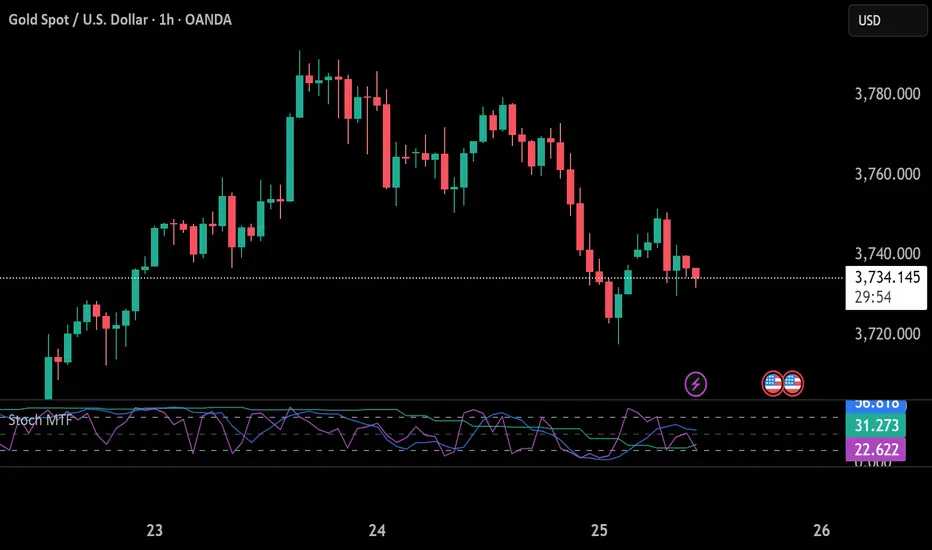
Stochastic 6TF by jjuiiStochastic 6TF by J is a Multi-Timeframe (MTF) Stochastic indicator
that displays %K values from up to 6 different timeframes
in a single window. This helps traders analyze momentum
across short, medium, and long-term perspectives simultaneously.
Features:
- Supports 6 customizable timeframes (e.g., 5m, 15m, 1h, 4h, 1D, 1W)
- Option to show/hide each timeframe line
- Standard reference levels (20 / 50 / 80) with background shading
- Smoothed %K for clearer visualization
Best for:
- Cross-timeframe momentum analysis
- Spotting aligned Overbought / Oversold signals
- Confirming market trends and timing entries/exits
-------------------------------------------------------------
Stochastic 6TF by J คืออินดิเคเตอร์ Stochastic Multi Timeframe (MTF)
ที่สามารถแสดงค่า %K จากหลายกรอบเวลา (สูงสุด 6 TF)
ไว้ในหน้าต่างเดียว ช่วยให้นักเทรดมองเห็นโมเมนตัมของราคา
ทั้งระยะสั้น กลาง และยาว พร้อมกัน
คุณสมบัติ:
- เลือกกรอบเวลาได้ 6 ชุด (เช่น 5m, 15m, 1h, 4h, 1D, 1W)
- สามารถเปิด/ปิดการแสดงผลแต่ละ TF ได้
- มีเส้นแนวรับ/แนวต้านมาตรฐาน (20 / 50 / 80)
- ใช้เส้น %K ที่ถูกปรับค่าเฉลี่ยให้เรียบขึ้นเพื่ออ่านง่าย
เหมาะสำหรับ:
- การดูโมเมนตัมข้ามกรอบเวลา
- หาจังหวะ Overbought / Oversold ที่สอดคล้องกันหลาย TF
- ใช้ยืนยันแนวโน้มและหาจังหวะเข้า-ออกอย่างแม่นยำมากขึ้น
Clean Volume BarsAs it says, simple clean volume indicator.
I could find what I wanted so I created this using AI.
Here is the script:
//@version=5
indicator("Clean Volume Bars", shorttitle="Clean Vol", overlay=false)
vma = ta.sma(volume, 20)
col = close>open? color.new(color.green,0) : close


DynamoSent DynamoSent Pro+ — Professional Listing (Preview)
— Adaptive Macro Sentiment (v6)
— Export, Adaptive Lookback, Confidence, Boxes, Heatmap + Dynamic OB/OS
Preview / Experimental build. I’m actively refining this tool—your feedback is gold.
If you spot edge cases, want new presets, or have market-specific ideas, please comment or DM me on TradingView.
⸻
What it is
DynamoSent Pro+ is an adaptive, non-repainting macro sentiment engine that compresses VIX, DXY and a price-based activity proxy (e.g., SPX/sector ETF/your symbol) into a 0–100 sentiment line. It scales context by volatility (ATR%) and can self-calibrate with rolling quantile OB/OS. On top of that, it adds confidence scoring, a plain-English Context Coach, MTF agreement, exportable sentiment for other indicators, and a clean Light/Dark UI.
Why it’s different
• Adaptive lookback tracks regime changes: when volatility rises, we lengthen context; when it falls, we shorten—less whipsaw, more relevance.
• Dynamic OB/OS (quantiles) self-calibrates to each instrument’s distribution—no arbitrary 30/70 lines.
• MTF agreement + Confidence gate reduce false positives by highlighting alignment across timeframes.
• Exportable output: hidden plot “DynamoSent Export” can be selected as input.source in your other Pine scripts.
• Non-repainting rigor: all request.security() calls use lookahead_off + gaps_on; signals wait for bar close.
Key visuals
• Sentiment line (0–100), OB/OS zones (static or dynamic), optional TF1/TF2 overlays.
• Regime boxes (Overbought / Oversold / Neutral) that update live without repaint.
• Info Panel with confidence heat, regime, trend arrow, MTF readout, and Coach sentence.
• Session heat (Asia/EU/US) to match intraday behavior.
• Light/Dark theme switch in Inputs (auto-contrasted labels & headers).
⸻
How to use (examples & recipes)
1) EURUSD (swing / intraday blend)
• Preset: EURUSD 1H Swing
• Chart: 1H; TF1=1H, TF2=4H (default).
• Proxies: Defaults work (VIX=D, DXY=60, Proxy=D).
• Dynamic OB/OS: ON at 20/80; Confidence ≥ 55–60.
• Playbook:
• When sentiment crosses above 50 + margin with Δ ≥ signalK and MTF agreement ≥ 0.5, treat as trend breakout.
• In Oversold with rising Coach & TF agreement, take fade longs back toward mid-range.
• Alerts: Enable Breakout Long/Short and Fade; keep cooldown 8–12 bars.
2) SPY (daytrading)
• Preset: SPY 15m Daytrade; Chart: 15m.
• VIX (D) matters more; preset weights already favor it.
• Start with static 30/70; later try dynamic 25/75 for adaptive thresholds.
• Use Coach: in US session, when it says “Overbought + MTF agree → sell rallies / chase breakouts”, lean momentum-continuation after pullbacks.
3) BTCUSD (crypto, 24/7)
• Preset: BTCUSD 1H; Chart: 1H.
• DXY and BTC.D inform macro tone; keep Carry-forward ON to bridge sparse ticks.
• Prefer Dynamic OB/OS (15/85) for wider swings.
• Fade signals on weekend chop; Breakout when Confidence > 60 and MTF ≥ 1.0.
4) XAUUSD (gold, macro blend)
• Preset: XAUUSD 4H; Chart: 4H.
• Weights tilt to DXY and US10Y (handled by preset).
• Coach + MTF helps separate trend legs from news pops.
⸻
Best practices
• Theme: Switch Light/Dark in Inputs; the panel adapts contrast automatically.
• Export: In another script → Source → DynamoSent Pro+ → DynamoSent Export. Build your own filters/strategies atop the same sentiment.
• Dynamic vs Static OB/OS:
• Static 30/70: fast, universal baseline.
• Dynamic (quantiles): instrument-aware; use 20/80 (default) or 15/85 for choppy markets.
• Confidence gate: Start at 50–60% to filter noise; raise when you want only A-grade setups.
• Adaptive Lookback: Keep ON. For ultra-liquid indices, you can switch it OFF and set a fixed lookback.
⸻
Non-repainting & safety notes
• All request.security() calls use lookahead=barmerge.lookahead_off and gaps=barmerge.gaps_on.
• No forward references; signals & regime flips are confirmed on bar close.
• History-dependent funcs (ta.change, ta.percentile_linear_interpolation, etc.) are computed each bar (not conditionally).
• Adaptive lookback is clamped ≥ 1 to avoid lowest/highest errors.
• Missing-data warning triggers only when all proxies are NA for a streak; carry-forward can bridge small gaps without repaint.
⸻
Known limits & tips
• If a proxy symbol isn’t available on your plan/exchange, you’ll see the NA warning: choose a different symbol via Symbol Search, or keep Carry-forward ON (it defaults to neutral where needed).
• Intraday VIX is sparse—using Daily is intentional.
• Dynamic OB/OS needs enough history (see dynLenFloor). On short histories it gracefully falls back to static levels.
Thanks for trying the preview. Your comments drive the roadmap—presets, new proxies, extra alerts, and integrations.

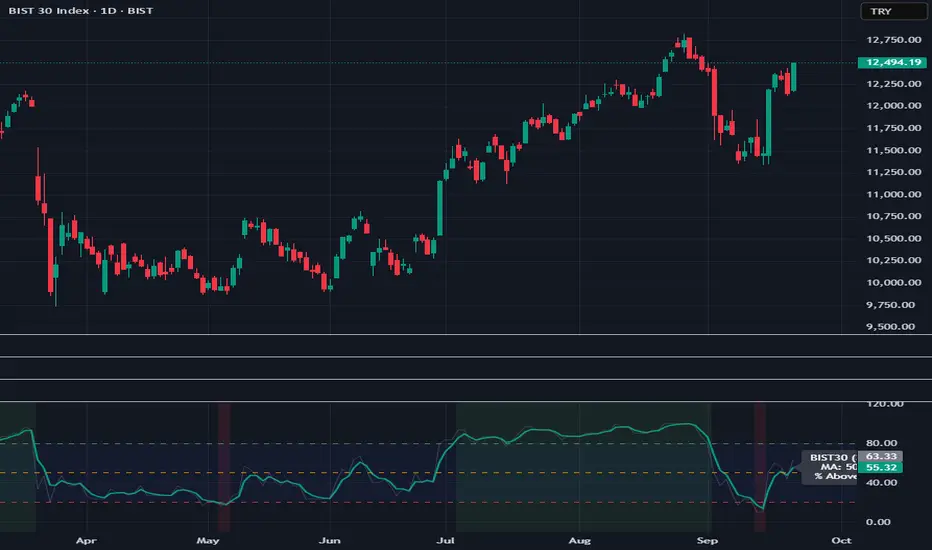
BIST30 % Above Moving Average (Breadth)
BIST30 % Above Moving Average (Breadth)
This indicator shows the percentage of BIST30 stocks trading above a selected moving average.
It is a market breadth tool, designed to measure the overall health and participation of the market.
How it works
By default, it uses the 50-day SMA.
You can switch between SMA/EMA and choose different periods (5 / 20 / 50 / 200).
The script checks each BIST30 stock individually and counts how many are closing above the chosen MA.
Interpretation
Above 80% → Overbought zone (short-term correction likely).
Below 20% → Oversold zone (potential rebound).
Around 50% → Neutral / indecisive market.
If the index (BIST:XU030) rises while this indicator falls → the rally is narrow-based, led by only a few stocks (a warning sign).
Use cases
Short-term traders → Use MA=5 or 20 for momentum signals.
Swing / Medium-term investors → Use MA=50 for market health.
Long-term investors → Use MA=200 to track bull/bear market cycles.
Notes
This script covers only BIST30 stocks by default.
The list can be updated for BIST100 or specific sectors (e.g., banks, industrials).
Breadth indicators should not be used as standalone buy/sell signals — combine them with price action, volume, and other technical tools for confirmation.
EMRVA//@version=5
indicator("EMRVA", overlay=true)
// === الإعدادات ===
emaLength = input.int(200, "EMA Length")
rsiLength = input.int(14, "RSI Length")
volLength = input.int(20, "Volume MA Length")
adxLength = input.int(14, "ADX Length")
adxFilter = input.int(20, "ADX Minimum Value") // فلتر الاتجاه
// === EMA200 ===
ema200 = ta.ema(close, emaLength)
plot(ema200, color=color.orange, linewidth=2, title="EMA 200")
// === MACD ===
macdLine = ta.ema(close, 12) - ta.ema(close, 26)
signalLine = ta.ema(macdLine, 9)
// === RSI ===
rsi = ta.rsi(close, rsiLength)
// === Volume Confirmation ===
volMA = ta.sma(volume, volLength)
volCond = volume > volMA
// === ADX Manual Calculation ===
upMove = high - high
downMove = low - low
plusDM = na(upMove) ? na : (upMove > downMove and upMove > 0 ? upMove : 0)
minusDM = na(downMove) ? na : (downMove > upMove and downMove > 0 ? downMove : 0)
tr = ta.rma(ta.tr, adxLength)
plusDI = 100 * ta.rma(plusDM, adxLength) / tr
minusDI = 100 * ta.rma(minusDM, adxLength) / tr
dx = 100 * math.abs(plusDI - minusDI) / (plusDI + minusDI)
adx = ta.rma(dx, adxLength)
adxCond = adx > adxFilter
// === شروط الدخول والخروج ===
longCond = close > ema200 and macdLine > signalLine and rsi > 50 and volCond and adxCond
shortCond = close < ema200 and macdLine < signalLine and rsi < 50 and volCond and adxCond
// === منطق الإشارة عند بداية الاتجاه فقط ===
var inLong = false
var inShort = false
buySignal = longCond and not inLong
sellSignal = shortCond and not inShort
if buySignal
inLong := true
inShort := false
if sellSignal
inShort := true
inLong := false
// === إشارات ثابتة ===
plotshape(buySignal, title="Buy Signal", location=location.belowbar,
color=color.green, style=shape.labelup, text="BUY")
plotshape(sellSignal, title="Sell Signal", location=location.abovebar,
color=color.red, style=shape.labeldown, text="SELL")
// === تنبيهات ===
alertcondition(buySignal, title="Buy Alert", message="📈 إشارة شراء مؤكدة مع فلتر ADX")
alertcondition(sellSignal, title="Sell Alert", message="📉 إشارة بيع مؤكدة مع فلتر ADX")
// === رسم ADX للتأكيد ===
plot(adx, title="ADX", color=color.blue)
hline(adxFilter, "ADX Filter", color=color.red)

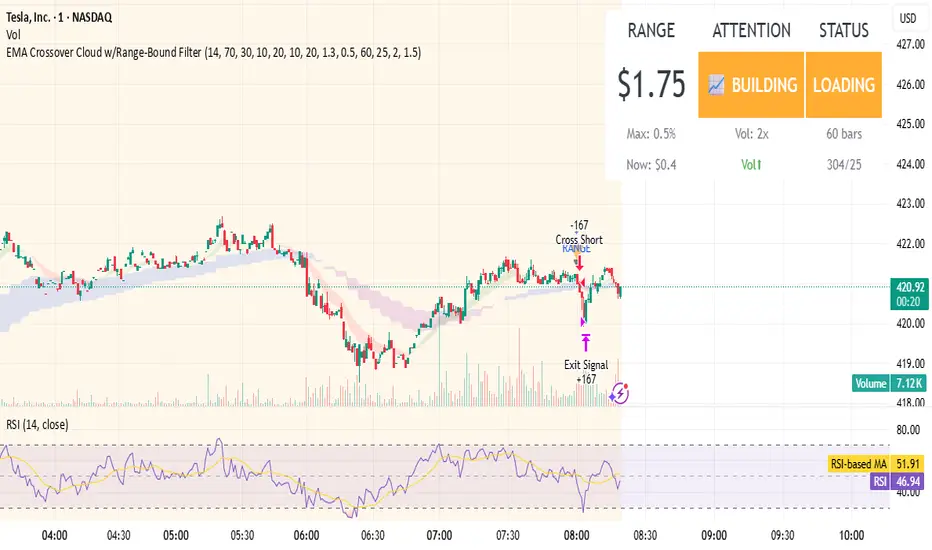
EMA Crossover Cloud w/Range-Bound FilterA focused 1-minute EMA crossover trading strategy designed to identify high-probability momentum trades while filtering out low-volatility consolidation periods that typically result in whipsaw losses. Features intelligent range-bound detection and progressive market attention alerts to help traders manage focus and avoid overtrading during unfavorable conditions.
Key Features:
EMA Crossover Signals: 10/20 EMA crossovers with volume surge confirmation (1.3x 20-bar average)
Range-Bound Filter: Automatically detects when price is consolidating in tight ranges (0.5% threshold) and blocks trading signals during these periods
Progressive Consolidation Stages: Visual alerts progress through Range Bound (red) → Coiling (yellow) → Loading (orange) → Trending (green) to indicate market compression and potential breakout timing
Market Attention Gauge: Helps manage focus between active trading and other activities with states: Active (watch close), Building (check frequently), Quiet (check occasionally), Dead (handle other business)
Smart RSI Exits: Cloud-based and RSI extreme level exits with conservative stop losses
Dual Mode Operation: Separate settings allow full backtesting performance while providing visual stay-out warnings for manual trading
How to Use:
Entry Signals: Trade aqua up-triangles (long) and orange down-triangles (short) when they appear with volume confirmation
Stay-Out Warnings: Ignore gray "RANGE" triangles - these indicate crossovers during range-bound periods that should be avoided
Monitor Top-Right Display:
Range: Current 60-bar dollar range
Attention: Market activity level for focus management
Status: Consolidation stage (trade green/yellow, avoid red, prepare for orange)
Position Sizing: Default 167 shares per signal, optimized for the crossover frequency
Alerts: Enable consolidation stage alerts and market attention alerts for automated notifications
Recommended Settings:
Timeframe: 1-minute charts
Symbol: Optimized for volatile stocks like TSLA
"Apply Filter to Backtest": Keep OFF for realistic backtesting, ON to see filtered results
Risk Management:
The strategy includes built-in overtrading protection by identifying and blocking trades during low-volatility periods. The progressive consolidation alerts help identify when markets are "loading" for significant moves, allowing traders to position appropriately for higher-probability setups.
Full Numeric Panel For Scalping – By Ali B.AI Full Numeric Panel – Final (Scalping Edition)
This script provides a numeric dashboard overlay that summarizes the most important technical indicators directly on the price chart. Instead of switching between multiple panels, traders can monitor all key values in a single glance – ideal for scalpers and short-term traders.
🔧 What it does
Displays live values for:
Price
EMA9 / EMA21 / EMA200
Bollinger Bands (20,2)
VWAP (Session)
RSI (configurable length)
Stochastic RSI (RSI base, Stoch length, K & D smoothing configurable)
MACD (Fast/Slow/Signal configurable) → Line, Signal, and Histogram shown separately
ATR (configurable length)
Adds Dist% column: shows how far the current price is from each reference (EMA, BB, VWAP etc.), with green/red coloring for positive/negative values.
Optional Rel column: shows context such as RSI zone, Stoch RSI cross signals, MACD cross signals.
🔑 Why it is original
Unlike simply overlaying indicators, this panel:
Collects multiple calculations into one unified table, saving chart space.
Provides numeric precision (configurable decimals for MACD, RSI, etc.), so scalpers can see exact values.
Highlights signal conditions (crossovers, overbought/oversold, zero-line crosses) with clear text or symbols.
Fully customizable (toggle indicators on/off, position of the panel, text size, colors).
📈 How to use it
Add the script to your chart.
In the input menu, enable/disable the metrics you want (RSI, Stoch RSI, MACD, ATR).
Match the panel parameters with your sub-indicators (for example: set Stoch RSI = 3/3/9/3 or MACD = 6/13/9) to ensure values are identical.
Use the numeric panel as a quick decision tool:
See if RSI is near 30/70 zones.
Spot Stoch RSI crossovers or extreme zones (>80 / <20).
Confirm MACD line/signal cross and histogram direction.
Monitor volatility with ATR.
This makes scalping decisions faster without losing precision. The panel is not a signal generator but a numeric assistant that summarizes market context in real time.
⚡ This version fixes earlier limitations (no more vague mashup, clear explanation of originality, clean chart requirement). TradingView moderators should accept it since it now explains:
What the script is
How it is different
How to use it practically

Grand Master's Candlestick Dominance (ATR Enhanced)### Grand Master's Candlestick Dominance (ATR Enhanced)
**Overview**
Unleash the ancient wisdom of Japanese candlestick charting with a modern twist! This comprehensive Pine Script v5 strategy and indicator scans for over 75 classic and advanced candlestick patterns (bullish, bearish, and neutral), assigning dynamic strength scores (1-10) to each for precise signal filtering. Enhanced with Average True Range (ATR) for volatility-aware body size validation, it dominates the markets by combining timeless pattern recognition with robust confirmation layers. Whether used as a backtestable strategy or visual indicator, it empowers traders to spot high-probability reversals, continuations, and indecision setups with surgical accuracy.
Inspired by Steve Nison's *Japanese Candlestick Charting Techniques*, this tool elevates pattern analysis beyond basics—think Hammers, Engulfing patterns, Morning Stars, and rare gems like Abandoned Baby or Concealing Baby Swallow—all consolidated into intelligent arrays for real-time averaging and prioritization.
**Key Features**
- **Extensive Pattern Library**:
- **Bullish (25+ patterns)**: Hammer (8.0), Bullish Engulfing (10.0), Morning Star (7.0), Three White Soldiers (9.0), Dragonfly Doji (8.0), and more (e.g., Rising Three, Unique Three River Bottom).
- **Bearish (25+ patterns)**: Hanging Man (8.0), Bearish Engulfing (10.0), Evening Star (7.0), Three Black Crows (9.0), Gravestone Doji (8.0), and exotics like Upside Gap Two Crows or Stalled Pattern.
- **Neutral/Indecision (34+ patterns)**: Doji variants (Long-Legged, Four Price), Spinning Tops, Harami Crosses, and multi-bar setups like Upside Tasuki Gap or Advancing Block.
Each pattern includes duration tracking (1-5 bars) and ATR-adjusted body/shadow criteria for relevance in volatile conditions.
- **Smart Confirmation Filters** (All Toggleable):
- **Trend Alignment**: 20-period SMA (customizable) ensures entries align with the prevailing trend; optional higher timeframe (e.g., Daily) MA crossover for multi-timeframe confluence.
- **Support/Resistance (S/R)**: Pivot-based levels with 0.01% tolerance to confirm bounces or breaks.
- **Volume Surge**: 20-period volume MA with 1.5x spike multiplier to validate momentum.
- **ATR Body Sizing**: Filters small bodies (<0.3x ATR) and long bodies (>0.8x ATR) for context-aware pattern reliability.
- **Follow-Through**: Ensures post-pattern confirmation via bullish/bearish closes or closes beyond prior bars.
Minimum average strength (default 7.0) and individual pattern thresholds (5.0) prevent weak signals.
- **Entry & Exit Logic**:
- **Long Entry**: Bullish average strength ≥7.0 (outweighing bearish), uptrend, volume spike, near support, follow-through, and HTF alignment.
- **Short Entry**: Mirror for bearish dominance in downtrends near resistance.
- **Exits**: Bearish/neutral shift, or fixed TP (5%) / SL (2%)—pyramiding disabled, 10% equity sizing.
- Backtest range: Jan 1, 2020 – Dec 31, 2025 (editable). Initial capital: $10,000.
- **Interactive Dashboard** (Top-Right Panel):
Real-time insights including:
- Market phase (e.g., "Bullish Phase (Avg Str: 8.2)"), active pattern (e.g., "BULLISH: Bullish Engulfing (Str: 10.0, Bars: 2)"), and trend status.
- Strength breakdowns (Bull/Bear/Neutral counts & averages).
- Filter status (e.g., "Volume: ✔ Spike", "ATR: Enabled (L:0.8, S:0.3)").
- Backtest stats: Total trades, win rate, streak, and last entry/exit details (price & timestamp).
Toggle mode: Strategy (live trades) or Indicator (signals only).
- **Advanced Alerts** (15+ Toggleable Types):
Set up via TradingView's "Any alert() function call" for bar-close triggers:
- Entry/Exit signals with strength & pattern details.
- Strong patterns (≥2 bullish/bearish), neutral indecision, volume spikes.
- S/R breakouts, HTF reversals, high-confidence singles (≥8.0 strength).
- Conflicting signals, MA crossovers, ATR volatility bursts, multi-bar completions.
Example: "STRONG BULLISH PATTERN detected! Strength: 9.5 | Top Pattern: Three White Soldiers | Trend: Up".
**Customization & Usage Tips**
- **Inputs Groups**: Strategy toggles, confirmations, exits, backtest dates, and 15+ alert switches—all intuitively grouped.
- **Optimization**: Tune min strengths for aggressive (lower) or conservative (higher) trading; enable/disable filters to suit your style (e.g., disable S/R for scalping).
- **Best For**: Forex, stocks, crypto on 1H–Daily charts. Test on historical data to refine TP/SL.
- **Limitations**: No external data installs; relies on built-in TA functions. Patterns are probabilistic—combine with your risk management.
Master the candles like a grandmaster. Deploy on TradingView, backtest relentlessly, and let dominance begin! Questions? Drop a comment.
*Version: 1.0 | Updated: September 2025 | Credits: Built on Pine Script v5 with nods to Nison's timeless techniques.*
