3SMA +30 Stan Weinstein +200WMA +alert-crossingIndicator Description: Stan Weinstein Strategy + Key Moving Averages
🔹 Introduction
This indicator combines the Classic Stan Weinstein Strategy with a modern update based on the author’s latest recommendations. It includes key moving averages that help identify trends and potential entry or exit points in the market.
📊 Included Moving Averages (Fully Customizable)
All moving averages in this indicator have modifiable parameters, allowing users to adjust values in the input settings.
1️⃣ 30-Week SMA (Stan Weinstein): A long-term trend indicator defining the asset’s main trend.
2️⃣ 40-Week SMA (Weinstein Update): An adjusted version recommended by the author in his recent updates.
3️⃣ 10-Day SMA: Displays short-term price action and helps confirm trend changes.
4️⃣ 100-Day SMA: A medium-term trend measure used by traders to assess trend strength.
5️⃣ 200-Day WMA (Weighted Moving Average): A very long-term indicator that filters market noise and confirms solid trends.
🔍 How to Interpret It
✔️ 30/40-Week SMA in an uptrend → Confirms an accumulation phase or an upward price trend.
✔️ Price above the 200-WMA → Indicates a strong and healthy long-term trend.
✔️ 10-SMA crossing other moving averages → Can signal an early entry or exit opportunity.
✔️ 100-SMA vs. 200-WMA → A breakout of the 100-SMA above the 200-WMA may signal a new bullish phase.
🚨 Built-in Alerts (Key Crossovers)
The indicator includes automatic alerts to notify traders when key moving averages cross, allowing timely reactions:
🔔 10-SMA crossing the 40-SMA → Possible medium-term trend shift.
🔔 10-SMA crossing the 200-WMA → Confirmation of a stronger trend.
🔔 40-SMA crossing the 200-WMA → Long-term trend reversal signal.
💡 Customization: All moving average periods can be adjusted in the input settings, making the indicator flexible for different trading strategies.
스크립트에서 "200元+股票大盘"에 대해 찾기

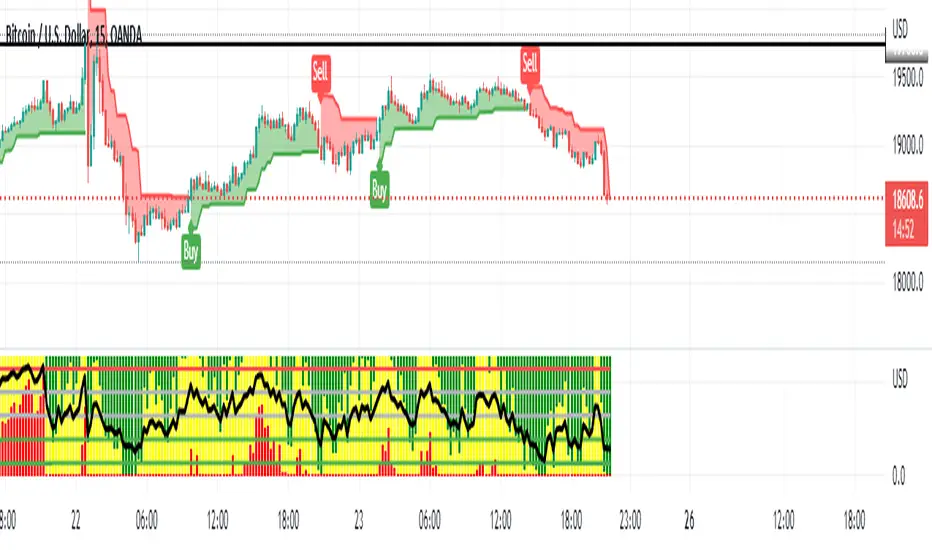
Regime Filter IndicatorRegime Filter – Crypto Market Trend Indicator
📊 Overview
The Regime Filter is a powerful market analysis indicator designed specifically for crypto trading. It helps traders identify whether the market is in a bullish or bearish phase by analyzing key assets in the cryptocurrency market, including Bitcoin (BTC), Bitcoin Dominance (BTC.D), and the Altcoin Market (TOTAL3). The indicator compares these assets against their respective Simple Moving Averages (SMA) to determine the overall market regime, allowing traders to make more informed decisions.
🔍 How It Works
The Regime Filter evaluates three main components to determine the market's sentiment:
1. BTC Dominance (BTC.D) vs. 40 SMA (Medium Timeframe)
The Bitcoin Dominance (BTC.D) is compared to its 40-period SMA on a mid-timeframe (e.g.,
1-hour). If BTC.D is below the 40 SMA, it indicates that altcoins are performing well relative
to Bitcoin, suggesting a bullish altcoin market. If BTC.D is above the 40 SMA, Bitcoin is
gaining dominance, indicating a potential bearish phase for altcoins.
2. TOTAL3 Market Cap vs. 100 SMA (Medium Timeframe)
The TOTAL3 index, which tracks the total market capitalization of all cryptocurrencies except
Bitcoin and Ethereum, is compared to its 100-period SMA. A bullish signal occurs when TOTAL3
is above the 100 SMA, indicating strength in altcoins, while a bearish signal occurs when
TOTAL3 is below the 100 SMA, signaling a potential weakness in the altcoin market.
3. BTC Price vs. 200 SMA (Higher Timeframe)
The current Bitcoin price is compared to its 200-period Simple Moving Average (SMA) on a
higher timeframe (e.g., 4-hour). A bullish signal is given when the BTC price is above the 200
SMA, and a bearish signal when it's below.
🟢 Bullish Market Conditions
The market is considered bullish when:
- BTC Dominance (BTC.D) is below the 40 SMA, suggesting altcoins are gaining momentum.
- TOTAL3 Market Cap is above the 100 SMA, signaling strength in the altcoin market.
- BTC price is above the 200 SMA, indicating an uptrend in Bitcoin.
In these conditions, the background turns green 🟢, and a "Bullish" label is displayed on the chart.
🔴 Bearish Market Conditions
The market is considered bearish when:
- BTC Dominance (BTC.D) is above the 40 SMA, indicating Bitcoin is outperforming altcoins.
- TOTAL3 Market Cap is below the 100 SMA, signaling weakness in altcoins.
- BTC price is below the 200 SMA, indicating a downtrend in Bitcoin.
In these conditions, the background turns red 🔴, and a "Bearish" label appears on the chart.
⚙ Customization Options
- The Regime Filter offers flexibility for traders:
- Enable or Disable Specific SMAs: Customize the indicator by enabling or disabling the 200 SMA for Bitcoin, the 40 SMA for BTC Dominance, and the 100 SMA for TOTAL3.
- Adjust Timeframes: Choose the timeframes for each of the moving averages to suit your preferred trading strategy.
- Real-Time Data Adjustments: The indicator updates in real-time to reflect current market conditions, ensuring timely analysis.
📈 Best Use Cases
- Trend Confirmation: The Regime Filter is ideal for confirming the market's overall trend,
helping traders to align their positions with the dominant market sentiment.
- Trade Entry/Exit Signals: Use the indicator to identify favorable entry or exit points based on
whether the market is in a bullish or bearish phase.
- Market Overview: Gain a quick understanding of the broader crypto market, with a focus on
Bitcoin and altcoins, to make more strategic decisions.
⚠️ Important Notes
Trend-Following Indicator: The Regime Filter is a trend-following tool, meaning it works best in strong trending markets. It may not perform well in choppy, sideways markets.
Risk Management: This indicator is designed to assist in identifying market trends, but it does not guarantee profits. Always apply sound risk management strategies and use additional indicators when making trading decisions.
Not a Profit Guarantee: While this indicator can help identify potential market trends, no trading tool or strategy guarantees profits. Please trade responsibly and ensure that your decisions are based on comprehensive analysis and risk tolerance.

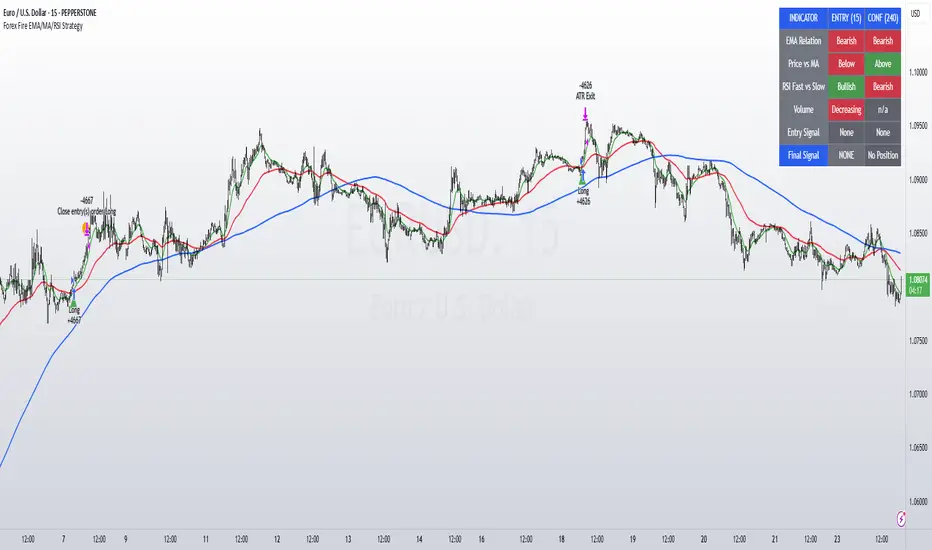
Forex Fire EMA/MA/RSI StrategyEURUSD
The entry method in the Forex Fire EMA/MA/RSI Strategy combines several conditions across two timeframes. Here's a breakdown of how entries are determined:
Long Entry Conditions:
15-Minute Timeframe Conditions:
EMA 13 > EMA 62 (short-term momentum is bullish)
Price > MA 200 (trading above the major trend indicator)
Fast RSI (7) > Slow RSI (28) (momentum is increasing)
Fast RSI > 50 (showing bullish momentum)
Volume is increasing compared to 20-period average
4-Hour Timeframe Confluence:
EMA 13 > EMA 62 (larger timeframe confirms bullish trend)
Price > MA 200 (confirming overall uptrend)
Slow RSI (28) > 40 (showing bullish bias)
Fast RSI > Slow RSI (momentum is supporting the move)
Additional Precision Requirement:
Either EMA 13 has just crossed above EMA 62 (crossover)
OR price has just crossed above MA 200
Short Entry Conditions:
15-Minute Timeframe Conditions:
EMA 13 < EMA 62 (short-term momentum is bearish)
Price < MA 200 (trading below the major trend indicator)
Fast RSI (7) < Slow RSI (28) (momentum is decreasing)
Fast RSI < 50 (showing bearish momentum)
Volume is increasing compared to 20-period average
4-Hour Timeframe Confluence:
EMA 13 < EMA 62 (larger timeframe confirms bearish trend)
Price < MA 200 (confirming overall downtrend)
Slow RSI (28) < 60 (showing bearish bias)
Fast RSI < Slow RSI (momentum is supporting the move)
Additional Precision Requirement:
Either EMA 13 has just crossed under EMA 62 (crossunder)
OR price has just crossed under MA 200
The key aspect of this strategy is that it requires alignment between the shorter timeframe (15m) and the larger timeframe (4h), which helps filter out false signals and focuses on trades that have strong multi-timeframe support. The crossover/crossunder requirement further refines entries by looking for actual changes in direction rather than just conditions that might have been in place for a long time.
Smart MA Crossover BacktesterSmart MA Crossover Backtester - Strategy Overview
Strategy Name: Smart MA Crossover Backtester
Published on: TradingView
Applicable Markets: Works well on crypto (tested profitably on ETH)
Strategy Concept
The Smart MA Crossover Backtester is an improved Moving Average (MA) crossover strategy that incorporates a trend filter and an ATR-based stop loss & take profit mechanism for better risk management. It aims to capture trends efficiently while reducing false signals by only trading in the direction of the long-term trend.
Core Components & Logic
Moving Averages (MA) for Entry Signals
Fast Moving Average (9-period SMA)
Slow Moving Average (21-period SMA)
A trade signal is generated when the fast MA crosses the slow MA.
Trend Filter (200-period SMA)
Only enters long positions if price is above the 200-period SMA (bullish trend).
Only enters short positions if price is below the 200-period SMA (bearish trend).
This helps in avoiding counter-trend trades, reducing whipsaws.
ATR-Based Stop Loss & Take Profit
Uses the Average True Range (ATR) with a multiplier of 2 to calculate stop loss.
Risk-Reward Ratio = 1:2 (Take profit is set at 2x ATR).
This ensures dynamic stop loss and take profit levels based on market volatility.
Trading Rules
✅ Long Entry (Buy Signal):
Fast MA (9) crosses above Slow MA (21)
Price is above the 200 MA (bullish trend filter active)
Stop Loss: Below entry price by 2× ATR
Take Profit: Above entry price by 4× ATR
✅ Short Entry (Sell Signal):
Fast MA (9) crosses below Slow MA (21)
Price is below the 200 MA (bearish trend filter active)
Stop Loss: Above entry price by 2× ATR
Take Profit: Below entry price by 4× ATR
Why This Strategy Works Well for Crypto (ETH)?
🔹 Crypto markets are highly volatile – ATR-based stop loss adapts dynamically to market conditions.
🔹 Long-term trend filter (200 MA) ensures trading in the dominant direction, reducing false signals.
🔹 Risk-reward ratio of 1:2 allows for profitable trades even with a lower win rate.
This strategy has been tested on Ethereum (ETH) and has shown profitable performance, making it a strong choice for crypto traders looking for trend-following setups with solid risk management. 🚀

Exposure Oscillator (Cumulative 0 to ±100%)
Exposure Oscillator (Cumulative 0 to ±100%)
This Pine Script indicator plots an "Exposure Oscillator" on the chart, which tracks the cumulative market exposure from a range of technical buy and sell signals. The exposure is measured on a scale from -100% (maximum short exposure) to +100% (maximum long exposure), helping traders assess the strength of their position in the market. It provides an intuitive visual cue to aid decision-making for trend-following strategies.
Buy Signals (Increase Exposure Score by +10%)
Buy Signal 1 (Cross Above 21 EMA):
This signal is triggered when the price crosses above the 21-period Exponential Moving Average (EMA), where the current bar closes above the EMA21, and the previous bar closed below the EMA21. This indicates a potential upward price movement as the market shifts into a bullish trend.
buySignal1 = ta.crossover(close, ema21)
Buy Signal 2 (Trending Above 21 EMA):
This signal is triggered when the price closes above the 21-period EMA for each of the last 5 bars, indicating a sustained bullish trend. It confirms that the price is consistently above the EMA21 for a significant period.
buySignal2 = ta.barssince(close <= ema21) > 5
Buy Signal 3 (Living Above 21 EMA):
This signal is triggered when the price has closed above the 21-period EMA for each of the last 15 bars, demonstrating a strong, prolonged uptrend.
buySignal3 = ta.barssince(close <= ema21) > 15
Buy Signal 4 (Cross Above 50 SMA):
This signal is triggered when the price crosses above the 50-period Simple Moving Average (SMA), where the current bar closes above the 50 SMA, and the previous bar closed below it. It indicates a shift toward bullish momentum.
buySignal4 = ta.crossover(close, sma50)
Buy Signal 5 (Cross Above 200 SMA):
This signal is triggered when the price crosses above the 200-period Simple Moving Average (SMA), where the current bar closes above the 200 SMA, and the previous bar closed below it. This suggests a long-term bullish trend.
buySignal5 = ta.crossover(close, sma200)
Buy Signal 6 (Low Above 50 SMA):
This signal is true when the lowest price of the current bar is above the 50-period SMA, indicating strong bullish pressure as the price maintains itself above the moving average.
buySignal6 = low > sma50
Buy Signal 7 (Accumulation Day):
An accumulation day occurs when the closing price is in the upper half of the daily range (greater than 50%) and the volume is larger than the previous bar's volume, suggesting buying pressure and accumulation.
buySignal7 = (close - low) / (high - low) > 0.5 and volume > volume
Buy Signal 8 (Higher High):
This signal occurs when the current bar’s high exceeds the highest high of the previous 14 bars, indicating a breakout or strong upward momentum.
buySignal8 = high > ta.highest(high, 14)
Buy Signal 9 (Key Reversal Bar):
This signal is generated when the stock opens below the low of the previous bar but rallies to close above the previous bar’s high, signaling a potential reversal from bearish to bullish.
buySignal9 = open < low and close > high
Buy Signal 10 (Distribution Day Fall Off):
This signal is triggered when a distribution day (a day with high volume and a close near the low of the range) "falls off" the rolling 25-bar period, indicating the end of a bearish trend or selling pressure.
buySignal10 = ta.barssince(close < sma50 and close < sma50) > 25
Sell Signals (Decrease Exposure Score by -10%)
Sell Signal 1 (Cross Below 21 EMA):
This signal is triggered when the price crosses below the 21-period Exponential Moving Average (EMA), where the current bar closes below the EMA21, and the previous bar closed above it. It suggests that the market may be shifting from a bullish trend to a bearish trend.
sellSignal1 = ta.crossunder(close, ema21)
Sell Signal 2 (Trending Below 21 EMA):
This signal is triggered when the price closes below the 21-period EMA for each of the last 5 bars, indicating a sustained bearish trend.
sellSignal2 = ta.barssince(close >= ema21) > 5
Sell Signal 3 (Living Below 21 EMA):
This signal is triggered when the price has closed below the 21-period EMA for each of the last 15 bars, suggesting a strong downtrend.
sellSignal3 = ta.barssince(close >= ema21) > 15
Sell Signal 4 (Cross Below 50 SMA):
This signal is triggered when the price crosses below the 50-period Simple Moving Average (SMA), where the current bar closes below the 50 SMA, and the previous bar closed above it. It indicates the start of a bearish trend.
sellSignal4 = ta.crossunder(close, sma50)
Sell Signal 5 (Cross Below 200 SMA):
This signal is triggered when the price crosses below the 200-period Simple Moving Average (SMA), where the current bar closes below the 200 SMA, and the previous bar closed above it. It indicates a long-term bearish trend.
sellSignal5 = ta.crossunder(close, sma200)
Sell Signal 6 (High Below 50 SMA):
This signal is true when the highest price of the current bar is below the 50-period SMA, indicating weak bullishness or a potential bearish reversal.
sellSignal6 = high < sma50
Sell Signal 7 (Distribution Day):
A distribution day is identified when the closing range of a bar is less than 50% and the volume is larger than the previous bar's volume, suggesting that selling pressure is increasing.
sellSignal7 = (close - low) / (high - low) < 0.5 and volume > volume
Sell Signal 8 (Lower Low):
This signal occurs when the current bar's low is less than the lowest low of the previous 14 bars, indicating a breakdown or strong downward momentum.
sellSignal8 = low < ta.lowest(low, 14)
Sell Signal 9 (Downside Reversal Bar):
A downside reversal bar occurs when the stock opens above the previous bar's high but falls to close below the previous bar’s low, signaling a reversal from bullish to bearish.
sellSignal9 = open > high and close < low
Sell Signal 10 (Distribution Cluster):
This signal is triggered when a distribution day occurs three times in the rolling 7-bar period, indicating significant selling pressure.
sellSignal10 = ta.valuewhen((close < low) and volume > volume , 1, 7) >= 3
Theme Mode:
Users can select the theme mode (Auto, Dark, or Light) to match the chart's background or to manually choose a light or dark theme for the oscillator's appearance.
Exposure Score Calculation: The script calculates a cumulative exposure score based on a series of buy and sell signals.
Buy signals increase the exposure score, while sell signals decrease it. Each signal impacts the score by ±10%.
Signal Conditions: The buy and sell signals are derived from multiple conditions, including crossovers with moving averages (EMA21, SMA50, SMA200), trend behavior, and price/volume analysis.
Oscillator Visualization: The exposure score is visualized as a line on the chart, changing color based on whether the exposure is positive (long position) or negative (short position). It is limited to the range of -100% to +100%.
Position Type: The indicator also indicates the position type based on the exposure score, labeling it as "Long," "Short," or "Neutral."
Horizontal Lines: Reference lines at 0%, 100%, and -100% visually mark neutral, increasing long, and increasing short exposure levels.
Exposure Table: A table displays the current exposure level (in percentage) and position type ("Long," "Short," or "Neutral"), updated dynamically based on the oscillator’s value.
Inputs:
Theme Mode: Choose "Auto" to use the default chart theme, or manually select "Dark" or "Light."
Usage:
This oscillator is designed to help traders track market sentiment, gauge exposure levels, and manage risk. It can be used for long-term trend-following strategies or short-term trades based on moving average crossovers and volume analysis.
The oscillator operates in conjunction with the chart’s price action and provides a visual representation of the market’s current trend strength and exposure.
Important Considerations:
Risk Management: While the exposure score provides valuable insight, it should be combined with other risk management tools and analysis for optimal trading decisions.
Signal Sensitivity: The accuracy and effectiveness of the signals depend on market conditions and may require adjustments based on the user’s trading strategy or timeframe.
Disclaimer:
This script is for educational purposes only. Trading involves significant risk, and users should carefully evaluate all market conditions and apply appropriate risk management strategies before using this tool in live trading environments.

SMA- Ashish SinghSMA
This script implements a Simple Moving Average (SMA) crossover strategy using three SMAs: 200-day, 50-day, and 20-day, with buy and sell signals triggered based on specific conditions involving these moving averages. The indicator is overlaid on the price chart, providing visual cues for potential buy and sell opportunities based on moving average crossovers.
Key Features:
Moving Averages:
The 200-day, 50-day, and 20-day SMAs are calculated and plotted on the price chart. These are key levels that traders use to assess trends.
The 200-day SMA represents the long-term trend, the 50-day SMA is used for medium-term trends, and the 20-day SMA is for short-term analysis.
Buy Signal:
A buy signal is triggered when the price is below all three moving averages (200 SMA, 50 SMA, 20 SMA) and the SMAs are in a specific downward trend (200 SMA > 50 SMA > 20 SMA). This is an indication of a potential upward reversal.
The buy signal is marked with a green triangle below the price bar.
Sell Signal:
A sell signal is triggered when the price is above all three moving averages and the SMAs are in a specific upward trend (200 SMA < 50 SMA < 20 SMA). This signals a potential downward reversal.
The sell signal is marked with a red triangle above the price bar.
Trade Information:
After a buy signal, the buy price, bar index, and timestamp are recorded. When a sell signal occurs, the percentage gain or loss is calculated along with the number of days between the buy and sell signals.
The script automatically displays a label on the chart showing the gain or loss percentage along with the number of days the trade lasted. Green labels represent gains, and red labels represent losses.
User-friendly Visuals:
The buy and sell signals are plotted as small triangles directly on the chart for easy identification.
Detailed trade information is provided with well-formatted labels to highlight the profit or loss after each trade.
How It Works:
This strategy helps traders to identify trend reversals by leveraging long-term and short-term moving averages.
A single buy or sell signal is triggered based on price movement relative to the SMAs and their order.
The tool is designed to help traders quickly spot buying and selling opportunities with clear visual indicators and gain/loss metrics.
This indicator is ideal for traders looking to implement a systematic SMA-based strategy with well-defined buy/sell points and automatic performance tracking for each trade.
Disclaimer: The information provided here is for educational and informational purposes only. It is not intended as financial advice or as a recommendation to buy or sell any stocks. Please conduct your own research or consult a financial advisor before making any investment decisions. ProfitLens does not guarantee the accuracy, completeness, or reliability of any information presented.

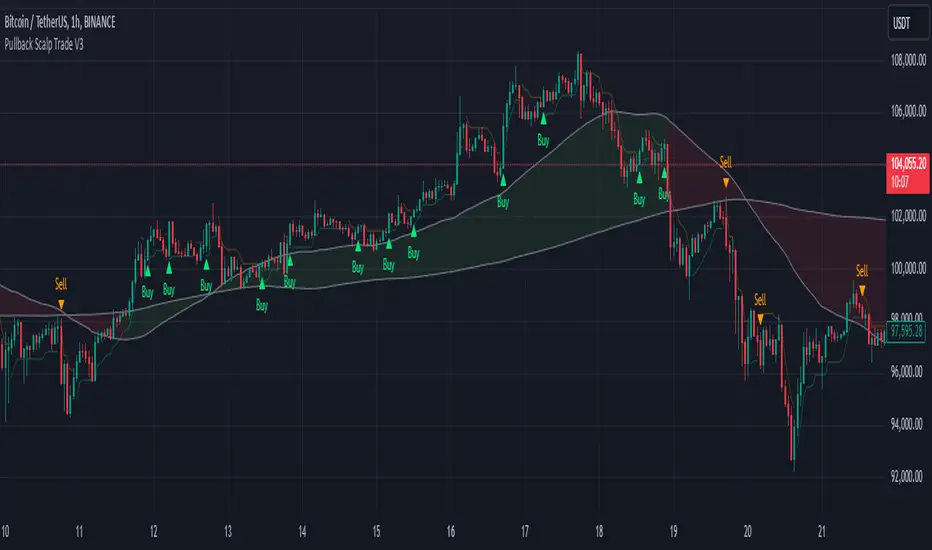
Pullback Scalp Trade V2Pullback Scalp Trading Indicator
This indicator combines multiple technical analysis tools to identify potential pullback trading opportunities in trending markets. It uses a dual moving average system along with RSI for confirmation, providing a comprehensive approach to trend-following and momentum trading.
Key Features:
1. Trend Identification:
- Uses 50 and 200 period moving averages to define the overall trend
- Visual trend zone highlighting for clear market direction
- Customizable MA periods for different timeframes
2. Signal Generation System:
- Combines RSI crossovers with trend direction
- Buy signals occur when:
* Price is above 200 MA (uptrend)
* RSI crosses above its SMA
* RSI is below the lower threshold (default 50)
- Sell signals occur when:
* Price is below 200 MA (downtrend)
* RSI crosses below its SMA
* RSI is above the upper threshold (default 50)
3. Customizable Parameters:
- Short and Long MA periods
- MA types (SMA, EMA, VWMA)
- RSI length and RSI-SMA length
- RSI signal thresholds
- Trend MA periods
Usage Guidelines:
- Best used on higher timeframes (1H and above) for trend trading
- Wait for price to respect the trend zone before taking trades
- Use additional confirmation from price action or other indicators
- Adjust RSI levels based on market volatility
Limitations:
- Like all indicators, this tool may generate false signals in choppy markets
- Should not be used as a sole decision-making tool
- Past performance does not guarantee future results
----------
Türkçe Açıklama:
Bu indikatör, trendli piyasalarda potansiyel geri çekilme fırsatlarını belirlemek için birden fazla teknik analiz aracını birleştirir. Trend takibi ve momentum ticareti için kapsamlı bir yaklaşım sunan ikili hareketli ortalama sistemi ile RSI'yı bir arada kullanır.
Temel Özellikler:
1. Trend Belirleme:
- Genel trendi tanımlamak için 50 ve 200 periyotlu hareketli ortalamalar
- Görsel trend bölgesi vurgulaması
- Farklı zaman dilimleri için özelleştirilebilir MA periyotları
2. Sinyal Üretim Sistemi:
- RSI kesişimlerini trend yönü ile birleştirir
- Alış sinyalleri şu durumlarda oluşur:
* Fiyat 200 MA'nın üzerinde (yükseliş trendi)
* RSI, SMA'sını yukarı keser
* RSI alt eşiğin altında (varsayılan 50)
- Satış sinyalleri şu durumlarda oluşur:
* Fiyat 200 MA'nın altında (düşüş trendi)
* RSI, SMA'sını aşağı keser
* RSI üst eşiğin üzerinde (varsayılan 50)
3. Özelleştirilebilir Parametreler:
- Kısa ve Uzun MA periyotları
- MA tipleri (SMA, EMA, VWMA)
- RSI uzunluğu ve RSI-SMA uzunluğu
- RSI sinyal seviyeleri
- Trend MA periyotları
Kullanım Önerileri:
- Trend ticareti için yüksek zaman dilimlerinde (1S ve üzeri) kullanılması önerilir
- İşlem almadan önce fiyatın trend bölgesine saygı göstermesini bekleyin
- Fiyat hareketi veya diğer indikatörlerden ek teyit alın
- RSI seviyelerini piyasa volatilitesine göre ayarlayın
Sınırlamalar:
- Tüm indikatörler gibi, dalgalı piyasalarda yanlış sinyaller üretebilir
- Tek başına karar verme aracı olarak kullanılmamalıdır
- Geçmiş performans, gelecekteki sonuçların garantisi değildir
Gold Scalping Strategy with Precise EntriesThe Gold Scalping Strategy with Precise Entries is designed to take advantage of short-term price movements in the gold market (XAU/USD). This strategy uses a combination of technical indicators and chart patterns to identify precise buy and sell opportunities during times of consolidation and trend continuation.
Key Elements of the Strategy:
Exponential Moving Averages (EMAs):
50 EMA: Used as the shorter-term moving average to detect the recent price trend.
200 EMA: Used as the longer-term moving average to determine the overall market trend.
Trend Identification:
A bullish trend is identified when the 50 EMA is above the 200 EMA.
A bearish trend is identified when the 50 EMA is below the 200 EMA.
Average True Range (ATR):
ATR (14) is used to calculate the market's volatility and to set a dynamic stop loss based on recent price movements. Higher ATR values indicate higher volatility.
ATR helps define a suitable stop-loss distance from the entry point.
Relative Strength Index (RSI):
RSI (14) is used as a momentum oscillator to detect overbought or oversold conditions.
However, in this strategy, the RSI is primarily used as a consolidation filter to look for neutral zones (between 45 and 55), which may indicate a potential breakout or trend continuation after a consolidation phase.
Engulfing Patterns:
Bullish Engulfing: A bullish signal is generated when the current candle fully engulfs the previous bearish candle, indicating potential upward momentum.
Bearish Engulfing: A bearish signal is generated when the current candle fully engulfs the previous bullish candle, signaling potential downward momentum.
Precise Entry Conditions:
Long (Buy):
The 50 EMA is above the 200 EMA (bullish trend).
The RSI is between 45 and 55 (neutral/consolidation zone).
A bullish engulfing pattern occurs.
The price closes above the 50 EMA.
Short (Sell):
The 50 EMA is below the 200 EMA (bearish trend).
The RSI is between 45 and 55 (neutral/consolidation zone).
A bearish engulfing pattern occurs.
The price closes below the 50 EMA.
Take Profit and Stop Loss:
Take Profit: A fixed 20-pip target (where 1 pip = 0.10 movement in gold) is used for each trade.
Stop Loss: The stop-loss is dynamically set based on the ATR, ensuring that it adapts to current market volatility.
Visual Signals:
Buy and sell signals are visually plotted on the chart using green and red labels, indicating precise points of entry.
Advantages of This Strategy:
Trend Alignment: The strategy ensures that trades are taken in the direction of the overall trend, as indicated by the 50 and 200 EMAs.
Volatility Adaptation: The use of ATR allows the stop loss to adapt to the current market conditions, reducing the risk of premature exits in volatile markets.
Precise Entries: The combination of engulfing patterns and the neutral RSI zone provides a high-probability entry signal that captures momentum after consolidation.
Quick Scalping: With a fixed 20-pip profit target, the strategy is designed to capture small price movements quickly, which is ideal for scalping.
This strategy can be applied to lower timeframes (such as 1-minute, 5-minute, or 15-minute charts) for frequent trade opportunities in gold trading, making it suitable for day traders or scalpers. However, proper risk management should always be used due to the inherent volatility of gold.

Dysmen signalsDysmen Signals Indicator
The "Dysmen Signals" indicator is designed to provide clear buy and sell signals based on the crossover of various Exponential Moving Averages (EMAs). This indicator employs a combination of short-term and long-term EMA crossovers to identify potential trading opportunities, while also highlighting significant market movements through specific signals such as the Golden Cross and Death Cross.
Indicator Components
1. Exponential Moving Averages (EMAs)
- EMA 14: A short-term EMA calculated over 14 periods.
- EMA 20: Another short-term EMA calculated over 20 periods.
- EMA 50: A mid-term EMA used as a trend filter.
- EMA 200: A long-term EMA representing the overall trend.
2. Buy and Sell Signals
- Buy Signal: This is triggered when the EMA 14 crosses above the EMA 20 and the closing price is above the EMA 50. This suggests a bullish trend in the market.
- Sell Signal: This is triggered when the EMA 14 crosses below the EMA 20 and the closing price is below the EMA 50. This indicates a bearish trend in the market.
3. Golden Cross and Death Cross
- Golden Cross (GC): Occurs when the EMA 50 crosses above the EMA 200. This is a strong bullish signal indicating a potential long-term upward trend.
- Death Cross (DC): Occurs when the EMA 50 crosses below the EMA 200. This is a strong bearish signal suggesting a potential long-term downward trend.
4. Signal Visualization
- Buy and Sell signals are marked on the chart with green and red triangles respectively. These signals help traders identify potential entry and exit points.
- Golden Cross and Death Cross signals are indicated with yellow and purple diamonds respectively, providing insight into major market trend shifts.
5. Candle Coloring
- Candles are colored green if a buy signal is active and red if a sell signal is active. This visual aid helps in quickly identifying the prevailing market sentiment.
6. EMA 200 Plotting
- The EMA 200 is plotted as a white, semi-thick line on the chart. This line serves as a reference for the overall long-term trend.
Detailed Code Explanation
- EMA Calculations: The script calculates the EMA for 14, 20, 50, and 200 periods using the ta.ema function.
- Crossover Conditions: It uses the ta.crossover and ta.crossunder functions to detect when the EMAs cross each other, triggering buy and sell signals.
- Plotting Signals: The plotshape function is utilized to display BUY and SELL signals as well as Golden Cross and Death Cross signals on the chart.
- Candle Coloring Logic: A variable direction is used to store the current market direction based on the latest signal, which then determines the candle colors using the barcolor function.
- EMA 200 Display: The plot function is used to draw the EMA 200 line on the chart with the specified color and thickness.
By employing this indicator, traders can gain valuable insights into potential market trends and make more informed trading decisions based on the crossover of key EMAs.

($ROSE Trader) Mean Multiple OscillatorThe ROSE Trader Mean Multiple Oscillator is an adaptation of The Mayer Multiple, using the 99-Day Simple Moving Average rather than the 200-Day (adjusted for ROSE's higher delta), setting distinct preset levels for ROSE overbought and oversold conditions.
Who is this indicator for?
While this indicator will function on any chart, it is setup for trading Oasis BINANCE:ROSEUSDT token specifically — the presets used are tailored to the ROSE chart.
While it is an open source public script, it has been released primarily for the ROSE community
What does this indicator offer?
This indicator follows the same concepts as the Mayer Multiple, popular with BTC. What makes it unique is that it the presets are setup specifically for the BINANCE:ROSEUSDT , based upon my trading experience.
About the Mayer Multiple:
The Mayer Multiple is a derivative of the 200-day MA, calculated by dividing the BTC market price by the 200-day MA. The 200-day MA is a widely recognised indicator for BTC in establishing macro bull or bear bias. The Mayer Multiple therefore represents a measure of distance away from this long-term average or mean price as a tool to gauge overbought and oversold conditions.
For BTC overbought, and oversold conditions, have historically coincided with Mayer Multiple values of 2.4, and 0.8 respectively.
Adapting this concept to the ROSE token:
The adaption of the Mayer Multiple offered here adjusts the 200-day MA to suit the higher delta or volatility of the BINANCE:ROSEUSDT token specifically. For ROSE I use the 99-day MA to establish macro bull or bear bias. The derived 'Mean Multiple', based on the 99-day MA therefore represents a measure of distance away from this long-term average or mean price as a tool to gauge overbought and oversold conditions.
For ROSE overbought, and oversold conditions, tend to coincide with values of 1.618, and 0.618 respectively. Further offsets have been preprogrammed to add nuance to the way this indicator may be used in different market conditions
The ROSE Trader Mean Multiple Oscillator:
The Oscillator version of this script is useful to determine possible levels that price is likely to reach overbought and over sold conditions by plotting the offsets and values directly on the price chart
Calculations:
99-Day Simple Moving Average (99D SMA) * by offset
This script is partnered with the "ROSE Trade Mean Multiple”: an adaptation of The Mayer Multiple, using the 99-Day Simple Moving Average rather than the 200-Day (adjusted for ROSE's higher delta), setting distinct preset levels for ROSE overbought and oversold conditions.
Note: this script is setup to work with any instrument, but the presets are built to provide actionable data on the Oasis BINANCE:ROSEUSDT token specifically. It is not a predicative model, it rather shows how price has behaved historically / statistically at these levels given past data.

CE_ZLSMA_5MIN_CANDLECHART-- Overview
The "CE_ZLSMA_5MIN_CANDLECHART" strategy, developed by DailyPanda, is a comprehensive trading strategy designed for analyzing trading on 5-minute candlestick charts.
It aims to use some indicators calculated from a Hekin Ashi chart, while running it on a normal candlestick chart, making sure that no price distortion affects the strategy results .
It also brings a feature to show, on the candlestick chart, where the entries would take place on the HA chart, to also be able to study the effect that the price distortion would make on your backtest.
-- Credit
The code in this script is based on open-source indicators originally written by veryfid and everget, I've made significant changes and additions to the scripts but all credit for the idea goes to them, I just built on top of it:
-- Key Features
It incorporate already built indicators (ZLSMA) and CandelierExit (CE)
-- Zero Lag Least Squares Moving Average (ZLSMA) - by veryfid
The ZLSMA is used to detect trends with minimal lag, improving the accuracy of entry and exit signals.
It incorporates a double-smoothed linear regression to minimize lag and enhance trend-following capabilities.
Buy signals are generated when the price closes above the ZLSMA together with the CE signal.
It is calculated based on the HA candlestick pattern.
-- Chandelier Exit (CE) - by everget
The Chandelier Exit indicator is used to dynamically manage stop-loss levels based on the Average True Range (ATR).
It ensures that stop-loss levels are adaptive to market volatility, protecting profits and limiting losses.
The ATR period and multiplier can be customized to fit different trading styles and risk tolerances.
It is calculated based on the HA candlestick pattern.
-- Heikin Ashi Candles
The strategy leverages Heikin Ashi candlesticks to be able identify trends more clearly and leverage this to stay on winning trades longer.
Traders can choose to display Heikin Ashi candlesticks and order fills on the chart for better visualization.
-- Risk Management
The strategy includes multiple risk management options to protect traders' capital.
Maximum intraday loss limit based on a percentage of equity.
Maximum stop-loss in points to filter out entries with excessive risk.
Daily profit target to stop trading once the goal is achieved.
Options to use fixed contract sizes or dynamically adjust based on a percentage of equity.
These features help traders manage risk and ensure sustainable trading practices.
Moving Averages
Several moving averages (EMA 9, EMA 20, EMA 50, EMA 72, EMA 200, SMA 200, and SMA 500) are plotted to provide additional context and trend confirmation.
A "Zone of Value" is highlighted between the EMA 200 and SMA 200 to identify potential support and resistance areas.
-- Customizable Inputs
The strategy includes various customizable inputs, allowing traders to tailor it to their specific needs.
Start and stop trading times.
Risk management parameters (e.g., maximum stop-loss, daily drawdown limit, and daily profit target).
Display options for Heikin Ashi candles and moving averages.
ZLSMA length and offset.
-- Usage
-- Setting Up the Strategy
Configure the start year for the strategy and the trading hours using the input fields. The first candle of each day will be filled black for easy identification, while candles that are outside the allowed time range will be filled purple.
Customize the risk management parameters to match your risk tolerance and trading style.
Enable or disable the display of Heikin Ashi candlesticks and moving averages as desired.
-- Interpreting Signals
Buy signals are indicated by a "Buy" label when the Heikin Ashi close price is above the ZLSMA and the Chandelier Exit indicates a long position.
The strategy will automatically enter a long position with a stop-loss level determined the swing low.
Positions are closed when the close price falls below the ZLSMA.
-- Risk Management
The strategy monitors the maximum intraday loss and stops trading if the loss limit is reached.
If enabled, also stops trading once the daily profit target is achieved, helping to lock in gains.
You have the option to filter operations based on a maximum accepted stop-loss level, based on your risk tolerance.
You can also operate with a fixed amount of contracts or dynamically adjust it based on your allowed risk per trade, ensuring optimal protection of capital.
-- Visual Aids
The strategy plots various moving averages to provide additional trend context.
The "Zone of Value" between the EMA 200 and SMA 200 highlights potential support and resistance areas.
Heikin Ashi candlesticks and order fills can be displayed to enhance the difference this strategy would take if you were to backtest it on a Heikin Ashi chart.
-- Table of results
This strategy also breaks down the results on a monthly basis for better understanding of your capital development along the way.
-- Conclusion
The "CE_ZLSMA_5MIN_CANDLECHART" strategy is a tool for intraday traders looking to understand and leaverage the Heikin Ashi chart while still using the normal candle chart. Traders can customize the strategy to fit their specific needs, making it a versatile addition to any trading toolkit.

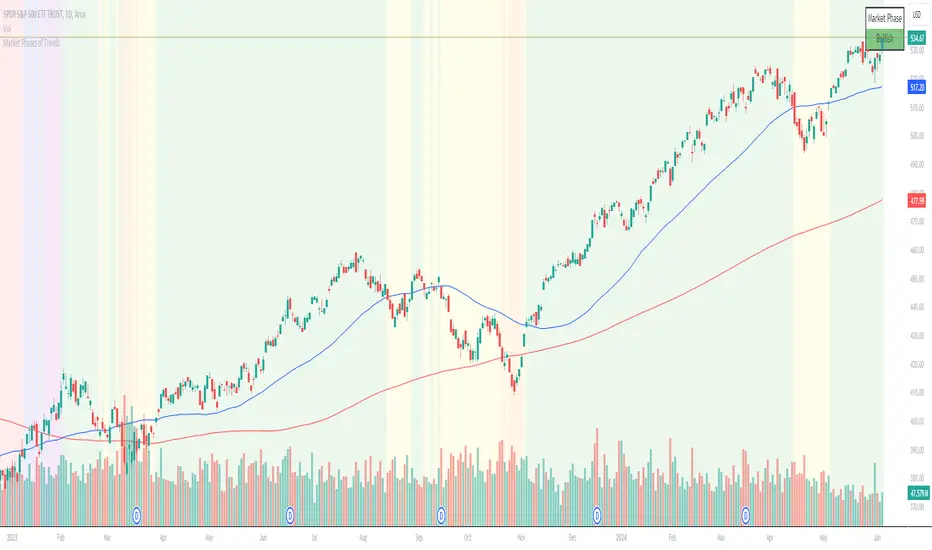
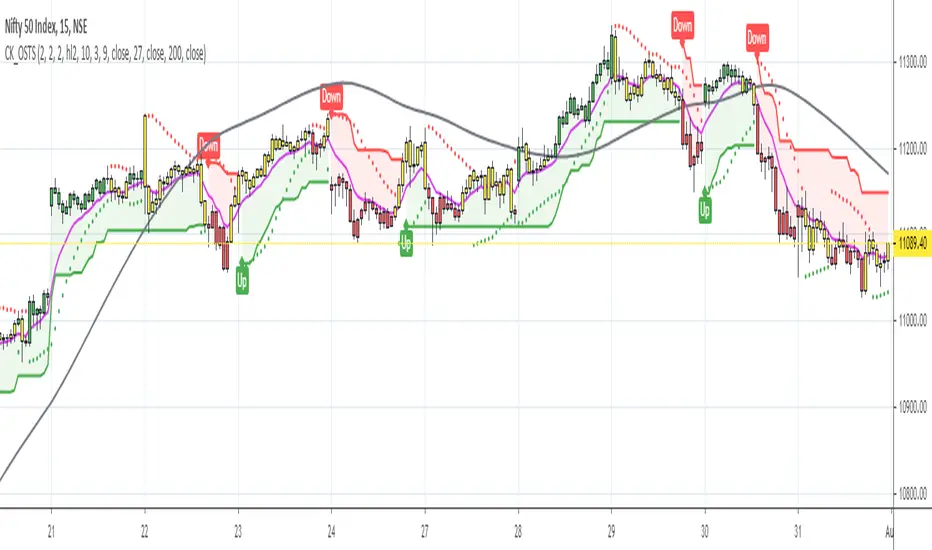
Chuck Dukas Market Phases of Trends (based on 2 Moving Averages)This script is based on the article “Defining The Bull And The Bear” by Chuck Duckas, published in Stocks & Commodities V. 25:13 (14-22); (S&C Bonus Issue, 2007).
The article “Defining The Bull And The Bear” discusses the concepts of “bullish” and “bearish” in relation to the price behavior of financial instruments. Chuck Dukas explains the importance of analyzing price trends and provides a framework for categorizing price activity into six phases. These phases, including recovery, accumulation, bullish, warning, distribution, and bearish, help to assess the quality of the price structure and guide decision-making in trading. Moving averages are used as tools for determining the context preceding the current price action, and the slope of a moving average is seen as an indicator of trend and price phase analysis.
The six phases of trends
// Definitions of Market Phases
recovery_phase = src > ma050 and src < ma200 and ma050 < ma200 // color: blue
accumulation_phase = src > ma050 and src > ma200 and ma050 < ma200 // color: purple
bullish_phase = src > ma050 and src > ma200 and ma050 > ma200 // color: green
warning_phase = src < ma050 and src > ma200 and ma050 > ma200 // color: yellow
distribution_phase = src < ma050 and src < ma200 and ma050 > ma200 // color: orange
bearish_phase = src < ma050 and src < ma200 and ma050 < ma200 // color red
Recovery Phase : This phase marks the beginning of a new trend after a period of consolidation or downtrend. It is characterized by the gradual increase in prices as the market starts to recover from previous losses.
Accumulation Phase : In this phase, the market continues to build a base as prices stabilize before making a significant move. It is a period of consolidation where buying and selling are balanced.
Bullish Phase : The bullish phase indicates a strong upward trend in prices with higher highs and higher lows. It is a period of optimism and positive sentiment in the market.
Warning Phase : This phase occurs when the bullish trend starts to show signs of weakness or exhaustion. It serves as a cautionary signal to traders and investors that a potential reversal or correction may be imminent.
Distribution Phase : The distribution phase is characterized by the market topping out as selling pressure increases. It is a period where supply exceeds demand, leading to a potential shift in trend direction.
Bearish Phase : The bearish phase signifies a strong downward trend in prices with lower lows and lower highs. It is a period of pessimism and negative sentiment in the market.
These rules of the six phases outline the cyclical nature of market trends and provide traders with a framework for understanding and analyzing price behavior to make informed trading decisions based on the current market phase.
60-period channel
The 60-period channel should be applied differently in each phase of the market cycle.
Recovery Phase : In this phase, the 60-period channel can help identify the beginning of a potential uptrend as price stabilizes or improves. Traders can look for new highs frequently in the 60-period channel to confirm the trend initiation or continuation.
Accumulation Phase : During the accumulation phase, the 60-period channel can highlight that the current price is sufficiently strong to be above recent price and longer-term price. Traders may observe new highs frequently in the 60-period channel as the slope of the 50-period moving average (SMA) trends upwards while the 200-period moving average (SMA) slope is losing its downward slope.
Bullish Phase : In the bullish phase, the 60-period channel showing a series of higher highs is crucial for confirming the uptrend. Additionally, traders should observe an upward-sloping 50-period SMA above an upward-sloping 200-period SMA for further validation of the bullish phase.
Warning Phase : When in the warning phase, the 60-period channel can provide insights into whether the current price is weaker than recent prices. Traders should pay attention to the relationship between the price close, the 50-period SMA, and the 200-period SMA to gauge the strength of the phase.
Distribution Phase : In the distribution phase, traders should look for new lows frequently in the 60-period channel, hinting at a weakening trend. It is crucial to observe that the 50-period SMA is still above the 200-period SMA in this phase.
Bearish Phase : Lastly, in the bearish phase, the 60-period channel reflecting a series of lower lows confirms the downtrend. Traders should also note that the price close is below both the 50-period SMA and the 200-period SMA, with the relationship of the 50-period SMA being less than the 200-period SMA.
By carefully analyzing the 60-period channel in each phase, traders can better understand market trends and make informed decisions regarding their investments.
Multiple MAs Signals with RSI MA Filter & Signal About the Script
The "Multiple Moving Averages Signals with RSI MA Filter and Golden Signals" script is a comprehensive trading tool designed to provide traders with detailed insights and actionable signals based on multiple moving averages and RSI (Relative Strength Index). This script combines traditional moving average crossovers with RSI filtering to enhance the accuracy of trading signals and includes "golden" signals to highlight significant long-term trend changes.
This script integrates several technical indicators and concepts to create a robust and versatile trading tool. Here's why this combination is both original and useful:
1. Multiple Moving Averages:
- Why Use Multiple MAs: Different types of moving averages (SMA, EMA, SMMA, WMA, VWMA, Hull) offer unique perspectives on price trends and volatility. Combining them allows traders to capture a more comprehensive view of the market.
- Purpose: Using multiple moving averages helps identify trend direction, support/resistance levels, and potential reversal points.
2. RSI MA Filter:
- Why Use RSI: RSI is a momentum oscillator that measures the speed and change of price movements. It is used to identify overbought or oversold conditions in a market.
- Purpose: Filtering signals with RSI moving averages ensures that trades are taken in line with the prevailing momentum, reducing the likelihood of false signals.
3. Golden Signals:
- Why Use Golden Crosses: A golden cross (50-period MA crossing above the 200-period MA) is a well-known bullish signal, while a death cross (50-period MA crossing below the 200-period MA) is bearish. These signals are widely followed by traders and institutions.
- Purpose: Highlighting these significant long-term signals helps traders identify major buy or sell opportunities and align with broader market trends.
How the Script Works
1. Moving Average Calculations:
- The script calculates multiple moving averages (MA1 to MA5) based on user-selected types (SMA, EMA, SMMA, WMA, VWMA, Hull) and periods (9, 21, 50, 100, 200).
- Golden Moving Averages: Separately calculates 50-period and 200-period moving averages for generating golden signals.
2. RSI and RSI MA Filter:
- RSI Calculation: Computes the RSI for the given period.
- RSI MA: Calculates a moving average of the RSI to smooth out the RSI values and reduce noise.
- RSI MA Filter: Traders can enable/disable RSI filtering and set custom thresholds to refine long and short signals based on RSI momentum.
3. Long & Short Signal Generation:
- Long Signal: Generated when the short-term moving average crosses above both the mid-term and long-term moving averages, and the RSI MA is below the specified threshold (if enabled).
- Short Signal: Generated when the short-term moving average crosses below both the mid-term and long-term moving averages, and the RSI MA is above the specified threshold (if enabled).
4. Golden Signals:
- Golden Long Signal: Triggered when the 50-period golden moving average crosses above the 200-period golden moving average.
- Golden Short Signal: Triggered when the 50-period golden moving average crosses below the 200-period golden moving average.
How to Use the Script
1. Customize Inputs:
- Moving Averages: Choose the type of moving averages and set the periods for up to five different moving averages.
- RSI Settings: Adjust the RSI period and its moving average period. Enable or disable RSI filtering and set custom thresholds for long and short signals.
- Signal Colors: Customize the colors for long, short, and golden signals.
- Enable/Disable Signals: Toggle the visibility of long, short, and golden signals.
2. Observe Plots and Signals:
- The script plots the selected moving averages on the chart.
- Long and short signals are marked with labels on the chart, with customizable colors for easy identification.
- Golden signals are highlighted with specific labels to indicate significant long-term trend changes.
3. Analyze and Trade:
- Use the generated signals as part of your trading strategy. The script provides visual cues to help you make informed decisions about entering or exiting trades based on multiple technical indicators.
Unique Features
1. Integration of Multiple Moving Averages: Combines various moving average types to provide a holistic view of market trends.
2. RSI MA Filtering: Enhances signal accuracy by incorporating RSI momentum, reducing the likelihood of false signals.
3. Golden Signals: Highlights significant long-term trend changes, aligning with broader market movements.
4. Customizability: Offers extensive customization options, allowing traders to tailor the script to their specific trading strategies and preferences.
feel free to comments.

Daniels Script v2 EMA 4h y DTitle:
"EMA 200 Dynamic Projection on 4H and Daily Charts"
Description:
"This script is designed to provide traders with a comprehensive view of market trends by displaying the 200-period Exponential Moving Average (EMA) on both 4-hour and daily charts simultaneously. Unlike typical EMA representations, this script enhances user decision-making by projecting the potential future path of these EMAs using a dynamic slope calculation.
The dynamic projection feature calculates the slope based on recent changes in the EMA, allowing traders to visualize potential future trends more accurately. This innovative approach helps in identifying potential areas of support and resistance before they are fully formed, offering traders a strategic advantage in planning their entries and exits.
Key Features:
Dual Time Frame Analysis: View 200-period EMAs for both 4-hour and daily charts on a single graph.
Dynamic EMA Projections: Projected using a calculated slope from recent EMA changes, presented as dotted lines for clear distinction.
Enhanced Trend Visualization: Helps in recognizing trend continuations or reversals early, aiding in risk management and decision-making processes.
Usage:
Simply add the script to your chart, and the EMAs along with their projections will automatically be displayed. The 4-hour EMA is shown in green, while the daily EMA is in red. Projections extend from the last known data point, providing a visual guide to potential future movements.
This script is unique in its approach to combining real-time EMA analysis with predictive modeling, making it a valuable tool for traders looking to enhance their technical analysis capabilities."
## SPANISH
Título del Script:
"Proyección Dinámica de la EMA 200 en Gráficos de 4H y Diarios"
Descripción del Script:
"Este script está diseñado para proporcionar a los traders una visión integral de las tendencias del mercado al mostrar la Media Móvil Exponencial (EMA) de 200 periodos tanto en los gráficos de 4 horas como diarios simultáneamente. A diferencia de las representaciones típicas de la EMA, este script mejora la toma de decisiones del usuario al proyectar el posible camino futuro de estas EMAs utilizando un cálculo de pendiente dinámico.
La función de proyección dinámica calcula la pendiente basada en cambios recientes en la EMA, permitiendo a los traders visualizar tendencias futuras potenciales con mayor precisión. Este enfoque innovador ayuda a identificar áreas potenciales de soporte y resistencia antes de que se formen completamente, ofreciendo a los traders una ventaja estratégica en la planificación de sus entradas y salidas.
Características Clave:
Análisis de Doble Marco Temporal: Visualiza las EMAs de 200 periodos para los gráficos de 4 horas y diarios en un solo gráfico.
Proyecciones Dinámicas de la EMA: Proyectadas utilizando una pendiente calculada a partir de cambios recientes en la EMA, presentadas como líneas punteadas para una clara distinción.
Visualización Mejorada de Tendencias: Ayuda en el reconocimiento temprano de continuaciones o reversos de tendencias, asistiendo en la gestión de riesgos y en los procesos de toma de decisiones.
Uso:
Simplemente añade el script a tu gráfico, y las EMAs junto con sus proyecciones se mostrarán automáticamente. La EMA de 4 horas se muestra en verde, mientras que la EMA diaria está en rojo. Las proyecciones se extienden desde el último punto de datos conocido, proporcionando una guía visual hacia movimientos futuros potenciales.
Este script es único en su enfoque de combinar análisis de EMA en tiempo real con modelado predictivo, convirtiéndolo en una herramienta valiosa para traders que buscan mejorar sus capacidades de análisis técnico."

Market Smith IndicatorsMarket Smith has a collection of tools that are useful for identifying stocks. On their charts they have a 21/50/200 day moving averages, high and low pivot points, a relative strength line, and a relative strength rating. This script contains indicators for the following:
21/50/200 Day Moving Averages
High and Low pivot points
A Relative Strength line
A Relative Strength rating
21/50/200 Day Moving Averages
The 21/50/200 Day moving averages are simple moving averages. They are visible in any chart increment but to use them properly you need to set you charts to be by day. Labels will appear on the right of the lines to show that they are representative of 21/50/200 day moving averages.
High and Low pivot points
The High and Low pivot points are green for high pivot points and red for low points. They are show in the Market Smith style with the numbers simply above the pivot points.
Relative Strength line
The Relative Strength line is a line that shows the strength of the stock compared to the S&P 500. In this case we utilize the SPX ticker to compare the stock to. This line is almost identical to the Market Smith tool and is an excellent tool to determine how a stock is doing compared to the market. When movements in the stock and shown with sideways trending of the RS line that means that the stock is following the market. When a stock is outperforming the market the RS line will follow.
Relative Strength rating
Thank you to ©Fred6724 for the RS Rating inspiration. They wrote excellent open source code for a RS Rating comparable to Market Smith. As the RS Rating in Market Smith is not open source it is difficult to know exactly how it is being calculated. After simplifying Fred's code and building upon a few ideas I had I compared the RS Rating to multiple Market Smith Ratings. The rating is close but often off by multiple points. If there is anyone who has a better idea on how to get this rating or how to improve on the code please send me a PM or fork this project. This rating is a good indicator to see how a certain stock compares to other stocks in the market. In Market Smith they are able to utilize their database to compare it to all other stocks. Since we do not have access to the same tools we are only able to compare it to the percentage of stocks above the 200, 150, 100, 50, and 20 day moving average.
Using these tools together are a small fraction what make people like Bill O'neill and Jim Roppel so successful. I plan on updating the RS Rating as I continue to work on this project so if there is anyone who has ideas then please send me a PM. Ultimately the goal of this project is to have a solution that is identical to Market Smith.

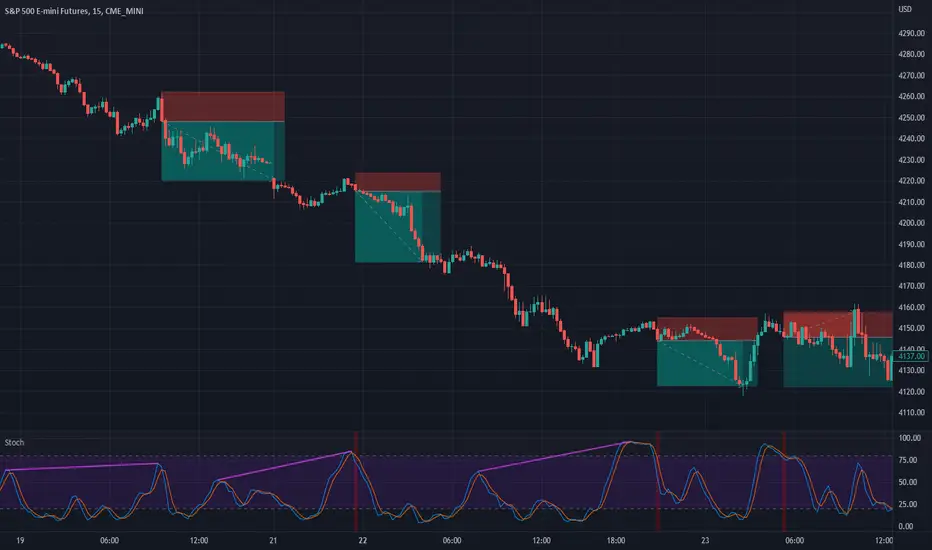
Stochastic with DivergencesReuploading as there was an issue with the description.
This indicator uses the popular Stochastic indicator as its base. I have included the ability to draw divergences on the indicator as they occur live. By default it will be off, select the settings for the indicator and about halfway down there will be a dropdown menu that says "Off". Select it and then select which divergences you want to draw: Regular, Hidden, or Both. I like to draw both. I find that hidden divergence is really nice during a trending market and the regular divergence is works great in a range market. I also feel that the regular divergence is great during a trending market if you are given the signal but then wait for the next price movement for a double top/bottom to occur. The Stochastic indicator itself is often used in a ranging market by selling when it is overbought and buying once it indicates oversold (much like the RSI indicator). I find that it can work in trending markets if you only take overbought in a down trend and oversold in an up trend. In the above picture you can see that I had used it to trade this downtrend using both the Hidden Divergence and Sell Signals to catch the trend continuation until it failed on the fourth trade. From here I would usually start using the Stochastic as simply an oscillating indicator and buy/sell based on overbought/oversold. I've also added an option to enable the Stochastic RSI if you'd rather use that, as well as a fill option which simply colors in the space between the Stochastic and Signal lines. The Signals option will put on highlights of when to buy or sell based on overbought/oversold areas that agree with the long term trend (based on the 200 EMA).
Divergence is a short way of saying there was a higher or lower movement compared to normal but the price did not represent that movement, indicating strength or weakness in a specific direction.
Regular divergence is an indication of a trend reversal. Regular bullish divergence occurs when the price chart shows a lower low while the stochastic shows a higher low. Regular bearish divergence occurs when the price chart shows a higher high while the stochastic shows a lower high.
Hidden divergence is an indication of a trend continuation. Hidden bullish divergence occurs when the price chart shows a higher low while the stochastic shows a lower low. Hidden bearish divergence occurs when the price chart shows a lower high while the stochastic shows a higher high.
The "Only Trending Divergences" option, if enabled, will only show bearish divergences during a down trend (price is below 200 EMA) and only show bullish divergences during an uptrend (price is above 200 EMA). I like to use this option and have set it to ON by default.
The "Middle Filter" option, if enabled, ensures that Highs on the stochastic indicator will not be counted as Highs unless they are above the middle value of the oscillator (which is 50), same goes for lows: they will not be counted as Lows unless they are below the middle value of the oscillator.
I also include buy/sell signals that coincide with the trend (based on the 200 EMA). If price is currently below the 200 EMA and the stochastic indicator is overbought (over 80), you can get a sell signal when it the blue line crosses down below 80. This sell signal shows that you are in a down trend and the price just was overbought but is now likely to continue pushing downwards. The opposite works for buy signals: Above 200 EMA, stochastic goes below 20, when it crosses above 20 it will show a green highlight to indicate price is likely to push upwards.
I think the default options are likely the best to use. The only one I tend to change on occasion is the "Pivots to look back" which I adjust usually to either 1 or 3.
Seth_Signal
This script designed to identify up, down, and sideways trends. 200 HMA , 9 EMA , PSAR, and ATR are used to identify the strength of any instrument.
Candle Colors - Simpler approach to follow:
Green color indicates for up side trade signals
Red color indicates for down side trade signals
Yellow color can be interpreted for stop, sideways, and counter trade trade signals
Multiple Trade Setups:
Green Zone - Trading green candles within green zone has better odds of long trades
Red Zone - Trading red candles within red zone has better odds of short trades
200 HMA - Candles above 200 HMA mostly for long trades. Candles below 200 HMA usually for short trades. But the zone also very important to consider
9 EMA - Cross over above 200 HMA in Green zone, look for long trades. Cross over below 200 HMA in red zone, look for short trades
PSAR - This can be used as potential initial warning sign. Also can be used to exit partial or wait for it goes to opposite side for taking trade decisions
Candle Above all - If Green candle and above all the indicators, then very good sign of long side. If red candle and below all indicators, then very good sign of short side.
Multiple Time Frame:
This works very well with any instrument and on any time frame. Always its better to do analysis on multi time frame before entry, exit, and trade execution. Back test it with this setup and also observe it on live market. That will give edge in taking trade decisions. All the best and happy trading.
Bogdan Ciocoiu - Pager► Description
This script creates the possibility for users to set up alerts on different timeframes when close prices crossover or cross under certain essential exponential moving averages such as 20, 50 or 200. The script shows the fundamental levels where one can set notifications.
The current levels are:
15min timeframe: when Close < EMA 200
15min timeframe: when close > EMA 200
5min timeframe: when close < EMA 200
5min timeframe: when close > EMA 200
60min timeframe: when close < EMA 200
60min timeframe: when close > EMA 200
► Originality and usefulness
This tool is helpful because it enables users to use the notification system when specific trends form without actively monitoring price action.
► Open-source reuse
The script only leverages TradingView native functionality.

EBB & Flow: a multi-EMA-based BB cloudIntro
This is an idea evolved out of the market maker method and EMA convergence, divergence, and mean reversion.
The market maker method informs us that the 5, 13, 50 and 200 EMAs are important to regulating price. Those EMA lengths are multiples of the 50 and 200 on lower major timeframes -- the 1 minute, 5, 15, 1H, 4H, 1D. I include the 21 because it is also a multiple and in crypto very often respected.
When market makers are testing price, they set their range and spike in the direction they test for liquidity. This can get chaotic. For instance, in a shorter time frame consolidation inside a bigger timeframe uptrend, it can be too easy to forget where you are in the many trends playing out.
When the EMAs are dragged over each other during normal price movement, you get these crisscrossing tracks of price, and the individual breaks can be hard to trace.
The range is what matters, ultimately, and the range is dynamic. In that case, the Bollinger Band is a great tool for detecting outliers in this case.
The Answer
So the answer this indicator seeks to give, is to look for outliers. This gives you a scalping strategy built on Traders Reality thinking and best put together with the PVSRA indicator, which I may include in this indicator just for the sake of concision, but they can work alongside each other or separately.
The key thing is the different EMA clouds, which are bollinger bands. Tight bands mean imminent breaks, favouring the trend. Vector candles out of a zone, pins to the low/high, etc. are all very relevant alongside this indicator.
You can also use it on its own and scalp the breaks of a cloud.
How it works
Each cloud is a standard deviation from their respective EMA, all in the same colour. The deviation multiple is 1.618 by default. Yes, fibonacci sequences are usually nonsense, but it works better with the BB than 2, 2.5 or 3.
Using just the clouds, you can see where each EMA is headed and how it behaves within the deviation of the others.
But that on its own isn't enough.
The indicator will also print snowflakes above and below the candle for notable outliers. It will be in the colour of the cloud it breaks, but only if that break is also breaking the smaller EMA clouds too.
The most snowflakes will be yellow because that's the 13 EMA. That one is dependent on nothing else and every break will print a snowflake. The 21 will be dependent on the 13. The 50 dependent on the 13 and 21 breaks. The 200 the most important.
For example, if the 200 EMA-BB or EBB is broken at the upper band, deviating by more than 162% of price over a 200 period EMA, and that break is not above the 50 EMA cloud, there will be no snowflake. However, if it exceeds the 13, 21, 50, and 200 clouds, then a purple snowflake will appear above the bar.
Any snowflake is an extreme in price. The purple is an especially good point of entry. That doesn't mean it is a perfect entry. You can build position from it, though, and be relatively certain of a price correction in the near future, because not only was this major EMA cloud violated, but all of the smaller ones too.
Reminder
You still need your PVSRA and candlesticks. This indicator on its own may have a nice hit rate for scalping and building position, as an alternative to the TDI or alongside it, but it is not enough on its own, just like the TDI.
Enjoy!

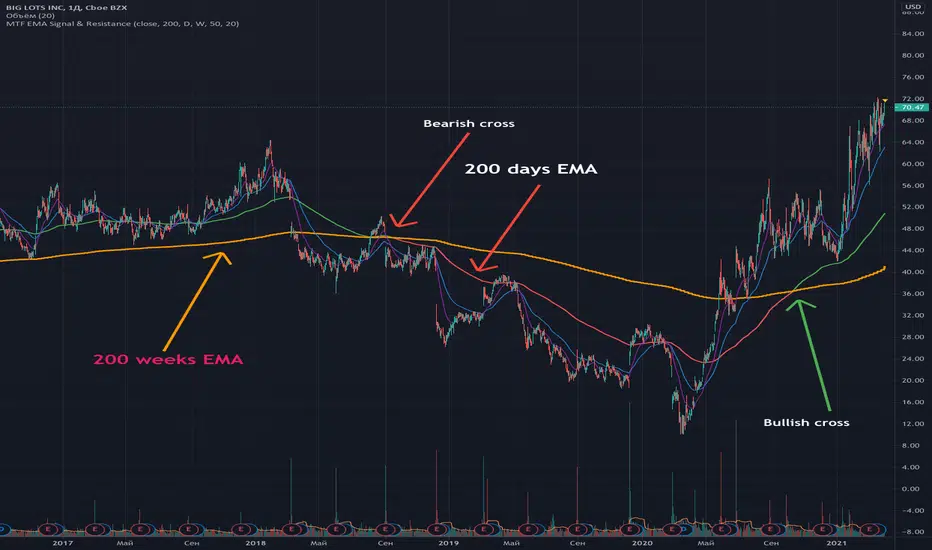
Multi Time Frame EMA Signal & ResistanceFull code and description: github.com/samgozman/MTF-EMA-Signal-and-Resistance
The idea of this script is quite simple. Imagine that you have a 200-day EMA and its support or resistance line is the 200-week EMA.
Then if EMA 200 1D > EMA 200 1W then the trend is bullish.
That is, EMA 200 1D is the signal line, and EMA 200 1W is the resistance.
Of course, you can independently set the time interval for the signal line and resistance, as well as the number of periods.
In addition to setting time intervals and period lengths, you can optionally enable the display of additional class EMAs.
You can also set the timeframe for the signal line equal to the current time period.
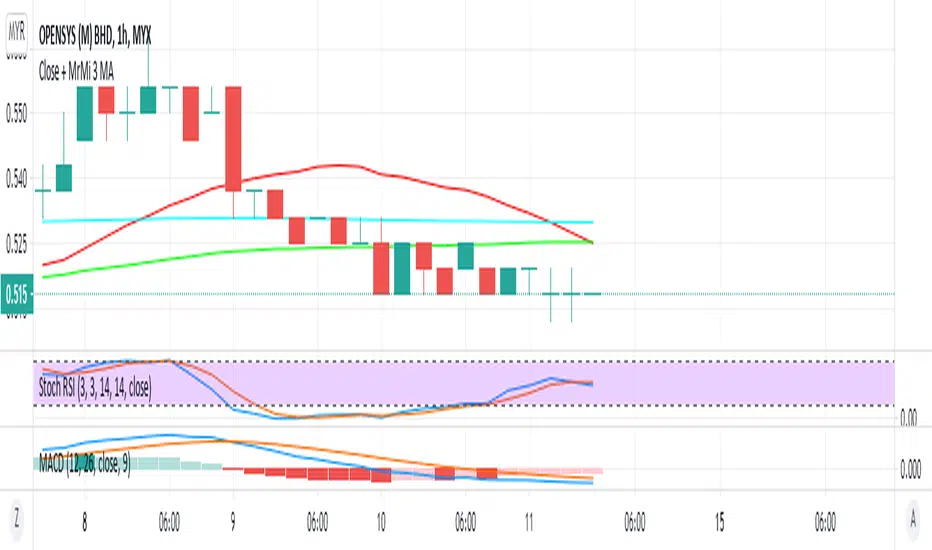
MrMi 3 in 1 MAThis 3 in 1 moving average script can help all of you to save your indicator use especially for free user. this script icluded 20 MA, 50 MA, and 200 MA which is important to all trader. I hope this script can assist all of you to maximize the important indicators in your trading plan.
Skrip purata bergerak 3 dalam 1 ini dapat membantu anda semua untuk menjimatkan penggunaan penunjuk anda terutama untuk pengguna percuma. skrip ini merangkumi 20 MA, 50 MA, dan 200 MA yang penting bagi semua peniaga. Saya harap skrip ini dapat membantu anda semua untuk memaksimumkan petunjuk penting dalam rancangan perdagangan anda.
يمكن أن يساعدك هذا البرنامج النصي 3 في 1 في المتوسط المتحرك جميعًا على حفظ استخدام المؤشر الخاص بك بشكل خاص للمستخدم المجاني. يتضمن هذا البرنامج النصي 20 MA و 50 MA و 200 MA وهو أمر مهم لجميع المتداولين. آمل أن يساعدك هذا البرنامج النصي جميعًا على تعظيم المؤشرات المهمة في خطة التداول الخاصة بك.
这种三合一移动平均值脚本可以帮助所有人节省指标使用量,尤其是对于免费用户而言。该脚本包括20 MA,50 MA和200 MA,这对所有交易者都很重要。我希望该脚本可以帮助大家最大化您的交易计划中的重要指标。
यह 3 इन 1 मूविंग एवरेज स्क्रिप्ट विशेष रूप से मुफ्त उपयोगकर्ता के लिए आपके संकेतक उपयोग को बचाने में आप सभी की मदद कर सकती है। इस स्क्रिप्ट में 20 एमए, 50 एमए और 200 एमए शामिल हैं जो सभी व्यापारी के लिए महत्वपूर्ण है। मुझे उम्मीद है कि यह स्क्रिप्ट आपकी ट्रेडिंग योजना में महत्वपूर्ण संकेतकों को अधिकतम करने के लिए आप सभी की सहायता कर सकती है।
이 3 in 1 이동 평균 스크립트는 특히 무료 사용자를 위해 지표 사용을 절약하는 데 도움이 될 수 있습니다. 이 스크립트에는 모든 상인에게 중요한 20 MA, 50 MA 및 200 MA가 포함되었습니다. 이 스크립트가 거래 계획의 중요한 지표를 극대화하는 데 도움이되기를 바랍니다.
この3in 1移動平均スクリプトは、特に無料ユーザーの場合、インジケーターの使用を節約するのに役立ちます。このスクリプトには、すべてのトレーダーにとって重要な20 MA、50 MA、および200MAが含まれていました。このスクリプトが、取引計画の重要な指標を最大化するのに役立つことを願っています。
One-Stop Trading SetupOne-Stop Trading Setup:
This script designed to identify up, down, and sideways trends. 200 HMA, 9 EMA, PSAR, and ATR are used to identify the strength of any instrument.
Candle Colors - Simpler approach to follow:
Green color indicates for up side trade signals
Red color indicates for down side trade signals
Yellow color can be interpreted for stop, sideways, and counter trade trade signals
Multiple Trade Setups:
Green Zone - Trading green candles within green zone has better odds of long trades
Red Zone - Trading red candles within red zone has better odds of short trades
200 HMA - Candles above 200 HMA mostly for long trades. Candles below 200 HMA usually for short trades. But the zone also very important to consider
9 EMA - Cross over above 200 HMA in Green zone, look for long trades. Cross over below 200 HMA in red zone, look for short trades
PSAR - This can be used as potential initial warning sign. Also can be used to exit partial or wait for it goes to opposite side for taking trade decisions
Candle Above all - If Green candle and above all the indicators, then very good sign of long side. If red candle and below all indicators, then very good sign of short side.
Multiple Time Frame:
This works very well with any instrument and on any time frame. Always its better to do analysis on multi time frame before entry, exit, and trade execution. Back test it with this setup and also observe it on live market. That will give edge in taking trade decisions. All the best and happy trading.
Disclaimer:
This script and setup is written with the sole purpose of identifying the strength of any instrument. Interpretation, trade decisions, and changing inputs are up to each individual users/trades.
MACD/EMA/SMA/Ichimoku Confluence StrategyThis strategy uses a number of chart indicators to provide a Bullish/Bearish signal. Using a combination of the 200 SMA, the 20 EMA, the MACD and the Ichimoku cloud, the strategy logic will adjust the amount of confluence required between the indicators depending on how bullish or bearish the chart is looking. The logic looks for the following:
- Are we above or below the 200 SMA?
- Are we above or below the 20 EMA?
- Have we had a bullish MACD cross?
- Where are we in relation to the Ichimoku cloud?
If the coin is below the 200 SMA, then the strategy will only give a buy signal if the coin closes a candle above the 20 EMA AND the MACD is bullish and either the Ichimoku cloud is green, or the coin is above the Ichimoku cloud (regardless of colour).
If the coin is above the 200 SMA, Then the strategy will give a buy signal if the coin closes a candle above the 20 EMA AND the MACD is bullish and the coin is either IN the cloud (not necessarily above it) or the cloud is green.
The reverse is true for a sell signal, i.e. when the coin is above the 200 SMA it must close a candle below the Ichimoku cloud and be bearish in relation to the 20 EMA and MACD. If it is below the 200 SMA, then the strategy will give a sell signal if the the EMA/MACD conditions are true and the coin enters the cloud.
This strategy gives a fairly conservative signal for entry and exit points, but is fairly successful across a number of time frames, both short term and long term. As with all my strategies, I only include LONG entries and closes, not SHORT entries (as I find they make for inaccurate backtesting).
Please feel free to like, share, critique and suggest any improvements to this strategy. All feedback, positive and negative, is appreciated.
