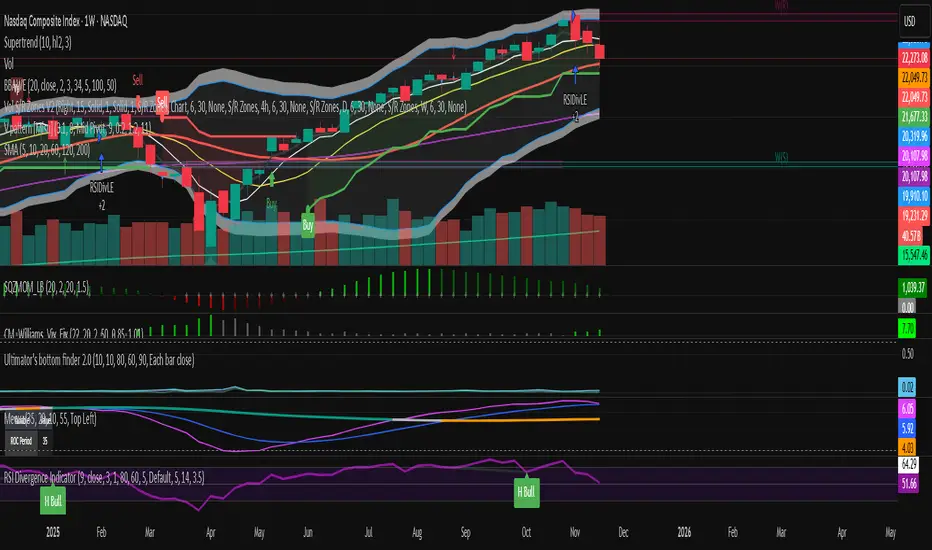
Simple Moving Averages (5, 10, 20, 60, 120, 200SMA for different time frames.
Covers 5, 10, 20, 60, 120, 200 sma units
스크립트에서 "200亿美元是多少人民币"에 대해 찾기
MA Suite 10/50/150/200 + Legend (v6)ma 10 50 150 200 that i have made with chat gpt to help find moving avarage

Vertical Lines: 5, 20, 50, 200 Days Back - 30 minutesVerticals lines to indicate 5, 20, 50, and 200 day marks on a 30 minute chart. Used in Swing trading with multi-timeframe approach to mark the levels.
Generated using Claude.

300/200 EMA Spread HeatmapHighlights the difference between 300 and 200 EMA to indicated potential over extensions in breakout structures.

EMA 50/100/200 Trend BandsEMA Trend Bands is a clean and powerful trend-structure tool built around the classic 50/100/200 EMA stack.
It provides an intuitive, color-coded view of market conditions by identifying when the trend is bullish, bearish, or neutral based on EMA alignment.
This indicator is designed for traders who want a simple, objective trend filter without the clutter of extra signals or repainting logic.


Moving Averages: 09-21-55-200 - Multiple Times Frames v2This is a multi-timeframe 9ema, 21ema, 55ema and the 200 SMA for the 1 minute, 2minute, 5 minute and 15 minute timeframes. SO when you are on any of these time-frames it will show the EMAs and SMAs for the other levels.

EMA 8/50/200I set it up so that three EMAs are displayed within a single indicator window.
このスクリプトでは、3本のEMA(8間・50期間・200期間)を1つのインジケータ枠で表示しています。

EMA50/200 — Nth Close After Break (Up/Down/Both)This indicator tracks EMA-based momentum confirmation using a customizable N-bar rule.
🧠 Logic:
- You can choose whether to track EMA 50 or EMA 200.
- When the price breaks above (or below) the selected EMA, the indicator starts counting.
- If the price stays on that side of the EMA for N consecutive closes, a single signal is triggered on the Nth bar.
- After signaling, the counter resets — the next signal appears only after a new EMA break.
⚙️ Parameters:
- Target EMA: Choose which EMA (50 or 200) the logic is based on.
- N: Number of consecutive bars required after a break.
- Direction: Up / Down / Both.
- Optional trend filters: Require EMA50 > EMA200 for Up signals, or EMA50 < EMA200 for Down signals.
- Blue ▲ = Bullish signal (Nth close after breaking above EMA)
- Red ▼ = Bearish signal (Nth close after breaking below EMA)
✅ Ideal for identifying strong trend confirmations and filtering out false EMA breakouts.

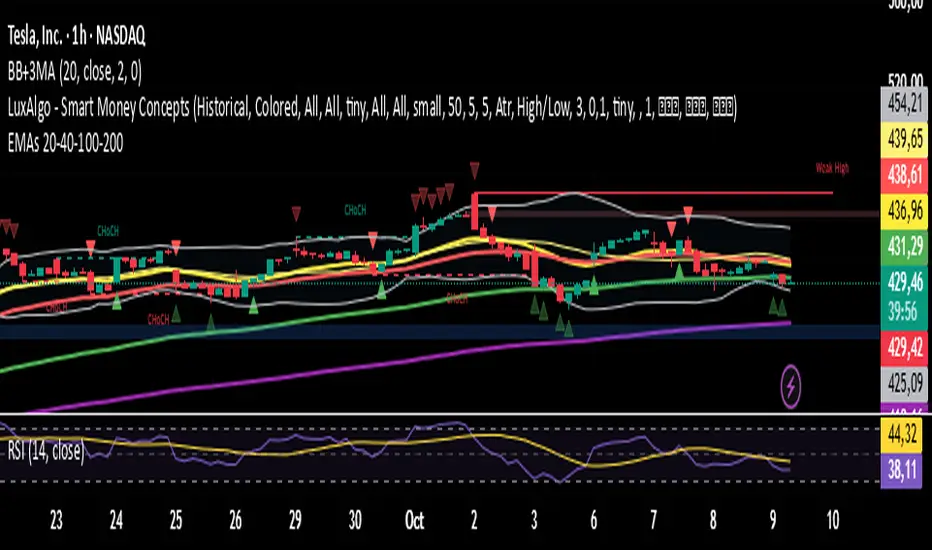
EMAs 20 - 40 - 100 - 200
This script contains the 20-40-100-200 EMAs.
EMA (Exponential)
Best for active or short-term trading because:
It adjusts more quickly to recent price changes.
It allows for earlier detection of trend reversals.
It is preferred by traders who trade calls and puts for a few days or weeks.
Example:
On 15-minute, 1-hour, or daily time frames, the 20-EMA or 40-EMA gives you early signals to open or close options.
It is good for momentum trades or quick breakouts.
Niveles Históricos + EMA 200 (zoom fijo) by flavexIndicador estrategia minimos y maximos diarios de 4 h. muestra ema 200 suavizada.

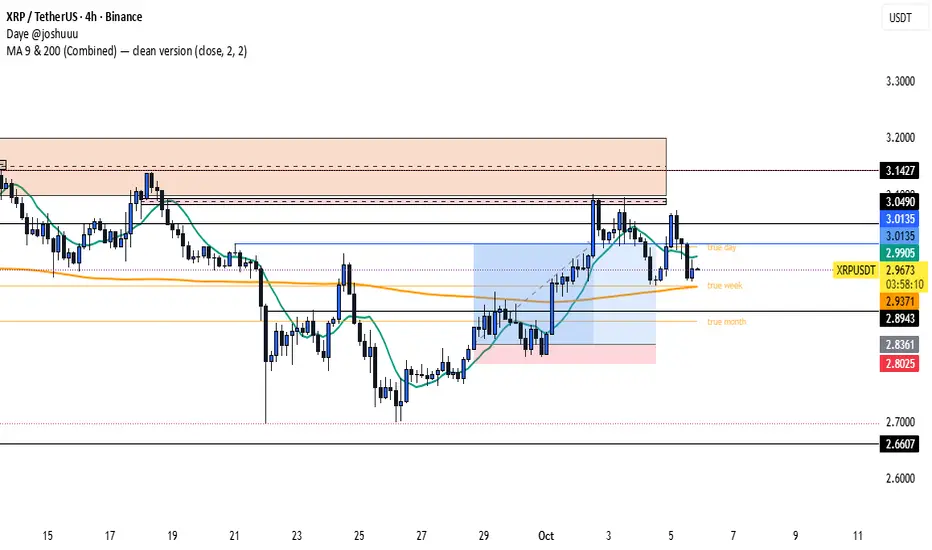
elipli5648 , MA 9 & 200 (Combined) — clean versionThis indicator displays two moving averages on the same chart — the 9-period and 200-period simple moving averages (SMA).
Both lines are customizable in color and line width directly from the settings menu.
Useful for identifying short-term vs long-term trend direction.
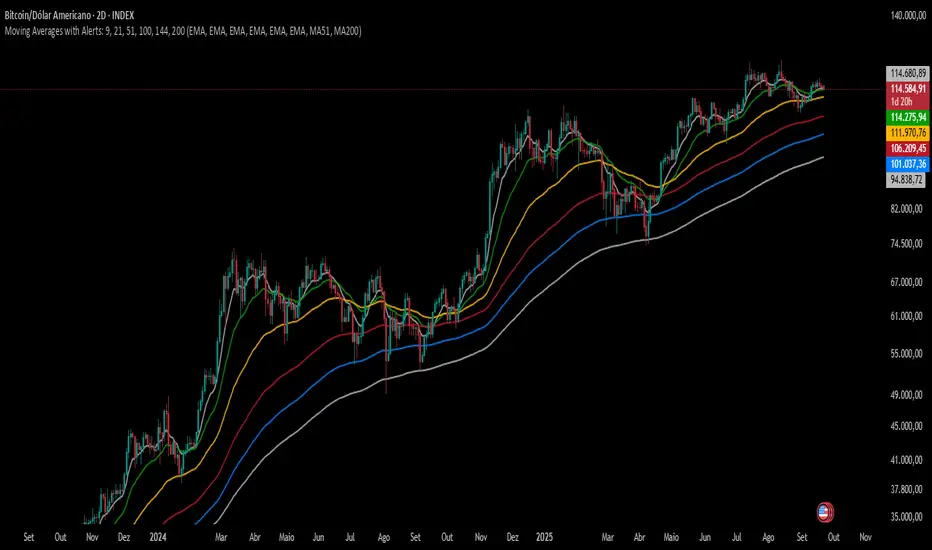
Moving Averages with Alerts: 9, 21, 51, 100, 144, 200---
This indicator plots six configurable moving averages (MA) with options for EMA, SMA, RCI, HMA, and Pivô Boss types. It highlights key crossover points, especially monitoring the 9-period MA for crosses with others. Users can enable alerts for these crossovers, as well as set custom alerts between any two selected MAs. Additionally, the indicator marks the important crossovers of the 51 and 200 MAs on the chart with an “X”. This helps traders identify trend changes and potential entry or exit points efficiently.
---
Alerta de toque de la 200-Week SMACuando el precio toca la MMS de 200 semanas es una posible compra.


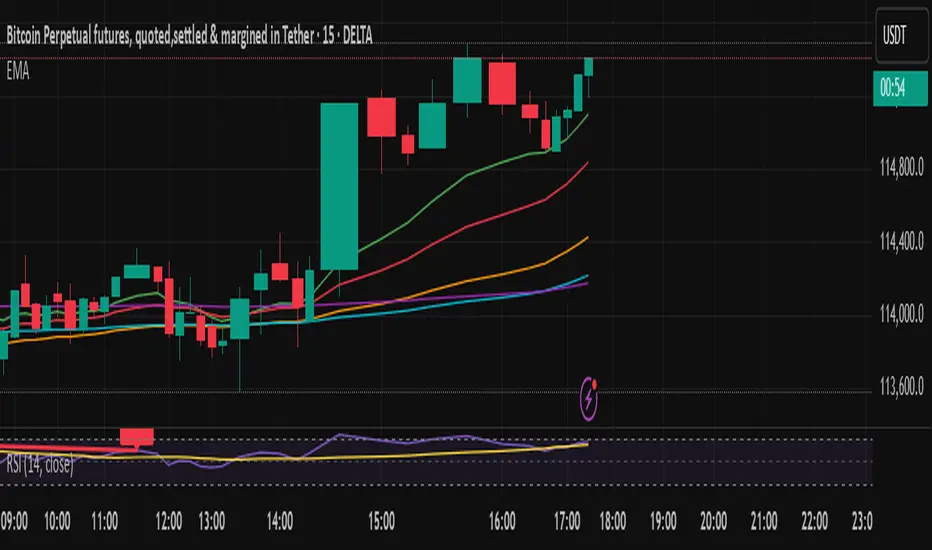
EMA 200 HIGH LOWS - BIRMANO - A Pine Script v6 indicator plotting a smoothed cloud between EMA 200 of high and close prices, with dynamic colors (green/soft red) based on price position. Includes RSI (14) in a subpanel for confluence, with an ATR filter to hide the cloud during high volatility.

Moving Averages 7 & 15 & 50 & 100 & 200 & 400we can use 7 moving averages for one indicator.
base moving averages are 7, 15, 50, 100, 200 and 400.
it can be used for determining of trend
Higher High Close 3 Days & Price ±5% 200 EMAScript by Raj Natarajan V 1
This script identifies stocks that are within +/- 5% of the 200 day EMA and within that sub-set, it identifies stocks that have had three consecutive days of higher highs.

EMA band 12/60/150/200EMA band consisting of 12/60/150/200
Specifically for Indian stock market, can be used for other trading scripts after testing.
Best use case : on Daily TF.
Bull run entry criteria, Not bear market or Bottom catching.

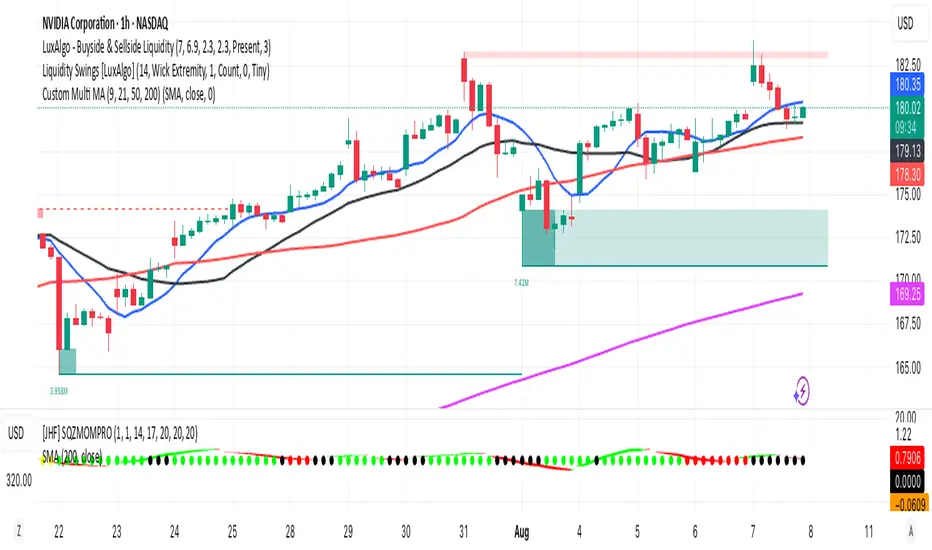
Multi MA (9, 21, 50, 200)This indicator plots four commonly used moving averages — 9, 21, 50, and 200 — with customizable smoothing methods and color-coded lines optimized for visibility on any chart background.
EMA 10/20/50/100/200plot 10, 20, 50,100,200 EMA on the chart. can be used to determine on any timeframe EMA