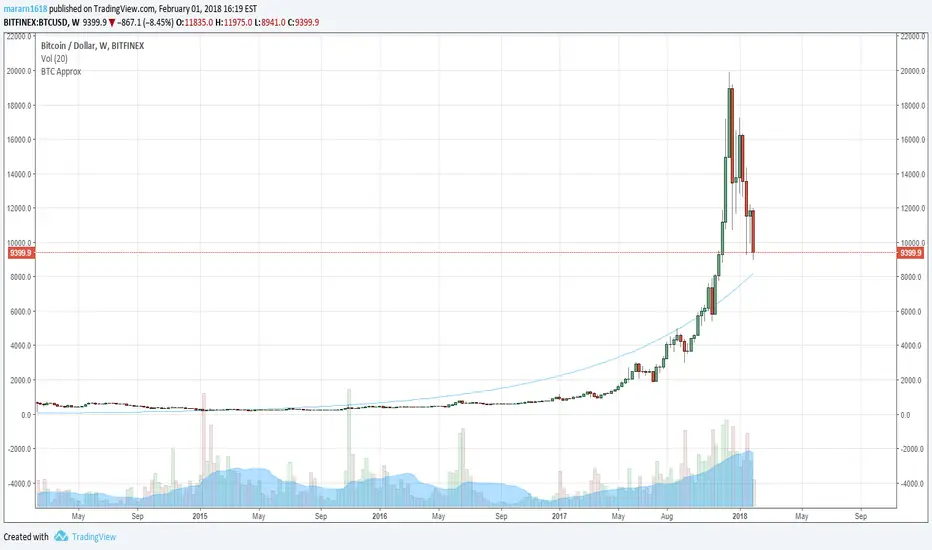
BTC Approximation (BETI) - Bitcoin Exponential Trend//based on
//https://www.wolframalpha.com/input/?i=e+%5E+(+0.00331836433279664++(+number+of+seconds+since+jul+17,+2010+12pm+UTC%2F86400%2Fseconds+)+-0.120774828196607+)
//https://bitcointalk.org/index.php?topic=470453.680
스크립트에서 "电脑桌面显示BTC"에 대해 찾기
BTC Price Spread - Coinbase & Futs - Premiums & DiscountsThis indicator takes the price of Bitcoin on Coinbase and the futures price on Mex, and compares it the average price of Bitcoin across other major exchanges.
This essentials give us a spread at which Bitcoin is going for.
In turn, this could be a possible tool to help determine market sentiment.
This indicator was created for experimental purposes.
Use at your own digression.

BTC Futures Settlement DatesShows the CBOE and CME settlement dates as horizontal lines, with the option to show a 7 day warning in the background. This should hopefully give ample warning.
I intend to update the script as new dates become available but please PM if I've forgotten.

BTC: CME Futures vs. Exchange SpreadsAs you can see, this script plots the current (10-min. delayed) CME Futures price versus Bitfinex, Bitstamp, and Coinbase prices.
It's displayed here on a 30 minute view because at the time of writing the futures have been alive for approximately one day. The script will likely be more useful on longer time frames as a macro-level indicator.
It's pretty simple to adapt this to additional exchanges


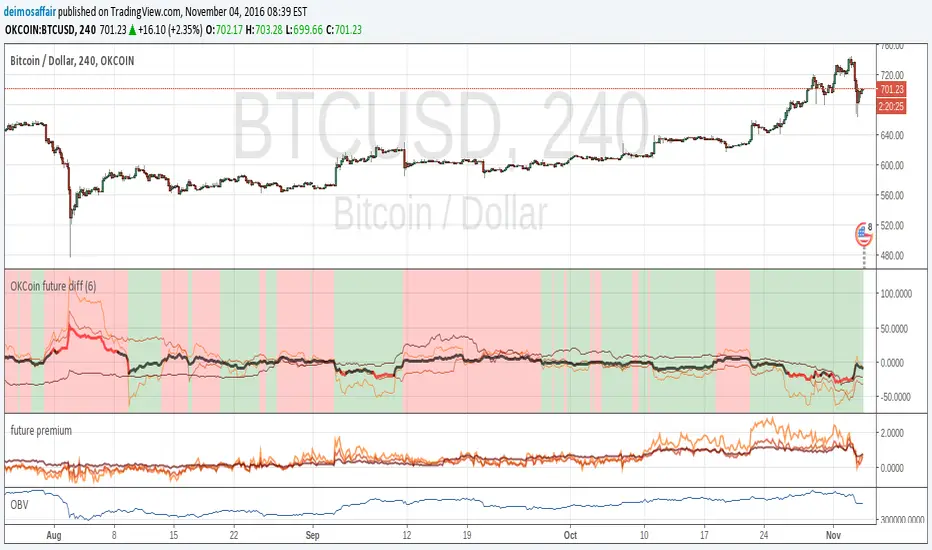
OKCoin future diffThis indicator checks the accuracy of okcoin futures against the current index. Example, check how the 1W future from 7 days ago matches the current spot value. The matches are on the 1W, 2W, 3M futures
The indicator bundles them together, makes a weighted average and shows it all.
the thin lines are the futures deltas for each of the futures(check the code to see the color of each).
the thick line is the compound indicator, the line is red when the value is too far off the spot price, black when it's <5%
background is green on "bullish", red for "bearish", take it as you want with many grains of salt :)
there is an input value (default = 1) to adjust time scales. the value is a multiplier for the number of periods in a day.
Example:
1D chart, input = 1
4h chart, input = 4h * 6 = 24h
using the incorrect adjustment for the wrong time scale, makes the indicator (even more) meaningless ;)
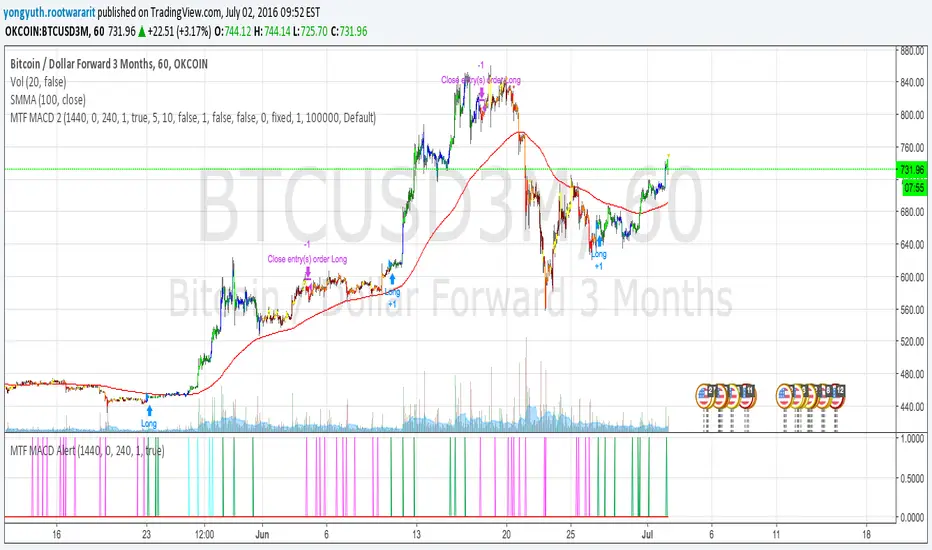
MTF MACD 2 By YuthavithiIf you want a good strategy without repaint. This one might be for you. Excellent profitable for BTCUSD3M for OKCoin.
It uses multiple time frame MACD for trading decision. To avoid repaint, set the delay period = 1 for both long term and midterm.
The idea is that, if long term, mid term and current time frame all agree on traidng direction, the trade will take place.
I also uses it in my automated trading bot with good result.
www.tradingview.com
(CRISIS) aggregateBTCvol v0.2.4Aggregate multiple exchange volumes into single indicator
This update adds:
*Moving Average
*Add/change/disable to up 6 securities without touching code.
*Monochrome mode for dark themes.

BTC Volume Index 1.1 beta [Dia]Indicator calculates total volume across multiple bitcoin exchanges. The influence of each exchange can be adjusted seperately.
0 fee exchanges default to 50%
0 fee futures default to 10%
Define custom lookback periods for price breakout detection.
Look for low-volume price reversals in those candles immediately following high volume peaks. The lower the volume and the greater the open/close price difference of that 2nd candle is compared to the previous one, the higher the likelihood of a local top/bottom being in.
Note:
Bar highlighting is still experimental, future versions will include better filtering options.
Use for confirmation only, not as standalone trading system.


CT Market Fragility & Systemic Risk Monitor v1.0CT ⊕ Market Fragility & Systemic Risk Monitor v1.0
Systemic Stress & Market Regime Monitor
OVERVIEW
Wall Street-grade structural monitoring now open-source.
CT ⊕ Market Fragility & Systemic Risk Monitor v1.0 is a real-time systemic risk tool designed to detect fragility before it hits price. Built by former institutional traders, it delivers structural insight typically reserved for desks inside hedge funds and global macro desks.
This isn’t about finding entries or exits, it’s about understanding the environment you're trading in, and recognizing when it's shifting.
WHAT IT DOES
• Monitors six key market domains: Equities, Rates/Credit, FX (USD stress), Commodities, Crypto, and Macro
• Detects volatility stress, cross-domain coupling, and regime synchronization
• Classifies market structure into Normal → Fragile → Critical
• Shows a live dashboard with scores, coupling levels, and structural state
• Plots event markers (T1, T2, T3) for structural transitions
• Implements hysteresis logic to model post-stress 'memory
• Supports both single-domain ("Local Mode") and system-wide monitoring
HOW IT WORKS
This engine does not rely on traditional TA. No moving averages. No MACD. No patterns. No guesswork.
Instead, it measures how markets are behaving beneath price detecting when stress is:
• Building internally
• Spreading across domains
• Synchronizing into systemic fragility
T1 (🟠) — Early instability: acceleration in market coupling
T2 (🔵) — Fragile regime: multiple domains simultaneously stressed
T3 (🔴) — Critical regime: synchronized, system-wide stress
These are not buy/sell signals. They are structural regime alerts, the same kind used by institutions to cut risk before stress cascades.
WHY IT MATTERS
Most retail tools are reactive. They interpret surface-level patterns after the move.
This tool is different. It’s proactive – measuring pressure before it breaks structure.
Institutions have used structural fragility models like this for years. This script helps close that gap, giving everyday traders the same early warnings that pros use to reduce exposure and sidestep systemic blowups.
It’s not about finding the edge.
It’s about not getting crushed when the system breaks.
Whether you trade crypto, stocks, FX, or macro, this engine helps answer:
• Is the system stable right now?
• Are stress levels rising across markets?
• Is it time to tighten risk?
Institutions don’t wait for breakouts. They monitor structure.
Now, you can too.
KEY FEATURES
• Works on any asset class and any timeframe
• Fully customizable domain selection
• Three-tier structural alert system (T1–T3)
• Real-time dashboard: stress scores, states, and coupling levels
• Hysteresis modeling: post-stress “memory” detection
• Supports single-domain (local) or multi-domain (systemic) monitoring
• PineScript alerts built-in
RECOMMENDED USE
Active traders - all asset classes
Use the dashboard and T1–T3 alerts to stay aware of structural risk in real time.
Track multi-timeframe alignment to detect where risk originates and how it spreads across markets.
Crypto trader s
Monitor upstream domains (Equities, FX, Rates, Macro) to detect pressure before it reaches crypto.
Identify reflexive stress before Bitcoin reacts — and stay ahead of contagion events.
Macro & systematic traders
Use T1–T3 transitions as volatility filters, exposure governors, or dynamic risk overlays.
Build regime-aware models that adapt to shifting systemic conditions.
Examples & Visuals
Question: Would it have helped to know that at 9:30 on October 9th and again at 10:00 on October 10th that critical states were detected in the structural behavior of Bitcoin? Take a look:
30 min chart BTC shows two distinct T3 (critical) regime detections October 9th and 10:30 October 10th
5m BTC chart reveals high frequency instability for the same period, identifying instability, fragility, criticality
The 30minute BTC chart at 16:30 Friday October 10th,, a few hours after first detecting critical systemic risk
RISK DISCLAIMER
This is a structural analysis tool, not a predictive signal. It does not provide financial advice, trade entries, or forecasts. Use at your own risk. Full disclaimer embedded in the script.
Complexity Trading - From Wall St to Main St
No patterns. No repainting. No mysticism. Just logic, math, science and market structure - now made accessible to everyone.
Developer of LPPL Critical Pulse (LPPLCP), the Temporal Phase Model (TPM) and other
other advanced structural and attractor based systems inspired by Sornette’s LPPL framework and other differentiated thinkers.
Note on Methodology
This tool is not predictive, and not designed for academic publication.
It is a real-time structural monitoring system inspired by academically established concepts,
including LPPL attractor dynamics, cross-asset coupling, reflexivity, and phase regime transitions, implemented within the real-time constraints of PineScript, and intended for visual, exploratory, and diagnostic use.

USD Liquidity Regime IndexTrack global risk regimes with this USD Liquidity Composite —
It aims to be a daily macro indicator blending normalised DXY (50%), UUP (20%), 10Y Treasury yields (20%), and VIX (10%).
How to read:
When the blue index is above its red SMA: Strong USD, tightening liquidity → Risk-Off mode (often bearish for Nasdaq, BTC, and risk assets).
When the line is below: Weak USD, abundant liquidity → Risk-On (bullish environment).
Example: In 2022's bear market, the index stayed high above SMA most of the year, signalling persistent Risk-Off as USD surged.
Features on-chart table, regime background colors, and crossover alerts.
Great contextual tool for macro traders IMO.
Educational only — not financial advice.
Use at your own risk.
By @frank_vergaram

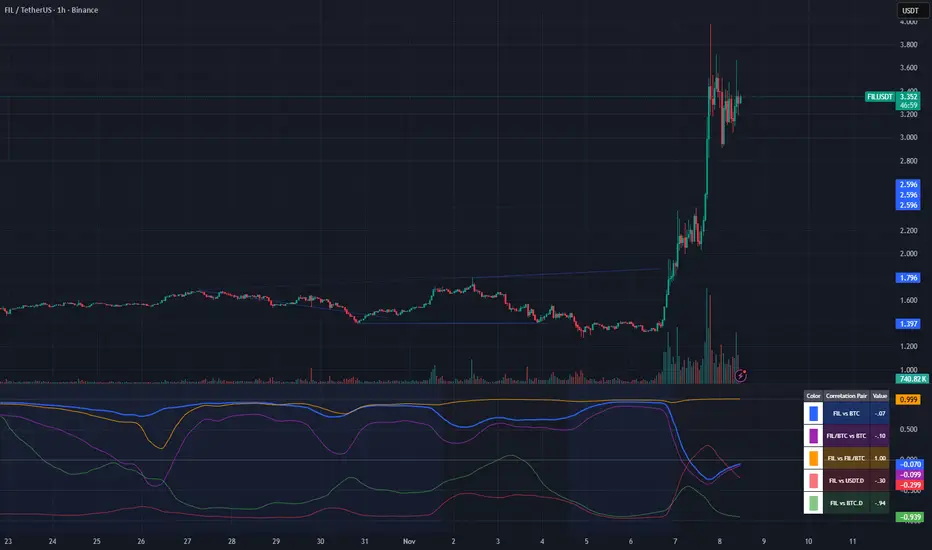
Crypto Correlation Oscillator# Crypto Correlation Oscillator
**Companion indicator for Tri-Align Crypto Trend**
## Overview
The Crypto Correlation Oscillator helps you identify **alpha opportunities** and **market regime changes** by showing how closely your coin follows Bitcoin and other assets over time. It displays rolling correlations as an oscillator in a separate pane below your price chart.
## What It Does
This indicator calculates **Pearson correlations** between different trading pairs on a rolling window (default: 100 bars). Correlations range from **-1.0** (perfect inverse relationship) to **+1.0** (perfect positive relationship), with **0** meaning no correlation.
### The 5 Correlation Lines
1. **Blue (thick line) - Coin vs BTC**: The most important metric
- **High correlation (>0.7)**: Your coin is just following BTC - no independent movement
- **Low correlation (<0.3)**: Your coin has **alpha** - it's moving independently from BTC
- **Negative correlation**: Your coin moves opposite to BTC (rare but powerful)
2. **Purple - Coin/BTC vs BTC**: Inverse relationship check
- **Negative values**: When BTC rises, your coin weakens relative to BTC
- **Positive values**: When BTC rises, your coin strengthens against BTC
3. **Orange - Coin vs Coin/BTC**: Structural consistency check
- Shows how well the Coin/USDT and Coin/BTC pairs maintain their mathematical relationship
- Unusual values can indicate liquidity issues or market inefficiencies
4. **Light Red - Coin vs USDT.D** (optional): Stablecoin dominance correlation
- Shows how your coin correlates with USDT dominance
- Useful for understanding flight-to-safety dynamics
5. **Light Green - Coin vs BTC.D** (optional): Bitcoin dominance correlation
- Shows how your coin correlates with BTC dominance
- Helps identify altcoin season vs BTC dominance cycles
## How to Read It
### Finding Alpha Opportunities
- **Low blue line (<0.3)**: Your coin is decoupled from BTC → potential alpha
- **Blue line dropping**: Coin is gaining independence from BTC
- **Blue line spiking to >0.9**: Coin is a "BTC clone" with no independent movement
### Regime Change Detection
- **Blue line crossing 0.5**: Major shift in correlation behavior
- **Purple line turning negative**: Coin starting to weaken when BTC rises (warning sign)
- **Sharp correlation changes**: Market structure is shifting - adjust strategy
### Visual Zones
- **Blue background**: High correlation zone (>0.7) - coin just following BTC
- **Red background**: Inverse correlation zone (<-0.5) - coin moving opposite to BTC
### Reference Lines
- **+1.0 / -1.0**: Perfect correlation boundaries (dotted gray)
- **+0.5 / -0.5**: Moderate correlation thresholds (dotted gray)
- **0.0**: Zero correlation line (solid gray)
## Dynamic Legend
The legend table (top-right) automatically shows the actual symbol names based on your chart:
- **Example on SOLUSDT**: Shows "SOL vs BTC", "SOL/BTC vs BTC", "SOL vs SOL/BTC", etc.
- **Color boxes**: Match the plot colors for easy identification
- **Live values**: Current correlation numbers update in real-time
- **Tooltips**: Hover over labels for interpretation guidance
## Configuration
### Key Inputs
- **Correlation Lookback** (default: 100): Number of bars for rolling correlation window
- Shorter = more reactive, noisier
- Longer = smoother, slower to detect changes
- **Correlation Smoothing** (default: 5): EMA smoothing period for raw correlations
- Reduces noise while preserving trends
- **Symbol Detection**: Auto-detects symbols from your chart, or use manual overrides
- **Dominance Pairs**: Toggle USDT.D and BTC.D correlations on/off
## Usage Tips
1. **Combine with main Tri-Align indicator**: Use correlation for context, Tri-Align for entry/exit signals
2. **Watch for divergences**: Correlation changing while price moves in sync can signal upcoming shift
3. **Adjust lookback period**: Use shorter (50-70) for day trading, longer (150-200) for position trading
4. **Focus on the blue line**: It's your primary alpha indicator
## Technical Details
- **Calculation**: Pearson correlation coefficient with EMA smoothing
- **Data source**: Close prices from `request.security()` (multi-timeframe capable)
- **Update frequency**: Every bar on your selected timeframe
- **Overlay**: False (displays in separate pane)
## Quick Interpretation Guide
| Blue Line Value | Interpretation | Action |
|----------------|----------------|--------|
| > 0.9 | Coin is a BTC clone | Avoid - no alpha opportunity |
| 0.7 - 0.9 | High correlation | Standard altcoin behavior |
| 0.3 - 0.7 | Moderate correlation | Some independence emerging |
| < 0.3 | Low correlation | **Strong alpha opportunity** |
| < 0 | Inverse correlation | Rare - potential hedge asset |
| Purple Line | Interpretation |
|-------------|----------------|
| Strongly negative | Coin weakens when BTC rises - risky |
| Near zero | Coin/BTC pair moves independently of BTC |
| Positive | Coin strengthens with BTC - ideal |
## Version History
### v1.0 (Initial Release)
- Pearson correlation calculation with configurable lookback
- 5 correlation pairs: Coin vs BTC, Coin/BTC vs BTC, Coin vs Coin/BTC, USDT.D, BTC.D
- EMA smoothing to reduce noise
- Visual zones for high/inverse correlation
- Dynamic legend with symbol name extraction
- Auto-symbol detection matching main Tri-Align indicator
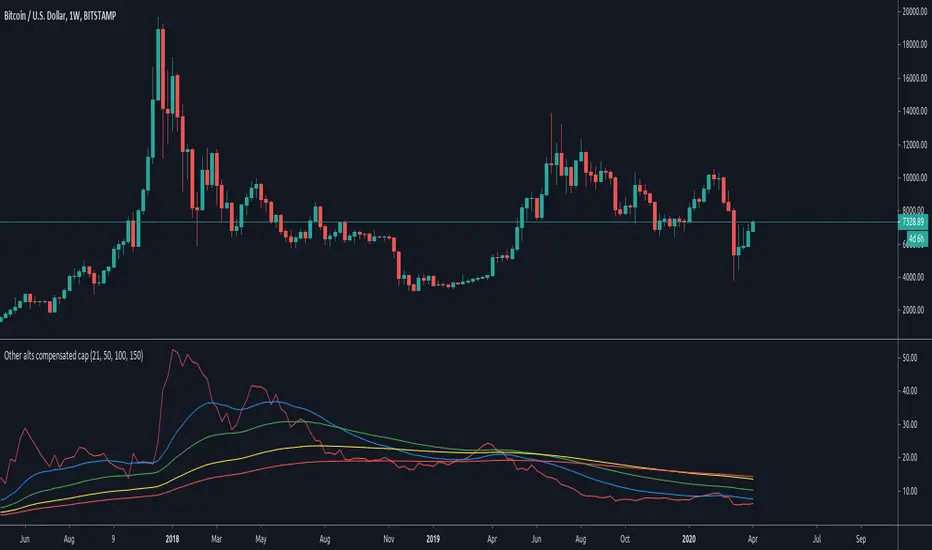
Other alts compensated capitalization [Peregringlk]DISCLAIMER: I'm not a native English speaker, so let me know please about mistakes in my wording.
Introduction
==========
This indicator (the middle one in the image) shows how the "others altcoins" (all altcoins except coins with high capitalization) are adding own value to its capitalization by removing BTC price changes. By "own value" I mean USD value gaining by actual buys in BTC markets beyong arbitrage effects of BTC price changes.
The main idea is that, if bitcoin has increased is value by 20%, and the other altcoins has increased its capitalization by 30%, the chart will only plot an increased of 10%. In other words, it will show its increased capitalization measured in BTC (the combined altcoin/BTC market is uptrending). Its purpose is to try to identify altseasons. A bit more concisely, the graph will only grow when both USD and BTC capitalization are growing. If any of them are going down, the graph will go down as well.
Rationale
========
- Altseasons are characterized by an incresed in BTC value of almost every altcoin during some period of time, although not all at once, but distributed over the altseason. For example, in the crazy altseason of Dec17/Jan18, almost every (low capitalized) altcoin increased its BTC value by a minimum of +300%, some at the beginning of the season, some at the end.
- When this happens, BTC loss capitalization dominance, but this also can happen if BTC is downtrending while altcoins are being bought in BTC markets but its USD value doesn't change too much. This happens when altcoins are uptrending in BTC price, but there are actually no gain of USD value because the BTC gain in value is not enough to compensate the BTC fall in price. Since BTC is losing USD price, but altcoins are not, dominance falls. So, looking at BTC dominance is not enough to spot possible beginnings of altseasons, because of arbitrage of other effects.
- The "big altcoins" are removed from the counting because one single big capitalized altcoin that grows, let's say, a 20%, will have an observable effect on the total altcoin capitalization, even if the rest of the altcoins are stagnated in price. For example, at today's date (8th April 2020), Ethereum by itself has the 23.89% of the total altcoins capitalization. A +10% in Ethereum price will increase the total altcoin capitalization by a +2.38%. I wanted to remove that effect to focus on generalized price changes of all altcoins. Remember that there are only 9 big altcoins 9 coins representing the 71% of the alts capitalization, while there are exists more than 5000 altcoins in total.
- Another key factor is that I want to focus on what happens in alt/BTC markets, because almost every altcoin can be traded against BTC, and most of them can only be traded against BTC. However, big altcoins can usually be traded against USD or other alt coins or fiat currencies as well. Removing the big alts from the equation helps (just a bit) to simplify the interpretation of the chart because arbitrage effects of those "impactfull" alts are limited (although not removed, because arbitrage also happens cross-markets).
- There are situations where BTC price is going up, alts USD capitalization is going up as well, but alts BTC capitalization is going down because altcoins are being sold in BTC markets, it just happens that the speed of the selling is not high enough as to compensated the increased in BTC price. That makes the USD capitalization grows, while alts are really being dumped in BTC markets. I wanted to reflect that effect as well by making sure that the graph is growing only when both USD and BTC capitalization of alts are growing.
Interpretation
============
If you want, you can see this chart as if plotting the Other alts capitalization as if priced against a fictional coin FCOIN, that start by having a price of 1, that combines the up and downs of both BTC price and alts USD capitalization in a very conservative way: if FCOIN price goes up, means that the other alts are gained USD value but only when they have overcome BTC price changes. Otherwise, it goes down.
If this fictional FCOIN has went up during some days straight with a total gain of maybe, greater than 10%, we are maybe in front of the start of an altseason. Sometimes, maybe (it requires some more years to extract a theory out of here), it can be used as proxy of the BTC near future (trend changes or continuations): if this FCOIN goes up, while BTC is doing nothing relevant or even is going down, it could signal that "people" is getting prepared and a generalized altcoin accumulation process has started, because of a combined people's assumption that BTC will start to have an stable uptrend, or will continue the current trend soon. There's some matches in the past about that, but there are also false positives, as usual.
Additionally, four customizable EMAs are added to the script, by default 21, 50, 100 and 150.
Definitions
=========
- Let's call `altcap_btc` the altcoin capitalization in USD, divided by BTC price. In other words, `altcap_btc` is the capitalization in terms of BTC.
- Let's call `x` the BTC price change rate as `btc_price_current_candle / btc_price_previous_candle`. So, if BTC has grown a +20%, `x = 1.20`, and if BTC has gone down a -20%, `x = 0.80`.
- Let's call `y` the `altcap_btc` price change rate, calculated as before but for `altcap_btc`.
- For pure math equivalence, `x * y` is thus the USD capitalization change rate.
Calculation
=========
For plotting the graph, for each candle, I choose a change rate, and then I plot the total accumulated change rate as by `ch0 * ch1 * ch2 * .... * ch_today`, where each `chX` is the choosen change rate of each candle since the beginning of the chart. So, if the "alts compensated value" has grown yesterday +20% and today's -10%, `1.20 * 0.9 = 1.08`, which means that in two days the compensated value has grown an 8% in total.
- If `x * y > 1` (USD cap is growing), I take `y` as change rate (alt/btc change rate).
- If both `x` and `y` are `> 1`, then the graph grows because I'm taking `y`.
- If `x > 1` and `y < 1`, the graph goes down because I'm taking `y`, reflecting the BTC markets are dumping.
- If `x < 1` and `y > 1`, the graph goes up because I'm taking `y`, reflecting the BTC markets are pumping so much that it overcomes the btc fall.
- `x < 1` and `y < 1` is impossible here because `x * y` must be `> 1` by precondition.
- If `x * y < 1` (USD cap is going down), I take `y` or `x * y` depending on the individual change rates:
- If `x` and `y` go in different directions (one up and the other down), I take `x * y` to reflect that USD capitalization has gone down. I don't take `y` here because it could be `> 1`, and I don't want to make the graph grow if alts are lossing USD value. Also, if `y < 1` and I take `y` the graph will go down faster than USD capitalization and I want to show that "alts compensated value is gown down slower than BTC because some boughts are happening". I don't take `x` either here for the same reasons.
- If both `x` and `y` are `< 1`, I take `y`, because otherwise the graph would be less than 0.000001 today after two years of bleeding, making literally impossible to see if alts "grow tomorrow".
- `x > 1` and `y > 1` is impossible here because `x * y` must be `< 1` by precondition.
Spot Symbols for CryptoLibrary "CryptoSpotSymbols"
This Library has one purpose only. It generate Symbols for the Crypto Spot Market, like all the currencies pairs of most Crypto Exchanges available to TradingView.
Have a look at .find() , which is an all in one function.
Binance(basecurrency)
Generate 27 Symbols for the Spot Market of Binance.
Parameters:
basecurrency (simple string) : Its the Basecurrency to generate the Symbols with. Optional. Default value is `syminfo.basecurrency`.
Returns:
BinanceUS(basecurrency)
Generate seven Symbols for the Spot Market of BinanceUS.
Parameters:
basecurrency (simple string) : Its the Basecurrency to generate the Symbols with. Optional. Default value is `syminfo.basecurrency`.
Returns:
Bitfinex(basecurrency)
Generate 12 Symbols for the Spot Market of Bitfinex.
Parameters:
basecurrency (simple string) : Its the Basecurrency to generate the Symbols with. Optional. Default value is `syminfo.basecurrency`.
Returns:
bitFlyer(basecurrency)
Generate three Symbols for the Spot Market of bitFlyer.
Parameters:
basecurrency (simple string) : Its the Basecurrency to generate the Symbols with. Optional. Default value is `syminfo.basecurrency`.
Returns:
Bitget(basecurrency)
Generate seven Symbols for the Spot Market of Bitget.
Parameters:
basecurrency (simple string) : Its the Basecurrency to generate the Symbols with. Optional. Default value is `syminfo.basecurrency`.
Returns:
Bithumb(basecurrency)
Generate two Symbols for the Spot Market of Bithumb.
Parameters:
basecurrency (simple string) : Its the Basecurrency to generate the Symbols with. Optional. Default value is `syminfo.basecurrency`.
Returns:
bitkub(basecurrency)
Generate one Symbol for the Spot Market of bitkub.
Parameters:
basecurrency (simple string) : Its the Basecurrency to generate the Symbols with. Optional. Default value is `syminfo.basecurrency`.
Returns: THB
BitMEX(basecurrency)
Generate two Symbols for the Spot Market of BitMEX.
Parameters:
basecurrency (simple string) : Its the Basecurrency to generate the Symbols with. Optional. Default value is `syminfo.basecurrency`.
Returns:
bitpanda_pro(basecurrency)
Generate six Symbols for the Spot Market of bitpanda pro.
Parameters:
basecurrency (simple string) : Its the Basecurrency to generate the Symbols with. Optional. Default value is `syminfo.basecurrency`.
Returns:
bitrue(basecurrency)
Generate nine Symbols for the Spot Market of bitrue.
Parameters:
basecurrency (simple string) : Its the Basecurrency to generate the Symbols with. Optional. Default value is `syminfo.basecurrency`.
Returns:
Bitstamp(basecurrency)
Generate eight Symbols for the Spot Market of Bitstamp.
Parameters:
basecurrency (simple string) : Its the Basecurrency to generate the Symbols with. Optional. Default value is `syminfo.basecurrency`.
Returns:
BITTREX(basecurrency)
Generate six Symbols for the Spot Market of BITTREX.
Parameters:
basecurrency (simple string) : Its the Basecurrency to generate the Symbols with. Optional. Default value is `syminfo.basecurrency`.
Returns:
BTSE(basecurrency)
Generate 15 Symbols for the Spot Market of BTSE.
Parameters:
basecurrency (simple string) : Its the Basecurrency to generate the Symbols with. Optional. Default value is `syminfo.basecurrency`.
Returns:
BYBIT(basecurrency)
Generate five Symbols for the Spot Market of BYBIT.
Parameters:
basecurrency (simple string) : Its the Basecurrency to generate the Symbols with. Optional. Default value is `syminfo.basecurrency`.
Returns:
CapitalCom(basecurrency)
Generate five Symbols for the Spot Market of capital.com.
Parameters:
basecurrency (simple string) : Its the Basecurrency to generate the Symbols with. Optional. Default value is `syminfo.basecurrency`.
Returns:
coinbase(basecurrency)
Generate seven Symbols for the Spot Market of coinbase.
Parameters:
basecurrency (simple string) : Its the Basecurrency to generate the Symbols with. Optional. Default value is `syminfo.basecurrency`.
Returns:
CoinEx(basecurrency)
Generate three Symbols for the Spot Market of CoinEx.
Parameters:
basecurrency (simple string) : Its the Basecurrency to generate the Symbols with. Optional. Default value is `syminfo.basecurrency`.
Returns:
CurrencyCom(basecurrency)
Generate 30 Symbols for the Spot Market of currency.com.
Parameters:
basecurrency (simple string) : Its the Basecurrency to generate the Symbols with. Optional. Default value is `syminfo.basecurrency`.
Returns:
Delta(basecurrency)
Generate one Symbol for the Spot Market of Delta.
Parameters:
basecurrency (simple string) : Its the Basecurrency to generate the Symbols with. Optional. Default value is `syminfo.basecurrency`.
Returns: USDT
Deribit(basecurrency)
Generate two Symbols for the Spot Market of Deribit.
Parameters:
basecurrency (simple string) : Its the Basecurrency to generate the Symbols with. Optional. Default value is `syminfo.basecurrency`.
Returns:
easyMarkets(basecurrency)
Generate one Symbol for the Spot Market of easyMarkets.
Parameters:
basecurrency (simple string) : Its the Basecurrency to generate the Symbols with. Optional. Default value is `syminfo.basecurrency`.
Returns: USD
Eightcap(basecurrency)
Generate one Symbol for the Spot Market of Eightcap.
Parameters:
basecurrency (simple string) : Its the Basecurrency to generate the Symbols with. Optional. Default value is `syminfo.basecurrency`.
Returns: USD
ExMo(basecurrency)
Generate ten Symbols for the Spot Market of ExMo.
Parameters:
basecurrency (simple string) : Its the Basecurrency to generate the Symbols with. Optional. Default value is `syminfo.basecurrency`.
Returns:
FOREXcom(basecurrency)
Generate four Symbols for the Spot Market of FOREX.com.
Parameters:
basecurrency (simple string) : Its the Basecurrency to generate the Symbols with. Optional. Default value is `syminfo.basecurrency`.
Returns:
FXCM(basecurrency)
Generate three Symbols for the Spot Market of FXCM.
Parameters:
basecurrency (simple string) : Its the Basecurrency to generate the Symbols with. Optional. Default value is `syminfo.basecurrency`.
Returns:
GateIO(basecurrency)
Generate five Symbols for the Spot Market of Gate.io.
Parameters:
basecurrency (simple string) : Its the Basecurrency to generate the Symbols with. Optional. Default value is `syminfo.basecurrency`.
Returns:
Gemini(basecurrency)
Generate ten Symbols for the Spot Market of Gemini.
Parameters:
basecurrency (simple string) : Its the Basecurrency to generate the Symbols with. Optional. Default value is `syminfo.basecurrency`.
Returns:
Kraken(basecurrency)
Generate 14 Symbols for the Spot Market of Kraken.
Parameters:
basecurrency (simple string) : Its the Basecurrency to generate the Symbols with. Optional. Default value is `syminfo.basecurrency`.
Returns:
KuCoin(basecurrency)
Generate 13 Symbols for the Spot Market of KuCoin.
Parameters:
basecurrency (simple string) : Its the Basecurrency to generate the Symbols with. Optional. Default value is `syminfo.basecurrency`.
Returns:
MEXC(basecurrency)
Generate six Symbols for the Spot Market of MEXC.
Parameters:
basecurrency (simple string) : Its the Basecurrency to generate the Symbols with. Optional. Default value is `syminfo.basecurrency`.
Returns:
OANDA(basecurrency)
Generate one Symbol for the Spot Market of OANDA.
Parameters:
basecurrency (simple string) : Its the Basecurrency to generate the Symbols with. Optional. Default value is `syminfo.basecurrency`.
Returns: USD
OKX(basecurrency)
Generate six Symbols for the Spot Market of OKX.
Parameters:
basecurrency (simple string) : Its the Basecurrency to generate the Symbols with. Optional. Default value is `syminfo.basecurrency`.
Returns:
Pepperstone(basecurrency)
Generate one Symbol for the Spot Market of Pepperstone.
Parameters:
basecurrency (simple string) : Its the Basecurrency to generate the Symbols with. Optional. Default value is `syminfo.basecurrency`.
Returns: USD
phemex(basecurrency)
Generate four Symbols for the Spot Market of phemex.
Parameters:
basecurrency (simple string) : Its the Basecurrency to generate the Symbols with. Optional. Default value is `syminfo.basecurrency`.
Returns:
POLONIEX(basecurrency)
Generate nine Symbols for the Spot Market of POLONIEX.
Parameters:
basecurrency (simple string) : Its the Basecurrency to generate the Symbols with. Optional. Default value is `syminfo.basecurrency`.
Returns:
Pyth(basecurrency)
Generate three Symbols for the Spot Market of Pyth.
Parameters:
basecurrency (simple string) : Its the Basecurrency to generate the Symbols with. Optional. Default value is `syminfo.basecurrency`.
Returns:
Skilling(basecurrency)
Generate four Symbols for the Spot Market of Skilling.
Parameters:
basecurrency (simple string) : Its the Basecurrency to generate the Symbols with. Optional. Default value is `syminfo.basecurrency`.
Returns:
TimeX(basecurrency)
Generate six Symbols for the Spot Market of TimeX.
Parameters:
basecurrency (simple string) : Its the Basecurrency to generate the Symbols with. Optional. Default value is `syminfo.basecurrency`.
Returns:
TradeStation(basecurrency)
Generate four Symbols for the Spot Market of TradeStation.
Parameters:
basecurrency (simple string) : Its the Basecurrency to generate the Symbols with. Optional. Default value is `syminfo.basecurrency`.
Returns:
UpBit(basecurrency)
Generate four Symbols for the Spot Market of UpBit.
Parameters:
basecurrency (simple string) : Its the Basecurrency to generate the Symbols with. Optional. Default value is `syminfo.basecurrency`.
Returns:
whitebit(basecurrency)
Generate 13 Symbols for the Spot Market of whitebit.
Parameters:
basecurrency (simple string) : Its the Basecurrency to generate the Symbols with. Optional. Default value is `syminfo.basecurrency`.
Returns:
WOOX(basecurrency)
Generate two Symbols for the Spot Market of WOO.
Parameters:
basecurrency (simple string) : Its the Basecurrency to generate the Symbols with. Optional. Default value is `syminfo.basecurrency`.
Returns:
find(exchange, basecurrency)
Generate up to 30 Symbols for the Spot Market, depending on the market picked.
Parameters:
exchange (simple string) : The name of an Exchange. Case insensitivity. Optional. Default value is `syminfo.prefix`. If something else is put in here it will return `na` values.
basecurrency (simple string) : The Basecurrency to generate the Symbols with. Optional. Default value is `syminfo.basecurrency`
Returns: 30x string as tuple

ALT Risk Metric StrategyHere's a professional write-up for your ALT Risk Strategy script:
ALT/BTC Risk Strategy - Multi-Crypto DCA with Bitcoin Correlation Analysis
Overview
This strategy uses Bitcoin correlation as a risk indicator to time entries and exits for altcoins. By analyzing how your chosen altcoin performs relative to Bitcoin, the strategy identifies optimal accumulation periods (when alt/BTC is oversold) and profit-taking opportunities (when alt/BTC is overbought). Perfect for traders who want to outperform Bitcoin by strategically timing altcoin positions.
Key Innovation: Why Alt/BTC Matters
Most traders focus solely on USD price, but Alt/BTC ratios reveal true altcoin strength:
When Alt/BTC is low → Altcoin is undervalued relative to Bitcoin (buy opportunity)
When Alt/BTC is high → Altcoin has outperformed Bitcoin (take profits)
This approach captures the rotation between BTC and alts that drives crypto cycles
Key Features
📊 Advanced Technical Analysis
RSI (60% weight): Primary momentum indicator on weekly timeframe
Long-term MA Deviation (35% weight): Measures distance from 150-period baseline
MACD (5% weight): Minor confirmation signal
EMA Smoothing: Filters noise while maintaining responsiveness
All calculations performed on Alt/BTC pairs for superior market timing
💰 3-Tier DCA System
Level 1 (Risk ≤ 70): Conservative entry, base allocation
Level 2 (Risk ≤ 50): Increased allocation, strong opportunity
Level 3 (Risk ≤ 30): Maximum allocation, extreme undervaluation
Continuous buying: Executes every bar while below threshold for true DCA behavior
Cumulative sizing: L3 triggers = L1 + L2 + L3 amounts combined
📈 Smart Profit Management
Sequential selling: Must complete L1 before L2, L2 before L3
Percentage-based exits: Sell portions of position, not fixed amounts
Auto-reset on re-entry: New buy signals reset sell progression
Prevents premature full exits during volatile conditions
🤖 3Commas Automation
Pre-configured JSON webhooks for Custom Signal Bots
Multi-exchange support: Binance, Coinbase, Kraken, Bitfinex, Bybit
Flexible quote currency: USD, USDT, or BUSD
Dynamic order sizing: Automatically adjusts to your tier thresholds
Full webhook documentation compliance
🎨 Multi-Asset Support
Pre-configured for popular altcoins:
ETH (Ethereum)
SOL (Solana)
ADA (Cardano)
LINK (Chainlink)
UNI (Uniswap)
XRP (Ripple)
DOGE
RENDER
Custom option for any other crypto
How It Works
Risk Metric Calculation (0-100 scale):
Fetches weekly Alt/BTC price data for stability
Calculates RSI, MACD, and deviation from 150-period MA
Normalizes MACD to 0-100 range using 500-bar lookback
Combines weighted components: (MACD × 0.05) + (RSI × 0.60) + (Deviation × 0.35)
Applies 5-period EMA smoothing for cleaner signals
Color-Coded Risk Zones:
Green (0-30): Extreme buying opportunity - Alt heavily oversold vs BTC
Lime/Yellow (30-70): Accumulation range - favorable risk/reward
Orange (70-85): Caution zone - consider taking initial profits
Red/Maroon (85-100+): Euphoria zone - aggressive profit-taking
Entry Logic:
Buys execute every candle when risk is below threshold
As risk decreases, position sizing automatically scales up
Example: If risk drops from 60→25, you'll be buying at L1 rate until it hits 50, then L2 rate, then L3 rate
Exit Logic:
Sells only trigger when in profit AND risk exceeds thresholds
Sequential execution ensures partial profit-taking
If new buy signal occurs before all sells complete, sell levels reset to L1
Configuration Guide
Choosing Your Altcoin:
Select crypto from dropdown (or use CUSTOM for unlisted coins)
Pick your exchange
Choose quote currency (USD, USDT, BUSD)
Risk Metric Tuning:
Long Term MA (default 150): Higher = more extreme signals, Lower = more frequent
RSI Length (default 10): Lower = more volatile, Higher = smoother
Smoothing (default 5): Increase for less noise, decrease for faster reaction
Buy Settings (Aggressive DCA Example):
L1 Threshold: 70 | Amount: $5
L2 Threshold: 50 | Amount: $6
L3 Threshold: 30 | Amount: $7
Total L3 buy = $18 per candle when deeply oversold
Sell Settings (Balanced Exit Example):
L1: 70 threshold, 25% position
L2: 85 threshold, 35% position
L3: 100 threshold, 40% position (final exit)
3Commas Setup
Bot Configuration:
Create Custom Signal Bot in 3Commas
Set trading pair to your altcoin/USD (e.g., ETH/USD, SOL/USDT)
Order size: Select "Send in webhook, quote" to use strategy's dollar amounts
Copy Bot UUID and Secret Token
Script Configuration:
Paste credentials into 3Commas section inputs
Check "Enable 3Commas Alerts"
Save and apply to chart
TradingView Alert:
Create Alert → Condition: "alert() function calls only"
Webhook URL: api.3commas.io
Enable "Webhook URL" checkbox
Expiration: Open-ended
Strategy Advantages
✅ Outperform Bitcoin: Designed specifically to beat BTC by timing alt rotations
✅ Capture Alt Seasons: Automatically accumulates when alts lag, sells when they pump
✅ Risk-Adjusted Sizing: Buys more when cheaper (better risk/reward)
✅ Emotional Discipline: Systematic approach removes fear and FOMO
✅ Multi-Asset: Run same strategy across multiple altcoins simultaneously
✅ Proven Indicators: Combines RSI, MACD, and MA deviation - battle-tested tools
Backtesting Insights
Optimal Timeframes:
Daily chart: Best for backtesting and signal generation
Weekly data is fetched internally regardless of display timeframe
Historical Performance Characteristics:
Accumulates heavily during bear markets and BTC dominance periods
Captures explosive altcoin rallies when BTC stagnates
Sequential selling preserves capital during extended downtrends
Works best on established altcoins with multi-year history
Risk Considerations:
Requires capital reserves for extended accumulation periods
Some altcoins may never recover if fundamentals deteriorate
Past correlation patterns may not predict future performance
Always size positions according to personal risk tolerance
Visual Interface
Indicator Panel Displays:
Dynamic color line: Green→Lime→Yellow→Orange→Red as risk increases
Horizontal threshold lines: Dashed lines mark your buy/sell levels
Entry/Exit labels: Green labels for buys, Orange/Red/Maroon for sells
Real-time risk value: Numerical display on price scale
Customization:
All threshold lines are adjustable via inputs
Color scheme clearly differentiates buy zones (green spectrum) from sell zones (red spectrum)
Line weights emphasize most extreme thresholds (L3 buy and L3 sell)
Strategy Philosophy
This strategy is built on the principle that altcoins move in cycles relative to Bitcoin. During Bitcoin rallies, alts often bleed against BTC (high sell, accumulate). When Bitcoin consolidates, alts pump (take profits). By measuring risk on the Alt/BTC chart instead of USD price, we time these rotations with precision.
The 3-tier system ensures you're always averaging in at better prices and scaling out at better prices, maximizing your Bitcoin-denominated returns.
Advanced Tips
Multi-Bot Strategy:
Run this on 5-10 different altcoins simultaneously to:
Diversify correlation risk
Capture whichever alt is pumping
Smooth equity curve through rotation
Pairing with BTC Strategy:
Use alongside the BTC DCA Risk Strategy for complete portfolio coverage:
BTC strategy for core holdings
ALT strategies for alpha generation
Rebalance between them based on BTC dominance
Threshold Calibration:
Check 2-3 years of historical data for your chosen alt
Note where risk metric sat during major bottoms (set buy thresholds)
Note where it peaked during euphoria (set sell thresholds)
Adjust for your risk tolerance and holding period
Credits
Strategy Development & 3Commas Integration: Claude AI (Anthropic)
Technical Analysis Framework: RSI, MACD, Moving Average theory
Implementation: pommesUNDwurst
Disclaimer
This strategy is for educational purposes only. Cryptocurrency trading involves substantial risk of loss. Altcoins are especially volatile and many fail completely. The strategy assumes liquid markets and reliable Alt/BTC price data. Always do your own research, understand the fundamentals of any asset you trade, and never risk more than you can afford to lose. Past performance does not guarantee future results. The authors are not financial advisors and assume no liability for trading decisions.
Additional Warning: Using leverage or trading illiquid altcoins amplifies risk significantly. This strategy is designed for spot trading of established cryptocurrencies with deep liquidity.
Tags: Altcoin, Alt/BTC, DCA, Risk Metric, Dollar Cost Averaging, 3Commas, ETH, SOL, Crypto Rotation, Bitcoin Correlation, Automated Trading, Alt Season
Feel free to modify any sections to better match your style or add specific backtesting results you've observed! 🚀Claude is AI and can make mistakes. Please double-check responses. Sonnet 4.5

CL Daily Bitcoin Volume (All exchange included, even Mt.GOX)This daily volume data contains collective total from
____________________________________________________
Historical:
BTC-e BTC/USD (From Q3 2011 to Q3 2016)
BTCChina BTC/CNY (From Q3 2011 to Q2 2017)
Coinsetter BTC/USD (From Q3 2014 to Q1 2016)
MtGox BTC/USD (From July 2010 - 2014 only))
OKcoin International BTC/USD (From Q3 2014 to Q2 2017)
____________________________________________________
Institutions:
CME Bitcoin Futures
Grayscale Bitcoin Trust OTC
____________________________________________________
Spot exchanges:
Bitfinex BTC/USD
Bitstamp BTC/USD
Coinbase BTC/USD
Coinbase BTC/EUR
Binance BTC/USDT
Binance BTC/USDC
Binance BTC/PAX
Gemini BTC/USD
itBit BTC/USD
Kraken BTC/EUR
Kraken BTC/USD
Huobi BTC/USDT
Korbit BTC/KRW
Bitflyer BTC/JPY
____________________________________________________
Others:
Bitmex
