LevelUp^ AlphaLevelUp Alpha is a collection of tools designed in collaboration with Brian Shannon, CMT, creator of the anchored VWAP (AVWAP) and the author of two best-selling books on technical analysis. This indicator is focused on tools and techniques that Brian uses in both his analysis and trading.
LevelUp Alpha Goals
One primary goal of LevelUp Alpha was to create an indicator with tools and visuals that mimic Brian's preferred chart layouts. For example, the default lengths/colors for AVWAP, 5-day moving average and vertical lines where moving averages begin, are all aligned with Brian's approach to technical analysis. Through this educational process, one can learn how to effectively use AVWAP and other intraday tools to properly manage trades and adhere to sound risk management principles. At any point, the indicator can be customized to match one's preferred layout, colors and trading style.
Trend Alignment - Multiple Timeframe Analysis
As trend followers, we look for stocks in an established uptrend. This starts with reviewing stocks on weekly and/or daily charts. From there, we focus on lower timeframes using intraday charts, with the objective to verify alignment between the timeframes.
Important Note: The majority of tools in LevelUp Alpha are for lower timeframes (intraday) analysis as this is where potential trade setups, entries and exits (stops) are often determined.
Key Features:
▪ AVWAP auto-anchored on 1-day, 2-day, week-to-date and month-to-date (for intraday charts).
▪ AVWAP works with any exchange around the globe, respecting trading days, hours and holidays.
▪ AVWAP works with the TradingView Replay feature, facilitating historical and post-mortem analysis.
▪ 5-day moving average auto-calculated based on the chart timeframe.
▪ 5-day moving average auto-adjusts the minutes in the trading day for crypto and futures.
▪ View up to three daily moving averages on intraday charts, including optional price data.
▪ Anticipate moving average direction based on vertical lines placed at the first bar for each moving average.
▪ Pivot points, aka floor trader pivots or support/resistance levels (R1/S1, R2/S2, etc).
▪ Highlight current and prior day highs/lows with line and price data as these are areas of potential support and resistance.
▪ Table of stats for AVWAP, current and prior day highs/lows, and pivot point price levels, helpful for entries, exits and stops.
▪ Custom alerts for all AVWAPs and pivot points.
AVWAP
The Volume Weighted Average Price (VWAP) is the cumulative average price a stock traded for one day. AVWAP is the same as the VWAP with the exception that the start point (the anchor) is configurable based on a trader's preference, not simply the start of the trading day. From the anchor point forward, on each bar, AVWAP is calculated based on the cumulative volume and average price.
The AVWAP shows the relationship between price and volume over any time period based on the anchor point. At a glance we can see who is in control, the buyers (bulls) or the sellers (bears).
AVWAP Concepts:
▪ When a stock is above an advancing AVWAP, buyers are in control for that timeframe, as the average price is increasing.
▪ When prices are below a declining AVWAP, sellers are in control for that timeframe, as the average price is declining.
▪ When prices oscillate above and below the AVWAP it indicates indecision for that timeframe.
What's unique about AVWAP in this indicator is that it is auto-anchored on 1-day, 2-day, week-to-date and month-to-date. In addition, LevelUp Alpha supports any exchange around the globe, respecting trading days, hours and holidays. You can also use the TradingView replay feature with this indicator, a powerful tool for historical and post-mortem analysis.
AVWAP Auto-Anchor: 1-day, 2-day, week-to-date and month-to-date
AVWAP and TradingView Replay: Review Historical Data and Past Trades
Saudi Exchange (Tadāwul): Trading Days, Sunday to Thursday, 10:00am to 3:00pm
Auto-Anchor: Detects Trading Days
London Stock Exchange (LSE): Trading Days, Monday to Friday, 8:00am to 4:30pm
Auto-Anchor: Detects U.K. Bank Holiday
5-Day Moving Average
When using AVWAP, we look for stocks where the trend of the 50-SMA is higher. We follow this by reviewing lower timeframes (intraday charts) to see if the price action is setting up for a low risk trade by verifying the shorter timeframes align with the longer. As we look at various timeframes, we need to make sure the moving average is consistent across the timeframes, which is done via the 5-day moving average as explained by Brian:
"If you want to see a five DAY moving average on a chart with 10 minute candles, you have to consider how many 10 minute periods of trading there are in the trading day. The US equities markets are open from 9:30- 4:00 each day, which is 6.5 hours per trading day. In each hour of trading, there are 6-10 minute periods, so during the regular session for equities, the market is open for 390 minutes or 39-10 minute periods per day. If we are to get a five day moving average, we would take the 39-10 minute periods the market is open each day and then multiply that by five days. 39 x 5 = 195. So a 5 DAY moving average is represented by a 195 PERIOD moving average when looking at a 10 minute timeframe."
In LevelUp Alpha, the default value for the minutes per day is 390, the number of minutes in one trading day in the U.S. This value can be changed to match any exchange. For example, if trading the India National Stock Exchange (NSE), which is open from 9:30am to 3:30pm, the minutes per day would be set to 375.
As trend followers, our goal is to find stocks where the 5-day moving average is trending up.
5-Day Moving Average Trending Up
When viewing charts of crypto or futures, the minutes per trading day will be auto-adjusted as follows:
• Crypto: 1440 minutes per day based on 24 hrs per day.
• Futures: 1380 minutes per day based on 23 hrs per day - S&P 500 E-mini Futures (ES1!) & NASDAQ 100 E-mini Futures (NS1!)
Important Note: Based on the math as described above using the minutes in the trading day, there will be chart timeframes where the 5-day moving average is not shown. If you have the 5-day moving average enabled from within the indicator Settings, yet the 5-day line is not visible, try changing to another timeframe.
Moving Averages
There are three configurable daily moving averages, including the option to use simple or exponential calculations. These daily moving averages can be viewed on intraday charts as they can often act as areas of support or resistance. There is also an option to smooth the daily moving average when they are shown on an intraday chart.
Daily 10-SMA on Intraday Chart - Acting as Support
Auto-smoothing feature is off.
Daily 20-SMA on Intraday Chart - Acting as Support
Auto-smoothing feature is on.
Vertical Lines - Anticipating Direction
By placing vertical lines at the starting bar where a moving average calculation begins, one can anticipate the direction of the moving average by viewing the trend of the bars that will fall off the moving average as new bars are added. This can be helpful to gauge if the trend will continue in its current trajectory or begin to move in a different direction.
Intraday Chart
Daily Chart
S&P 500 E-mini Futures (ES1!)
Crypto
Pivot Points
Pivot points are intraday price levels that may act as areas of support or resistance. These pivot points were initially created by floor traders operating within the trading pits of the equity futures exchange in Chicago.
The calculations for determining these pivots are based on the prior days high, low and close:
Pivot (P) = (prevHigh + prevLow + prevClose) / 3
Resistance R1 = (2 * P) - prevLow
Support S1 = (2 * P) - prevHigh
Resistance R2 = P + (prevHigh - prevLow)
Support S2 = P - (prevHigh - prevLow)
Resistance R3 = prevHigh + (2 * (pivot - prevLow))
Support S3 = prevLow - (2 * (prevHigh - pivot))
R1 Acting as Resistance
S2 Acting as Support
Prior Day High and Low
With LevelUp Alpha you can show horizontal lines at both the prior day high and low values. This makes it easy to visualize the prior day's trading range in anticipation of potential areas of support or resistance. These area can also be potential points for entering, exiting or profit taking.
Current Day High and Low
In a similar manner to prior day high and low values, you can also view the current day high and low. Notice in the chart below that you can easily see inside days and watch the price action in real-time.
Tables for AVWAP and Pivot Stats
To make it easy to quickly determine potential entries, exits and stops, as well as areas of support or resistance, key values can be shown in a table. The table contents are configurable, with options to include: AVWAP, current day and prior day highs/lows as well as pivot points.
AVWAP Color Coded & Pivot Points
Current Day High/Low and Prior Day High Low
Custom Alerts
There are alert options for all AVWAP values as well as resistance levels R1, R2 and support levels S1 and S2.
Acknowledgements
Many thanks to Brian Shannon for sharing his expertise on technical analysis and risk management, as well as providing feedback and suggestions on the indicator.
스크립트에서 " TABLE "에 대해 찾기

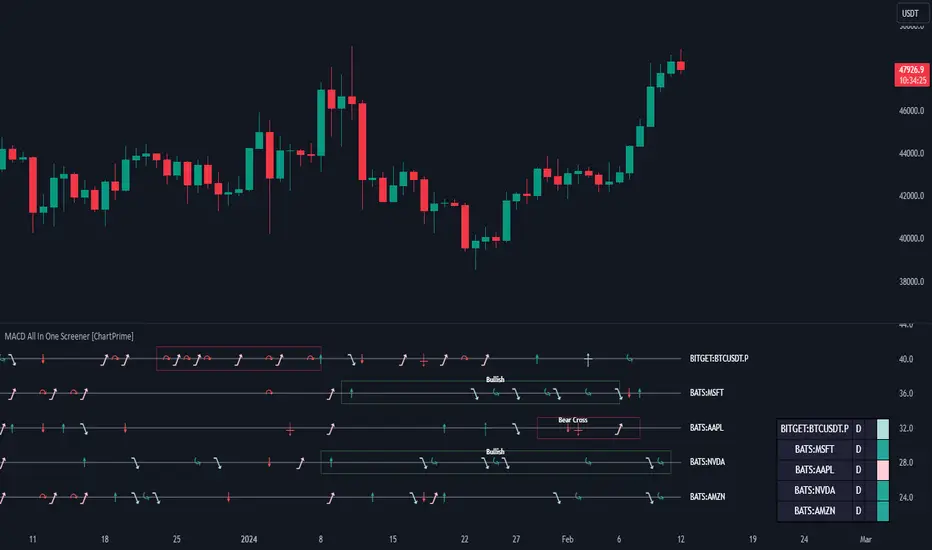
MACD All In One Screener [ChartPrime]INTRODUCTION
MACD All In One Screener (ChartPrime) is a multi instrument, multi timeframe indicator designed to provide traders with a comprehensive solution to monitoring the market. This indicator is designed to be easy to use and visually appealing while also being highly flexible and feature rich. Users can pick up to 10 symbols not including the chart's symbol and set up alerts for many different signals that the MACD produces. One standout feature of this indicator is its ability to display not only each symbol individually as a MACD but you can also view its chart from within this indicator. This removes the need to flip between symbols to see the price action for your basket.
On top of that we have designed this indicator to be friendly with "indicator on indicator" by providing outputs for all of the standards of price that users may want. Included is an overview section that shows all of the symbols signals symbolically over time. Additionally we have included a table for easy monitoring. This table includes the symbol, its timeframe, the current alert, and its histogram state. To make things as user friendly as possible we have also included rich error handling that tells you exactly what is wrong with your configuration.
HOW TO USE
To use this indicator, simply add it to your chart and navigate to the settings. From there select the symbols you want to monitor and the timeframes you want to use. Next you want to navigate down to the alerts section to select the what alerts you want to receive, and what symbols you want to get alerts for. Finally, you wan to create your alert using "Any alert() function call". Now your screener is all set up!
OVERVIEW OF INPUTS
View allows you to select what the indicator currently displays. You can pick from any one of the selected symbols, an overview of all of the symbols, or simply nothing. If you want to only use the table, "None" is provided so you can move the indicator into the chart panel.
View Toggle lets you pick from displaying the MACD for the selected symbol or the Price Action as a candle chart. To see your "indicator on indicator" you will have to select a symbol from the view list. There is a bug where if you select "Overview" while you are using "indicator on indicator" your added indicator will see the last symbol you viewed. To fix this, simply change the setting of your overlaid indicator and it will correct its self.
History Length is the number of historical bars to calculate over. This feature is here to prevent the indicator from breaking due to uneven historical data between the symbols.
Show Price Line toggles a dotted line that follows the current symbols closing price when "Price" is selected under the "View Toggle" dropdown.
Show Symbol Label toggles a label that displays the current symbols name and timeframe. This only impacts the single symbol view.
Overview Label Color adjusts the color of the symbol labels for both overview and single symbol view.
MA Type lets you pick what kind of moving average you want to use for the oscillator or signal. You can pick from the standard SMA or EMA.
Fast Length is a standard input for MACD. This lets you pick the period of the fast MA.
Slow Length , just like Fast Lenght, is a standard input for MACD. This lets you pick the period of the slow MA.
Signal Length is another standard input for MACD. This lets you configure the period of the signal MA.
MACD Cross Overlay Icon is a toggle to display MACD crosses when viewing a single symbol's MACD. When the MACD has a bullish cross it will plot a bullish dot, and when it has a bearish cross it will plot a bearish dot. This is purely visual.
Regular Bullish and Bearish toggles the visual display of the divergences on the single symbol view. This does not effect the indicators ability do send alerts.
Divergence Look Right adjusts the number of bars into the future to look for confirmation of a signal. This directly impacts lag but enhances stability.
Divergence Look Left adjusts the number of bars into the past to check for a signal. A longer period will filter out smaller moves
Maximum Lookback adjusts the maximum size of a divergence.
Minimum Lookback adjusts the minimum size of a divergence.
Divergence Drawings picks how you want to visualize the divergence. You can pick from displaying it as a line, a label, or both.
Enable Table toggles the overview table. When enabled it will show you the enabled symbols and their current state. From left to right: symbol name, timeframe, current alert, and histogram state.
Position picks where on the chart you want the table to be.
Text Color adjusts the text color of the table.
BG Color adjusts the background color of the table.
Frame Color adjust the frame color of the table.
Current Symbol Time Frame adjusts the timeframe of the chart's symbol.
Symbol 1 - 10 pick "Symbol's" symbol and timeframe. To use higher timeframes, the symbol's have to be the same type. You can't have a crypto and a stock using HTF at the same time as they don't have the same sessions and will result in an error. You can use unsafe mode (as described below) to potentially get around this.
Enable Symbol when enabled it will give you alerts for the symbol. This also enables the symbol in the overview. If this is disabled it won't send alerts, and it will not show up in overview, or the table.
Wait for Close enables waiting for the bar to close before printing an alert.
Alert Symbol Size picks what size you want the overview symbols to be.
Enable Cross Over 0 Alert: MACD crosses over the 0 line.
Enable Cross Under 0 Alert: MACD crosses under the 0 line.
Enable MACD Cross Bullish Alert: Bullish MACD cross.
Enable MACD Cross Bearish Alert: Bearish MACD cross.
Enable Histogram Bullish Turn Alert: MACD begins to turn bullish but hasn't crossed.
Enable Histogram Bearish Turn Alert: MACD begins to turn bearish but hasn't crossed.
Enable Histogram Bullish Continuation Alert: MACD is in a bullish cross state and it was declining but began rising again.
Enable Histogram Bearish Continuation Alert: MACD is in a bearish cross state and it was rising but began falling again.
Enable Bullish/Bearish Divergence Alert enables divergence alerts. Divergences are lagging, especially on a higher timeframe. These alerts will also tell you the time in the past when the divergence occurred.
Color Section is provided to allow for personalization of the indicator. Everything can be adjusted here.
Disable Error Checking: Only enable this if you want to bypass the built in error checking. This will enable 'Safe Requesting'. Safe Requesting will only request enabled symbols and you will not be able to view symbols that are not enabled in this mode. Only use this if you want to mix symbol types and you know it will work. (An example would be viewing stocks and SPY at the same time.)
CONCLUSION
The MACD All In One Screener (ChartPrime) is a versatile indicator designed to monitor multiple symbols across various timeframes. The flexibility in customization, from MACD settings to visual alerts and table presentations, allows users to tailor the screener to their needs and preferences. We hope you find this as useful and interesting as we do and wish you good luck in the market!
Enjoy
Liquidity composition / quantifytools- Overview
Liquidity composition divides each candle into sections that are used to display transaction activity at price. In simple terms, an X-ray through candle is formed, revealing the orderflow that built the candle in greater detail. Liquidity composition consists of two main components, lots and columns. Lots and columns can be used to visualize user specified volume types, currently supporting net volume and volume delta. Lots and columns can be used to visualize same or different volume types, allowing a combination of volume footprint, volume delta footprint and volume profile in one single view. Liquidity composition principally works on any chart, whether that is equities, currencies, cryptocurrencies or commodities, even charts with no volume data (in which case volatility is used to approximate transaction activity). The script also works on any timeframe, from minute charts to monthly charts. Orderflow can be observed in real-time as it develops and none of the indications are repainted.
Example: Displaying same volume types on lots and columns
Example: Displaying different volume types on lots and columns
Liquidity composition supports user specified derivative data, such as point of control(s) and net activity coloring. Derivative data can be calculated based on either net volume or volume delta, resulting in different highlights.
With net volume, volume delta and derivative data in one view, key orderflow events such as delta imbalances, high volume nodes, low volume nodes and point of controls can be used to quickly identify accumulation/distribution, imbalances, unfinished/finished auctions and trapped traders.
Accessing script 🔑
See "Author's instructions" section, found at bottom of the script page.
Key takeaways
- Liquidity composition breaks down transaction activity at price, measured in net volume or volume delta
- Developing activity can be observed real-time, none of the indications are repainted
- Transaction activity is calculated using volumes accrued in lower timeframe price movements
- Lots and columns can be used to display same or different volume types (e.g. volume delta lots and net volume columns) in single view
- Users can specify derivative data such as volume delta POCs, net volume POC and net activity coloring
- For practical guide with practical examples, see last section
Disclaimer
Orderflow data is estimated using lower timeframe price movement. While accurate and useful, it's important to note the calculations are estimations and are not based on orderbook data. Estimates are calculated by allotting volume developing on lower timeframe chart to its respective section based on closing price. Volume delta (difference between buyers/sellers) is calculated by subtracting down move volumes (sell volume) from up move volumes (buy volume). Accuracy of the orderflow estimations largely depends on quality of lower timeframe chart used for calculations, which is why this tool cannot be expected to work accurately on illiquid charts with broken data.
Liquidity composition does not provide a standalone trading strategy or financial advice. It also does not substitute knowing how to trade. Example charts and ideas shown for use cases are textbook examples under ideal conditions, not guaranteed to repeat as they are presented. Liquidity composition should be viewed as one tool providing one kind of evidence, to be used in conjunction with other means of analysis.
- Example charts
Chart #1: BTCUSDT
Chart #2: EURUSD
Chart #3: ES futures
- Calculations
By default, size of sections and lower timeframe accuracy are automatically determined for all charts and timeframes. Number of lower timeframe price moves used for calculating orderflow is kept at fixed value, by default set to 350. Accuracy value dictates how many lower timeframe candles are included in the calculation of volume at price. At 350, the script will always use 350 lower timeframe price movements in calculations (when possible). When calculated dynamic timeframe is less than 1 minute, the script switches to available seconds based timeframes. Minimum dynamic timeframe can be capped to 1 minute (as seconds based timeframes are not available for all plans) or dynamic timeframe can be overridden using an user specified timeframe.
Example: Calculating dynamic lower timeframe
Main chart: 4H / 240 minutes
Accuracy value: 100
Formula: 240 minutes / 100 = 2.4 minutes
Timeframe used for calculations = 2 minutes
Section size is automatically determined based on typical historical candle range, the bigger it is, the bigger the section size as well. Like dynamic timeframe, automatic section size can be manually overridden by user specified size expressed in ticks (minimum price unit). Users can also adjust sensitivity of automatic sizing by setting it higher (smaller sections, more detail and more noise) or lower (less sections, less detail and less noise). Section size and dynamic timeframe can be monitored via metric table.
Volume at price is calculated by allotting volume associated with a lower timeframe price movement to its respective section based on closing price (volume is stored to the section that covers closing price). When used on a chart with no volume data, volatility is used instead to determine likely magnitude of participation. Volume delta (difference between buyers/sellers) is calculated by subtracting down move volumes (sell volume) from up move volumes (buy volume). Volumes accrued in sections are monitored over a longer period of time to determine a "normal" amount of activity, which is then used to normalize accrued volumes by benchmarking them against historical values.
Volume values displayed on the left side represent how close or far volume traded at given section is to an extreme, represented by value of 10 . The more value exceeds 10, the more extreme transaction activity is historically. The lesser the value, the less extreme (and therefore more typical) transaction activity is. Users can adjust sensitivity of volume extreme threshold, either by increasing it (more transaction activity is needed to constitute an extreme) or decreasing it (less transaction activity is needed to constitute an extreme).
Example: Interpreting volume scale
0 = Very little to no transaction activity compared to historical values
5 = Transaction activity equal to average historical values
10 = Transaction activity equal to an extreme in historical values
10+ = The more transaction activity exceeds value of 10, the more extreme it is historically
Accuracy of orderflow data largely depends on quality of lower timeframe data used in calculations. Sometimes quality of underlying lower timeframe data is insufficient due to suboptimal accuracy or broken lower timeframe data, usually caused by illiquid charts with gaps and inconsistent values. Therefore, one should always ensure the usage of most liquid chart available with no gaps in lower timeframe data. To combat poor orderflow data, a simple data quality check is conducted by calculating percentage of sections with volume data out of all available sections. Idea behind the test is to capture instances where unusual amount of sections are completely empty, most likely due to data gaps in LTF chart. E.g. 90% of sections hold some volume data, 10% are completely empty = 90% data quality score.
Data quality score should be viewed as a metric alerting when detail of underlying data is insufficient to consider accurate. When data quality score is slightly below threshold, lower timeframe chart used for calculations is likely fine, but accuracy value is too low. In this case, one should increase accuracy value or manually override used timeframe with a smaller one. When data quality score is well below threshold, lower timeframe chart used for calculations is likely broken and cannot be fixed. In this case, one should look for alternative charts with more reliable data (e.g. ES1! -> SPY, BITSTAMP:BTCUSD -> BINANCE:BTCUSDT).
Example : When insufficient data quality scores can/cannot be fixed
- Derivative data
Point of control
Point of control, referring to point in price where transaction activity is highest, can be calculated based on the volume type of lots or columns (based on net volume or volume delta). Depending on the calculation basis, displayed point of controls will vary. POC calculated based on net volume is no different from traditional POC, it is simply the section with highest amount of transaction activity, marked with an X. When calculating POC based on volume delta, the script will highlight two point of controls, named leading and losing point of control . Leading POC refers to lot with highest amount of volume delta, marked with an X. If leading POC was net buy volume, losing POC is marked on section with highest net sell volume, marked with S respectfully. Same logic applies in vice versa, if leading POC is net sell volume, losing POC is marked on highest buy volume section, using the letter B.
Net activity
Similarly to point of control calculation, net activity can be calculated based on either volume types, lots or columns. When calculating net activity based on net volume, candles will be colorized according to magnitude of total volume traded. When calculating net activity based on volume delta, candles will be colorized according to side with most volume traded (buyers or sellers). Net activity color can be applied on borders or body of a candle.
- Visuals
Lots, columns, candles and POCs can be colorized using a fixed color or a volume based dynamic color, with separate color options for buy side volume, sell side volume and net volume.
Metric table can be offsetted horizontally or vertically from any four corners of the chart, allowing space for tables from other scripts.
Table sizes, label sizes and offsets for visuals are fully customizable using settings menu.
- Practical guide
OHLC data (candles) is a simple condensed visualization of an auction market process. Candles show where price was in the beginning of an auction period (timeframe), the highest/lowest point and where price was at the end of an auction. The core utility of Liquidity composition is being able to view the same auction market process in much greater detail, revealing likely intention, effort and magnitude driving the process. All basic orderflow concepts, such as ones presented by auction market theory can be applied to Liquidity composition as well.
The most obvious and easy to spot use case for orderflow tools is identifying trapped traders/absorption, seen in high transaction activity at the very highs/lows of a candle or even better, at wicks. High participation at wicks can be used to identify forced orders absorbed into limit orders, idea behind being that when high transaction activity is placed at a wick, price went one direction with a lot of participation (high effort) and came right back up (low impact) within the same time period.
Absorption can show itself in many ways:
- Extreme buy volume sections at wick highs or buy side POC at wick highs
- Multiple, clustered high buy volume sections (but not extreme) at wick highs
- Positive net volume delta into a reversal down
- Extreme sell volume sections at wick lows or sell side POC at wick lows
- Multiple, clustered high sell volume sections (but not extreme) at wick lows
- Negative net volume delta into a reversal up
- Extreme net volume sections at or net volume POC at wick highs/lows
- Extreme net volume into a reversal up/down
For accurate analysis, orderflow based events should be viewed in the context of price action. To identify absorption, it's best to look for opportunities where an opposing trend is clearly in place, e.g. absorption into highs on an uptrend, absorption into lows on a downtrend. When price is ranging without a clear trend or there's no opposing trend, extreme activity at an extreme end of a candle might be aggressive participants attempting to initiate a new trend, rather than getting absorbed in the same sense. With enough effort put into pushing price to the opposite direction at overextended price, a shift in trend direction might be near.
Price action based levels are a great way to get context around orderflow events. Simple range highs/lows as a single data point serve as a high probability regimes for reversals, making them a great point of confluence for identifying trapped traders.
Low to zero volume sections can be used to identify points in price with little to no trading, leaving a volume null/void behind. Typically sections like these represent gaps on a lower timeframe chart, which can be used as reference levels for targets and support/resistance.
Net volume can be used for same purposes as above, but for determining general intention of market participants it's a much more suitable tool than volume delta. According to auction market theory, low/no participation is considered to reject prices and high participation is considered to accept prices. With this concept in mind, unfinished auctions occur when participation is high at highs or high at lows, idea behind being that participants are showing willingness and interest to trade at higher or lower prices. Auction is considered finished when the opposite is true, i.e. when participants are not showing willingness to trade at higher/lower prices. In general, direction of unfinished auctions can be expected to continue shortly and direction of unfinished auctions can be expected to hold.
While shape of volume delta and net volume are usually similar, they're not the same thing and do not represent the same event under the hood. Volume delta at 0 does not necessarily mean participation is 0, but can also mean high participation with equal amount of buying and selling. With this distinction in mind, using volume delta and net volume in tandem has the benefit of being able to identify points in price with a lot of up and down price movement packed into a small area, i.e. consolidation. Points in price where price hangs around for an extended period of time can be used to identify levels of interest for re-tests and breakout opportunities.

Supply And DemandThis supply and demand indicator uses sessions, volume spikes, higher timeframe price action and other volume calculations to spot areas on the chart where price will likely react. From the 1 minute and below charts to the daily and up charts, you can get excellent levels for any timeframe.
Why Use Supply And Demand?
One of the safest ways to trade is to wait for price to enter an area of interest where price should react. When we play reversals off of these areas, you increase the likelihood that your trade will be profitable because there was previous price action that told you that the current level is one where price will react. So we look for reversals at or very near these levels to enter into scalp or swing trade positions and look to exit that position when price is at or near the next major supply and demand level.
How To Use
The strategy with this indicator is to wait for price action to reach the levels shown by this supply and demand indicator and then enter trades at these levels, looking for a reversal. The thicker lines and the lines that are from the highest timeframes will be the most important levels on the chart. There is a table on the chart that will help you identify what timeframe the levels are using, with the color of that line next to it for easy identification.
The default settings are designed for scalping the 1-5 minute charts, so there are more levels turned on than necessary if you are using higher timeframes than 5 minutes. If you are using higher timeframes, make sure to turn off some of the lower timeframe levels so that it doesn’t clog up your charts. On the daily timeframe and above, many of the levels are coded to not turn on so that you don’t have to turn them off manually, but be aware that you will need to adjust your charts to suit your preferences, especially if you are on anything above the 5 minute chart.
For scalping, wait for price to react from the supply and demand levels by showing wicks, struggling to break through or getting reversal candles at those levels. Ride those moves to the next major supply and demand area before taking profit. You may want to turn on sessions and some of the lower timeframe levels as well if there are big gaps on the chart that are not suitable for scalping.
For swing trading, you will want to turn some of the lower timeframe and session levels off. Leave it to only higher timeframe OHLC lines and volume spike levels. Then you can swing moves that reverse off of the supply and demand lines.
Customization
This indicator is fully customizable. You can turn on or off any of the levels as well as increase the number specific levels so your charts suit your preferences.
All of the levels used are color coded individually so you can easily tell which type of level it is and these colors can be changed within the settings to suit your preferences. These colors are also reflected in the line identification table that show you exactly which color each type of level is.
There are toggles for the line identification table and session identification table as well if you don’t want them on your chart.
Types Of Levels Used
This indicator uses 4 different types of levels that I have found to be extremely influential on the price action. They are: volume spikes, higher timeframe price action, country based trading sessions and the VWAP. All of these levels have proven to be very important levels in my testing and are very helpful in spotting reversal areas.
Volume Spikes
This indicator is looking for the largest volume spikes and plotting the levels where that volume came in. It checks for the highest volume spikes across multiple different lengths of candles so that you get recent levels as well as the most important levels in the past. There are volume spike calculations for your current chart timeframe, 1 hour charts, 4 hour charts, daily charts, weekly charts, and monthly charts. Each of these looks for volume spikes across various lengths of candles for each timeframe and is color coded so you can identify which levels are which easily. The weekly and monthly volume spike levels are fatter than the normal volume spike levels with a line width of 2 to signify their importance.
OHLC Higher Timeframe Candles
This script plots levels of higher timeframe candles since price usually reacts very strongly to these levels. The levels it will produce are the high, low, open and close of the most recent closed candle of each higher timeframe. You can adjust these to show as many or as few previous HTF candles as you would like. The higher timeframe candles available to use are as follows: 1 hour, 4 hour, daily, 3 day, weekly, monthly, quarterly and yearly. The monthly, quarterly and yearly levels are fatter than the normal levels with a line width of 2 to signify their importance.
Trading Sessions
Trading sessions are very important levels because the market makers of different parts of the world are typically positioning themselves at these specific times. The number of each trading session line can be adjusted to show more or less levels depending on your preference. When you adjust the number, it will affect all lines that are enabled for that specific session. The levels available for each Tokyo, London & New York session are as follows: session premarket open, regular session open, session close, and session high & low. The session close boxes are fatter than the others with a line width of 2 to signify its importance.
VWAP & Previous Close
We all know that the VWAP aka Volume Weighted Average Price is a very important level on any chart, so we included this level as a default. However, we decided to take this a step further and include the previous daily session’s VWAP closing price and plot those levels. These are extremely important levels that you should pay very close attention to, along with the other levels mentioned above. The market makers are hedging their positions based on these levels and you will typically see very strong reactions to these levels, especially in the first hour when the markets open up. The VWAP and previous session VWAP close levels can be turned on or off and the default for the number of previous VWAP session close prices is set to 5. These levels are fatter lines because they are extremely important, so make sure to pay attention to them!
Line & Session Identification Tables
There are two tables to help you identify what is on the chart. The first is a large table in the top right that shows you the color and type of each line that is turned on so you can easily identify which lines are which. The second table is a small one at the bottom center of the chart that tells you which trading session we are currently in and what color that session is on the chart. These tables can be turned on or off and you can also change where they are on the chart by adjusting them at the bottom of the settings page.
Markets
This Supply And Demand indicator can be used on any market with price data such as stocks, crypto, forex and futures.
Timeframes
This Supply And Demand indicator can be used on any timeframe, from the second charts all the way up to the yearly charts.

BTC(Sats Stacking) - CDC Action zone filterType: Indicator (Pine v6) • Category: Strategy Tools / DCA • Overlay: Yes
Overview
This indicator simulates fixed-amount Bitcoin DCA (dollar-cost averaging) and lets you apply a CDC Action Zone filter to only buy in specific market conditions. It plots EMA(12/26) lines with a shaded zone (green when fast > slow, red when slow > fast), shows buy markers on the chart when a DCA event actually executes, and displays a concise performance table.
The simulation tracks real invested capital (sum of your buys), not hypothetical equity injections, and reports PnL vs invested capital.
Key features
DCA frequency: Everyday, Every week, or Every month
CDC filter: Buy on all days, only when CDC is Green (trend-up above fast EMA), or only when Red (trend-down below fast EMA)
Execution price: Choose to buy at bar close or next bar open
Capital controls: Fixed DCA amount per event, optional max budget cap
Currency support: Portfolio currency label plus optional FX conversion (by symbol or manual rate)
Chart visuals: Buy markers on candles; EMA(12/26) lines with shaded “action zone”
Metrics table: Invested capital, buys executed, BTC accumulated, average price per BTC (quote), equity (portfolio), PnL% vs invested, and CAGR
How it works
CDC state:
Green = EMA(fast) > EMA(slow) and price ≥ EMA(fast)
Red = EMA(fast) < EMA(slow) and price < EMA(fast)
DCA trigger: Fires on new day/week/month boundaries (timeframe-agnostic).
Buy execution: When a DCA event occurs and passes the CDC filter and budget check, the script spends the fixed amount and adds the corresponding BTC at the chosen execution price.
Inputs (highlights)
Simulation
Symbol (blank = current chart), Buy at close/open, DCA amount, Max total invested
DCA Schedule
Everyday / Every week / Every month
CDC Action Zone
Filter mode (All / Green only / Red only), Price source, Fast/Slow EMA lengths (defaults 12/26)
Currency / Conversion
Portfolio currency label, Convert on/off, By symbol (e.g., OANDA:USDTHB) or Manual rate
Backtest Range
Optional start/end dates
Style
Show EMA lines and zone, colors and opacities, buy marker size and color
Display
Show qty/price labels on buys, show metrics table, number formatting
Metrics
Invested capital: Sum of all DCA spends in your portfolio currency
Equity (portfolio): BTC holdings marked to market and converted back if FX is enabled
PnL % vs invested: (Equity / Invested - 1) × 100
CAGR: Based on elapsed time from first in-range bar to the latest bar
Average price per BTC (quote): Spend in quote currency divided by BTC accumulated
Notes
This is an indicator, not a broker-connected strategy. It simulates buys and displays results without placing orders.
For more realistic fills, use Buy at next bar open.
If your portfolio currency differs from the symbol’s quote currency, enable Convert and supply a conversion symbol or manual rate.
EMA shading is purely visual; the filter logic uses the same EMA definitions.
Attribution & License
Inspired by the DCA idea and community simulations; CDC filtering implemented with standard EMA(12/26) logic.
License: MPL-2.0 (see code header).
Author: MiSuNoJo
Disclaimer
This tool is for research and education only and is not financial advice. Past performance does not guarantee future results. Use at your own risk.

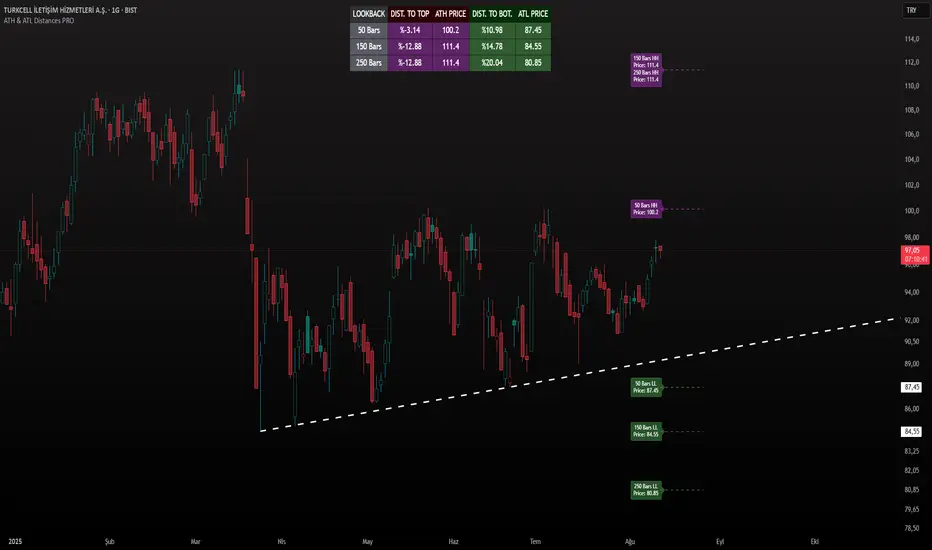
Peak Traker by Futures.RobbyOverview
Peak Tracker is a specialized tool designed to assist traders in proprietary trading challenges. Its main purpose is to help you identify and track the maximum value (the "peak") within an active trade. This is crucial for keeping an eye on your trailing drawdown and avoiding rule violations. The indicator visualizes up to three separate trade windows and provides all necessary data in a clear table.
Key Features
Trailing Drawdown Tracking: The primary function of this indicator is to accurately track the peak value from your entry point to your exit. This helps you minimize the risk of violating drawdown rules in your funding challenge.
Visual Representation: It draws vertical lines for the entry (green) and exit (red) points directly on the chart. This clearly visualizes the exact time frames that are relevant for managing your drawdown.
Dynamic Real-Time Tracking: Within an active trade window, the indicator continuously tracks the highest price reached (Peak) while the entry price (Entry) remains fixed. This allows you to calculate your current drawdown at any moment.
Clear Data Table: A customizable table provides all relevant information at a glance: Trade ID, Entry/Peak prices, and exact timestamps for entry and exit. The numbers are formatted for easy reading using the German number style (e.g., 12.345,67).
Flexible Input: The indicator supports various date and time formats (17:47:00, 2025-08-30 17:14:00, 27.08.25 15:00). The time zone is automatically converted from your local time to the chart's time for precise line placement.
How to Use
Add the indicator to your chart.
Open the indicator's settings (⚙️).
Under "Datums- und Zeit-Eingaben," enter the desired time frames for your trades.
The indicator updates in real time, showing your trade's progress.
Conclusion
This indicator is an essential tool for any trader participating in prop firm challenges who needs a precise method to monitor their trailing drawdown. It provides clarity and visual support to help you avoid rule violations and maximize your chances of success.

200 EMA w/ Ticker Memory200 EMA w/ Ticker Memory — Multi-Symbol & Multi-Timeframe EMA Tracker with Alerts
Overview
The 200 EMA w/ Ticker Memory indicator allows you to monitor the 200-period Exponential Moving Average (EMA) across multiple symbols and timeframes. Designed for traders managing multiple tickers, it provides customizable timeframe inputs per symbol and instant alerts on price touches of the 200 EMA.
Key Features
Multi-symbol support: Configure up to 20 different symbols, each with its own timeframe setting.
Flexible timeframe input: Assign specific timeframes per symbol or use a default timeframe fallback.
Accurate 200 EMA calculation: Uses request.security to fetch 200 EMA from the symbol-specific timeframe.
Visual EMA plots: Displays both the EMA on the selected timeframe and the EMA on the current chart timeframe for comparison.
Touch alerts: Configurable alerts when price “touches” the 200 EMA within a user-defined sensitivity percentage.
Ticker memory: Remembers your configured symbols and displays them in an on-chart table.
Compact info table: Displays current symbol status, alert settings, and timeframe in a clean, transparent table overlay.
How to Use
Configure Symbols and Timeframes:
Input your desired symbols (up to 20) and their respective timeframes under the “Symbol Settings” groups in the indicator’s settings pane.
Set Default Timeframe:
Choose a default timeframe to be used when no specific timeframe is assigned for a symbol.
Adjust Alert Settings:
Enable or disable alerts and set the touch sensitivity (% distance from EMA to trigger alerts).
Alerts
Alerts trigger once per bar when the price touches the 200 EMA within the defined sensitivity threshold.
Alert messages include:
Symbol / Current price / EMA value / EMA timeframe used / Chart timeframe / Timestamp
Customization
200 EMA Color: Change the line color for better visibility.
Touch Sensitivity: Fine-tune how close price must be to the EMA to count as a touch (default 0.1%).
Enable Touch Alerts: Turn on/off alert notifications easily.
For:
- Swing traders monitoring multiple stocks or assets.
- Day traders watching key EMA levels on different timeframes.
- Analysts requiring a quick visual and alert system for 200 EMA touches.
- Portfolio managers tracking key technical levels across various securities.
Limitations
Supports up to 20 configured symbols (can be extended manually if needed).
Works best on charts with reasonable bar frequency due to request.security usage.
Alert frequency is limited to once per bar for clarity.
Disclaimer
This indicator is provided “as-is” for educational and informational purposes only. It does not guarantee trading success or financial gain.

GLD GC Price Converter Its primary function is to fetch the prices of the Gold ETF (ticker: GLD) and Gold Futures (ticker: GC1!) and then project significant price levels from one or both of these assets onto the chart of whatever instrument you are currently viewing.
Core Functionality & Features
Dual Asset Tracking: The script simultaneously tracks the prices of GLD and Gold Futures (GC).
Dynamic Price Level Projection: The script's main feature is its ability to calculate and draw horizontal price levels. It determines a "base price" (e.g., the nearest $100 level for GC) and then draws lines at specified increments above and below it. The key is that these levels are projected onto the current chart's price scale.
On-Chart Information Display:
Price Table: A customizable table can be displayed in any corner of the chart, showing the current prices of GLD and GC. It can also show the daily percentage change for GC, colored green for positive changes and red for negative ones.
Last Price Label: It can show a label next to the most recent price bar that displays the current prices of both GLD and GC.
Extensive Customization: The user has significant control over the indicator's appearance and behavior through the settings panel.
This includes:
Toggling the display for GLD and GC levels independently.
Adjusting the multiplier for the price levels (e.g., show levels every $100 or $50 for GC).
Changing the colors, line styles (solid, dashed, dotted), and horizontal offset for the labels.
Defining the number of price levels to display.
Controlling the text size for labels and the table.
Choosing whether the script updates on every tick or only once per candle close for better performance.

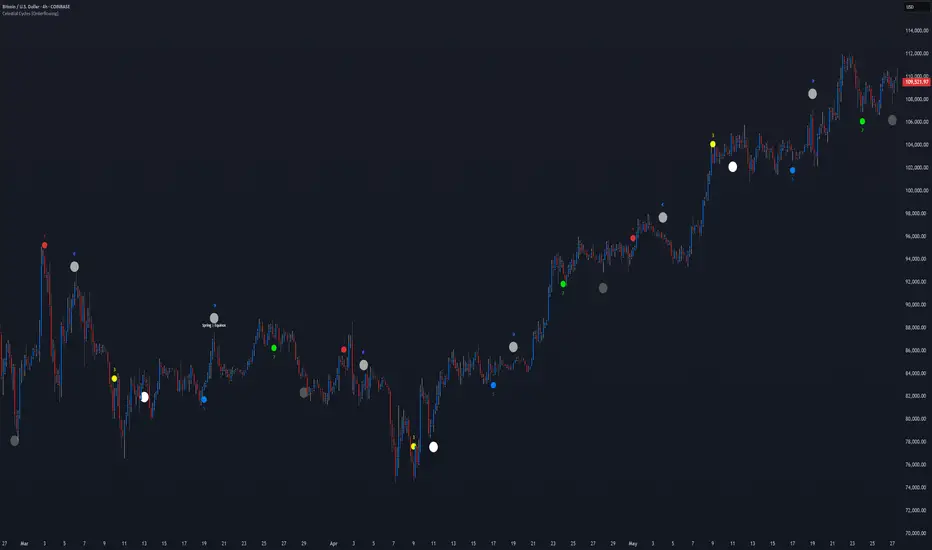
Celestial Cycles [Orderflowing]Astronomical Calculations | Moon Phases | Lunar Cycles & Rare Events | Solar Eclipses & Seasonal Markers | Mercury Retrograde Analysis | Momentum-Based Trend Coloration | Moon Information Table | Customizable Alerts
Built using Pine Script V6
Introduction
The Celestial Cycles indicator is a simple yet complex script that merges the timeless influence of astronomical events with modern technical analysis. By plotting key celestial phenomena, such as moon phases, seasonal markers, and Mercury retrograde periods onto your price chart, this indicator offers traders a fresh perspective on market cycles.
If you like financial astrology or seeking a creative edge, it provides a visually intuitive way to explore potential correlations between celestial events and market behavior.
This indicator is ideal for traders of all experience levels looking to integrate the celestial cycle into their strategies, complementing traditional technical tools with a unique layer of analysis.
Innovation and Inspiration
Inspired by financial astrology. The notion that celestial events, like moon phases or planetary retrogrades, might influence human psychology and market dynamics has intrigued traders for a long time. "Millionaires don’t use astrology, billionaires do." (allegedly): ~J.P. Morgan
This indicator modernizes that concept with astronomical calculations, plotting these events on your chart.
Core Features
Moon Phases: Displays new moons, full moons, and quarter moons, with optional micro phases (1/8, 3/8, 5/8, 7/8) for detailed analysis.
Special Moons: Highlights rare events like blood moons (lunar eclipses) and blue moons with distinct markers.
Solar Eclipses: Marks solar eclipses during new moon phases when enabled.
Seasonal Events: Plots "Spring | Equinox," "Summer | Solstice," "Autumn | Equinox," and "Winter | Solstice" for cyclical context.
Mercury Retrograde: Visualizes current and future Mercury retrograde periods with background highlights and labels.
Trend Coloration: Colors price bars based on momentum to aid trend visualization (optional).
Information Table: Shows real-time moon age and phase details in a table.
Customizable Alerts: Set up alerts for moon phases, special moon events, seasonal events, and Mercury retrograde transitions to stay informed about key celestial occurrences.
Customization and User Inputs
Celestial Cycles is customizable, allowing you to adjust it to your liking:
Event Toggles: Show or hide specific events (e.g., moon phases, special moons, eclipses, seasonal events, Mercury retrograde).
Visual Adjustments: Set colors and positions (above or below bars) for each event type.
Phase Timing: Fine-tune moon phase detection with hour-based adjustments for precision.
Trend Settings: Enable/disable trend coloration and adjust the momentum calculation period.
Mercury Retrograde Options: Display current retrogrades and up to 10 future periods, with customizable visibility.
Alert Settings: Enable or disable alerts for specific celestial events, including moon phases, special moons, seasonal events, and Mercury retrograde starts and ends.
These options ensure a clean, focused chart highlighting only the elements most relevant to your analysis.
How It Works
The indicator leverages code to show celestial events:
Moon Phases: Calculated using Julian dates and ecliptic coordinates to determine moon age and phase transitions.
Special Events: Detects eclipses and rare moons by analyzing lunar and solar positions relative to the ecliptic plane.
Seasonal Markers: Identifies "Spring | Equinox," "Summer | Solstice," "Autumn | Equinox," and "Winter | Solstice".
Mercury Retrograde: Approximates retrograde cycles and projects future periods based on a simplified orbital model.
Trend Coloration: Applies a momentum oscillator to color bars, reflecting potential bullish or bearish trend.
Analysis and Interpretation
Traders can use Celestial Cycles to explore intriguing market hypotheses:
Moon Phases: New and full moons may align with volatility spikes or trend reversals.
Eclipses: Eclipses might signal significant market shifts.
Seasonal Events: Equinoxes and solstices could highlight cyclical turning points.
Mercury Retrograde: Periods of potential disruption or reversal, often linked to communication and technology challenges.
Trend Coloration: Visual cues to confirm potential momentum alongside celestial events.
Usage and Applications
Long-Term Trends: High Timeframe (HTF) charts to study celestial impacts on major cycles.
Short-Term Trends: Apply to intraday timeframes (LTF) for event correlations.
Confluence: Pair with technical indicators for stronger signals.
Research: Backtest historical data to uncover patterns specific to your chosen market. Use the adjustment periods to fine-tune.
Why Use This Indicator?
Unique Perspective: Combines celestial and technical analysis.
Free Access: Enjoy a premium script with lots of features at no cost.
Customization: Personalize every aspect to suit your preferences.
Educational: Learn about astronomical cycles.
Stay Informed: Set up customizable alerts to receive event notifications.
Conclusion
Celestial Cycles is an exploration of how the cosmos might intersect with the markets. By overlaying key astronomical events on your chart and offering alerts, it invites you to see trading through a new lens. While not a crystal ball, it’s a compelling addition to a trader’s toolkit.
Disclaimer: This indicator is for informational, educational and analytical purposes only. Celestial correlations are speculative and should not be the sole basis for trading decisions. Always combine with other analysis methods and manage risk appropriately.
ADR, ATR & VOL OverlayThis is a combined version of 2 of my other indicators:
ADR / ATR Overlay
VOL / AVG Overlay
This indicator will display the following as an overlay on your chart:
ADR
% of ADR
ADR % of Price
ATR
% of ATR
ATR % of Price
Custom Session Volume
Average For Selected Session
Volume Percentage Comparison
Description:
ADR : Average Day Range
% of ADR : Percentage that the current price move has covered its average.
ADR % of Price : The percentage move implied by the average range.
ATR : Average True Range
% of ATR : Percentage that the current price move has covered its average.
ATR % of Price : The percentage move implied by the average true range.
Custom Session Volume : User chosen time frame to monitor volume
Average For Selected Session : Average for the custom session volume
Volume Percentage Comparison : Current session compared to the average (calculated at session close)
Options:
ADR/ATR:
Time Frame
Length
Smoothing
Volume:
Set Custom Time Frame For Calculations
Set Custom Time Frame For Average Comparison
Set Custom Time Zone
Table:
Enable / Disable Each Value
Change Text Color
Change Background Color
Change Table location
Add/Remove extra row for placement
ADR / ATR Example:
The ADR and ATR can be used to provide information about average price moves to help set targets, stop losses, entries and exits based on the potential average moves.
Example: If the "% of ADR" is reading 100%, then 100% of the asset's average price range has been covered, suggesting that an additional move beyond the range has a lower probability.
Example: "ADR % of Price" provides potential price movement in percentage which can be used to asses R/R for asset.
Example: ADR (D) reading is 100% at market close but ATR (D) is at 70% at close. This suggests that there is a potential (coverage) move of 30% in Pre/Post market as suggested by averages.
Custom Volume Session Example:
Set indicator to 30 period average. Set custom time frame to 9:30am to 10:30am Eastern/New York.
When the time frame for the calculation is closed, the indicator will provide a comparison of the current days volume compared to the average of 30 previous days for that same time frame and display it as a percentage in the table.
In this example you could compare how the first hour of the trading day compares to the previous 30 day's average, aiding in evaluating the potential volume for the remainder of the day.
Notes:
Times must be entered in 24 hour format. (1pm = 13:00 etc.)
Volume indicator is for Intra-day time frames, not > Day.
How I use these values:
I use these calculations to determine if a ticker symbol has the necessary range to achieve target gains, to determine if the price oscillation is within "normal" ranges to determine if the trading day will be choppy, and to determine placement of stops and targets within average ranges in combination with support, resistance and retracement levels.

Revenue & Net IncomeRevenue & Net Income Indicator
This indicator provides a clear visual representation of a company's revenue and net income, with the flexibility to switch between Trailing Twelve Months (TTM) and Quarterly data. Values are automatically converted into billions and displayed in both an area chart and a dynamic table.
Features:
TTM & Quarterly Data: Easily toggle between financial periods.
Intuitive Visuals: Semi-transparent area charts make trends easy to spot.
Smart Number Formatting: Revenue below 1B is shown with two decimals (e.g., "0.85B"), while larger values use one decimal (e.g., "1.2B").
Customizable Table: Displays the most recent revenue and net income figures, with adjustable position and text size.
Light Mode: Switch table text to black with a white header for better readability on light backgrounds.
This indicator is freely available and open-source on TradingView for all. It is designed to help traders enhance their market analysis and strategic decision-making.

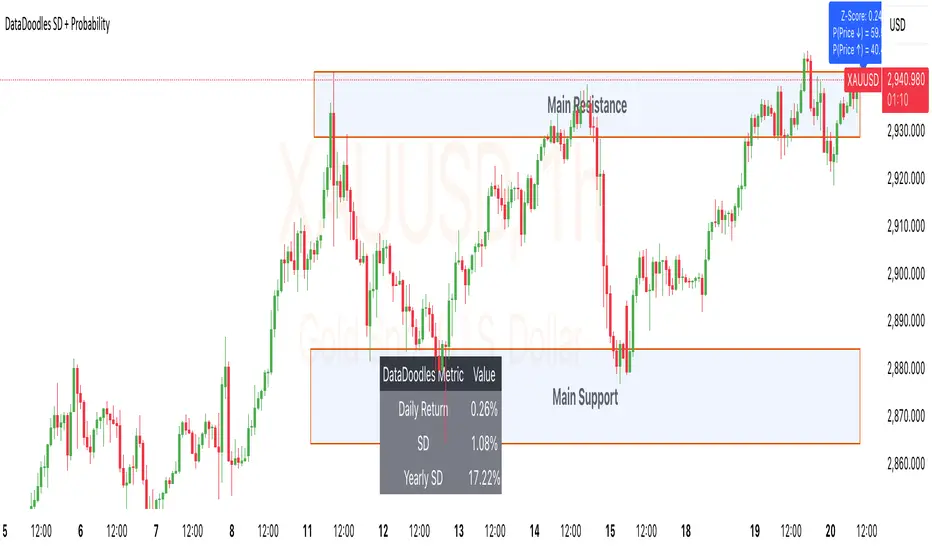
DataDoodles SD + ProbabilityDataDoodles SD + Probability
Overview:
The “DataDoodles SD + Probability” indicator is designed to provide traders with a statistical edge by leveraging standard deviation and probability metrics. This advanced tool calculates the annualized standard deviation, Z-score, and probability of price movements, offering insights into potential market direction with customizable alert thresholds.
Key Features:
1. Annualized Standard Deviation (Volatility) Calculation:
• Uses a user-defined period to compute the rolling standard deviation of daily returns.
• Annualizes the volatility, giving a clear picture of expected price fluctuations.
2. Probability of Price Movement:
• Calculates the probability of price moving up or down using a corrected Z-Score.
• Displays the probability percentage for both upward and downward movements.
3. Dynamic Alerts:
• Configurable alerts for upward and downward price movement probabilities.
• Receive alerts when the probability exceeds user-defined thresholds.
4. Projections and Visuals:
• Plots projected high and low price levels based on annualized volatility.
• Displays Z-Score and probability metrics on the chart for quick reference.
5. Comprehensive Data Table:
• Bottom-center table displays key metrics:
• Daily Return
• Standard Deviation (SD)
• Annualized Standard Deviation (Yearly SD)
User Inputs:
• Annualization Period: Set the time frame for volatility annualization (Default: 252 days).
• SD Period: Define the rolling window for calculating standard deviation (Default: 252 days).
• Alert Probability Up/Down: Customize the probability thresholds for alerts (Default: 90%).
How It Works:
• Data Request and Calculation:
• Uses daily close prices to ensure consistent timeframe calculations.
• Calculates daily returns and annualizes the volatility using the square root of the time frame.
• Probability Computation:
• Employs a normal distribution CDF approximation to compute the probability of upward and downward price movements.
• Adjusts probabilities based on Z-Score to ensure accuracy.
• High and Low Projections:
• Utilizes the annualized volatility to estimate high and low price projections for the year.
• Visual Indicators and Alerts:
• Plots projected high (green) and low (red) levels on the chart.
• Displays Z-Score, probability percentages, and dynamically updates a statistics table.
Use Cases:
• Trend Analysis: Identify high-probability market movements using the probability metrics.
• Volatility Insights: Understand annualized volatility to gauge market risk and potential price ranges.
• Strategic Trading Decisions: Set alerts for high-probability scenarios to optimize entry and exit points.
Why Use “DataDoodles SD + Probability”?
This indicator provides a powerful combination of statistical analysis and visual representation. It empowers traders with:
• Quantitative Edge: By leveraging probability metrics and standard deviation, users can make informed trading decisions.
• Risk Management: Annualized volatility projections help in setting realistic stop-loss and take-profit levels.
• Actionable Alerts: Customizable probability alerts ensure users are notified of potential market moves, allowing proactive trading strategies.
Recommended Settings:
• Annualization Period: 252 (Ideal for daily data representing a trading year)
• SD Period: 252 (One trading year for consistent volatility calculations)
• Alert Probability: Set to 90% for conservative signals or lower for more frequent alerts.
Final Thoughts:
The “DataDoodles SD + Probability” indicator is a robust tool for traders looking to integrate statistical analysis into their trading strategies. It combines volatility measurement, probability calculations, and dynamic alerts to provide a comprehensive market overview.
Whether you’re a day trader or a long-term investor, this indicator can enhance your market insight and improve decision-making accuracy.
Disclaimer:
This indicator is a technical analysis tool designed for educational purposes. Past performance is not indicative of future results. Traders are encouraged to perform their own analysis and manage risk accordingly.
Advanced Trend and Volatility Indicator with Alerts by ZaimonThis script presents a comprehensive analytical tool that integrates multiple technical indicators to provide a holistic view of market trends and volatility. By uniquely combining Moving Averages (MA), Relative Strength Index (RSI), Stochastic Oscillator, Bollinger Bands, and Average True Range (ATR), it offers nuanced insights into price movements and helps identify potential trading opportunities.
---
### **Key Features and Integration:**
1. **Moving Averages (MA20 & MA50):**
- **Trend Identification:**
- **Methodology:** Calculates two Simple Moving Averages—MA20 (short-term) and MA50 (long-term).
- **Bullish Trend:** When MA20 crosses above MA50, indicating upward momentum.
- **Bearish Trend:** When MA20 crosses below MA50, signaling downward momentum.
- **Golden Cross & Death Cross Alerts:**
- **Golden Cross:** MA20 crossing above MA50 generates a bullish alert and visual symbol.
- **Death Cross:** MA20 crossing below MA50 triggers a bearish alert and visual symbol.
- **Integration:**
- Serves as the foundational trend indicator, influencing interpretations of other indicators within the script.
2. **Relative Strength Index (RSI):**
- **Momentum Measurement:**
- **Methodology:** Calculates RSI to assess the speed and change of price movements over a 14-period length.
- **Overbought/Oversold Conditions:** Customizable thresholds set at 70 (overbought) and 30 (oversold).
- **Alerts:**
- Generates alerts when RSI crosses above or below the specified thresholds.
- **Integration:**
- Confirms trend strength identified by MAs.
- Overbought/Oversold signals can precede potential trend reversals, especially when aligned with MA crossovers.
3. **Stochastic Oscillator:**
- **Momentum and Reversal Signals:**
- **Methodology:** Uses %K and %D lines to evaluate price momentum relative to high-low range over recent periods.
- **Bullish Signal:** %K crossing above %D in oversold territory (below 20).
- **Bearish Signal:** %K crossing below %D in overbought territory (above 80).
- **Alerts:**
- Provides alerts on bullish and bearish crossovers in extreme regions.
- **Integration:**
- Enhances RSI signals by providing additional momentum confirmation.
- When both RSI and Stochastic indicate overbought/oversold conditions, it strengthens the likelihood of a reversal.
4. **Bollinger Bands:**
- **Volatility Visualization:**
- **Methodology:** Plots upper and lower bands based on standard deviations from a moving average (BB Basis).
- **Dynamic Support/Resistance:** Prices touching or exceeding the bands may indicate potential reversals.
- **Integration:**
- Works with RSI and Stochastic to identify overextended price movements.
- Helps in assessing volatility alongside trend and momentum indicators.
5. **Average True Range (ATR):**
- **Volatility Assessment:**
- **Methodology:** Calculates ATR over a 14-period length to measure market volatility.
- **ATR Bands:** Plots upper and lower bands relative to the current price using an ATR multiplier.
- **Integration:**
- Assists in setting stop-loss and take-profit levels based on current volatility.
- Complements Bollinger Bands for a comprehensive volatility analysis.
6. **Information Table:**
- **Real-Time Data Display:**
- Shows current values of MA20, MA50, RSI, Stochastic %K and %D, BB Basis, ATR, and Trend Status.
- **Trend Status Indicator:**
- Displays "Bullish," "Bearish," or "Sideways" based on MA conditions.
- **Integration:**
- Provides a consolidated view for quick decision-making without analyzing individual indicators separately.
7. **Periodic Labels:**
- **Enhanced Visibility:**
- Adds labels every 50 bars showing RSI and Stochastic values.
- **Integration:**
- Helps track momentum changes over time and spot longer-term patterns.
---
### **How the Components Work Together:**
- **Synergistic Analysis:**
- **Trend Confirmation:** MA crossovers establish the primary trend, while RSI and Stochastic confirm momentum within that trend.
- **Volatility Context:** Bollinger Bands and ATR provide context on market volatility, refining entry and exit points suggested by trend and momentum indicators.
- **Signal Strength:** Concurrent signals from multiple indicators increase confidence in trading decisions.
---
### **Usage Guidelines:**
1. **Trend Analysis:**
- **Identify Trend Direction:**
- Observe MA20 and MA50 crossovers.
- Refer to the Trend Status in the information table.
- **Confirm with Momentum Indicators:**
- Ensure RSI and Stochastic support the identified trend.
2. **Entry and Exit Points:**
- **Overbought/Oversold Conditions:**
- Look for RSI and Stochastic reaching extreme levels.
- Consider entering positions when oversold in a bullish trend or overbought in a bearish trend.
- **Bollinger Band Interactions:**
- Use price interactions with Bollinger Bands to identify potential reversal zones.
3. **Risk Management:**
- **ATR-Based Levels:**
- Set stop-loss and take-profit levels using ATR bands to account for current volatility.
- **Adjusting to Volatility:**
- Modify position sizes and targets based on Bollinger Band width and ATR values.
4. **Alerts Setup:**
- **Customize Alert Thresholds:**
- Configure alerts for MA crossovers, RSI levels, and Stochastic crossovers according to your trading strategy.
- **Stay Informed:**
- Use alerts to monitor key events without constant chart observation.
---
### **Customization:**
- **Flexible Parameters:**
- All indicator lengths, thresholds, and settings are adjustable to suit different trading styles and timeframes.
- **Adjustable Visuals:**
- Modify plot colors, line styles, and label positions to enhance chart readability.
---
### **Originality and Value Addition:**
This script differentiates itself by:
- **Integrated Approach:**
- Seamlessly combining multiple indicators to provide a more comprehensive analysis than using each indicator separately.
- **Enhanced Visualization:**
- Utilizing plots, fills, labels, and an information table to present data intuitively.
- **User-Friendly Features:**
- Pre-configured alerts and real-time data displays reduce the need for manual monitoring.
By explaining how each component interacts and contributes to the overall analysis, the script adds substantial value to traders seeking a multi-faceted tool for market analysis.
---
### **Additional Notes:**
- **Learning Resource:**
- The script is well-commented, serving as an educational tool for those learning Pine Script and technical analysis integration.
- **Further Enhancements:**
- Opportunities exist to incorporate additional indicators like MACD or ADX, and to develop advanced alert logic, such as RSI or Stochastic divergences.
---
### **Disclaimer:**
- **Educational Purpose Only:**
- This script is provided for informational purposes and should not be construed as financial advice.
- **Risk Acknowledgment:**
- Trading involves significant risk; past performance is not indicative of future results.
- **Due Diligence:**
- Users should conduct their own analysis and consider consulting a financial professional before making trading decisions.
---
By providing detailed explanations of the methodologies and the synergistic use of multiple indicators, this script aligns with TradingView's guidelines for originality and usefulness. It offers traders a unique tool that enhances market analysis through the thoughtful integration of technical indicators.

Uptrick: Oscillator SpectrumUptrick: Oscillator Spectrum is a versatile trading tool designed to bring together multiple aspects of technical analysis—oscillators, momentum signals, divergence checks, correlation insights, and more—into one script. It includes customizable overlays and alert conditions intended to address a wide range of market conditions and trading styles.
Developed in Pine Script™, Uptrick: Oscillator Spectrum represents an extended version of the classic Ultimate Oscillator concept. It consolidates short-, medium-, and long-term momentum readings, applies correlation analysis across different symbols, and offers optional table-based metrics to provide traders with a more structured overview of potential trade setups. Whether used alongside your existing charts or as a standalone toolkit, it aims to build on and enhance the functionality of the standard Ultimate Oscillator.
### A Few Key Features
- Momentum Insights: Multiple timeframes for oscillators, plus buy/sell signal modes for flexible identification of overbought/oversold situations or crossovers.
- Divergence Detection: Automated checks for bullish/bearish divergences, aiming to help traders spot potential shifts in momentum.
- Correlation Meter: A visual histogram summarizing how selected assets are collectively trending. It is useful for tracking the bigger market picture.
- Gradient Overlays & Bar Coloring: Dynamic color transitions designed to emphasize changes in momentum, trend shifts, and overall sentiment without cluttering the chart.
- Money Flow Tracker: Tracks the flow of money into and out of the market using a smoothed Money Flow Index (MFI). Highlights overbought/oversold conditions with dynamic bar coloring and visual gradient fills, helping traders assess volume-driven sentiment shifts.
- Advanced Table Metrics: An optional table showing return on investment (ROI), collateral risk, and other contextual metrics for supported assets.
- Alerts & Automation: Configurable alerts covering divergence events, crossing of critical levels, and more, helping to keep traders informed of developments in real time.
### Intended Usage
- For Multiple Markets: Works on various markets (cryptocurrencies, forex pairs, stocks) to deliver a consistent view of momentum, potential entry/exit signals, and correlation.
- Adaptable Trading Styles: With customizable input settings, you can enable or disable specific features to align with your preferred strategies—intraday scalping, swing trading, or position holding.
By combining these elements under one indicator, Uptrick: Oscillator Spectrum allows traders to streamline analysis workflows, helping them stay focused on interpreting market moves and making informed decisions rather than juggling multiple scripts.
Purpose
Purpose of the “Uptrick: Oscillator Spectrum” Indicator
The “Uptrick: Oscillator Spectrum” indicator is intended to bring together several technical analysis elements into one tool. It combines oscillator-based momentum readings across different lookback periods, checks for potential divergences, provides optional buy/sell signal triggers, and offers correlation-based insights across multiple symbols. Additionally, it includes features such as bar coloring, gradient visualization, and user-configurable alerts to help highlight various market conditions.
By consolidating these functions, the script aims to help users systematically observe changing momentum, identify when prices reach user-defined overbought or oversold levels, detect when oscillator movements diverge from price, and examine whether different assets are aligning or diverging in their trends. The indicator also allows for optional advanced metric tables, which can supply further context on risk, ROI calculations, or other factors for supported assets. Overall, the script’s purpose is to organize multiple layers of technical analysis so that users have a structured way to evaluate potential trade opportunities and market behavior.
## Usage Guide
Below is an outline of how you can utilize the various components and features of Uptrick: Oscillator Spectrum in your charting workflow.
---
### 1. Using the Core Oscillator
- Basic View: By default, the script calculates a multi-timeframe oscillator (commonly displayed as the “Ultimate Oscillator”). This oscillator combines short-, medium-, and long-term measurements of buying pressure and true range.
- Overbought/Oversold Zones: You can configure thresholds (e.g., 70 for overbought, 30 for oversold) to help identify potential turning points. When the oscillator crosses these levels, it may indicate that price is extended in one direction.
- You can use the colors of the main oscillator to help you take short-term trades as well: cyan : Buy , red: Sell
- Alerts: If you enable alerts, the indicator can notify you when the oscillator crosses above or below your chosen overbought/oversold boundaries or when you get buy/sell signals.
---
### 2. Buy/Sell Signals in Overlay Modes
Uptrick: Oscillator Spectrum provides several signal modes and a choice between overlay true and overlay false or both. Additionally, you can pick which “line” (data source) the script uses to generate signals. This is set in the “Line to Analyze” dropdown, which includes Oscillator, HMA of Oscillator, and Moving Average. The following sections describe how each piece fits together.
---
#### Line to Analyze - Overlay Flase: Oscillator / HMA of Oscillator / Moving Average
1. Oscillator
- The core momentum reading, reflecting short-, medium-, and long-term periods combined.
2. HMA of Oscillator
- Applies a Hull Moving Average to the oscillator, creating a smoother but still responsive curve.
- Signals will be derived from this smoothed line. Some traders find it filters out minor fluctuations while remaining quicker to react than standard averages.
3. Moving Average
- Uses a user-selected MA type (SMA, EMA, WMA, etc.) over the oscillator values, rather than the raw oscillator itself.
- Tends to be more stable than the raw oscillator, but might delay signals more depending on the chosen MA settings.
---
#### Signal Modes
Regardless of which line you choose to analyze, you can use one of the following seven signal modes in overlay being true:
1. Overbought/Oversold (Pyramiding)
- What It Does:
- Buy signal when the chosen line crosses below the oversold threshold.
- Sell signal when it crosses above the overbought threshold.
- Pyramiding:
- Allows multiple triggers within the same overbought/oversold event.
2. Overbought/Oversold (Non Pyramiding)
- What It Does:
- Same thresholds but only one signal per oversold or overbought event.
- Use Case:
- Prevents repeated signals and chart clutter.
3. Smoothed MA Middle Crossover
- What It Does:
- Uses an MA defined by the user.
- Buy when crossing above the midpoint (50), Sell when crossing below.
- Use Case:
- Generates fewer signals, focusing on broader momentum shifts. There is no pyramiding.
In this image ,for example, the VWMA is used with length of 14 to identify buy sell signals.
4. Crossing Above Overbought/Below Oversold (Non Pyramiding)
- What It Does:
- Buy occurs if the line exits oversold territory by crossing back above it.
- Sell occurs if the line exits overbought territory by crossing back below it.
- Non Pyramiding:
- Restricts repeated signals until conditions reset.
5. Crossing Above Overbought/Below Oversold (Pyramiding)
- What It Does:
- Same thresholds, but allows multiple signals if the line repeatedly dips in and out of overbought or oversold.
- Use Case:
- More frequent entries/exits for active traders.
6. Divergence (Non Pyramiding)
- What It Does:
- Identifies bullish or bearish divergences using the chosen line vs. price.
- Buy for bullish divergence (higher low on the line vs. lower low on price), Sell for bearish divergence.
- Single Trigger:
- Only one signal per identified divergence event. (non pyramiding)
7. Divergence (Pyramiding)
- What It Does:
- Same divergence logic but triggers multiple times if the script sees repeated divergence in the same direction.
- Use Case:
- Could suit traders who layer positions during sustained divergence scenarios.
#### Overlay Modes: True vs. False
1. Overlay True
- Buy/sell arrows or labels plot directly on the main price chart, often at or near candlesticks.
- Bar Coloring:
- Can turn the candlestick bars green (buy) or red (sell), with intensity reflecting signal recency if bar coloring is enabled for this mode. (read below.)
- Advantage:
- Everything (price, signals, bar colors) is in one spot, making it straightforward to associate signals with current market action. You can adjust the periods of the main oscillator or lookback periods of divergences or overbought/oversold thresholds, to play around with your signals.
2. Overlay False
- Signal Placement:
- Signals appear in a sub-window or oscillator panel, leaving the main price chart uncluttered.
- Bar Coloring:
- You may still enable bar colors on the main chart (green for buy, red for sell) if desired.
- Alternatively, you can keep them neutral if you prefer a completely separate display of signals.
- Advantage:
- Clear separation of price action from signals, useful for cleaner charts or if using multiple overlay-based tools.
At the bottom are the signals for overlay being false and on the chart are the signals for overlay being true:
#### Bar Color Adjustments
1. Coloring Logic
- Bars typically go green on buy signals, red on sell signals.
- The opacity or brightness can vary to indicate signal freshness. When a new signal is formed, the color gets brighter. When there is no signal for a longer period of time, then the color slowly fades.
2. Enabling Bar Coloring
- In the indicator’s settings, turn on Bar Coloring.
- Choose “Signals Overlay True” or “Signals Overlay False” from the “Color should depend on:” dropdown, depending on which overlay approach you want to drive your bar colors. You can also chose the cloud fill in overlay false, correlation meter and smoothed HMA to color bars. Read more below:
### Bar Color Options:
When you enable bar coloring in Uptrick: Oscillator Spectrum, you can select which component or signal logic drives the color changes. Below are the five available choices:
---
#### Option 1: Overlay True Signals
- What It Does:
- Uses signals generated under the Overlay True mode to color the bars on your main chart.
- If a buy signal is triggered, bars turn green. If a sell signal occurs, bars turn red.
- Color Intensity:
- Bars appear brighter (more opaque) immediately after a new signal fires, then gradually fade over subsequent bars if no new signal appears.
---
#### Option 2: Overlay False Signals
- What It Does:
- Links bar coloring to signals generated when Overlay False mode is active.
- Buy/sell labels typically plot in a separate sub-window instead of the main chart, but your price bars can still change color based on these signals.
- Color Intensity:
- Similar to Overlay True, new buy/sell signals yield stronger color intensity, which fades over time.
- Use Case:
- Helps maintain a clean main chart (with signals off-chart) while still providing an immediate color-coded indication of a buy or sell state.
- Particularly useful if you prefer less clutter from signal markers on your price chart yet still want a visual representation of signal timing.
In this example normal divergence Pyramiding Signals are used in the overlay being true and the signals in overlay false are signals that analyze the HMA. This can help clear out noise (using a combo of both).
Option 3: Money Flow Tracker
What It Does:
The Money Flow Tracker uses the Money Flow Index (MFI), a volume-weighted oscillator, to measure the strength of money flowing into or out of an asset. The script smooths the raw MFI data using an EMA for a more responsive and visually intuitive output.
The feature also includes dynamic color gradients and bar coloring that highlight whether money flow is positive or negative.
Green Fill/Bar Color: Indicates positive money flow, suggesting potential accumulation.
Red Fill/Bar Color: Indicates negative money flow, signaling potential distribution.
Overbought and oversold thresholds are dynamically emphasized with transparency, making it easier to identify high-confidence zones.
Use Case:
Ideal for traders focusing on volume-driven sentiment to identify turning points or confirm existing trends.
Suitable for assessing broader market conditions when used alongside other indicators like oscillators or correlation analysis.
Provides additional clarity in spotting areas of accumulation or distribution, making it a valuable complement to price action and momentum studies.
---
#### Option 4: Correlation Meter
- What It Does:
- Colors the bars based on the indicator’s Correlation Meter output. The script checks multiple chosen tickers and sums up how many are trending positively or negatively.
- If the meter indicates an overall bullish bias (e.g., more than three assets in uptrend), bars turn green; if it’s bearish, bars turn red.
- Trend Readings:
- The correlation meter typically plots a histogram of bullish/neutral/bearish states. The bar color option links your chart’s candlestick coloring to that higher-level market sentiment.
- Use Case:
- Useful for traders wanting a quick visual prompt of whether the broader market (or a selection of related assets) is bullish or bearish at any given time.
- Helps avoid signals that conflict with the market majority.
#### Option 5: Smoothed HMA
- What It Does:
- Bar colors are driven by the slope or state of the Hull Moving Average (HMA) of the oscillator, rather than individual buy/sell triggers or correlation data.
- If the HMA indicates a strong upward slope (possibly darkening), bars may turn green; if the slope is downward (purple in the HMA line), bars turn red.
- Use Case:
- Ideal for those who focus on momentum continuity rather than discrete signals like overbought/oversold or divergence.
- May help identify smoother, more sustained moves, as the HMA filters out minor oscillations.
---
### 3. Using the Hull Moving Average (HMA) of the Oscillator
- HMA Calculation: You can enable a dedicated Hull Moving Average (HMA) for the oscillator. This creates a smoother line of the same underlying momentum reading, typically responding more quickly than classic moving averages.
- Color Intensity: As the HMA sustains an uptrend or downtrend, the script can adjust the line’s color. When slope momentum persists in one direction, the color appears more opaque. This intensification can hint that the existing direction may be well-established.
- Reversal Potential: If you observe the HMA color shifting or darkening after multiple bars of slope in the same direction, it may indicate increasing momentum. Conversely, a sudden flattening or change in color can be a clue that momentum is waning.
---
### 4. Moving Average Overlays & Gradient Cloud
- Oscillator MA: The script allows you to apply moving average types (SMA, EMA, SMMA, WMA, or VWMA) to the core oscillator, rather than to price. This can smooth out noise in the oscillator, potentially highlighting more consistent momentum shifts.
- Gradient Cloud: You can also enable a cloud in overlay true between two moving averages (for instance, a Hull MA and a Double EMA) on the price chart. The cloud fills with different colors, depending on which MA is above the other. This can provide a quick visual reference to bullish or bearish areas.
---
### 5. Divergence Detection
- Bullish & Bearish Divergence: By toggling “Calculate Divergence,” the script looks for oscillator pivots that contrast with price pivots (e.g., price making a lower low while the oscillator makes a higher low).
- A divergence is when the price makes an opposite pivot to the indicator value. E.g. Price makes lower low but indicator does higher low - This suggests a bullish divergence. THe opposite is for a bearish divergence.
- Visual Labels: When a divergence is found, labels (such as “Bull” or “Bear”) appear on the oscillator. This helps you see if the oscillator’s momentum patterns differ from the price movement.
- Filtering Signals: You can combine divergence signals with other features like overbought/oversold or the HMA slope to refine potential entries or exits.
---
### 6. Correlation & Multi-Ticker Analysis
- Correlation Meter: You can select up to five tickers in the settings. The script calculates a slope-based metric for each, then combines those metrics to show an overall bullish or bearish tendency (displayed as a histogram).
- Bar Coloring & Overlay: If you activate correlation-based bar coloring, it will reflect the broader trend alignment among the selected assets, potentially indicating when most are trending in the same direction.
- Use Case: If you trade multiple markets, the correlation histogram can help you quickly see if several major assets support the same market bias or are diverging from one another.
—
### 7. Money Flow Tracker
Money Flow Calculation: The Money Flow Tracker calculates the Money Flow Index (MFI) based on price and volume data, factoring in buying pressure and selling pressure. The output is smoothed using a low-lag EMA to reduce noise and enhance usability.
Visual Features:
Dynamic Gradient Fill:
The space between the smoothed MFI line and the midline (set at 50) is filled with a gradient.
Above 50: Green gradient, with intensity increasing as the MFI moves further above the midline.
Below 50: Red gradient, with intensity increasing as the MFI moves further below the midline.
This gradient provides a clear visual representation of money flow strength and direction, making it easier to assess sentiment shifts at a glance.
Overbought/Oversold Levels: Default thresholds are set at 70 (overbought) and 30 (oversold). When the MFI crosses these levels, it signals potential reversals or trend continuations.
Bar Coloring:
Bars turn green for positive money flow and red for negative money flow.
Color intensity fades over time, ensuring recent signals stand out while older ones remain visible without dominating the chart.
Alerts:
Alerts are triggered when the Money Flow Tracker crosses into overbought or oversold zones, keeping traders informed of critical conditions without constant monitoring.
Practical Applications:
Trend Confirmation: Use the Money Flow Tracker alongside the oscillator or HMA to confirm trends or identify potential reversals.
Volume-Based Reversal Signals: Spot turning points where price action aligns with shifts in money flow direction.
Sentiment Analysis: Gauge whether market participants are accumulating (positive flow) or distributing (negative flow) assets, offering an additional layer of insight into price movement.
(Space for an example chart: “Money Flow Tracker with gradient fills and overbought/oversold levels”)
### 8. Putting It All Together
- Combining Signals: A practical approach might be to watch for a bullish divergence in the oscillator, confirm it with a shift in the HMA slope color, and then wait for the price to be near or below oversold conditions. The correlation histogram may further confirm if the broader market is also leaning bullish at that time.
- Visual Cues: Bar coloring adds another layer, making your chart easier to interpret at a glance. You can also set alerts to ensure you don’t miss key events like divergences, crossovers, or moving average flips.
- Flexibility: Not every feature needs to be used simultaneously. You might opt to focus on divergences and overbought/oversold signals, or you could emphasize the correlation histogram and bar colors. The settings let you enable or disable each module to suit your style.
---
### 9. Tips for Customization
- Adjust Periods: Shorter periods can yield more signals but also more noise. Longer periods may provide steadier, but fewer, signals.
- Set Appropriate Alert Conditions: Only alert on events most relevant to your strategy to avoid overload.
- Explore Different MAs: Depending on the instrument, some moving average types may give a smoother or more responsive indication.
- Monitor Risk Management: As with any tool, these signals do not guarantee performance, so consider position sizing and stop-loss strategies.
---
By toggling and experimenting with the features described above—buy/sell signals, divergences, moving averages, dynamic gradient clouds, and correlation analysis—you can tailor Uptrick: Oscillator Spectrum to your specific trading approach. Each module is designed to give you a clearer, structured view of potential momentum shifts, overbought or oversold states, and the alignment or divergence of multiple assets.
## Features Explanation
Below is a detailed overview of key features in Uptrick: Oscillator Spectrum. Each component is designed to provide different angles of market analysis, allowing you to customize the tool to your preferences.
---
### 1. Main Oscillator
- Purpose: The primary oscillator in this script merges short-, medium-, and long-term views of buying pressure and true range into a single line.
- Calculation: It weights each period’s contribution (e.g., a heavier focus on the short period if desired) and normalizes the result on a 0–100 scale, where higher readings may suggest more robust momentum. (like from the classic Ultimate Oscillator)
- Practical Use:
- Traders can watch for overbought/oversold conditions at user-defined thresholds (e.g., 70/30).
- It can also provide a straightforward momentum reading for those who prefer to see if momentum is rising, falling, or leveling off.
---
### 2. HMA of the Smoothed Oscillator
- What It Is: A Hull Moving Average (HMA) applied to the main oscillator values. The HMA is often more responsive than standard MAs, offering smoother lines while preserving relatively quick reaction to changes.
- How It Works:
- The script takes the oscillator’s output and processes it through a Hull MA calculation.
- The HMA’s slope and color can change more dynamically, highlighting sharper momentum shifts.
- Why It’s Useful:
- By smoothing out minor fluctuations, the HMA can highlight trends in the oscillator’s trajectory.
- If you see an extended run in the HMA slope, it may indicate a more persistent trend in momentum.
- Color Intensity:
- As the HMA continues in one direction for several bars, the script can intensify the color, signaling stronger or more sustained momentum in that direction.
- Sudden changes in color or slope can signal the start of a new momentum swing.
---
### 3. Gradient Fill
This script uses two gradient-based visual elements:
1. Shining/Layered Gradient on the Main Oscillator
- Purpose: Adds multiple layers around the oscillator line (above and below) to emphasize slope changes and highlight how quickly the oscillator is moving up or down.
- Color Changes:
- When the oscillator rises, it uses a color scheme (e.g., aqua/blue) that intensifies as the slope grows.
- When the oscillator declines, it uses a distinct color (e.g., red/pink).
- User Benefit: Makes it easier to see at a glance if momentum is accelerating or decelerating, beyond just the numerical reading.
2. Dynamic Cloud Fill (Between MAs)
- Purpose: Allows you to plot two moving averages (for example, a short-term Hull MA and a longer-term DEMA) and fill the area between them with a color gradient.
- Bullish vs. Bearish:
- When the short MA is above the long MA, the cloud might appear in a greenish hue.
- When the short MA is below the long MA, the cloud can switch to red or another color.
- Transparency/Intensity:
- The fill can get more opaque if the difference between the two MAs is large, indicating a stronger trend but a higher probability of a reversal.
- User Benefit: Helps visualize changes in trend or momentum across multiple time horizons, all within a single chart overlay.
---
### 4. Correlation Meter & Symbol Inputs
- What It Is: This feature looks at multiple user-selected symbols (e.g., BTC, ETH, BNB, etc.) and computes each symbol’s short-term slope. It then aggregates these slopes into an overall “trend” score.
- Inputs Configuration:
1. Ticker Inputs: You can specify up to five different tickers.
2. Timeframe: Decide whether to pull data from different chart timeframes for each symbol.
3. Slope Calculation: The script may compute, for instance, a 5-period SMA minus a 20-period SMA to gauge if each symbol is trending up or down.
- Market Trend Histogram:
- Displays a column that goes above/below zero depending on how many symbols are bullish or bearish.
- If more than three (out of five) symbols are bullish, the histogram can show a green bar at +1; if fewer than three are bullish, it can show red at –1.
- How to Use:
- Quick Glance: Lets you know if most correlated assets are aligning or diverging.
- Bar Coloring (Optional): If enabled, your main chart’s bars can reflect the aggregated correlation, turning green or red depending on the meter’s reading.
---
### 5. Advanced Metrics Table
- What It Is: An optional table displaying additional metrics for several cryptocurrencies (or any symbols you define).
- Metrics Included:
1. ROI (30D): Calculates return relative to the lowest price in a 30-day period.
2. Collateral Risk: Uses standard deviation to assess volatility (higher risk if standard deviation is large).
3. Liquidity Recovery: A rolling average of volume, aiming to show how liquidity flows might recover over time.
4. Weakening (Rate of Change): Reflects how quickly price is changing compared to previous bars.
5. Monetary Bias (SMA): A simple average of recent prices. If price is below this SMA, it might be seen as undervalued relative to the short term.
6. Risk Phase: Categorizes risk as low, medium, or high based on the standard deviation figure.
7. DCA Signal: Suggests “Accumulate” or “Do Not Accumulate” by checking if the current price is below or above the SMA.
- Why It’s Useful:
- Offers a concise view of multiple assets in one place—helpful for portfolio-level insight.
- DCA (Dollar-Cost Averaging) suggestions can guide longer-term strategies, while volatility (collateral risk) helps gauge how aggressive the price swings might be.
---
### 6. Other Vital Aspects
- Alerts & Notifications:
- The script can trigger alerts for various conditions—crossovers, divergence detections, overbought/oversold transitions, or correlation-based signals.
- Useful for automating watchlists or ensuring you don’t miss a key setup while away from the screen.
- Customization:
- Each module (oscillator settings, divergence detection, correlation meter, advanced metrics table, etc.) can be enabled or disabled based on your preferences.
- You can fine-tune parameters (e.g., periods, smoothing lengths, alert triggers) to align the indicator with different trading styles—scalping, swing, or position trading.
- Combining Features:
- One might watch the main oscillator for momentum extremes, confirm via the HMA slope, check if correlation supports the same bias, and look at the table for risk-phase validation.
- This multi-layer approach can help develop a more structured and informed trading view.
(Space for an example chart: “A fully configured layout showing oscillator, HMA, gradient cloud, correlation meter, and table all in use.”)
7. Money Flow Tracker
Purpose: The Money Flow Tracker adds a volume-based perspective to the indicator suite by incorporating the Money Flow Index (MFI), which assesses buying and selling pressure over a defined period. By smoothing the MFI using an exponential moving average (EMA), the feature highlights the directional flow of capital into and out of the market with greater clarity and reduced noise.
Dynamic Gradient Visualization:
The Money Flow Tracker enhances visual analysis with gradient fills that reflect the MFI’s relationship to the midline (50).
Above 50: A green gradient emerges, intensifying as the MFI moves higher, indicating stronger positive money flow.
Below 50: A red gradient appears, with deeper shades signifying increasing selling pressure.
Transparency dynamically adjusts based on the MFI’s proximity to the midline, making high-confidence zones (closer to 0 or 100) visually distinct.
Directional Sensitivity:
The Tracker emphasizes the importance of overbought (above 70) and oversold (below 30) zones. These thresholds help traders identify when an asset might be overextended, signaling potential reversals or trend continuations.
The inclusion of a midline (50) as a neutral zone helps gauge shifts between accumulation (money flowing in) and distribution (money flowing out).
Bar Integration:
By enabling bar coloring linked to the Money Flow Tracker, traders can visualize its impact directly on price bars.
Green bars reflect positive money flow (above 50), signaling bullish conditions.
Red bars indicate negative money flow (below 50), highlighting bearish sentiment.
Intensity adjustments ensure that recent signals are more visually prominent, while older signals gradually fade for a clean, non-cluttered chart.
Key Advantages:
Volume-Informed Context: Traditional oscillators often focus solely on price; the Money Flow Tracker incorporates volume, adding a crucial dimension for analyzing market behavior.
Adaptive Filtering: The EMA-smoothing feature ensures that sudden, insignificant spikes in volume don’t trigger false signals, providing a clearer and more actionable representation of money flow trends.
Early Warning System: Divergences between price movement and the Money Flow Tracker’s trends can signal potential turning points, helping traders anticipate reversals before they occur.
Practical Use Cases:
Trend Confirmation: Pair the Money Flow Tracker with the oscillator or HMA to confirm bullish or bearish trends. For example, a rising oscillator with positive money flow indicates strong buying interest.
Identifying Entry/Exit Zones: Use overbought/oversold conditions as entry/exit points, particularly when combined with other features like divergence detection.
Market Sentiment Analysis: The Tracker’s ability to dynamically assess buying and selling pressure provides a clear picture of market sentiment, helping traders adjust their strategies to align with broader trends.
By understanding these features—main oscillator readings, the HMA’s smoothing capabilities, gradient-based visual highlights, correlation insights, advanced metrics, and the money flow tracker—you can tailor Uptrick: Oscillator Spectrum to your specific needs, whether you’re focusing on quick trades, longer-term market moves, or broad portfolio health.
Originality of the “Uptrick: Oscillator Spectrum” Indicator
While it includes elements of standard momentum analysis, Uptrick: Oscillator Spectrum sets itself apart by adding an array of features that broaden the typical oscillator’s scope:
1. Slope Coloring & Layered Gradient Effects
- Beyond just plotting a single line, the indicator visually highlights momentum shifts using color changes and gradient fills.
- As the oscillator’s slope becomes steeper or flatter, these gradients intensify or fade, helping users see at a glance when momentum is accelerating, slowing, or reversing.
2. Mean Reversion & Divergence Detection
- The script offers optional logic for marking potential mean reversion points (e.g., overbought/oversold crossovers) and flagging divergences between price and the oscillator line.
- These divergence signals come with adjustable lookback parameters, giving traders control over how recent or extended the pivots should be for detection.
- This functionality can reveal subtle momentum discrepancies that a basic oscillator might overlook.
3. Integrated Multi-Asset Correlation Meter
- In addition to monitoring a single symbol, the indicator can fetch data for multiple tickers. It aggregates each symbol’s slope into a histogram showing whether the broader market (or a group of assets) leans bullish or bearish.
- This cross-market insight moves beyond standard “one-symbol, one-oscillator” usage, adding a bigger-picture perspective in one tool.
4. Advanced Metrics Table
- Users can enable a table that covers ROI calculations, volatility-based risk (“Collateral Risk”), liquidity checks, DCA signals, and more.
- Rather than just seeing an oscillator value, traders can view additional metrics for selected assets in one place, helping them judge overall market conditions or assess multiple instruments simultaneously.
5. Flexible Overlay & Bar Coloring
- Signals can be displayed directly on the price chart (Overlay True) or in a sub-window (Overlay False).
- Bars themselves may change color (e.g., green for bullish or red for bearish) according to different rules—signals, dynamic cloud fill, correlation meter states, etc.
- This adaptability allows traders to keep the chart as simple or as info-rich as they prefer.
6. Custom Smoothing Options & HMA Extensions
- The oscillator can be processed further with a Hull Moving Average (HMA) to reduce noise while still reacting quickly to market changes.
- Slope-based coloring on the HMA provides an additional layer of visual feedback, which is not common in a standard oscillator.
By blending traditional momentum checks with slope-based color feedback, mean reversion triggers, divergence signals, correlation analysis, and an optional metrics table, Uptrick: Oscillator Spectrum offers a more rounded approach than a typical oscillator. It integrates multiple market insights—both visual and analytical—into one script, giving users a broader toolkit for studying potential reversals, gauging momentum strength, and assessing multi-asset trends.
## Conclusion
Uptrick: Oscillator Spectrum brings together multiple layers of analysis—oscillator momentum, divergence detection, correlation insights, HMA smoothing, and more—into one adaptable toolkit. It aims to streamline your charting process by offering meaningful visual cues (such as gradient fills and bar color shifts), advanced tables for broader market data, and flexible alerts to keep you informed of potential setups.
Traders can choose the specific features that suit their style, whether they prefer to focus on raw oscillator signals, multi-ticker correlation, or smooth trend cues from the HMA. By centralizing these different methods in one place, Uptrick: Oscillator Spectrum can help users build more structured approaches to spotting trend shifts and extended conditions, while also remaining compatible with additional analysis techniques.
---
### Disclaimer
This script is provided for informational purposes only and does not constitute financial or investment advice. Past performance is not indicative of future results, and all trading involves risk. You should carefully consider your objectives, risk tolerance, and financial situation before making any trading decisions.

Supertrend StatsSupertrend with Probabilistic Stats and MA Filter
Overview: The Supertrend with Probabilistic Stats and MA Filter is a comprehensive TradingView Pine Script indicator designed to enhance trading strategies by combining the trend-detection capabilities of the Supertrend indicator with the trend-confirmation strength of Moving Averages (MA). Additionally, it offers robust statistical tracking to provide traders with valuable insights into the performance and reliability of their trading signals.
Key Features:
Supertrend Indicator Integration:
Trend Detection: Utilizes the Supertrend algorithm to identify prevailing market trends.
Buy/Sell Signals: Generates clear buy and sell signals based on trend reversals.
Customizable Parameters: Allows adjustment of ATR period and multiplier to suit different trading styles and market conditions.
Visual Aids: Plots Supertrend lines on the chart and highlights trend areas for easy visualization.
Moving Average (MA) Filter:
Trend Confirmation: Filters buy signals to occur only when the open price is above the MA and sell signals only when the open price is below the MA.
Customizable MA Types: Supports various MA types, including SMA, EMA, SMMA (RMA), WMA, and VWMA.
Flexible Configuration: Offers options to enable/disable the MA filter, select MA type, set MA length, and adjust MA source and offset.
Statistical Tracking:
Trimmed Mean Calculation: Computes trimmed means for bullish and bearish movements, removing outliers to provide a more accurate average movement.
Success Rate Metrics: Calculates the success rates (%) for both bullish and bearish signals, indicating the percentage of signals that resulted in favorable price movements.
Candle Count Analysis: Tracks the average number of candles each bullish and bearish move lasts, offering insights into the duration of trends.
Data Visualization: Presents all statistical data in a neatly formatted table on the chart, allowing for quick reference and analysis.
Customizable Statistics Table:
Text Color Customization: Provides an option to change the table text color to match personal preferences or chart aesthetics, enhancing readability.
Comprehensive Metrics: Displays key statistics such as Bullish/Bearish Averages, Counts, Success Rates, and Average Candle Counts.
Optional Pinbar Filtering:
Signal Refinement: Adds an additional layer of signal confirmation by filtering buy and sell signals based on pinbar candlestick patterns.
Adjustable Thresholds: Allows customization of the pinbar wick threshold to fine-tune signal accuracy.
Visual Enhancements:
Markers: Optionally displays markers on the first and last candles of bullish and bearish moves for better trend identification.
Highlighter: Shades the chart background to indicate current trend direction, aiding in visual trend recognition.
How It Works:
Trend Identification with Supertrend:
The indicator calculates the Supertrend based on user-defined ATR periods and multipliers.
It plots the Supertrend lines and generates buy/sell signals when the price crosses these lines, indicating a potential trend reversal.
Filtering Signals with Moving Average:
When the MA filter is enabled, the indicator ensures that buy signals are only considered valid if the candle's open price is above the selected MA, and sell signals only if the open price is below the MA.
This additional confirmation aligns trades with the broader market trend, potentially increasing signal reliability.
Statistical Analysis:
Upon triggering a buy or sell signal, the indicator records the entry price and tracks the subsequent price movements.
It calculates trimmed means to assess average movements while excluding extreme outliers.
Success rates are computed by comparing the closing price against the entry price, indicating how often signals result in favorable outcomes.
The average number of candles per move provides insight into trend duration and volatility.
Visualization and Customization:
All statistical data is presented in a table on the chart, with customizable text colors for enhanced readability.
Optional pinbar filtering and visual markers further refine and illustrate trading signals, aiding in decision-making.
Benefits to Traders:
Enhanced Signal Reliability:
By combining Supertrend with an MA filter, the indicator ensures that only signals aligning with the broader market trend are considered, potentially reducing false signals.
Data-Driven Decision Making:
The comprehensive statistical tracking offers traders insights into the performance of their signals, enabling informed adjustments to their trading strategies based on empirical data.
Trend Confirmation and Alignment:
The MA filter acts as a trend confirmation tool, ensuring that trades are placed in the direction of the prevailing trend, which can enhance the probability of successful trades.
Performance Metrics at a Glance:
The statistics table provides all necessary performance metrics in a single view, allowing traders to quickly assess the effectiveness of their strategy without sifting through extensive data.
Customization and Flexibility:
With options to adjust MA types, lengths, and table text colors, traders can tailor the indicator to fit their specific preferences and trading environments.
Visual Clarity and Aids:
The plotted Supertrend lines, MA line, signal markers, and highlighter enhance visual clarity, making it easier to identify trends and potential trade opportunities on the chart.
Usage Instructions:
Adding the Indicator:
Copy the Script: Select and copy the entire Pine Script provided.
Open TradingView: Navigate to TradingView and open your desired asset's chart.
Access Pine Editor: Click on the Pine Editor tab at the bottom of the TradingView interface.
Paste and Add to Chart: Paste the script into the editor and click "Add to Chart" to apply the indicator.
Configuring Settings:
Supertrend Parameters: Adjust the ATR period and multiplier to suit your trading style and the asset's volatility.
MA Filter Settings:
Enable MA Filter: Toggle "Enable MA Filter?" to ON to activate the filter.
Select MA Type: Choose from SMA, EMA, SMMA (RMA), WMA, or VWMA.
Set MA Length: Define the period for the MA calculation.
MA Source and Offset: Choose the price source (default is close) and set any desired plot offset.
Statistical Tracking:
Trimmed Mean Percentage: Set the percentage to trim outliers in mean calculations.
Show Cross Markers: Toggle to display or hide markers on the first and last candles of bullish and bearish moves.
Table Customization:
Table Text Color: Select your preferred text color for the statistics table to match your chart's theme or enhance readability.
Pinbar Filtering (Optional):
Enable Pinbar Filtering: Toggle to refine signals based on pinbar patterns.
Set Pinbar Wick Threshold: Adjust the threshold to define the characteristics of a valid pinbar.
Interpreting the Indicators:
Buy/Sell Signals: Look for labeled "BUY" and "SELL" signals on the chart that align with Supertrend reversals and MA conditions.
Statistics Table: Refer to the table located at the bottom right of the chart to assess:
Bullish/Bearish Averages: Average price movements following signals.
Counts: Total number of bullish and bearish signals.
Success Rates (%): Percentage of signals that resulted in profitable trades.
Candle Averages: Average duration of bullish and bearish moves in terms of candle counts.
Markers and Highlighter: Utilize visual markers and shaded trend areas to better understand market trends and the context of each signal.
Making Informed Decisions:
Assess Signal Performance: Use the success rates and averages to evaluate the effectiveness of your current settings and make necessary adjustments.
Adjust Parameters: Modify Supertrend and MA parameters based on observed performance and changing market conditions to optimize signal accuracy.
Combine with Other Analysis: Integrate insights from this indicator with other technical analysis tools and fundamental factors to form a holistic trading strategy.
Conclusion: The Supertrend with Probabilistic Stats and MA Filter indicator offers a powerful combination of trend detection, signal filtering, and statistical analysis. By providing detailed performance metrics and ensuring that trades align with the broader market trend, this indicator empowers traders to make more informed, data-driven decisions. Whether you're a novice seeking clarity or an experienced trader aiming to refine your strategy, this tool serves as a valuable asset in your trading toolkit.
If you have any further questions or require additional customizations, feel free to reach out!
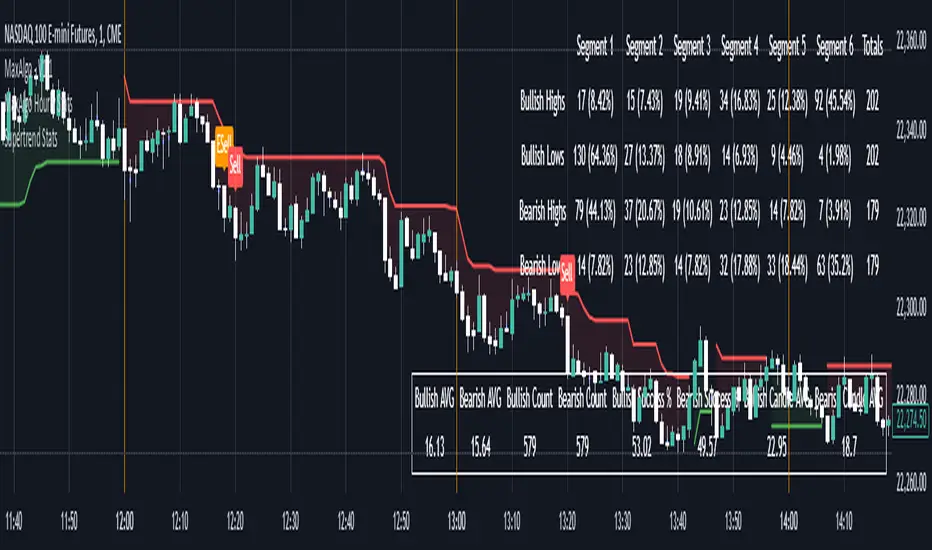
Weekly H/L DOTWThe Weekly High/Low Day Breakdown indicator provides a detailed statistical analysis of the days of the week (Monday to Sunday) on which weekly highs and lows occur for a given timeframe. It helps traders identify recurring patterns, correlations, and tendencies in price behavior across different days of the week. This can assist in planning trading strategies by leveraging day-specific patterns.
The indicator visually displays the statistical distribution of weekly highs and lows in an easy-to-read tabular format on your chart. Users can customize how the data is displayed, including whether the table is horizontal or vertical, the size of the text, and the position of the table on the chart.
Key Features:
Weekly Highs and Lows Identification:
Tracks the highest and lowest price of each trading week.
Records the day of the week on which these events occur.
Customizable Table Layout:
Option to display the table horizontally or vertically.
Text size can be adjusted (Small, Normal, or Large).
Table position is customizable (top-right, top-left, bottom-right, or bottom-left of the chart).
Flexible Value Representation:
Allows the display of values as percentages or as occurrences.
Default setting is occurrences, but users can toggle to percentages as needed.
Day-Specific Display:
Option to hide Saturday or Sunday if these days are not relevant to your trading strategy.
Visible Date Range:
Users can define a start and end date for the analysis, focusing the results on a specific period of interest.
User-Friendly Interface:
The table dynamically updates based on the selected timeframe and visibility of the chart, ensuring the displayed data is always relevant to the current context.
Adaptable to Custom Needs:
Includes all-day names from Monday to Sunday, but allows for specific days to be excluded based on the user’s preferences.
Indicator Logic:
Data Collection:
The indicator collects daily high, low, day of the week, and time data from the selected ticker using the request.security() function with a daily timeframe ('D').
Weekly Tracking:
Tracks the start and end times of each week.
During each week, it monitors the highest and lowest prices and the days they occurred.
Weekly Closure:
When a week ends (detected by Sunday’s daily candle), the indicator:
Updates the statistics for the respective days of the week where the weekly high and low occurred.
Resets tracking variables for the next week.
Visible Range Filter:
Only processes data for weeks that fall within the visible range of the chart, ensuring the table reflects only the visible portion of the chart.
Statistical Calculations:
Counts the number of weekly highs and lows for each day.
Calculates percentages relative to the total number of weeks in the visible range.
Dynamic Table Display:
Depending on user preferences, displays the data either horizontally or vertically.
Formats the table with proper alignment, colors, and text sizes for easy readability.
Custom Value Representation:
If set to "percentages," displays the percentage of weeks a high/low occurred on each day.
If set to "occurrences," displays the raw count of weekly highs/lows for each day.
Input Parameters:
High Text Color:
Color for the text in the "Weekly High" row or column.
Low Text Color:
Color for the text in the "Weekly Low" row or column.
High Background Color:
Background color for the "Weekly High" row or column.
Low Background Color:
Background color for the "Weekly Low" row or column.
Table Background Color:
General background color for the table.
Hide Saturday:
Option to exclude Saturday from the analysis and table.
Hide Sunday:
Option to exclude Sunday from the analysis and table.
Values Format:
Dropdown menu to select "percentages" or "occurrences."
Default value: "occurrences."
Table Position:
Dropdown menu to select the table position on the chart: "top_right," "top_left," "bottom_right," "bottom_left."
Default value: "top_right."
Text Size:
Dropdown menu to select text size: "Small," "Normal," "Large."
Default value: "Normal."
Vertical Table Format:
Checkbox to toggle the table layout:
Checked: Table displays days vertically, with Monday at the top.
Unchecked: Table displays days horizontally.
Start Date:
Allows users to specify the starting date for the analysis.
End Date:
Allows users to specify the ending date for the analysis.
Use Cases:
Day-Specific Pattern Recognition:
Identify if specific days, such as Monday or Friday, are more likely to form weekly highs or lows.
Seasonal Analysis:
Use the start and end date filters to analyze patterns during specific trading seasons.
Strategy Development:
Plan day-based entry and exit strategies by identifying recurring patterns in weekly highs/lows.
Historical Review:
Study historical data to understand how market behavior has changed over time.
TradingView TOS Compliance Notes:
Originality:
This script is uniquely designed to provide day-based statistics for weekly highs and lows, which is not a common feature in other publicly available indicators.
Usefulness:
Offers practical insights for traders interested in understanding day-specific price behavior.
Detailed Description:
Fully explains the purpose, features, logic, input settings, and use cases of the indicator.
Includes clear and concise details on how each input works.
Clear Input Descriptions:
All input parameters are clearly named and explained in the script and this description.
No Redundant Functionality:
Focused specifically on tracking weekly highs and lows, ensuring the indicator serves a distinct purpose without unnecessary features.

Export Candles DataThis program is written in Pine Script (version 5) and is designed to retrieve candlestick data (open, high, low, and close prices) from the TradingView chart. The data is displayed in a table located in the upper right corner of the chart.
Main Functions of the Program:
Retrieving candlestick data: The program processes data for the last 10 candlesticks on the selected timeframe (e.g., hourly, minute, etc.) in the TradingView chart. For each candlestick, it retrieves:
Time of the candle's close
Opening price
Highest price during the period
Lowest price during the period
Closing price
Displaying data in a table: The data is presented in a compact table located in the upper right corner of the chart. The table contains 5 columns:
Time of the candle's close (formatted as yyyy-MM-dd HH:mm)
Opening price
Highest price
Lowest price
Closing price
Clearing the table every 50 bars: To prevent the table from becoming overloaded, it clears itself every 50 bars, starting from the first row and first column.
Data updates dynamically: The table dynamically updates, displaying the latest 10 candles, allowing traders to track current market changes.
Application:
This indicator is useful for traders who want a quick view of key candlestick parameters directly on the chart.
The indicator can be easily applied to any instrument or index in TradingView, such as the IMOEX index.
The table view makes it easy to quickly analyze market movements without needing to inspect each candle individually.
How the Program Works:
On each new bar, the program checks the current bar's index.
The program clears the table if 50 bars have passed since the last clearing.
It writes the data of the last 10 candlesticks into the table: the time of the candle's close, opening price, highest and lowest prices, and closing price.
The table updates automatically and continuously displays the latest data.
This indicator is suitable for both short-term and long-term market analysis, providing a convenient and efficient way to monitor price movements directly on the chart.
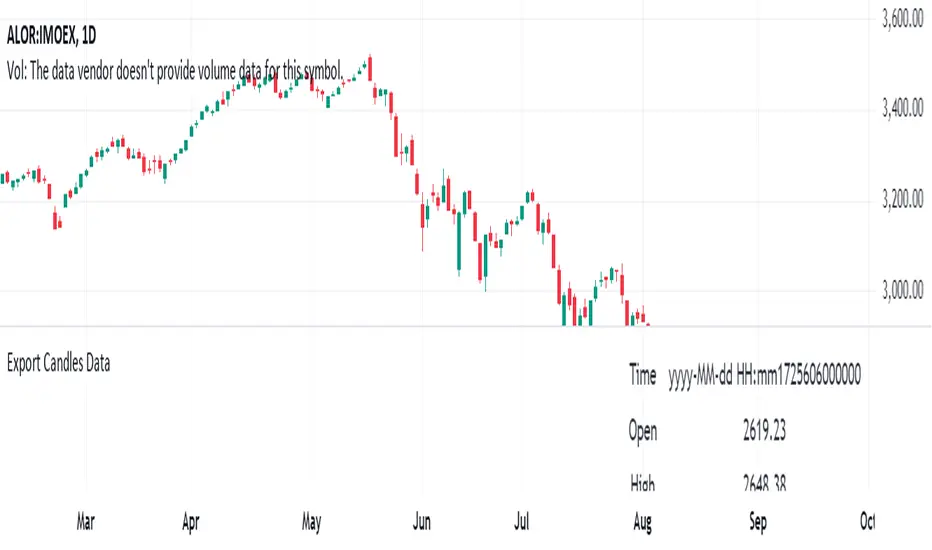
Volume Indıcator [JP & Dia]The volume indicator refers to the total amount of a financial instrument that has been traded within a specific time frame. This can include shares, contracts, or lots. Market exchanges track and provide this data. The volume indicator is one of the oldest and most widely used indicators in trading. It is typically represented by colored columns, with green indicating up volume and red indicating down volume, along with a moving average. Unlike other indicators, the volume indicator is not based on price. A high volume suggests a strong interest in a particular instrument at its current price, while a low volume suggests the opposite.
When there is a sudden increase in trading volume, it indicates a higher likelihood of the price changing. This often occurs during news events. Strong trending movements are often accompanied by increased trading volume, which can be seen as a measure of strength. Traders would typically expect to see high buying volume at a support level and high selling volume at a resistance level. There are various ways to incorporate volume into a trading strategy, and many traders combine it with other analysis techniques.
USECASE :
Timeframe Selection: Choose the timeframe for which you want to analyze the volume.
Volume Display Options: Toggle the display of today’s, yesterday’s, and the day before yesterday’s volume data.
Text Color: Select the color for the text in the volume table.
Volume Data Retrieval: The script fetches volume data for the selected timeframe and the daily volume for the current and previous two days.
Percentage Change Calculation: Calculates the percentage change in volume between days to identify significant increases or decreases.
Volume Table: A table is created to display the volume data and percentage changes, updating in real-time with each new bar.

Checklist By TradeINskiChecklist By TradeINski
First Things First
This indicator is a supporting tool for trading momentum burst that is 2 Lynch setup by stock bee aka Pradeep Bonde.
Disclaimer: This indicator will not give any buy or sell signal. This is just a supporting tool to improve efficiency in my trading.
Apply Indicators and then open indicator settings and read the following simultaneously to understand better.
Default color settings are best suited for light themes. Which is also my personal preference.
Users can change most of the default options in settings according to their personal preference in settings.
When we open settings we can see 3 tabs that are {Inputs tab} {Style tab} {Visibility tab} each tab have its own options, Understand and use it accordingly.
Indicator will be only visible in the Daily time frame as its primary TF is daily. In the lower time frame nothing is plotted.
An indicator is plotted on an existing plane and overlaid on the existing plane.
Contents
My Checklist Lynch
Table Header Settings
Position
Size
Text Color
Background Color
“ON/OFF” Header “Text Box” “Info”
Table Content
Text Color
Background Color
“ON/OFF” R (1 - 10) “Text Box” T (1 - 10) “Text Box”
My Checklist - 2Lynch
This is the checklist I use while placing the trade just to make use of not missing anything based on predefined rules of the setup I trade.
2 - The stock should not be Up more than 2 days in a row, Minor movement can be acceptable.
L - The stock price movement should be linear, validation of established momentum
Y - Young trend in preference 1 - 3rd breakout from base
N - Narrow Range or -ve day before breakout
C - Consolidation should be narrow, linear and low volume. No more than one 4% breakdown.
H - The candle should close near high or at least 20% within when entered.
Table Headers Settings
Position - “Drop Down” with 9 different options which are self explanatory. Users can change the position of the table as per their preference.
Size - “Drop Down” with 6 different options which are self explanatory. Users can change the size of all the text printed in the table as per their preference.
Text Color - “Default Color is White” This setting is specifically only for header text. And users can change the text color of the header as per their preference.
Background Color - “Default Color is Blue” This setting is specifically only for header
background color. Users can change the background color of the header as per their preference.
“ON/OFF” Header “Text Box” “Info”
“Check Mark” - To show or hide the header that is “ON/OFF”.
“Header” - Heading of the table.
“Text Box” - Users can input as per their preference.
“Info” - Info symbol that shows short form and important note that is (Max 50 characteristics for all text boxes) .
Table Content
Text Color - “Default Color is White” This setting is specifically for table texts. And users can change the text color of the all content table texts as per their preference.
Background Color - “Default Color is black” This setting is specifically for content table texts background color. Users can change the background color of the header as per their preference.
“ON/OFF” R (1 - 10) “Text Box” T (1 - 10) “Text Box”
“Check Mark” - To show or hide the complete Row. Users have options and can change as per their preferences.
R (1-10) - “R” stands for Row and (1-10) is Number of rows available for users to enter text. Users have 10 different options.
“Text Box” - Place to enter text that users want to print on column 1 of the table.
T (1-10) - “T” stands for table and (1-10) is Number of text boxes available for users to enter text. Users have 10 different options.
“Text Box” - Place to enter text that users want to print on column 2 of the table.

YinYang TrendTrend Analysis has always been an important aspect of Trading. There are so many important types of Trend Analysis and many times it may be difficult to identify what to use; let alone if an Indicator can/should be used in conjunction with another. For these exact reasons, we decided to make YinYang Trend. It is a Trend Analysis Toolkit which features many New and many Well Known Trend Analysis Indicators. However, everything in there is added specifically for the reason that it may work well in conjunction with the other Indicators prevalent within. You may be wondering, why bother including common Trend Analysis, why not make everything unique? Ideally, we would, however, you need to remember Trend Analysis may be one of the most common forms of charting. Therefore, many other traders may be using similar Trend Analysis either through plotting manually or within other Indicators. This all boils down to Psychology; you are trading against other traders, who may be seeing some of the similar information you are, and therefore, you may likewise want to see this information. What affects their trading decisions may affect yours as well.
Now enough about Trend Analysis, what is within this Indicator, and what does it do? Well, first let’s quickly mention all of its components, then we will, through a Tutorial, discuss each individually and finally how each comes together as a cohesive whole. This Indicator features many aspects:
Bull and Bear Signals
Take Profit Signals
Bull and Bear Zones
Information Tables displaying: (Boom Meter, Bull/Bear Strength, Yin/Yang State)
16 Cipher Signals
Extremes
Pivots
Trend Lines
Custom Bollinger Bands
Boom Meter Bar Colors
True Value Zones
Bar Strength Indexes
Volume Profile
There are many things to cover within our Tutorial so let's get started, chronologically from the list above.
Tutorial:
Bull and Bear Signals:
We’ve zoomed out quite a bit for this example to help give you a broader aspect of how these Bull and Bear signals work. When a signal appears, it is displaying that there may be a large amount of Bullish or Bearish Trend Analysis occurring. These signals will remain in their state of Bull or Bear until there is enough momentum change that they change over. There are a couple Options within the Settings that dictate when/where/why these signals appear, and this example is using their default Settings of ‘Medium’. They are, Purchase Speed and Purchase Strength. Purchase Speed refers to how much Price Movement is needed for a signal to occur and Purchase Strength refers to how many verifications are required for a signal to occur. For instance:
'High' uses 15 verifications to ensure signal strength.
'Medium' uses 10 verifications to ensure signal strength.
'Low' uses 5 verifications to ensure signal strength.
'Very Low' uses 3 verifications to ensure signal strength.
By default it is set to Medium (10 verifications). This means each verification is worth 10%. The verifications used are also relevant to the Purchase Speed; meaning they will be verified faster or slower depending on its speed setting. You may find that Faster Speeds and Lower Verifications may work better on Higher Time Frames; and Slower Speeds and Higher Verifications may work better on Lower Time Frames.
We will demonstrate a few examples as to how the Speed and Strength Settings work, and why it may be beneficial to adjust based on the Time Frame you’re on:
In this example above, we’ve kept the same Time Frame (1 Day), and scope; but we’ve changed Purchase Speed from Medium->Fast and Purchase Strength from Medium-Very Low. As you can see, it now generates quite a few more signals. The Speed and Strength settings that you use will likely be based on your trading style / strategy. Are you someone who likes to stay in trades longer or do you like to swing trade daily? Likewise, how do you go about identifying your Entry / Exit locations; do you start on the 1 Day for confirmation, then move to the 15/5 minute for your entry / exit? How you trade may determine which Speed and Strength settings work right for you. Let's jump to a lower Time Frame now so you can see how it works on the 15/5 minute.
Above is what BTC/USDT looks like on the 15 Minute Time Frame with Purchase Speed and Strength set to Medium. You may note that the signals require a certain amount of movement before they get started. This is normal with Medium and the amount of movement is generally dictated by the Time Frame. You may choose to use Medium on a Lower Time Frame as it may work well, but it may also be best to change it to a little slower.
We are still on the 15 Minute Time Frame here, however we simply changed Purchase Speed from Medium->Slow. As you can see, lots of the signals have been removed. Now signals may ‘hold their ground’ for much longer. It is important to adjust your Purchase Speed and Strength Settings to your Time Frame and personalized trading style accordingly.
Above we have now jumped down to the 5 Minute Time Frame. Our Purchase Speed is Slow and our Purchase Strength is Medium. We can see it looks pretty good, although there is some signal clustering going on in the middle there. If we change our Settings, we may be able to get rid of that.
We have changed our Purchase Speed from Slow->Snail (Slowest it can go) and Purchase Strength from Medium->Very Low (Lowest it can go). Changing it from Slow-Snail helped get rid of the signal clustering. You may be wondering why we lowered the Strength from Medium->Very Low, rather than going from Medium->High. This is a use case scenario and one you’ll need to decide for yourself, but we noticed when we changed the Speed from Slow->Snail that the signal clustering was gone, so then we checked both High and Very Low for Strengths to see which produced the best looking signal locations.
Please remember, you don’t have to use it the exact way we’ve displayed in this Tutorial. It is meant to be used to suit your Trading Style and Strategy. This is why we allow you to modify these settings, rather than just automating the change based on Time Frames. You’ll likely need to play around with it, as you’ll notice different settings may work better on certain pairs and Time Frames than others.
Take Profit Signals:
We’ve reset our Purchase Settings, everything is on defaults right now at Medium. We’ve enabled Take Profit signals. As you can see there are both Take Profit signals for the Bulls and the Bears. These signals are not meant to be used within automation. In fact, none of this indicator is. These signals are meant to show there has been a strong change in momentum, to such an extent that the signal may switch from its current (Bull or Bear) and now may be a good time to Take Profit. Your Take Profit Settings likewise has a Speed and Strength, and you can set them differently than your Purchase Settings. This is in case you want to Take Profit in a different manner than your Purchase Signals. For instance:
In the example above we’ve kept Purchase Strength and Speed at Medium but we changed our Take Profit Speed from Medium->Snail and our Take Profit Strength from medium->Very Low. This greatly reduces the amount of Take Profit signals, and in some cases, none are even produced. This form of Take Profit may act more as a Trailing Take Profit that if it’s not hit, nothing appears.
In this example we have changed our Purchase Speed from Medium->Fast, our Purchase Strength from Medium->Very Low. We’ve also changed our Take Profit Speed from Snail->Medium and kept our Take Profit Strength on Very Low. Now we may get our signals quicker and likewise our Take Profit may be more rare. There are many different ways you can set up your Purchase and Take Profit Settings to fit your Trading Style / Strategy.
Bull and Bear Zones:
We have disabled our Take Profit locations so that you can see the Bull and Bear Zones. These zones change color when the Signals switch. They may represent some strong Support and Resistance locations, but more importantly may be useful for visualizing changes in momentum and consolidation. These zones allow you to see various Moving Averages; and when they start to ‘fold’ (cross) each other you may see changes in momentum. Whereas, when they’re fully stretched out and moving all in the same direction, it can provide insight that the current rally may be strong. There is also the case where they look like they’re ‘twisted’ together. This happens when all of the Moving Averages are very close together and may be a sign of Consolidation. We will go over a few examples of each of these scenarios so you can understand what we’re referring to.
In this example above, there are a few different things happening. First we have the yellow circle, where the final and slowest Moving Average (MA) crossed over and now all of the MA’s that form the zone are Bullish. You can see this in the white circle where there are no MA’s that are crossing each other. Lastly, within the blue circle, we can see how some of the faster MA’s are crossing under each other. This is a bullish momentum change. The Faster moving MA’s will always be the first ones to cross before the Slower ones do. There is a color scheme in place here to represent the Speed of the MA within the Zone. Light blue is the fastest moving Bull color -> Light Green and finally -> Dark Green. Yellow is the fastest moving Bear color -> Orange and finally -> Red / Dark Red within the Zone.
Next we will review a couple different examples of what Consolidation looks like and why it is very important to look out for. Consolidation is when Most, if not All of the MA’s are very tightly ‘twisted’ together. There is very little spacing between almost all of the MA’s in the example above; highlighted by the white circle. Consolidation is important as it may indicate a strong price movement in either direction will occur soon. When the price is consolidating it means it has had very little upwards or downwards movement recently. When this happens for long enough, MA’s may all get very similar in value. This may cause high volatility as the price tries to break out of Consolidation. Let's look at another example.
Above we have two more examples of what Consolidation looks like and how high Volatility may occur after the Consolidation is broken. Please note, not all Consolidation will create high Volatility but it is something you may want to look out for.
Information Tables displaying: (Boom Meter, Bull/Bear Strength, Yin/Yang State):
Information tables are a very important way of displaying information. It contains 3 crucial pieces of information:
Boom Meter
Bull/Bear Strength
Yin/Yang State
Boom Meter is a meter that goes from 0-100% and displays whether the current price is Dumping (0 - 29%), Consolidating (30 - 70%) or Pumping (71 - 100%). The Boom Meter is meant to be a Gauge to how the price is currently fairing. It is composed of ~50 different calculations that all vary different weights to calculate its %. Many of the calculations it uses are likewise used in other things, such as the Bull/Bear Strength, Bull/Bear Zone MA cross’, Yin/Yang State, Market Cipher Signals, RSI, Volume and a few others. The Boom Meter, although not meant to be used solely to make purchase decisions, may give you a good idea of current market conditions considering how many different things it evaluates.
Bull/Bear Strength is relevant to your Purchase Speed and Strength. It displays which state it is currently in, and the % it is within that state. When a % hits 0, is when the state changes. When states change, they always start at 100% initially and will go down at the rate of Purchase Strength (how many verifications are needed). For instance, if your Purchase Strength is set to ‘Medium’ it will move 10% per verification +/-, if it is set to High, it will move 6.67% per verification +/-. Bull/Bear Strength is a good indicator of how well that current state is fairing. For instance if you started a Long when the state changed to Bull and now it is currently at Bull with 20% left, that may be a good indication it is time to get out (obviously refer to other data as well, but it may be a good way to know that the state is 20% away from transitioning to Bear).
Yin/Yang State is the strongest MA cross within our Indicator. It is unique in the sense that it is slow to change, but not so much that it moves slowly. It isn’t as simple as say a Golden/Death Cross (50/200), but it crosses more often and may hold similar weight as it. Yin stands for Negative (Bearish) and Yang stands for Positive (Bullish). The price will always be in either a state of Yin or Yang, and just because it is in one, doesn’t mean the price can’t/won’t move in the opposite direction; it simply means the price may be favoring the state it is in.
16 Cipher Signals:
Cipher Signals are key visuals of MA cross’ that may represent price movement and momentum. It would be too confusing and hard to decipher these MA’s as lines on a chart, and therefore we decided to use signals in the form of symbols instead. There are 12 Standard and 4 Predictive/Confirming Cipher signals. The Standard Cipher signals are composed of 6 Bullish and 6 Bearish (they all have opposites that balance each other out). There can never be 2 of the same signal in a row, as the Bull and Bear cancel each other out and it's always in a state of one or the other. When all 6 Bullish or Bearish signals appear in a row, very closely together, without any of the opposing signals it may represent a strong momentum movement is about to occur.
If you refer to the example above, you’ll see that the 6 Bullish Cipher signals appeared exactly as mentioned above. Shortly after the Green Circle appeared, there was a large spike in price movement in favor of the Bulls. Cipher signals don’t need to appear in a cluster exactly like the white circle in this photo for momentum to occur, but when it does, it may represent volatility more than if it is broken up with opposing signals or spaced out over a longer time span.
Above is an example of the opposite, where all 6 Bearish Cipher signals appeared together without being broken by a Bullish Cipher signal or being too far spaced out. As you can see, even though past it there was a few Bullish signals, they were quickly reversed back to Bearish before a large price movement occurred in favor of the Bears.
In the example above we’ve changed Cipher signals to Predictive and Confirming. Support Crosses (Green +) and Blood Diamonds (Red ♦) are the normal Cipher Signals that appear within the Standard Set. They are the first Cipher Signal that appears and are the most common ones as well. However, just because they are the first, that doesn’t mean they aren’t a powerful Cipher signal. For this reason, there are Predictive and Confirming Cipher signals for these. The Predictive do just that, they appear slightly sooner (if not the same bar) as the regular and the Confirming appear later (1+ bars usually). There will be times that the Predictive appears, but it doesn’t resort to the Regular appearing, or the Regular appears and the Confirming doesn’t. This is normal behavior and also the purpose of them. They are meant to be an indication of IF they may appear soon and IF the regular was indeed a valid signal.
Extremes:
Extremes are MA’s that have a very large length. They are useful for seeing Cross’ and Support and Resistance over a long period of time. However, because they are so long and slow moving, they might not always be relevant. It’s usually advised to turn them on, see if any are close to the current price point, and if they aren’t to turn them off. The main reason being is they stretch out the chart too much if they’re too far away and they also may not be relevant at that point.
When they are close to the price however, they may act as strong Support and Resistance locations as circled in the example above.
Pivots:
Pivots are used to help identify key Support and Resistance locations. They adjust on their own in an attempt to keep their locations as relevant as possible and likewise will adjust when the price pushes their current bounds. They may be useful for seeing when the Price is currently testing their level as this may represent Overbought or Oversold. Keep in mind, just because the price is testing their levels doesn’t mean it will correct; sometimes with high volatility or geopolitical news, movement may continue even if it is exhibiting Overbought or Oversold traits. Pivots may also be useful for seeing how far the price may correct to, giving you a benchmark for potential Take Profit and Stop Loss locations.
Trend Lines:
Trend Lines may be useful for identifying Support and Resistance locations on the Vertical. Trend Lines may form many different patterns, such as Pennants, Channels, Flags and Wedges. These formations may help predict and drive the price in specific directions. Many traders draw or use Indicators to help create Trend Lines to visualize where these formations will be and they may be very useful alone even for identifying possible Support and Resistance locations.
If you refer to the previous example, and now to this example, you’ll notice that the Trend Line that supported it in 2023 was actually created in June 2020 (yellow circle). Trend Lines may be crucial for identifying Support and Resistance locations on the Vertical that may withhold over time.
Custom Bollinger Bands:
Bollinger Bands are used to help see Movement vs Consolidation Zones (When it's wide vs narrow). It's also very useful for seeing where the correction areas may be. Price may bounce between top and bottom of the Bollinger Bands, unless in a pump or dump. The Boom Meter will show you whether it is currently: Dumping, Consolidation or Pumping. If combined with Boom Meter Bar Colors it may be a good indication if it will break the Bollinger Band (go outside of it). The Middle Line of the Bollinger Band (White Line) may be a very strong support / resistance location. If the price closes above or below it, it may be a good indication of the trend changing (it may indicate one of the first stages to a pump or dump). The color of the Bollinger Bands change based on if it is within a Bull or Bear Zone.
What makes this Bollinger Band special is not only that it uses a custom multiplier, but it also incorporates volume to help add weight to the calculation.
Boom Meter Bar Colors:
Boom Meter Bar Colors are a way to see potential Overbought and Oversold locations on a per bar basis. There are 6 different colors within the Boom Meter bar colors. You have:
Overbought and Very Bullish = Dark Green
Overbought and Slightly Bullish = Light Green
Overbought and Slight Bearish = Light Red
Oversold and Very Bearish = Dark Red
Oversold and Slightly Bearish = Orange
Oversold and Slightly Bullish = Light Purple
When there is no Boom Meter Bar Color prevalent there won’t be a color change within the bar at all.
Just because there is a Boom Meter Bar Color change doesn’t mean you should act on it purchase or sell wise, but it may be an indication as to how that bar is fairing in an Overbought / Oversold perspective. Boom Meter Bar Colors are mainly based on RSI but do take in other factors like price movement to determine if it is Overbought or Oversold. When it comes to Boom Meter Bar Color, you should take it as it is, in the sense that it may be useful for seeing how Individual bars are fairing, but also note that there may be things such as:
When there is Very Overbought (Dark Green) or Very Oversold (Dark Red), during massive pump or dumps, it will maintain this color. However, once it has lost ‘some’ momentum it will likely lose this color.
When there has been a massive Pump or Dump, and there is likewise a light purple or light red, this may mean there is a correction or consolidation incoming.
True Value Zones:
True Value zones are our custom way of displaying something that is similar to a Bollinger Band that can likewise twist like an MA cross. The main purpose of it is to display where the price may reside within. Much like a Bollinger Band it has its High and Low within its zone to specify this location. Since it has the ability to cross over and under, it has the ability to specify what it thinks may be a Bullish or Bearish zone. This zone uses its upper level to display what may be a Resistance location and its lower level to display what may be a Support location. These Support and Resistance locations are based on Momentum and will move with the price in an attempt to stay relevant.
You may use these True Values zones as a gauge of if the price is Overbought or Oversold. When the price faces high volatility and moves outside of the True Value Zones, it may face consolidation or likewise a correction to bring it back within these zones. These zones may act as a guideline towards where the price is currently valued at and may belong within.
Bar Strength Indexes:
Bar Strength Indexes are our way of ranking each bar in correlation to the last few. It is based on a few things but is highly influenced on Open/Close/High/Low, Volume and how the price has moved recently. They may attempt to ‘rate’ each bar and how Bullish/Bearish each of these bars are. The Green number under the bar is its Bullish % and the Red number above the bar is its Bearish %. These %’s will always equal 100% when combined together. Bar Strength Indexes may be useful for seeing when either Bullish or Bearish momentum is picking up or when there may be a reversal / consolidation.
These Bar Strength Indexes may allow you to decipher different states. If you refer to the example above, you may notice how based on how the numbers are changing, you may see when it has entered / exited Bullish, Bearish and Consolidation. Likewise, if you refer to the current bar (yellow circle), you can see that the Bullish % has dropped from 93 to 49; this may be signifying that the Bullish movement is losing momentum. You may use these changes in Bar Indexes as a guide to when to enter / end trades.
Volume Profile:
Volume Profile has been something that has been within TradingView for quite some time. It is a very useful way of seeing at what Horizontal Price there has been the most volume. This may be very useful for seeing not only Support and Resistance locations based on Volume, but also seeing where the majority of Limit Orders are placed. Limit Orders are where traders decide they want to either Buy / Sell but have the order placed so the trade won’t happen until the price reaches a certain amount. Either through many orders from many traders, or a single order from a ‘Whale’ (trader with a lot of capital); you may see Support and Resistance at specific Price Points that have large Volume.
Many Volume Profile Indicators feature a breakdown of all the different locations of volume, along with a Point Of Control (POC) line to designate where the most Volume has been. To try and reduce clutter within our already very saturated Toolkit Indicator, we’ve decided to strip our Volume Profile to only display this POC line. This may allow you to see where the crucial Volume Support and Resistance is without all of the clutter.
You may be wondering, well how important is this Volume Profile POC line and how do I go about using it? Aside from it being a gauge towards where Support and Resistance may be within Volume, it may also be useful for identifying good Long/Short locations. If you think of the line as a ‘Battle’ between the Bulls and Bears, they’re both fighting over that line. The Bears are wanting to break through it downwards, and the Bulls are wanting to break through it upwards. When one side has temporarily won this battle, this means they may have more Capital to push the price in their direction. For instance, if both the Bulls and the Bears are fighting over this POC price, that means the Bears think that price is a good spot to sell; however, the Bulls also deem that price to be a good point to buy. If the Bulls were to win this battle, that means the Bears either canceled their orders to reevaluate, or all of their orders have been completed from the Bulls buying them all. What may happen after that is, if the Bulls were able to purchase all of these Limit Sell Orders, then they may still have more Capital left to continue to pressure the price upwards. The same may be true for if the Bears were to win this ‘Battle’.
How to use YinYang Trend as a cohesive whole:
Hopefully you’ve read and understand how each aspect of this Indicator works on its own, as knowing how/what they each do is important to understanding how it is used as a cohesive whole. Due to the fact that this Toolkit of an Indicator displays so much data, you may find it easier to use and understand when you’re zoomed in a little, somewhat like we are in this example above.
If we refer to the example above, you may like us, deduce a few things:
1. The current price may be VERY Overbought. This may be seen by a few different things:
The Boom Meter Bar Colors have been exhibiting a Dark Green color for 6 bars in a row.
The price has continuously been moving the High (red) Pivot Upwards.
Our Boom Meter displays ‘Pumping’ at 100%.
The price broke through a Downward Trend Line that was created in February of 2022 at 45,000 like it was nothing.
The Bar Strength Index hit a Bullish value of 93%.
The Price broke out of the Bollinger Bands and continues to test its upper levels.
The Low is much greater than our fastest moving MA that creates the Purchase Zones.
The Price is vastly outside of the True Value Zone.
The Bar Strength Index of our current bar is 50% bullish, which is a massive decrease from the previous bar of 93%. This may indicate that a correction is coming soon.
2. Since we’ve identified the current price may be VERY Overbought, next we need to identify if/when/to where it may correct to:
We’ve created a new example here to display potential correction areas. There are a few places it has the ability to correct to / within:
The downward Trend Line (red) below the current bar sitting currently at 32,750. This downward Trend Line is at the same price point as the Fastest MA of our Purchase Zone which may provide some decent Support there.
Between two crucial Pivot heights, within a zone of 30,000 to 31,815. This zone has the second fastest MA from the Purchase Zone right near the middle of it at 31,200 which may act as a Support within the Zone. Likewise there is the Bollinger Band Basis which is also resting at 30,000 which may provide a strong Support location here.
If 30,000 fails there may be a correction all the way to the bottom of our True Value Zone and the top of one of our Extremes at 27,850.
If 27,850 fails it may correct all the way to the bottom of our Purchase Zone / lowest of our Extremes at 27,350.
If all of the above fails, it may test our Volume Profile POC of 26,430. If this POC fails, the trend may switch to Bearish and continue further down to lower levels of Support.
The price can always correct more than the prices mentioned above, but considering overall this Indicator is favoring the Bulls, we will tailor this analysis in Favor of the Bullish Momentum maintaining even during this correction. For these reasons, we think the price may correct between the 30,000 and 31,815 zone before continuing upwards and maintaining this Bullish Momentum.
Please note, these correction estimates are just that, they’re estimates. Aside from the fact that the price is very overbought right now and our Bar Strength Index may be declining (bar hasn’t closed yet); the Boom Meter Strength remains at 100%, meaning there may not be much Bearish momentum changes happening yet. We just want to show you how an Preemptive analysis may be done before there are even Bearish Cipher Signals appearing.
Using this Indicator, you may be able to decipher Entry and Exits. In the previous example, we went over how you may use it to see where a correction (Exit / Take Profit) may be and how far this correction may go. In this example above we will be discussing how to identify Entry locations. We will be discussing a Bullish Buy entry but the same rules apply for a Bearish Sell Entry just the opposite with the Cipher Signals.
If you refer to where we circled in white, this is where the Purchase Zones faced Consolidation. When the Purchase Zones all get tight and close together like that, this may represent Volatility and Momentum in either direction may occur soon.
This was then followed by all 6 of the Standard Cipher Signals closely in succession to each other. This means the Momentum may be favoring the Bulls. If this was likewise all 6 of the Bearish Cipher Signals closely in succession, than the momentum change would favor the Bears.
If you were looking for an entry, and you saw Consolidation with the Purchase Zones and then shortly after you saw the Green Circle and Blue Flag (they can swap order); this may now be a good Entry location.
We will conclude this Tutorial here. Hopefully this has taught you how this Trend Analysis Toolkit may help you locate multiple different types of important Support and Resistance locations; as well as possible Entry and Exit locations.
Settings:
1. Bull/Bear Zones:
1.1. Purchase Speed (Bull/Bear Signals and Take Profit Signals):
Speed determines how much price movement is needed for a signal to occur.
'Sonic' uses the extremities to try and get you the best entry and exit points, but is so quick, its speed may reduce accuracy.
'Fast' may attempt to capitalize on price movements to help you get SOME or attempt to lose LITTLE quickly.
'Medium' may attempt to get you the most optimal entry and exit locations, but may miss extremities.
'Slow' may stay in trades until it is clear that momentum has changed.
'Snail' may stay in trades even if momentum has changed. Snail may only change when the price has moved significantly (This may result in BIG gains, but potentially also BIG losses).
1.2. Purchase Strength (Bull/Bear Signals and Take Profit Signals):
Strength ensures a certain amount of verifications required for signals to happen. The more verifications the more accurate that signal is, but it may also change entry and exit points, and you may miss out on some of the extremities. It is highly advised to find the best combination between Speed and Strength for the TimeFrame and Pair you are trading in, as all pairs and TimeFrames move differently.
'High' uses 15 verifications to ensure signal strength.
'Medium' uses 10 verifications to ensure signal strength.
'Low' uses 5 verifications to ensure signal strength.
'Very Low' uses 3 verifications to ensure signal strength.
2. Cipher Signals:
Cipher Signals are very strong EMA and SMA crosses, which may drastically help visualize movement and help you to predict where the price will go. All Symbols have counter opposites that cancel each other out (YinYang). Here is a list, in order of general appearance and strength:
White Cross / Diamond (Predictive): The initial indicator showing trend movement.
Green Cross / Diamond (Regular): Confirms the Predictive and may add a fair bit of strength to trend movement.
Blue Cross / Diamond (Confirming): Confirms the Regular, showing the trend might have some decent momentum now.
Green / Red X: Gives momentum to the current trend direction, possibly confirming the Confirming Cross/Diamond.
Blue / Orange Triangle: may confirm the X, Possible pump / dump of decent size may be coming soon.
Green / Red Circle: EITHER confirms the Triangle and may mean big pump / dump is potentially coming, OR it just hit its peak and signifies a potential reversal correction. PAY ATTENTION!
Green / Red Flag: Oddball that helps confirm trend movements on the short term.
Blue / Yellow Flag: Oddball that helps confirm trend movements on the medium term (Yin / Yang is the long term Oddball).
3. Bull/Bear Signals:
Bear and Bull signals are where the momentum has changed enough based on your Purchase Speed and Strength. They generally represent strong price movement in the direction of the signal, and may be more reliable on higher TimeFrames. Please don’t use JUST these signals for analysis, they are only meant to be a fraction of the important data you are using to make your technical analysis.
4. Take Profit Signals:
Take Profit signals are guidelines that momentum has started to change back and now may be a good time to take profit. Your Take Profit signals are based on your Take Profit Speed and Strength and may be adjusted to fit your trading style.
5. Information Tables:
Information tables display very important data and help to declutter the screen as they are much less intrusive compared to labels. Our Information tables display: Boom Meter, Purchase Strength of Bull/Bear Zones and Yin/Yang State.
Boom Meter: Uses over 50 different calculations to determine if the pair is currently 'Dumping' (0-29%), 'Consolidating' (30-70%), or 'Pumping' (71-100%).
Bull / Bear Strength: Shows the strength of the current Bull / Bear signal from 0-100% (Signals start at 100% and change when they hit 0%). The % it moves up or down is based on your 'Purchase Strength'.
Yin / Yang state: Is one of the strongest EMA/SMA crosses (long term Oddball) within this Indicator and may be a great indication of which way the price is moving. Do keep in mind if the price is consolidating when changing state, it may have the highest chance of switching back also. Once momentum kicks in and there is price movement the state may be confirmed. Refer to other Cipher Symbols, Extremes, Trend, BOLL, Boom %, Bull / Bear % and Bar colors when Bull / Bear Zones are consolidating and Yin / Yang State changes as this is a very strong indecision zone.
6. Bull / Bear Zones:
Our Bull / Bear zones are composed of 8 very important EMA lengths that may act as not only Support and Resistance, but they help to potentially display consolidation and momentum change. You can tell when they are getting tight and close together it may represent consolidation and when they start to flip over on each other it may represent a change in momentum.
7. MA Extremes:
Our MA Extremes may be 3 of the most important long term moving averages. They don’t always play a role in trades as sometimes they’re way off from the price (cause they’re extreme lengths), but when they are around price or they cross under or over each other, it may represent large changes in price are about to occur. They may be very useful for seeing strong resistance / support locations based on price averages. Extremes may transition from a Support to a Resistance based on its position above or below them and how many times the price has either bounced up off them (Supporting) or Bounced back down after hitting them (Resistance).
8. Pivots:
Pivots may be a very important indicator of support and resistance for horizontal price movement. Pivots may represent the current strongest Support and Resistance. When the Pivot changes, it means a new strong Support or Resistance has been created. Sometimes you'll notice the price constantly pushes the pivot during a massive Pump or Dump. This is normal, and may indicate high levels of volatility. This generally also happens when the price is outside of the Bollinger Bands and is also Over or Undervalued. The price usually consolidates for a while after something like this happens before more drastic movement may occur.
9. Trend Lines:
Trend lines may be one of the best indicators of support and resistance for diagonal price movement. When a Trend Line fails to hold it may be a strong indication of a dump. Keep a close eye to where Upward and Downward Trend Lines meet. Trend lines can create different trading formations known as Pennants, Flags and Wedges. Please familiarize yourself with these formations So you know what to look for.
10. Bollinger Bands (BOLL):
Bollinger Bands may be very useful, and ours have been customized so they may be even more accurate by using a modified calculation that also incorporates volume.
Bollinger Bands may be used to see Movement vs Consolidation Zones (When it’s wide vs narrow). It also may be very useful for seeing where the correction areas are likely to be. Price may bounce between top and bottom of the BOLL, unless perhaps in a pump or dump. The Boom Meter may show you whether it is currently: Dumping, Consolidation or Pumping, along with Boom Meter Bar Colors, may be a good indication if it will break the BOLL. The Middle Line of the BOLL (White Line) may be a very strong support / resistance line. If the price closes above or below it, it may be a good indication of the trend changing (it may be one of the first stages to a pump or dump).
11. Boom Meter Bar Colors:
Boom Meter bar colors may be very useful for seeing when the bar is Overbought or Underbought. There are 6 different types of boom meter bar colors, they are:
Dark Green: RSI may be very Overbought and price going UP (May be in a big pump. NOTICE, chance of small dump correction if Cherry Red bar appears).
Light Green: RSI may be slightly Overbought and price going UP (chance of small pump).
Light Purple: RSI may be very Underbought and price going UP (May have chance of small correction).
Dark Red: RSI may be very Underbought and price going DOWN (May be in a big dump. NOTICE, chance of small pump correction if Light Purple bar appears).
Light Orange: RSI may be slightly Underbought and price going DOWN (chance of small dump).
Cherry Red: RSI may be very Overbought and price going DOWN (Chance of small correction).
12. True Value Zone:
True Value Zones display zones that represent ranges to show what the price may truly belong within. They may be very useful for knowing if the Price is currently not valued correctly, which generally means a correction may happen soon. True Value Zones can swap from Bullish to Bearish and are represented by Red for Bearish and Green for Bullish. For example, if the price is ABOVE and OUTSIDE of the True Value Zone, this means it may be very overvalued and might correct to go back inside the True Value Zone. This correction may be done by either dumping in price back into the zone, or consolidating horizontally back into it over a longer period of time. Vice Versa is also true if it is BELOW and OUTSIDE of the True Value Zone.
13. Bar Strength Index:
Bar Strength Index may display how Bullish/Bearish the current bar is. The strength is important to help see if a pump may be losing momentum or vice versa if a dump may correct. Keep in mind, the Bar Strength Index does a small 'refresh' to account for new bars. It may help to keep the Index more accurate.
14. Volume Profile:
Volume Profiles may be important to know where the Horizontal Support/Resistance is in Price base on Volume. Our Volume Profile may identify the point where the most volume has occurred within the most relevant timeframe. Volume Profiles are helpful at identifying where Whales have their orders placed. The reason why they are so helpful at identifying whales is when the volume is profiled to a specific area, there may likely be lots of Limit Buy and/or Sells around there. Limit Buys may act as Support and Limit Sells may act as Resistance. It may be very useful to know where these lie within the price, similar to looking at Order Book Data for Whale locations.
If you have any questions, comments, ideas or concerns please don't hesitate to contact us.
HAPPY TRADING!

RealEdgeFX EdgeMap ProPresentation
RealEdgeFX EdgeMap Pro is built for systematic intraday decision-making. It combines a rule-based Daily Bias engine with an intraday (1-hour) regime engine based on medium timeframe engulfing (a structure change where a new directional run overwhelms the prior one). The study continuously evaluates candlestick behavior, session-level displacement, previous-day range interaction, and clearly defined points of interest (price areas left by sharp moves that often act as magnets or rejection zones). Intraday highs/lows inside an active regime are updated in real time on lower timeframes, so levels expand tick-by-tick when price makes new extremes.
Description
RealEdgeFX EdgeMap Pro is built on the idea that price alternates between contraction and expansion. Expansion begins when price drives in one direction with conviction. The study blends higher-timeframe daily context with a confirmed 1-hour structure shift called ME (Medium timeframe engulfing)—the moment a fresh run closes beyond the opening level that began the previous opposite run. From that confirmation forward, the active range’s high and low are maintained in real time on lower timeframes, expanding tick-by-tick whenever price prints new extremes. The tool also marks points of interest derived from zones where the price usually reacts following the 1h order flow context. Only the most relevant, side-aligned area is shown, and it is removed as soon as price trades decisively through it.
The engine outputs a Buy/Sell/Neutral stance and a 0–100 strength score. The definitive rules are the ones displayed in the on-chart table: the bias is produced when at least three of those criteria are active, or when a rule-based override flips the stance. Strength is calculated from the same table and increases with the number and intensity of active checks.
Tools
- Daily Bias & Strength (table-driven): Produces a Buy/Sell/Neutral bias and a 0–100 strength score for the day. The decision follows the rules shown in the on-chart table; the bias is set when at least three table criteria are active, or when a rule-based override flips it. Strength scales with how many checks are active and how strong they are.
- Medium-Timeframe Engulfing (ME) on 1-Hour: Detects a confirmed 1-hour structure shift when a new move closes beyond the opening price that started the prior opposite move. From that moment, the active range’s high/low is maintained in real time on lower timeframes, expanding tick-by-tick as new extremes print. A 1-hour close through the invalidation clears the ME and its dependents.
- Points of Interest (POI): Marks areas created by a distinct three-candle move on the 1-hour chart where the middle bar’s range does not overlap the bar from two candles earlier, or the initial candle that produces the Medium-Timeframe Engulfing. Only POIs formed after the current ME begins and lying inside the active ME range are eligible. Overlapping same-side areas merge; only the nearest, side-aligned POI is shown and it is removed once price trades decisively through it.
- ME-Based Fibonacci Levels: Draws three live reference lines tied to the active ME range—100% at the active extreme, 50% at the midpoint, and 0% at the opposite extreme. These levels extend forward, update in real time as the ME range grows, and hide automatically when no valid ME is active.
- Intraday Visuals: On the first bar of each new trading day (on intraday charts), prints an up/down arrow reflecting the current Daily Bias and a clean text label with its strength. Sizes and colors are configurable to keep the chart readable.
- On-Chart Diagnostic Table: Displays the exact rules used to build the Daily Bias and Strength, broken down by sections (Price Body & Structure, Breakout & Liquidity, POI Context, Overrides). A check mark means the criterion is currently contributing; this table is the single source of truth for the engine’s decisions.
What can you customize?
- ME Level & Label (Medium-Timeframe Engulfing): Choose line style (solid, dashed, dotted), line width, and separate colors for bullish and bearish levels. Set the label text (e.g., “ME”), its color, and size. Control how far the line/label project forward in time. Once a 1-hour close invalidates the setup, the ME line and label are removed automatically, keeping the view clean.
- POI Areas (Points of Interest): Toggle on/off. Pick separate fill colors for bullish/bearish areas, adjust transparency, and set border color, width, and style. Define how far each area extends forward. Only the most relevant, side-aligned area is shown; when price closes decisively through it, the box is cleared to avoid clutter.
- ME-Based Fibonacci Levels (100/50/0): Toggle the three reference lines, and customize each level’s color, width, and style. Turn labels on/off and set label text size and color. Control forward extension so levels project the way you prefer. Levels auto-update in real time as the ME range expands and hide when no valid ME is active.
- Intraday Day-Change Arrows & Strength Labels: Select arrow size (Tiny, Small, Normal, Large) and separate colors for buy/sell arrows. Choose text color and size for the strength percentage, also separated for buy/sell. Control the history window (how many past days’ arrows/labels remain visible) to keep the chart minimal or more informative.
- Diagnostics Table (Daily Bias & Strength): Toggle the table on/off and place it in any corner (top/bottom, left/right). Customize header background/text colors, row background/text colors, and the colors used for Buy/Sell/Neutral states. Set border width and overall text size to match your chart theme.
- Forward Extensions & History Windows: Independently control how far ME lines, POI boxes, and ME-Fibonacci levels extend into the future, and how much intraday arrow/label history is kept. These controls let you balance context vs. cleanliness on any timeframe.
How to use properly
- Add RealEdgeFX EdgeMap Pro to any TradingView symbol and timeframe.
- For execution, use intraday charts (e.g., 1–15 minutes).
- The study pulls its higher-timeframe context from the Daily and confirms structure on the 1-hour engine.
Originality & value
This study is not a mashup; it integrates a daily rule engine with a 1-hour regime detector that maintains live extremes on lower timeframes and a single, side-aligned point-of-interest filter with merging/invalidations. The combination produces a table-audited bias and strength built from measurable, configurable checks rather than generic overlays.
Terms and Conditions
Purpose and no advice. These charting tools are provided for informational and educational purposes only. They do not predict markets or provide financial, investment, or trading advice. Past performance is not indicative of future results.
User responsibility and liability. By using these tools, you agree that all decisions and outcomes are your sole responsibility. RealEdgeFX EdgeMap Pro and its creator(s) are not liable for any losses or consequences arising from the use of these products. You agree to indemnify and hold RealEdgeFX EdgeMap Pro harmless from any claims related to your use.
Access and use. Access may be granted via TradingView invite and requires an active subscription. Access is personal and non-transferable. Sharing, reselling, redistributing, copying, decompiling, or attempting to reverse engineer the code is prohibited. Access may be suspended or revoked for violations of these terms or platform policies.
Subscriptions, discounts, and cancellation. If you receive access through a Friends & Family program or use a discount code, the discount applies only to the first purchase or first billing cycle unless explicitly stated otherwise. You are solely responsible for canceling—or requesting cancellation of—your subscription if you do not wish to continue after the discounted period and/or at full price.
Refund policy. No reimbursements, refunds, or chargebacks are provided, to the maximum extent permitted by law.
Acceptance and updates. By continuing to use these tools, you acknowledge and agree to these Terms and Conditions. RealEdgeFX EdgeMap Pro may update these terms from time to time; continued use after updates constitutes acceptance of the revised terms.

INCOME STATEMENT BY N' TEEREX HOONJONGPANGConcept
This Pine Script indicator displays a dynamic, customizable table on the TradingView chart.
It is designed for traders who want to monitor annual data, quarterly performance, and key financial ratios directly on the chart without switching to external spreadsheets.
Features
Three Structured Sections:
Yearly Data Table – Displays annual values with adjustable text size and colors.
Quarterly Data Table – Shows quarter-by-quarter figures in a clear, compact format.
Financial Ratios Table – Presents key metrics (e.g., growth rates, margins, or other ratios) for quick analysis.
Customizable Appearance:
Adjustable text size for each table section.
Background and text colors for improved readability.
Option to merge cells for titles and headers.
Flexible Positioning:
Tables can be displayed in various positions on the chart (e.g., top-left, top-center, top-right).
Data Highlighting:
Color-coded cells to highlight important values or trends.
How to Use
1.Add the script to your TradingView chart.
2.Select table position (e.g., top-center for balanced display).
3.Adjust text size and color for yearly, quarterly, and ratio tables according to your preference.
4.Review the merged header cells for section titles and use the table to track key performance data alongside price action.
This tool is especially useful for swing traders, investors, and analysts who need to quickly interpret fundamental data within the same visual context as the chart.

ATH & ATL Distances PROIndicator Description:
ATH & ATL Distances PROThis Pine Script indicator, built on version 6, helps traders visualize and monitor the percentage distances from the current closing price to the rolling All-Time High (ATH) and All-Time Low (ATL) over customizable lookback periods.
It's designed for overlay on your TradingView charts, providing a clear table display and optional horizontal lines with labels for quick reference.
This tool is ideal for assessing market pullbacks, rallies, or potential reversal points based on recent price extremes.
Key Features:
Customizable Lookbacks: Three adjustable periods (default: 50, 150, 250 bars) to calculate short-, medium-, and long-term highs/lows.
Percentage Distances: Shows how far the current price is from ATH (negative percentage if below) and ATL (positive if above).
Visual Aids: Optional dashed lines for ATH/ATL levels extending a set number of bars, with grouped labels to avoid clutter if levels overlap.
Info Table: A persistent table summarizing lookbacks, distances, and prices, with color-coded cells for easy reading (red for ATH/dist to top, green for ATL/dist to bottom).
User Controls: Toggle rows, lines, table position, and colors via inputs for a personalized experience.
How It Works (Logic Explained):
The script uses TradingView's built-in functions like ta.highest() and ta.lowest() to find the highest high and lowest low within each lookback period (capped at available bars to handle early chart data). It then computes:Distance to ATH: ((close - ATH) / ATH) * 100 – Negative values indicate the price is below the high.
Distance to ATL: ((close - ATL) / ATL) * 100 – Positive values show the price is above the low.
Unique ATH/ATL prices across lookbacks are grouped into arrays to prevent duplicate lines/labels; if prices match, labels concatenate details (e.g., "50 Bars HH\n150 Bars HH").
Drawings (lines and labels) are efficiently managed by redrawing only on the latest bar to optimize performance. The table updates in real-time on every bar close.How to Use:Add the indicator to your chart via TradingView's "Indicators" menu (search for "ATH & ATL Distances PRO").
Customize inputs:
Adjust lookback periods (1-1000 bars) for your timeframe (e.g., shorter for intraday, longer for daily/weekly).
Enable/disable lines, rows, or change colors/table position to suit your setup.
Interpret the table:
"DIST. TO TOP" (red): Percentage drop needed to reach ATH – useful for spotting overbought conditions.
"DIST. TO BOT." (green): Percentage rise from ATL – helpful for identifying support levels.
If lines are enabled, hover over labels for details on which lookbacks share the level.
Best on any symbol/timeframe; combine with other indicators like RSI or moving averages for confluence.
This script is open-source and free to use/modify. No external dependencies – it runs natively on TradingView. Feedback welcome; if you find it useful, a like or comment helps!