BE-QuantFlow: Adaptive Momentum Trading█ Overview: QuantFlow: Adaptive Momentum Trading
QuantFlow is a sophisticated algorithmic momentum trading method designed specifically for indices and high-beta stocks. However, its logic is universal; with appropriate parameter tuning, it adapts to various asset classes and timeframes.
While the standard momentum indicators (like RSI or MACD) simply measure how fast price is moving (Velocity), QuantFlow analyzes the quality and conviction of the trend . Features like Dynamic Volatility Filtering and Trend Shielding, combined with volatility weighting and a "Dual-Line" approach to distinguish between a sustainable institutional trend and a temporary retail spike, make the indicator unique and more powerful.
█ Why QuantFlow ?
Quant (The Engine): This replaces subjective guessing with objective math.
Instead of just seeing that the price is "up," we measure "how it got there". For example, a stock that rises 1 currency value every day for 10 days (smooth trend) gets a much higher score than a stock that jumps 10 currency value in one minute and does nothing else (erratic noise). This mathematical rigor provides the structure.
█ Core Logic & Philosophy
To understand how QuantFlow calculates momentum, imagine a "Tug-of-War" between Buyers (Bulls) and Sellers (Bears). Most indicators (like RSI) use a single line. If RSI is at 50, it means "Neutral." But "Neutral" can mean two very different things:
Peace: Nothing is happening. No one is buying or selling.
War: Buyers are pushing hard, but Sellers are pushing back equally hard. Volatility is massive.
A single line hides this reality. QuantFlow splits the market into two separate scores:
Bull Score (Green Line): How hard are the buyers pushing?
Bear Score (Red Line): How hard are the sellers pushing?
The Layman's Advantage:
If both lines are low = Sleepy Market (Avoid).
If Green is high and Red is low = Clean Uptrend (Buy).
If Red is high and Green is low = Clean Downtrend (Sell).
If both lines are high = Chaos/War Zone (Wait).
█ How it Weight "Sustenance" (The Critical Quality Check)
This is the most unique aspect of QuantFlow: Trend direction alone is not enough; Sustenance is weighed equally . Standard indicators treat every 10 currency value movements the same way with no distinction. However, QuantFlow asks, "Did you hold the ground you gained?"
Scenario A (High Sustenance) : A stock opens at 100, marches to 110, and closes at 110.
Verdict : Buyers pushed up and sustained the price.
QuantFlow Weight : 100%. This is a high-quality move.
Scenario B (Low Sustenance) : A stock opens at 100, spikes to 110, but gets sold off to close at 102.
Verdict : Buyers pushed up (Trend is Up), but failed to sustain it (Long Wick).
QuantFlow Weight : 20%. This is treated as "Noise" or a trap.
By mathematically weighing the Close Location Value (where the candle closes relative to its high/low), QuantFlow filters out "Gap-and-Fade" traps and exhaustion spikes that fool traditional indicators.
Comparisons: QuantFlow vs. The Rest
Calculation Logic : Standard RSI/MACD measures simple price change over time. QuantFlow measures Price Change 'times (x)' Conviction (Sustenance Weighting).
Visual Output : Standard tools show a single line (0-100), often hiding market conflict. QuantFlow displays Dual Lines (Bull vs Bear Intensity) to reveal the true state of the battle.
Trap Handling : Standard indicators are often fooled by sharp spikes. QuantFlow ignores "Gap-and-Fade" moves with poor closing conviction.
Adaptability : Standard tools use static levels (e.g., Overbought > 70). QuantFlow uses Dynamic Bands that adjust automatically to recent volatility.
█ Dynamic Volatility Filtering
Unlike standard indicators that use fixed levels (e.g., "Buy if RSI > 50"), QuantFlow acknowledges that "50" means something different in a quiet market versus a crashing market. This section explains the statistical engine driving the signals.
The Problem with Static Levels : In a low-volatility environment, a momentum score of 55 might indicate a massive breakout. In a high-volatility environment, a score of 55 might just be random noise. A fixed threshold cannot handle both scenarios.
The Solution: Adaptive Statistics : The script maintains a memory of the Momentum Events. It doesn't just look at price; it looks at where the momentum occurred in the past and draws a "Noise Zone" (Grey Band). This logic acts as a "Smart Gatekeeper" for trade entries:
Scenario A: Inside the Noise (The Filter)
If a new momentum signal happens inside the Noise Zone, the script assumes it is likely chop or noise.
Action : It forces a wait period. The signal is delayed until the trend sustains itself for Confirm Bars; else the signal is cancelled. This filters out ~70% of false signals in sideways markets.
Scenario B: Outside the Noise (The Breakout)
If a new momentum signal happens outside the Noise Zone (or the momentum score smashes through the Upper Band), it is statistically significant (an outlier event).
Action: It triggers an Immediate Entry. No waiting is required because the move is powerful enough to escape the historical noise zone.
█ The ⚠️ "Warning" System (Heads-up for Smart Reversals)
While you are directional if there is potential reversal signal, it provides the heads-up warning for a better decision-making
█ Special Utility: Ghost Mode
For intraday traders, the biggest disruption to "Flow" is the mandatory broker square-off at 3:15 PM (considering Indian Market). Often, a trend continues overnight, and the trader misses the gap-up opening the next morning because their algo was flat.
Ghost Mode is a unique feature that runs silently in the background:
At Square-off: The strategy closes your official position to satisfy the broker.
In the Background: It keeps the trade "alive" virtually (Ghost).
Next Morning: If the market opens in the trend's favor, the strategy re-enters the trade automatically. This approach ensures you capture the full swing of the trend, even if you are forced to exit at the previous session.
█ Advice on this indicator:
Parameter Calibration: The default settings are optimized for BankNifty on 5-minute charts. If you trade stocks, crypto, commodities, or any higher timeframes (e.g., 15-min or hourly), you must adjust these.
Low Volatility Assets: Reduce Stop Multiplier to 2.0.
High Volatility Assets: Increase Momentum Lookback to 50 to filter noise.
Confluence (Additional Confirmation): While QuantFlow is a complete system, using it alongside Key Support/Resistance Levels or Volume Profile provides the highest probability setups.
Rsistrategy

BE-Synergistic RSI Fusion Strategy█ Overview of the Script:
The Synergistic RSI Fusion Strategy is a sophisticated technical analysis tool designed to detect market turning points (reversals) and high-momentum breakouts. Unlike standard indicators that simply tell you to "Buy" or "Sell" based on a crossed line or overbought/oversold levels, this script builds a structural trade setup using zones. It waits for price action to confirm the signal before acting.
█ Why "Synergistic RSI Fusion"?:
The core engine of the indicator makes it all:
Fusion : Standard RSI only looks at the closing price relative to the previous closing price. This script calculates a comprehensive RSI that incorporates the candle's Highs and Lows.
Why is this more powerful? Imagine a "Hammer" candle where price drops significantly during the session but recovers to close near the open. A standard RSI sees almost no change because the Close is near the Open. However, Fusion RSI captures the full volatility of that dip and recovery, recognizing the massive "effort" and hidden battle between buyers and sellers that standard RSI completely misses.
Synergy : It combines this advanced momentum reading with ATR (Average True Range) to define volatility-based entry and exit zones. It blends momentum (RSI) with market structure (Price Action Zones).
█ How it Stands Unique:
The Core engine: Capturing the true efforts of the movement in price.
Multi-Peak Divergence: Instead of simple A-to-B divergence, this script uses a state machine to track local peaks by filtering out weak signals and waits for a significant disagreement between price and momentum.
The Zone System: It doesn't plot signals blindly. When divergence is found, it draws two "waiting rooms" (Green and Red zones). The trade is only taken if the candle closes inside one of these zones.
█ Divergence Trades: The Two-Way Setup:
A unique feature of this script is that when a Divergence signal appears, it generates two potential entry zones: a Bullish zone and a Bearish zone.
The Rational Behind the Two-Way Approach:
New traders often assume a Divergence means "Reversal." However, experienced traders know that Divergence simply means "Tension is building."
Scenario A (The Reversal): The RSI is screaming that momentum is dying, but price is pushing higher. If price respects the divergence, it will drop into the reversal zone. This is the standard divergence trade.
Scenario B (The Failure/Trap): sometimes, momentum is so strong that it blows through the divergence. If price ignores the RSI warning and breaks into the continuation zone, it signals that the trend is incredibly powerful.
Why Trade Both Ways?
By placing zones on both sides, the script essentially says: " I know a big move is coming because of the tension (Divergence), but I will let the market prove direction first. " This prevents you from " catching a falling knife " by trying to pick the exact top or bottom.
The Counter-Trading Logic (The Trap):
The script includes advanced logic for failed trades. If you enter a trade and the Stop Loss is hit immediately (a "fake-out"), the script adjusts the opposing zone by considering the liquidity of that particular candle.
Why? If the market traps Long traders and hits their stops, that selling pressure often fuels a massive move downwards. This logic allows the script to flip bias instantly and join the real move.
█ Continuation Trends: Why Price Runs After TP:
You may notice that often, after the Take Profit (TP) is hit, the price continues to run in that direction for a long time.
The "Breakout" Effect:
The Take Profit levels in this script are calculated using ATR (Average True Range). This is a conservative target based on recent average volatility.
Structural Breaks: The entry zones are usually positioned at key structural pivots. When price has enough energy to enter the zone and hit 100% of the ATR target, it effectively confirms a Break of Structure.
Momentum Release: The Divergence phase acts like a coiled spring. When that spring finally snaps (the trade entry), the release of energy is often far greater than just one ATR unit.
Psychology: When the TP is hit, it confirms the analysis was correct. This draws in other traders and algorithms who missed the initial entry, adding fuel to the fire and extending the trend.
█ Major Support & Resistance Zone:
The untested zones are typically the safe haven to place your SLs, which definitely act as Support & Resistance once the price approaches these zones.

RSI Ladder TP Strategy v1.0 Overview
This strategy is an RSI-based reversal entry system with a ladder-style take-profit mechanism.
It supports Long-only, Short-only, or Both directions and provides optional Average Entry Price, Stop Loss, and Take Profit reference lines on the chart.
Entry Rules
Long Entry: RSI crosses above the Oversold level (default: 20).
Short Entry: RSI crosses below the Overbought level (default: 80).
Optional: If enabled, the script will close the current position when an opposite signal appears before opening a new one.
Exit Rules (Ladder Take Profit)
Take profit is placed as a ladder using tpLevels and tpStepPct.
Example (default tpStepPct = 1%, tpLevels = 10):
TP1 at +1%, TP2 at +2%, … TP10 at +10% (relative to current average entry price).
Each TP level closes tpClosePct of the remaining position, meaning it scales out geometrically:
If tpClosePct = 50% → remaining position becomes 50%, then 25%, then 12.5%, etc.
Stop Loss
Optional stop loss is placed at slPct (%) away from the average entry price:
Long: avg * (1 - slPct%)
Short: avg * (1 + slPct%)
Visual Lines
Average Entry Price Line: current strategy.position_avg_price
Stop Loss Line: based on slPct
Next TP Line: shows the estimated next TP level based on current profit%
All TP Lines: optional (can clutter the chart)
==============================================================
Recommended Use
This strategy is best used on markets with strong mean-reversion behavior.
For exchanges/bots that do not support hedge mode in a single strategy, run two separate instances:
One set to Long Only
One set to Short Only

RSI Analytic Volume Matrix [RAVM] Overview
RSI Analytic Volume Matrix is an overlay indicator that turns classic RSI into a multi-layered market-reading engine. Instead of treating RSI 30 and 70 as simple buy/sell lines, RAVM combines RSI geometry (angle and acceleration), statistical volume analysis, and a 5×5 VSA-inspired matrix to describe what is really happening inside each candle.
The script is designed as an educational and analytical tool. It does not generate trading signals. Instead, it helps you read the market context, understand where the pressure is coming from (buyers vs. sellers), and see how price, momentum, and volume interact in real time.
Concept & Philosophy
RAVM is built around a hierarchical logic and a few core ideas:
• Hierarchical State Machine: First, RSI defines a context (where we are in the 0–100 range). Then the geometric engine evaluates the angle-of-turn of RSI using a Z-Score. Only after a meaningful geometric event is detected does the system promote a bar to a potential setup (warning vs. confirmed).
• Geometric Primacy: The angle and acceleration of RSI (RSI geometry) are more important than the raw RSI level itself. RAVM uses a geometric veto: if the geometric trigger is not confirmed, the confidence score is capped below 50%, even if volume looks interesting.
• RSI Beyond 30 and 70: Being above 70 or below 30 is not treated as an automatic overbought/oversold signal. RAVM treats those zones as contextual factors that contribute only a partial portion of the final score, alongside geometry, total volume expansion, buy/sell balance, and delta power.
• Volume Decomposition: Volume is decomposed into total, buy-side, sell-side, and delta components. Each of these is normalized with a Z-Score over a shared statistical window, so RSI geometry and volume live in the same statistical context.
• Educational Scoring Pipeline: RAVM builds a 0–100 "Quantum Score" for each detected setup. The score expresses how strong the story is across four dimensions: geometry (RSI angle-of-turn), total volume expansion, which side is driving that volume (buyers vs. sellers), and the power of delta. The score is designed for learning and weighting, not for mechanical trade entries.
• VSA Matrix Engine: A 5×5 matrix combines momentum states and volume dynamics. Each cell corresponds to an interpreted VSA-style scenario (Absorption, Distribution, No Demand, Stopping Volume, Strong Reversal, etc.), shown both as text and as a heatmap dashboard on the chart.
How RAVM Works
1. RSI Context & Geometry
RAVM starts with a classic RSI, but it does not stop at simple level checks. It computes the velocity and acceleration of RSI and normalizes them via a Z-Score to produce an Angle-of-Turn metric (Z-AoT). This Z-AoT is then mapped into a 0–1 intensity value called MSI (Momentum Shift Intensity).
The script monitors both classic RSI zones (around 30 and 70) and geometric triggers. Entering the lower or upper zone is treated as a contextual event only. A setup becomes "confirmed" when a significant geometric turn is detected (based on Z-AoT thresholds). Otherwise, the bar is at most a warning.
2. Volume & Statistical Engine
The volume engine can work in two modes: a geometric approximation (based on candle structure) or a more precise intrabar mode using up/down volume requests. In both cases, RAVM builds a volume packet consisting of:
• Total volume
• Buy-side volume
• Sell-side volume
• Delta (buy – sell)
Each of these series is normalized using a Z-Score over the same statistical window that is used for RSI geometry. This allows RAVM to answer questions such as: Is total volume exceptional on this bar? Is the expansion mostly coming from buyers or from sellers? Is delta unusually strong or weak compared to recent history?
3. Scoring System (Quantum Score)
For each bar where a setup is active, RAVM computes a 0–100 score intended as an educational confidence measure. The scoring pipeline follows this sequence:
A. RSI Geometry (MSI): Measures the strength of the RSI angle-of-turn via Z-AoT. This has geometric primacy over simple level checks.
B. RSI Zone Context: Being below 30 or above 70 contributes only a partial bonus to the score, reflecting the idea that these zones are context, not automatic signals. Mildly supportive zones (e.g., RSI below 50 for bullish contexts) can also contribute with lower weight.
C. Total Volume Expansion: A normalized Volume Power term expresses how exceptional the total volume is relative to its recent distribution. If there is no meaningful volume expansion, the score remains modest even if RSI geometry looks interesting.
D. Which Side Is Driving the Volume: RAVM then checks whether the expansion is primarily on the buy side or the sell side, using Z-Score statistics for buy and sell volume separately. This stage does not yet rely on delta as a power metric; it simply answers the question: "Is this expansion mostly driven by buyers, sellers, or both?"
E. Delta as Final Power: Only at the final stage does the script bring in delta and its Z-Score as a measure of how one-sided the pressure really is. A strong negative delta during a bullish context, for example, can highlight absorption, while a strong positive delta against a bearish context can highlight distribution or a buying climax.
If a setup is not geometrically confirmed (for example, a simple entry into RSI 30/70 without a strong geometric turn), RAVM caps the final score below 50%. This "Geometric Veto" enforces the idea that RSI geometry must confirm before a scenario can be considered high-confidence.
4. Overlay UI & Smart Labels
RAVM is an overlay indicator: all information is drawn directly on the price chart, not in a separate pane. When a setup is active, a smart label is attached to the bar, together with a vertical connector line. Each label shows:
• Direction of the setup (bullish or bearish)
• Trigger type (classic OS/OB vs. geometric/hidden)
• Status (warning vs. confirmed)
• Quantum Score as a percentage
Confirmed setups use stronger colors and solid connectors, while warnings use softer colors and dotted connectors. The script also manages label placement to avoid overlap, keeping the chart clean and readable.
In addition to labels, a dashboard table is drawn on the chart. It displays the currently active matrix scenario, the dominant bias, a short textual interpretation, the full 5×5 heatmap, and summary metrics such as RSI, MSI, and Volume Power.
RSI Is Not Just 30 and 70
One of the central design decisions in RAVM is to treat RSI 30 and 70 as context, not as fixed buy/sell buttons. Many traders mechanically assume that RSI below 30 means "buy" and RSI above 70 means "sell". RAVM explicitly rejects this simplification.
Instead, the script asks a series of deeper questions: How sharp is the angle-of-turn of RSI right now? Is total volume expanding or contracting? Is that expansion dominated by buyers or sellers? Is delta confirming the move, or is there a hidden absorption or distribution taking place?
In the scoring logic, being in a lower or upper RSI zone contributes only part of the final score. Geometry, volume expansion, the buy/sell split, and delta power all have to align before a high-confidence scenario emerges. This makes RAVM much closer to a structured market-reading tool than a classic overbought/oversold indicator.
Matrix User Manual – Reading the 5×5 Grid
The heart of RAVM is its 5×5 matrix, where the vertical axis represents momentum states (M1–M5) and the horizontal axis represents volume dynamics (V1–V5). Each cell in this grid corresponds to a VSA-style scenario. The dashboard highlights the currently active cell and prints a textual description so you can read the story at a glance.
1. Confirmation Scenarios
These scenarios occur when momentum direction and volume expansion are aligned:
• Bullish Confirmation / Strong Reversal: Momentum is shifting strongly upward (often from a depressed RSI context), and expanded volume is driven mainly by buyers. Often seen as a strong bullish reversal or continuation signal from a VSA perspective.
• Bearish Confirmation / Strong Drop: Momentum is turning decisively downward, and expanded volume is driven mainly by sellers. This maps to strong bearish continuation or sharp reversal patterns.
2. Absorption & Stopping Volume
• Absorption: Total volume expands, but the dominant flow is opposite to the recent price move or the geometric bias. For example, heavy selling volume while the geometric context is bullish. This can indicate smart money quietly absorbing orders from the crowd.
• Stopping Volume: Exceptionally high volume appears near the end of an extended move, while momentum begins to decelerate. Price may still print new extremes, but the effort vs. result relationship signals potential exhaustion and the possibility of a turn.
3. Distribution & Buying Climax
• Distribution: Heavy buying volume appears within a bearish or topping context. Rather than healthy accumulation, this often represents larger players offloading inventory to late buyers. The matrix will typically flag this as a bearish-leaning scenario despite strong upside prints.
• Buying Climax: A surge of buy-side volume near the end of a strong uptrend, with momentum starting to weaken. From a VSA point of view, this is often the last push where retail aggressively buys what smart money is selling.
4. No Demand & No Supply
• No Demand: Price attempts to rise but does so on low, non-expansive volume. The market is not interested in following the move, and the lack of participation often precedes weakness or sideways action.
• No Supply: Price tries to push lower on thin volume. Selling pressure is limited, and the lack of supply can precede stabilization or recovery if buyers step back in.
5. Trend Exhaustion
• Uptrend Exhaustion: Momentum remains nominally bullish, but the quality of volume deteriorates (e.g., more effort, less net result). The matrix marks this as an uptrend losing internal strength, often after a series of aggressive moves.
• Downtrend Exhaustion: Similar logic in the opposite direction: strong prior downtrend, but increasingly inefficient downside progress relative to the volume invested. This can precede accumulation or a relief rally.
6. Effort vs. Result Scenarios
• Bullish Effort, Little Result: Buyers invest notable volume, but price progress is limited. This may reveal hidden selling into strength or a lack of follow-through from the broader market.
• Bearish Effort, Little Result: Sellers push volume, but price does not decline proportionally. This can indicate absorption of selling pressure and potential underlying demand.
7. Neutral, Churn & Thin Markets
• Neutral / Thin Market: Momentum and volume both remain muted. RAVM marks these as neutral cells where aggressive decision-making is usually less attractive and observing the broader structure is more important.
• High Volume Churn / Volatility: Both sides are active with high volume but limited directional progress. This can correspond to battle zones, local ranges, or high volatility rotations where the main message is conflict rather than clear trend.
Inputs & Options
RAVM includes several input groups to adapt the tool to your preferences:
• Localization: Multiple language options for all labels and dashboard text (e.g., English, Farsi, Turkish, Russian).
• RSI Core Settings: RSI length, source, and upper/lower contextual zones (typically around 30 and 70).
• Geometric Engine: Z-AoT sigma thresholds, confirmation ratios, and normalization window multiplier. These control how sensitive the script is to RSI angle-of-turn events.
• Volume Engine: Choice between geometric approximation and intrabar up/down volume, Z-Score thresholds for volume expansion, and related parameters.
• Visual Interface: Toggles for smart labels, dashboard table, font sizes, dashboard position, and color themes for bullish, bearish, and warning states.
Disclaimer
RSI Analytic Volume Matrix is provided for educational and research purposes only. It does not constitute financial advice and is not a signal generator. Any trading decisions you make based on this tool, or any other, are entirely your own responsibility. Always consider your own risk management rules and conduct your own analysis.

SNP420/RSI_GOD_KOMPLEXRSI_GOD_KOMPLEX is a multi–timeframe RSI scanner for TradingView that displays a compact table in the top-right corner of the chart. For each timeframe (1m, 5m, 15m, 30m, 1h, 4h, 1d) it tracks the fast RSI line (not the smoothed/main one) and marks BUY in green when RSI crosses up through 30 (leaving oversold territory) and SELL in red when RSI crosses down through 70 (leaving overbought territory), always using only closed candles for reliable, non-repainting signals. The indicator remembers the last valid signal per timeframe, so the table always shows the most recent directional impulse from RSI across all selected timeframes on the same instrument.
author: SNP420 + Jarvis
project: FNXS
ps: piece and love

RSI Forecast Colorful [DiFlip]RSI Forecast Colorful
Introducing one of the most complete RSI indicators available — a highly customizable analytical tool that integrates advanced prediction capabilities. RSI Forecast Colorful is an evolution of the classic RSI, designed to anticipate potential future RSI movements using linear regression. Instead of simply reacting to historical data, this indicator provides a statistical projection of the RSI’s future behavior, offering a forward-looking view of market conditions.
⯁ Real-Time RSI Forecasting
For the first time, a public RSI indicator integrates linear regression (least squares method) to forecast the RSI’s future behavior. This innovative approach allows traders to anticipate market movements based on historical trends. By applying Linear Regression to the RSI, the indicator displays a projected trendline n periods ahead, helping traders make more informed buy or sell decisions.
⯁ Highly Customizable
The indicator is fully adaptable to any trading style. Dozens of parameters can be optimized to match your system. All 28 long and short entry conditions are selectable and configurable, allowing the construction of quantitative, statistical, and automated trading models. Full control over signals ensures precise alignment with your strategy.
⯁ Innovative and Science-Based
This is the first public RSI indicator to apply least-squares predictive modeling to RSI calculations. Technically, it incorporates machine-learning logic into a classic indicator. Using Linear Regression embeds strong statistical foundations into RSI forecasting, making this tool especially valuable for traders seeking quantitative and analytical advantages.
⯁ Scientific Foundation: Linear Regression
Linear regression is a fundamental statistical method that models the relationship between a dependent variable y and one or more independent variables x. The general formula for simple linear regression is:
y = β₀ + β₁x + ε
where:
y = predicted variable (e.g., future RSI value)
x = explanatory variable (e.g., bar index or time)
β₀ = intercept (value of y when x = 0)
β₁ = slope (rate of change of y relative to x)
ε = random error term
The goal is to estimate β₀ and β₁ by minimizing the sum of squared errors. This is achieved using the least squares method, ensuring the best linear fit to historical data. Once the coefficients are calculated, the model extends the regression line forward, generating the RSI projection based on recent trends.
⯁ Least Squares Estimation
To minimize the error between predicted and observed values, we use the formulas:
β₁ = Σ((xᵢ - x̄)(yᵢ - ȳ)) / Σ((xᵢ - x̄)²)
β₀ = ȳ - β₁x̄
Σ denotes summation; x̄ and ȳ are the means of x and y; and i ranges from 1 to n (number of observations). These equations produce the best linear unbiased estimator under the Gauss–Markov assumptions — constant variance (homoscedasticity) and a linear relationship between variables.
⯁ Linear Regression in Machine Learning
Linear regression is a foundational component of supervised learning. Its simplicity and precision in numerical prediction make it essential in AI, predictive algorithms, and time-series forecasting. Applying regression to RSI is akin to embedding artificial intelligence inside a classic indicator, adding a new analytical dimension.
⯁ Visual Interpretation
Imagine a time series of RSI values like this:
Time →
RSI →
The regression line smooths these historical values and projects itself n periods forward, creating a predictive trajectory. This projected RSI line can cross the actual RSI, generating sophisticated entry and exit signals. In summary, the RSI Forecast Colorful indicator provides both the current RSI and the forecasted RSI, allowing comparison between past and future trend behavior.
⯁ Summary of Scientific Concepts Used
Linear Regression: Models relationships between variables using a straight line.
Least Squares: Minimizes squared prediction errors for optimal fit.
Time-Series Forecasting: Predicts future values from historical patterns.
Supervised Learning: Predictive modeling based on known output values.
Statistical Smoothing: Reduces noise to highlight underlying trends.
⯁ Why This Indicator Is Revolutionary
Scientifically grounded: Built on statistical and mathematical theory.
First of its kind: The first public RSI with least-squares predictive modeling.
Intelligent: Incorporates machine-learning logic into RSI interpretation.
Forward-looking: Generates predictive, not just reactive, signals.
Customizable: Exceptionally flexible for any strategic framework.
⯁ Conclusion
By combining RSI and linear regression, the RSI Forecast Colorful allows traders to predict market momentum rather than simply follow it. It's not just another indicator: it's a scientific advancement in technical analysis technology. Offering 28 configurable entry conditions and advanced signals, this open-source indicator paves the way for innovative quantitative systems.
⯁ Example of simple linear regression with one independent variable
This example demonstrates how a basic linear regression works when there is only one independent variable influencing the dependent variable. This type of model is used to identify a direct relationship between two variables.
⯁ In linear regression, observations (red) are considered the result of random deviations (green) from an underlying relationship (blue) between a dependent variable (y) and an independent variable (x)
This concept illustrates that sampled data points rarely align perfectly with the true trend line. Instead, each observed point represents the combination of the true underlying relationship and a random error component.
⯁ Visualizing heteroscedasticity in a scatterplot with 100 random fitted values using Matlab
Heteroscedasticity occurs when the variance of the errors is not constant across the range of fitted values. This visualization highlights how the spread of data can change unpredictably, which is an important factor in evaluating the validity of regression models.
⯁ The datasets in Anscombe’s quartet were designed to have nearly the same linear regression line (as well as nearly identical means, standard deviations, and correlations) but look very different when plotted
This classic example shows that summary statistics alone can be misleading. Even with identical numerical metrics, the datasets display completely different patterns, emphasizing the importance of visual inspection when interpreting a model.
⯁ Result of fitting a set of data points with a quadratic function
This example illustrates how a second-degree polynomial model can better fit certain datasets that do not follow a linear trend. The resulting curve reflects the true shape of the data more accurately than a straight line.
⯁ What Is RSI?
The RSI (Relative Strength Index) is a technical indicator developed by J. Welles Wilder. It measures the velocity and magnitude of recent price movements to identify overbought and oversold conditions. The RSI ranges from 0 to 100 and is commonly used to identify potential reversals and evaluate trend strength.
⯁ How RSI Works
RSI is calculated from average gains and losses over a set period (commonly 14 bars) and plotted on a 0–100 scale. It consists of three key zones:
Overbought: RSI above 70 may signal an overbought market.
Oversold: RSI below 30 may signal an oversold market.
Neutral Zone: RSI between 30 and 70, indicating no extreme condition.
These zones help identify potential price reversals and confirm trend strength.
⯁ Entry Conditions
All conditions below are fully customizable and allow detailed control over entry signal creation.
📈 BUY
🧲 Signal Validity: Signal remains valid for X bars.
🧲 Signal Logic: Configurable using AND or OR.
🧲 RSI > Upper
🧲 RSI < Upper
🧲 RSI > Lower
🧲 RSI < Lower
🧲 RSI > Middle
🧲 RSI < Middle
🧲 RSI > MA
🧲 RSI < MA
🧲 MA > Upper
🧲 MA < Upper
🧲 MA > Lower
🧲 MA < Lower
🧲 RSI (Crossover) Upper
🧲 RSI (Crossunder) Upper
🧲 RSI (Crossover) Lower
🧲 RSI (Crossunder) Lower
🧲 RSI (Crossover) Middle
🧲 RSI (Crossunder) Middle
🧲 RSI (Crossover) MA
🧲 RSI (Crossunder) MA
🧲 MA (Crossover)Upper
🧲 MA (Crossunder)Upper
🧲 MA (Crossover) Lower
🧲 MA (Crossunder) Lower
🧲 RSI Bullish Divergence
🧲 RSI Bearish Divergence
🔮 RSI (Crossover) Forecast MA
🔮 RSI (Crossunder) Forecast MA
📉 SELL
🧲 Signal Validity: Signal remains valid for X bars.
🧲 Signal Logic: Configurable using AND or OR.
🧲 RSI > Upper
🧲 RSI < Upper
🧲 RSI > Lower
🧲 RSI < Lower
🧲 RSI > Middle
🧲 RSI < Middle
🧲 RSI > MA
🧲 RSI < MA
🧲 MA > Upper
🧲 MA < Upper
🧲 MA > Lower
🧲 MA < Lower
🧲 RSI (Crossover) Upper
🧲 RSI (Crossunder) Upper
🧲 RSI (Crossover) Lower
🧲 RSI (Crossunder) Lower
🧲 RSI (Crossover) Middle
🧲 RSI (Crossunder) Middle
🧲 RSI (Crossover) MA
🧲 RSI (Crossunder) MA
🧲 MA (Crossover)Upper
🧲 MA (Crossunder)Upper
🧲 MA (Crossover) Lower
🧲 MA (Crossunder) Lower
🧲 RSI Bullish Divergence
🧲 RSI Bearish Divergence
🔮 RSI (Crossover) Forecast MA
🔮 RSI (Crossunder) Forecast MA
🤖 Automation
All BUY and SELL conditions can be automated using TradingView alerts. Every configurable condition can trigger alerts suitable for fully automated or semi-automated strategies.
⯁ Unique Features
Linear Regression Forecast
Signal Validity: Keep signals active for X bars
Signal Logic: AND/OR configuration
Condition Table: BUY/SELL
Condition Labels: BUY/SELL
Chart Labels: BUY/SELL markers above price
Automation & Alerts: BUY/SELL
Background Colors: bgcolor
Fill Colors: fill
Linear Regression Forecast
Signal Validity: Keep signals active for X bars
Signal Logic: AND/OR configuration
Condition Table: BUY/SELL
Condition Labels: BUY/SELL
Chart Labels: BUY/SELL markers above price
Automation & Alerts: BUY/SELL
Background Colors: bgcolor
Fill Colors: fill

Institution Radar Institution Radar
Institution Radar compares Price RSI with Volume-Delta RSI to show when price moves are real (backed by volume) or fake (moving without volume).
This helps reveal two powerful concepts:
Absorption (Bullish or Bearish)
Absorption happens when a large limit order is sitting in the order book.
Market orders hit it over and over, but the level doesn't break.
This usually means:
Strong players are absorbing the aggressive orders
Price is likely to move in the opposite direction
The next candle often reacts immediately
Can lead to a full reversal or just a short 1–2 candle move
Exhaustion (Bullish or Bearish)
Exhaustion happens when institutions pull their limit orders away.
There is no real volume behind the move, so price drifts up or down easily.
This usually means:
The current move is weak
A slowdown, pullback, or reversal is likely
Often shows up right before a flip in direction
📌 What the Signals Mean
Green signal → next candles often push upward
Red signal → next candles often push downward
These can mark trend reversals or temporary 1–2 candle reactions
🎚️ Sensitivity Setting
You can adjust how strict the signals are:
Lower sensitivity = more signals, more noise
Higher sensitivity = fewer signals, but more accurate and stronger
A higher sensitivity is recommended if you only want the cleanest institutional moments.

RSI Divergence Strategy v6 What this does
Detects regular and hidden divergences between price and RSI using confirmed RSI pivots. Adds RSI@pivot entry gates, a normalized strength + volume filter, optional volume gate, delayed entries, and transparent risk management with rigid SL and activatable trailing. Visuals are throttled for clarity and include a gap-free horizontal RSI gradient.
How it works (simple)
🧮 RSI is calculated on your selected source/period.
📌 RSI pivots are confirmed with left/right lookbacks (lbL/lbR). A pivot becomes final only after lbR bars; before that, it can move (expected).
🔎 The latest confirmed pivot is compared against the previous confirmed pivot within your bar window:
• Regular Bullish = price lower low + RSI higher low
• Hidden Bullish = price higher low + RSI lower low
• Regular Bearish = price higher high + RSI lower high
• Hidden Bearish = price lower high + RSI higher high
💪 Each divergence gets a strength score that multiplies price % change, RSI change, and a volume ratio (Volume SMA / Baseline Volume SMA).
• Set Min divergence strength to filter tiny/noisy signals.
• Turn on the volume gate to require volume ratio ≥ your threshold (e.g., 1.0).
🎯 RSI@pivot gating:
• Longs only if RSI at the bullish pivot ≤ 30 (default).
• Shorts only if RSI at the bearish pivot ≥ 70 (default).
⏱ Entry timing:
• Immediate: on divergence confirm (delay = 0).
• Delayed: after N bars if RSI is still valid.
• RSI-only mode: ignore divergences; use RSI thresholds only.
🛡 Risk:
• Rigid SL is placed from average entry.
• Trailing activates only after unrealized gain ≥ threshold; it re-anchors on new highs (long) or new lows (short).
What’s NEW here (vs. the reference) — and why you may care
• Improved pivots + bar window → fewer early/misaligned signals; cleaner drawings.
• RSI@pivot gates → entries aligned with true oversold/overbought at the exact decision bar.
• Normalized strength + volume gate → ignore weak or low-volume divergences.
• Delayed entries → require the signal to persist N bars if you want more confirmation.
• Rigid SL + activatable trailing → trailing engages only after a cushion, so it’s less noisy.
• Clutter control + gradient → readable chart with a smooth RSI band look.
Suggested starting values (clear ranges)
• RSI@pivot thresholds: LONG ≤ 30 (oversold), SHORT ≥ 70 (overbought).
• Min divergence strength:
0.0 = off
3–6 = moderate filter
7–12 = strict filter for noisy LTFs
• Volume gate (ratio):
1.0 = at least baseline volume
1.2–1.5 = strong-volume only (fewer but cleaner signals)
• Pivot lookbacks:
lbL 1–2, lbR 3–4 (raise lbR to confirm later and reduce noise)
• Bar window (between pivots):
Min 5–10, Max 30–60 (increase Min if you see micro-pivots; increase Max for wider structures)
• Risk:
Rigid SL 2–5% on liquid majors; 5–10% on higher-volatility symbols
Trailing activation 1–3%, trailing 0.5–1.5% are common intraday starts
Plain-text examples
• BTCUSDT 1h → RSI 9, lbL 1, lbR 3, Min strength 5.0, Volume gate 1.0, SL 4.5%, Trail on 2.0%, Trail 1.0%.
• SPY 15m → RSI 8, lbL 1, lbR 3, Min strength 7.0, Volume gate 1.2, SL 3.0%, Trail on 1.5%, Trail 0.8%.
• EURUSD 4h → RSI 14, lbL 2, lbR 4, Min strength 4.0, Volume gate 1.0, SL 2.5%, Trail on 1.0%, Trail 0.5%.
Notes & limitations
• Pivot confirmation means the newest candidate pivot can move until lbR confirms it (expected).
• Results vary by timeframe/symbol/settings; always forward-test.
• Educational tool — no performance or profit claims.
Credits
• RSI by J. Welles Wilder Jr. (1978).
• Reference divergence script by eemani123:
• This version by tagstrading 2025 adds: improved pivot engine, RSI@pivot gating, normalized strength + optional volume gate, delayed entries, rigid SL and activatable trailing, and a gap-free RSI gradient.

Sentinel Nexus Dashboard [AGP] Ver.1.5Sentinel Nexus Dashboard is a versatile Pine Script designed as a comprehensive technical analysis tool. It condenses a variety of key indicators and metrics into a single, intuitive visual dashboard, providing an integrated view of market trends, momentum, volatility, and liquidity, all neatly organized on your TradingView chart.
Key Features and Benefits
All-in-One Dashboard: This script centralizes relevant information, offering a clean, efficient control panel that helps you make quick decisions without cluttering your chart with multiple overlays.
Trend Analysis with ADX: It incorporates the Average Directional Index (ADX) to measure trend strength. The dashboard displays ADX, DI+, and DI- values with dynamic color-coding to highlight trend intensity (e.g., blue for a very strong trend).
Momentum Analysis with MACD: The dashboard shows MACD line and signal line values in a table. The background color of the MACD values reflects the histogram's direction, allowing you to quickly identify crosses and shifts in market momentum.
Multi-Timeframe RSI Analysis: The RSI (Relative Strength Index) dashboard displays values across multiple timeframes (from 1 minute to 1 month). Overbought (77) and oversold (23) levels are color-coded for immediate identification of market conditions, making it an ideal tool for multi-timeframe analysis.
Smart and Dynamic Volume: The script uses a bar coloring algorithm based on average volume. Chart bars change color according to volume magnitude (extreme, high, average, or low) relative to the average, distinguishing between bullish and bearish bars. This helps you identify significant, liquidity-driven price movements.
Fair Value Analysis: The script calculates an asset's "fair value" using a noise filter (similar to a Kalman filter) on recent highs and lows to determine a midpoint. The price dashboard's background color changes to indicate if the current price is above or below this fair value.
Fibonacci EMA Analysis: A table displays several Exponential Moving Averages (EMAs) based on the Fibonacci sequence. The values are color-coded to show whether the current price is above (white) or below (orange) each EMA, helping you quickly identify dynamic support and resistance levels.
CME Futures Data Integration: For Bitcoin, the script can show a chart label with the Bitcoin futures price (CME:BTC1!), allowing you to compare the spot price with the CME futures market.
Potential Uses and Applications
The Sentinel Nexus Dashboard is an excellent support tool for trading. It is not a signal system but rather a suite of confirmation tools that can be used to:
Confirm Trend Strength: Before entering a trade, use the ADX data to ensure the trend has enough strength for your expected move.
Detect Reversal Points: Multi-timeframe RSI data can alert you to potential overbought or oversold conditions, indicating possible exhaustion of a price move.
Validate Price Movements: Bar coloring based on volume helps you determine if a price move is genuine and supported by strong market participation. High volume can confirm a breakout or reversal.
Identify Support and Resistance: The Fibonacci EMAs allow you to quickly visualize key levels where price might find support or resistance, aiding in planning entries and exits.
In short, this script is perfect for traders who want a comprehensive market overview without chart clutter. It efficiently integrates trend, momentum, and volume analysis in one place.
Legal Disclaimer
RISK WARNING:
This Pine Script is a technical analysis tool and should not be considered financial advice. Past performance of any indicator is no guarantee of future results. Trading in financial markets involves a high risk of loss and is not suitable for all investors. By using this indicator, you accept full responsibility for your trading decisions and acknowledge that any financial loss is your sole responsibility.
IMPORTANT:
Some script functions, such as the CME price label, may not work correctly if your TradingView subscription plan is not a paid one. Please check your plan's limitations to ensure the indicator's optimal functionality.

RMA Smoothed RSIRMA Smoothed RSI
Description:
An enhanced RSI built for cleaner intraday and swing reads. It applies RMA smoothing to damp noise.
How It Works
RSI (RMA-Smoothed):
Computes classic RSI from price changes and smooths the result with an additional RMA (user-controlled 3–7, where 5 is the sweet spot). This reduces whipsaw while preserving shifts in momentum.
How to Interpret
50 Midline = Bias Filter: Above 50 favors strength; below 50 favors weakness.
RSI vs RSI-MA Crosses: Cross up can precede thrust or mean-revert toward 50; cross down the opposite.
Inputs
Length: RSI period (default 14).
Source: Price source for RSI (default Close).
Smoothing: RMA smoothing length on RSI (3–7; default 3; 5 sweet spot).
Calculate Divergence: Toggle to compute pivots/divergences and enable alerts.
Moving Average Type: None, SMA, EMA, WMA, VWMA (default EMA).
MA Length: Length of the RSI-based MA (separate from RSI length).
Best For
Traders who want a cleaner RSI read without losing responsiveness.
Scalpers timing momentum shifts around the 50 line and MA crosses.
Swing traders using divergences as early reversal context.
Pro Tips
For fast intraday charts, start with Length 14, Smoothing 3–5, and EMA as the RSI-MA.
Use 50 reclaims/rejections as a simple regime filter.
Combine divergence labels with volume surges, key S/R, or volatility tools (e.g., BBW/TTM squeeze) to time entries.
Divergence alerts fire only if Calculate Divergence is enabled—keep it on if you rely on signals.

RSI DivergenceThe code originally belongs to Matthew J. Slabosz, the founder of Zen Trading (The Art of Trading). ✍️📈
👉 My contribution and improvement was adding a divergence line directly on the RSI chart.
Why? Because most people can’t confirm correctness just by reading the code. 🧑💻❌
They need to see it with their own eyes 👀✔️ — this prevents misinterpretation and makes divergences crystal clear.
✨ By adding these visual confirmations, the efficiency and usability of the code has been significantly enhanced. 🚀📊

Reversal Radar
**Reversal Radar - Multi-Indicator Confirmation System**
This script combines five proven technical analysis methods into a unified reversal signal, reducing false signals through multi-indicator confirmation.
**INDICATORS USED:**
1. ADX/Directional Movement System
Determines trend direction via +DI and -DI comparison. Signal only during downtrend condition (DI- > DI+). Filters out sideways markets.
2. Custom Linear Regression Momentum
Proprietary momentum calculation based on linear regression. Measures price deviation from Keltner Channel midline. Signal on negative but rising momentum (beginning trend reversal).
3. Williams VIX Fix (WVF)
Identifies panic-selling phases. Calculates relative distance to recent high. Signal when exceeding Bollinger Bands or historical percentiles.
4. RSI Oversold Filter
Default RSI < 35 (adjustable 30-40). Filters only oversold zones for reversal setups.
5. MACD Confirmation
Signal only when MACD below zero line and below signal line. Confirms ongoing weakness before potential reversal.
**FUNCTIONALITY:**
The system generates a BUY signal only when ALL activated filters are simultaneously met. Each indicator can be individually enabled/disabled. Flexible parameter adjustment for different markets/timeframes. Reduces false signals through multi-confirmation.
**APPLICATION:**
Suitable for swing trading on higher timeframes (4H, Daily), reversal strategies in oversold markets, and combination with additional confirmation indicators.
Setup: Activate desired filters, adjust parameters to market/timeframe, check BUY signal as entry opportunity. Additional confirmation through volume/support recommended.
**INNOVATION:**
The Custom Linear Regression Momentum is a proprietary development combining Keltner Channel logic with linear regression for more precise momentum detection than standard oscillators.
**DISCLAIMER:**
This tool serves as technical analysis support. No signal should be traded without additional confirmation and risk management.

RSI Long Only with Confirmed CrossbacksThis RSI-based long-only strategy aims to identify and trade potential reversals with confirmation to reduce false signals. It enters a long position only after the Relative Strength Index (RSI) first dips below a specified oversold threshold (default 44) and then crosses back above it, signaling a possible bullish reversal with momentum. The strategy avoids premature entries by requiring this two-step confirmation. Similarly, it exits the long position only after RSI first rises above the overbought threshold (default 70) and then crosses back below it, indicating a potential loss of bullish momentum. By waiting for RSI to travel beyond the thresholds and then revert, the strategy attempts to capture stronger and more reliable directional moves while filtering out temporary spikes.

RSI SwingRadar🧠 Strategy Overview
This long-only strategy combines RSI/MA crossovers with ATR-based risk management, designed for cleaner entries during potential bounce phases — especially tuned for assets like XMR/USDT.
🔍 Core Logic:
- RSI Crossover: Entry occurs when the 14-period RSI crosses above its 14-period SMA, signaling a potential shift in momentum.
- Oversold Filter: The RSI must have been below a user-defined oversold threshold (default: 35) on the previous candle, filtering for bounce setups after a pullback.
- ATR-Based Stop/Target: Stop-loss is placed below the low by a user-adjustable ATR multiplier (default: 0.5×). Take-profit is calculated with a Risk:Reward multiplier (default: 4×).
These elements work in tandem — RSI crossovers give momentum confirmation, oversold filtering adds context, and ATR-based exits adapt to volatility, creating a compact yet responsive strategy.
📉 Visuals:
- Dynamic Bands: The chart displays the active stop-loss, entry price, and take-profit as colored bands for easy visual tracking.
- Clean Overlay: Designed with simplicity — only confirmed setups are shown, keeping noise low.
✅ Suggested Use:
- Works best on XMR/USDT or similarly trending assets.
- Best suited for pullback entries during broader uptrends.
- Adjustable for different volatility conditions and asset behaviors.
⚠️ Disclaimer
- This strategy is for educational and research purposes only.
- It does not guarantee profitability in any market.
- Always backtest, forward-test, and understand your own risk tolerance before using any
strategy in a live environment.
- Past performance is not indicative of future results.
- This script is not financial advice.

RSI-EMA-Crossing with Donchian-Stop-LossThe Donchian RSI Indicator is a visual tool that combines momentum and trend analysis to identify high-quality long opportunities based on RSI crossovers, price action, and Donchian channel dynamics.
How It Works
Momentum Signal: A bullish RSI crossover is detected when the RSI crosses above its moving average.
Trend Filter: A signal is only valid if the crossover occurs while the price is above its moving average – filtering out entries against the prevailing trend.
Signal Candle: The high of the crossover candle is stored.
Entry Trigger: A valid signal occurs when a later candle closes above that signal high.
Stop-Loss (Visual Only)
The lower band of the Donchian Channel acts as a visual reference for a dynamic stop-loss level.
Features
Customizable RSI, Donchian Channel, and moving average lengths
Selectable MA types: SMA, EMA, WMA, VWMA, HMA
Signal candle highlighted (yellow background)
Entry points labeled on the chart
Price MA and Donchian Channel plotted
Trend filter improves signal quality by confirming upward bias
Use Case
Designed for swing and position traders
Optimized for use on daily or 4H charts

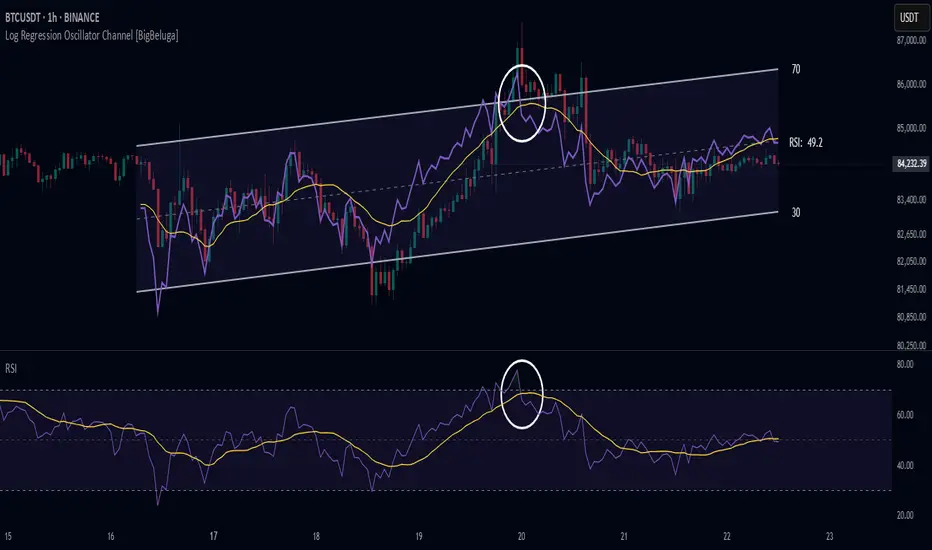
Log Regression Oscillator Channel [BigBeluga]
This unique overlay tool blends logarithmic trend analysis with dynamic oscillator behavior. It projects RSI, MFI, or Stochastic lines directly into a log regression channel on the price chart — offering an intuitive way to detect overbought/oversold momentum within the broader price structure.
🔵Key Features:
Logarithmic Regression Channel:
➣ Draws a trend-based channel using logarithmic regression, adapting to price growth curvature over time.
➣ Features upper, lower, and optional midline boundaries to visualize trend flow and range extremes.
Oscillator Overlay (RSI / MFI / Stochastic):
➣ Projects your chosen oscillator inside the channel using dynamic polylines.
➣ Allows switching between RSI, Money Flow Index, or Stochastic for versatile momentum insight.
Threshold-Based Scaling:
➣ The top and bottom of the channel represent traditional oscillator thresholds (e.g., RSI 70/30).
➣ Users can modify the scale in settings to customize what "overbought" or "oversold" means visually.
Signal Line Integration:
➣ Adds a yellow moving average (signal line) for smoother confirmation of oscillator turns.
➣ Helps identify divergence, momentum shifts, and fakeouts with better clarity.
Live Oscillator Readout:
➣ Displays the real-time oscillator value at the right edge of the chart.
➣ Ensures traders stay aware of current momentum levels without switching panels.
🔵Usage:
Momentum Context:
➣ When the oscillator touches the upper regression band, it may signal local overbought pressure.
➣ Touching the lower band may indicate oversold conditions within the current log trend.
Divergence Detection:
➣ Use the oscillator’s behavior relative to the channel slope to spot divergence from price.
➣ For example, RSI rising inside a falling channel can flag early trend shifts.
Trend-Sensitive Entries:
➣ Combine oscillator signals with log channel direction to filter trades in trend alignment.
➣ Signal line crossovers inside the channel act as early warning for momentum turns.
The Log Regression Oscillator Channel transforms how traders view classic momentum tools. By embedding oscillators into a logarithmic trend structure, it offers unmatched clarity on momentum positioning relative to price expansion. Ideal for swing traders, mean-reverters, or trend followers looking to sharpen entries and exits with style.
RSI Candles with EMA byAuncleJoeThe Relative Strength Index (RSI) is one of the most widely used momentum indicators in trading. It helps traders assess whether an asset is overbought or oversold by measuring the speed and magnitude of recent price changes. Traditionally, RSI is displayed as a single line oscillating between 0 and 100, but this representation can sometimes make it difficult to spot trends, reversals, and momentum shifts effectively.
To enhance RSI visualization and usability, the RSI Candles with EMA indicator transforms the RSI values into candlestick charts, providing a more intuitive and dynamic way to analyze momentum. Unlike the traditional RSI line, this approach allows traders to observe RSI trends just as they would analyze price charts, making it easier to detect changes in momentum and trend strength.
Each RSI candle represents a specific period’s momentum activity. Green candles indicate that the RSI closed higher than it opened, signaling bullish momentum, while red candles suggest that the RSI closed lower than it opened, indicating bearish sentiment. This candlestick-style visualization helps traders spot RSI trends, breakouts, and reversals more effectively than a simple line chart.
To further refine momentum analysis, this indicator also includes an Exponential Moving Average (EMA) of RSI. The EMA smooths RSI fluctuations and provides a clearer trend direction. When RSI candles remain above the EMA, it suggests strong buying momentum, whereas RSI candles falling below the EMA indicate increasing selling pressure. This combination of RSI candlesticks and an EMA line allows traders to better identify shifts in market sentiment and potential trend reversals.
Additionally, the indicator includes customizable overbought and oversold levels (defaulted at 70 and 30, respectively). These levels help traders recognize when an asset might be overextended in either direction, potentially signaling an upcoming reversal. When RSI candles approach or cross these thresholds, traders can anticipate possible changes in market direction.
This indicator is particularly useful for a wide range of traders. Scalpers and day traders can leverage it to quickly identify short-term momentum shifts, while swing traders can use it to detect potential reversals in multi-day trends. Trend-following traders can confirm bullish or bearish trends based on RSI’s position relative to its EMA, and mean reversion traders can use it to spot extreme conditions where price action might snap back.
By combining RSI candlesticks with an EMA filter, this indicator provides a more dynamic and visually intuitive approach to momentum trading. It offers clearer trend signals, better reversal detection, and enhanced decision-making, making it an essential tool for traders who rely on RSI-based strategies.

Adaptive RSI with Real-Time Divergence [AIBitcoinTrend]👽 Adaptive RSI Trailing Stop (AIBitcoinTrend)
The Adaptive RSI Trailing Stop is an indicator that integrates Gaussian-weighted RSI calculations with real-time divergence detection and a dynamic ATR-based trailing stop. This advanced approach allows traders to monitor momentum shifts, identify divergences early, and manage risk with adaptive trailing stop levels that adjust to price action.
👽 What Makes the Adaptive RSI with Signals and Trailing Stop Unique?
Unlike traditional RSI indicators, this version applies a Gaussian-weighted smoothing algorithm, making it more responsive to price action while reducing noise. Additionally, the trailing stop feature dynamically adjusts based on volatility and trend conditions, allowing traders to:
Detects real-time divergences (bullish/bearish) with a smart pivot-based system.
Filter noise with Gaussian weighting, ensuring smoother RSI transitions.
Utilize crossover-based trailing stop activation, for systematic trade management.
👽 The Math Behind the Indicator
👾 Gaussian Weighted RSI Calculation
Traditional RSI calculations rely on simple averages of gains and losses. Instead, this indicator weights recent price changes using a Gaussian distribution, prioritizing more relevant data points while maintaining smooth transitions.
Key Features:
Exponential decay ensures recent price changes are weighted more heavily.
Reduces short-term noise while maintaining responsiveness.
👾 Real-Time Divergence Detection
The indicator detects bullish and bearish divergences using pivot points on RSI compared to price action.
👾 Dynamic ATR-Based Trailing Stop
Bullish Trailing Stop: Activates when RSI crosses above 20 and dynamically adjusts based on low - ATR multiplier.
Bearish Trailing Stop: Activates when RSI crosses below 80 and adjusts based on high + ATR multiplier
This allows traders to:
Lock in profits systematically by adjusting stop-losses dynamically.
Stay in trades longer while maintaining adaptive risk management.
👽 How It Adapts to Market Movements
✔️ Gaussian Filtering ensures smooth RSI transitions while preventing excessive lag.
✔️ Real-Time Divergence Alerts provide early trade signals based on price-RSI discrepancies.
✔️ ATR Trailing Stop dynamically expands or contracts based on market volatility.
✔️ Crossover-Based Activation enables the stop-loss system only when RSI confirms a momentum shift.
👽 How Traders Can Use This Indicator
👾 Divergence Trading
Traders can use real-time divergence detection to anticipate reversals before they happen.
Bullish Divergence Setup:
Look for RSI making a higher low, while price makes a lower low.
Enter long when RSI confirms upward momentum.
Bearish Divergence Setup:
Look for RSI making a lower high, while price makes a higher high.
Enter short when RSI confirms downward momentum.
👾 Trailing Stop Signals
Bullish Signal and Trailing Stop Activation:
When RSI crosses above 20, a trailing stop is placed using low - ATR multiplier.
If price crosses below the stop, it exits the trade and removes the stop.
Bearish Signal and Trailing Stop Activation:
When RSI crosses below 80, a trailing stop is placed using high + ATR multiplier.
If price crosses above the stop, it exits the trade and removes the stop.
This makes trend-following strategies more efficient, while ensuring proper risk management.
👽 Why It’s Useful for Traders
✔️ Dynamic and Adaptive: Adjusts to changing market conditions automatically.
✔️ Noise Reduction: Gaussian-weighted RSI reduces short-term price distortions.
✔️ Comprehensive Strategy Tool: Combines momentum detection, divergence analysis, and automated risk management into a single indicator.
✔️ Works Across Markets & Timeframes: Suitable for stocks, forex, crypto, and futures trading.
👽 Indicator Settings
RSI Length: Defines the lookback period for RSI smoothing.
Gaussian Sigma: Controls how much weight is given to recent data points.
Enable Signal Line: Option to display an RSI-based moving average.
Divergence Lookback: Configures how far back pivot points are detected.
Crossover/crossunder values for signals: Set the crossover/crossunder values that triggers signals.
ATR Multiplier: Adjusts trailing stop sensitivity to market volatility.
Disclaimer: This indicator is designed for educational purposes and does not constitute financial advice. Please consult a qualified financial advisor before making investment decisions.

Position resetThe "Position Reset" indicator
The Position Reset indicator is a sophisticated technical analysis tool designed to identify possible entry points into short positions based on an analysis of market volatility and the behavior of various groups of bidders. The main purpose of this indicator is to provide traders with information about the current state of the market and help them decide whether to open short positions depending on the level of volatility and the mood of the main players.
The main components of the indicator:
1. Parameters for the RSI (Relative Strength Index):
The indicator uses two sets of parameters to calculate the RSI: one for bankers ("Banker"), the other for hot money ("Hot Money").
RSI for Bankers:
RSIBaseBanker: The baseline for calculating bankers' RSI. The default value is 50.
RSIPeriodBanker: The period for calculating the RSI for bankers. The default period is 14.
RSI for hot money:
RSIBaseHotMoney: The baseline for calculating the RSI of hot money. The default value is 30.
RSIPeriodHotMoney: The period for calculating the RSI for hot money. The default period is 21.
These parameters allow you to adjust the sensitivity of the indicator to the actions of different groups of market participants.
2. Sensitivity:
Sensitivity determines how strongly changes in the RSI will affect the final result of calculations. It is configured separately for bankers and hot money:
SensitivityBanker: Sensitivity for bankers' RSI. It is set to 2.0 by default.
SensitivityHotMoney: Sensitivity for hot money RSI. It is set to 1.0 by default.
Changing these parameters allows you to adapt the indicator to different market conditions and trader preferences.
3. Volatility Analysis:
Volatility is measured based on the length of the period, which is set by the volLength parameter. The default length is 30 candles. The indicator calculates the difference between the highest and lowest value for the specified period and divides this difference by the lowest value, thus obtaining the volatility coefficient.
Based on this coefficient, four levels of volatility are distinguished.:
Extreme volatility: The coefficient is greater than or equal to 0.25.
High volatility: The coefficient ranges from 0.125 to 0.2499.
Normal volatility: The coefficient ranges from 0.05 to 0.1249.
Low volatility: The coefficient is less than 0.0499.
Each level of volatility has its own significance for making decisions about entering a position.
4. Calculation functions:
The indicator uses several functions to process the RSI and volatility data.:
rsi_function: This function applies to every type of RSI (bankers and hot money). It adjusts the RSI value according to the set sensitivity and baseline, limiting the range of values from 0 to 20.
Moving Averages: Simple moving averages (SMA), exponential moving averages (EMA), and weighted moving averages (RMA) are used to smooth fluctuations. They are applied to different time intervals to obtain the average values of the RSI.
Thus, the indicator creates a comprehensive picture of market behavior, taking into account both short-term and long-term dynamics.
5. Bearish signals:
Bearish signals are considered situations when the RSI crosses certain levels simultaneously with a drop in indicators for both types of market participants (bankers and hot money).:
The bankers' RSI crossing is below the level of 8.5.
The current hot money RSI is less than 18.
The moving averages for banks and hot money are below their signal lines.
The RSI values for bankers are less than 5.
These conditions indicate a possible beginning of a downtrend.
6. Signal generation:
Depending on the current level of volatility and the presence of bearish signals, the indicator generates three types of signals:
Orange circle: Extremely high volatility and the presence of a bearish signal.
Yellow circle: High volatility and the presence of a bearish signal.
Green circle: Low volatility and the presence of a bearish signal.
These visual markers help the trader to quickly understand what level of risk accompanies each specific signal.
7. Notifications:
The indicator supports the function of sending notifications when one of the three types of signals occurs. The notification contains a brief description of the conditions under which the signal was generated, which allows the trader to respond promptly to a change in the market situation.
Advantages of using the "Position Reset" indicator:
Multi-level analysis: The indicator combines technical analysis (RSI) and volatility assessment, providing a comprehensive view of the current market situation.
Flexibility of settings: The ability to adjust the sensitivity parameters and the RSI baselines allows you to adapt the indicator to any market conditions and personal preferences of the trader.
Clear visualization: The use of colored labels on the chart simplifies the perception of information and helps to quickly identify key points for entering a trade.
Notification support: The notification sending feature makes it much easier to monitor the market, allowing you to respond to important events in time.

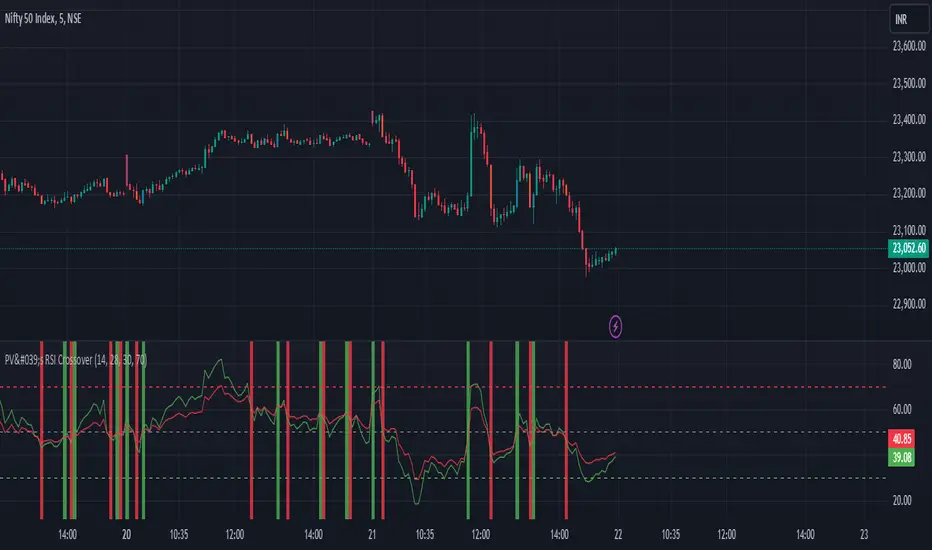
PV's Dual RSI Crossover StrategyIntroduction to the Dual RSI Two-Cross Indicator
The Relative Strength Index (RSI) is a widely used technical indicator in finance that measures the magnitude of recent price changes to determine overbought or oversold conditions. The RSI Two-Cross indicator takes this concept a step further by introducing a unique twist: it plots two RSI lines with different lengths and generates alerts based on their crossovers.
Key Features:
Dual RSI Lines: The indicator plots two RSI lines with user-defined lengths, allowing traders to compare the short-term and long-term momentum of an asset.
Crossover Alerts: The indicator generates alerts when the shorter RSI line crosses above or below the longer RSI line, indicating potential trend reversals or continuations.
Customizable Parameters: Users can adjust the lengths of the RSI lines, oversold and overbought levels, and other parameters to suit their trading strategy and asset of choice.
Visual Aids: The indicator features colored bars and backgrounds to highlight crossover events, making it easy to identify trading opportunities at a glance.
Trading Applications:
Trend Reversal Detection: The RSI Two-Cross indicator can help traders identify potential trend reversals by monitoring crossovers between the two RSI lines.
Momentum Confirmation: The indicator can be used to confirm momentum shifts in an asset's price, helping traders to filter out false signals and make more informed trading decisions.
Scalping and Day Trading: The indicator's short-term focus makes it suitable for scalping and day trading strategies, where traders aim to capitalize on small price movements.
By combining the versatility of the RSI with the power of crossover analysis, the RSI Two-Cross indicator offers a unique perspective on market momentum and trend dynamics. Whether you're a seasoned trader or just starting out, this indicator can help you navigate the markets with greater confidence and precision.
RSI Volatility Suppression Zones [BigBeluga]RSI Volatility Suppression Zones is an advanced indicator that identifies periods of suppressed RSI volatility and visualizes these suppression zones on the main chart. It also highlights breakout dynamics, giving traders actionable insights into potential market momentum.
🔵 Key Features:
Detection of Suppression Zones:
Identifies periods where RSI volatility is suppressed and marks these zones on the main price chart.
Breakout Visualization:
When the price breaks above the suppression zone, the box turns aqua, and an upward label is drawn to indicate a bullish breakout.
If the price breaks below the zone, the box turns purple, and a downward label is drawn for a bearish breakout.
Breakouts accompanied by a "+" label represent strong moves caused by short-lived, tight zones, signaling significant momentum.
Wave Labels for Consolidation:
If the suppression zone remains unbroken, a "wave" label is displayed within the gray box, signifying continued price stability within the range.
Gradient Intensity Below RSI:
A gradient strip below the RSI line increases in intensity based on the duration of the suppressed RSI volatility period.
This visual aid helps traders gauge how extended the low volatility phase is.
🔵 Usage:
Identify Breakouts: Use color-coded boxes and labels to detect breakouts and their direction, confirming potential trend continuation or reversals.
Evaluate Market Momentum: Leverage "+" labels for strong breakout signals caused by short suppression phases, indicating significant market moves.
Monitor Price Consolidation: Observe gray boxes and wave labels to understand ongoing consolidation phases.
Analyze RSI Behavior: Utilize the gradient strip to measure the longevity of suppressed volatility phases and anticipate breakout potential.
RSI Volatility Suppression Zones provides a powerful visual representation of RSI volatility suppression, breakout signals, and price consolidation, making it a must-have tool for traders seeking to anticipate market movements effectively.

AI InfinityAI Infinity – Multidimensional Market Analysis
Overview
The AI Infinity indicator combines multiple analysis tools into a single solution. Alongside dynamic candle coloring based on MACD and Stochastic signals, it features Alligator lines, several RSI lines (including glow effects), and optionally enabled EMAs (20/50, 100, and 200). Every module is individually configurable, allowing traders to tailor the indicator to their personal style and strategy.
Important Note (Disclaimer)
This indicator is provided for educational and informational purposes only.
It does not constitute financial or investment advice and offers no guarantee of profit.
Each trader is responsible for their own trading decisions.
Past performance does not guarantee future results.
Please review the settings thoroughly and adjust them to your personal risk profile; consider supplementary analyses or professional guidance where appropriate.
Functionality & Components
1. Candle Coloring (MACD & Stochastic)
Objective: Provide an immediate visual snapshot of the market’s condition.
Details:
MACD Signal: Used to identify bullish and bearish momentum.
Stochastic: Detects overbought and oversold zones.
Color Modes: Offers both a simple (two-color) mode and a gradient mode.
2. Alligator Lines
Objective: Assist with trend analysis and determining the market’s current phase.
Details:
Dynamic SMMA Lines (Jaw, Teeth, Lips) that adjust based on volatility and market conditions.
Multiple Lengths: Each element uses a separate smoothing period (13, 8, 5).
Transparency: You can show or hide each line independently.
3. RSI Lines & Glow Effects
Objective: Display the RSI values directly on the price chart so critical levels (e.g., 20, 50, 80) remain visible at a glance.
Details:
RSI Scaling: The RSI is plotted in the chart window, eliminating the need to switch panels.
Dynamic Transparency: A pulse effect indicates when the RSI is near critical thresholds.
Glow Mode: Choose between “Direct Glow” or “Dynamic Transparency” (based on ATR distance).
Custom RSI Length: Freely adjustable (default is 14).
4. Optional EMAs (20/50, 100, 200)
Objective: Utilize moving averages for trend assessment and identifying potential support/resistance areas.
Details:
20/50 EMA: Select which one to display via a dropdown menu.
100 EMA & 200 EMA: Independently enabled.
Color Logic: Automatically green (price > EMA) or red (price < EMA). Each EMA’s up/down color is customizable.
Configuration Options
Candle Coloring:
Choose between Gradient or Simple mode.
Adjust the color scheme for bullish/bearish candles.
Transparency is dynamically based on candle body size and Stochastic state.
Alligator Lines:
Toggle each line (Jaw/Teeth/Lips) on or off.
Select individual colors for each line.
RSI Section:
RSI Length can be set as desired.
RSI lines (0, 20, 50, 80, 100) with user-defined colors and transparency (pulse effect).
Additional lines (e.g., RSI 40/60) are also available.
Glow Effects:
Switch between “Dynamic Transparency” (ATR-based) and “Direct Glow”.
Independently applied to the RSI 100 and RSI 0 lines.
EMAs (20/50, 100, 200):
Activate each one as needed.
Each EMA’s up/down color can be customized.
Example Use Cases
Trend Identification:
Enable Alligator lines to gauge general trend direction through SMMA signals.
Timing:
Watch the Candle Colors to spot potential overbought or oversold conditions.
Fine-Tuning:
Utilize the RSI lines to closely monitor important thresholds (50 as a trend barometer, 80/20 as possible reversal zones).
Filtering:
Enable a 50 EMA to quickly see if the market is trading above (bullish) or below (bearish) it.

Multi-Feature IndicatorThe Multi-Feature Indicator combines three popular technical analysis tools — RSI, Moving Averages (MA), and MACD — into a single indicator to provide unified buy and sell signals. This script is designed for traders who want to filter out noise and focus on signals confirmed by multiple criteria.
Features:
RSI (Relative Strength Index):
Measures momentum and identifies overbought (70) and oversold (30) conditions.
A signal is triggered when RSI crosses these thresholds.
Moving Averages (MA):
Uses a short-term moving average (default: 9 periods) and a long-term moving average (default: 21 periods).
Buy signals occur when the short-term MA crosses above the long-term MA, indicating an uptrend.
Sell signals occur when the short-term MA crosses below the long-term MA, indicating a downtrend.
MACD (Moving Average Convergence Divergence):
A trend-following momentum indicator that shows the relationship between two moving averages of an asset's price.
Signals are based on the crossover of the MACD line and its signal line.
Unified Buy and Sell Signals:
Buy Signal: Triggered when:
RSI crosses above 30 (leaving oversold territory).
Short-term MA crosses above the long-term MA.
MACD line crosses above the signal line.
Sell Signal: Triggered when:
RSI crosses below 70 (leaving overbought territory).
Short-term MA crosses below the long-term MA.
MACD line crosses below the signal line.
Visualization:
The indicator plots the short-term and long-term moving averages on the price chart.
Green "BUY" labels appear below price bars when all buy conditions are met.
Red "SELL" labels appear above price bars when all sell conditions are met.
Parameters:
RSI Length: Default is 14. This controls the sensitivity of the RSI.
Short MA Length: Default is 9. This determines the short-term trend.
Long MA Length: Default is 21. This determines the long-term trend.
Use Case:
The Multi-Feature Indicator is ideal for traders seeking higher confirmation before entering or exiting trades. By combining momentum (RSI), trend (MA), and momentum shifts (MACD), it reduces false signals and enhances decision-making.
How to Use:
Apply the indicator to your chart in TradingView.
Look for "BUY" or "SELL" signals, which appear when all conditions align.
Use this tool in conjunction with other analysis techniques for best results.
Note:
The default settings are suitable for many assets, but you may need to adjust them for different timeframes or market conditions.
This indicator is meant to assist in trading decisions and should not be used as the sole basis for trading.
