Adaptive RSI [BOSWaves]Adaptive RSI - Percentile-Based Momentum Detection with Dynamic Regime Thresholds
Overview
Adaptive RSI is a self-calibrating momentum oscillator that identifies overbought and oversold conditions through historical percentile analysis, constructing dynamic threshold boundaries that adjust to evolving market volatility and momentum characteristics.
Instead of relying on traditional fixed RSI levels (30/70 or 20/80) or static overbought/oversold zones, regime detection, threshold placement, and signal generation are determined through rolling percentile calculation, smoothed momentum measurement, and divergence pattern recognition.
This creates adaptive boundaries that reflect actual momentum distribution rather than arbitrary fixed levels - tightening during low-volatility consolidation periods, widening during trending environments, and incorporating divergence analysis to reveal momentum exhaustion or continuation patterns.
Momentum is therefore evaluated relative to its own historical context rather than universal fixed thresholds.
Conceptual Framework
Adaptive RSI is founded on the principle that meaningful momentum extremes emerge relative to recent price behavior rather than at predetermined numerical levels.
Traditional RSI implementations identify overbought and oversold conditions using fixed thresholds that remain constant regardless of market regime, often generating premature signals in strong trends or missing reversals in range-bound markets. This framework replaces static threshold logic with percentile-driven adaptive boundaries informed by actual momentum distribution.
Three core principles guide the design:
Threshold placement should correspond to historical momentum percentiles, not fixed numerical levels.
Regime detection must adapt to current market volatility and momentum characteristics.
Divergence patterns reveal momentum exhaustion before price reversal becomes visible.
This shifts oscillator analysis from universal fixed levels into adaptive, context-aware regime boundaries.
Theoretical Foundation
The indicator combines smoothed RSI calculation, rolling percentile tracking, adaptive threshold construction, and multi-pattern divergence detection.
A Hull Moving Average (HMA) pre-smooths the price source to reduce noise before RSI computation, which then undergoes optional post-smoothing using configurable moving average types. Confirmed oscillator values populate a rolling historical buffer used for percentile calculation, establishing upper and lower thresholds that adapt to recent momentum distribution. Regime state persists until the oscillator crosses the opposing threshold, preventing whipsaw during consolidation. Pivot detection identifies swing highs and lows in both price and oscillator values, enabling regular divergence pattern recognition through comparative analysis.
Five internal systems operate in tandem:
Smoothed Momentum Engine : Computes HMA-preprocessed RSI with optional post-smoothing using multiple MA methodologies (SMA, EMA, HMA, WMA, DEMA, RMA, LINREG, TEMA).
Historical Buffer Management : Maintains a rolling array of confirmed oscillator values for percentile calculation with configurable lookback depth.
Percentile Threshold Calculation : Determines upper and lower boundaries by extracting specified percentile values from sorted historical distribution.
Persistent Regime Detection : Establishes bullish/bearish/neutral states based on threshold crossings with state persistence between signals.
Divergence Pattern Recognition : Identifies regular bullish and bearish divergences through synchronized pivot analysis of price and oscillator values with configurable range filtering.
This design allows momentum interpretation to adapt to market conditions rather than reacting mechanically to universal thresholds.
How It Works
Adaptive RSI evaluates momentum through a sequence of self-calibrating processes:
Source Pre-Smoothing: Input price undergoes 4-period HMA smoothing to reduce bar-to-bar noise before oscillator calculation.
RSI Calculation: Standard RSI computation applied to smoothed source over configurable length period.
Optional Post-Smoothing: Raw RSI value undergoes additional smoothing using selected MA type and length for cleaner regime detection.
Historical Buffer Population: Confirmed oscillator values accumulate in a rolling array with size limit determined by adaptive lookback parameter.
Percentile Threshold Extraction: Array sorts on each bar to calculate upper percentile (bullish threshold) and lower percentile (bearish threshold) values.
Regime State Persistence: Bullish regime activates when oscillator crosses above upper threshold, bearish regime activates when crossing below lower threshold, neutral regime persists until directional threshold breach.
Pivot Identification: Swing highs and lows detected in both oscillator and price using configurable left/right parameters.
Divergence Pattern Matching: Compares pivot relationships between price and oscillator within min/max bar distance constraints to identify regular bullish (price LL, oscillator HL) and bearish (price HH, oscillator LH) divergences.
Together, these elements form a continuously updating momentum framework anchored in statistical context.
Interpretation
Adaptive RSI should be interpreted as context-aware momentum boundaries:
Bullish Regime (Blue): Activated when oscillator crosses above upper percentile threshold, indicating momentum strength relative to recent distribution favors upside continuation.
Bearish Regime (Red): Established when oscillator crosses below lower percentile threshold, identifying momentum weakness relative to recent distribution favors downside continuation.
Upper Threshold Line (Blue)**: Dynamic resistance level calculated from upper percentile of historical oscillator distribution - adapts higher during trending markets, lower during ranging conditions.
Lower Threshold Line (Red): Dynamic support level calculated from lower percentile of historical oscillator distribution - adapts lower during downtrends, higher during consolidation.
Regime Fill: Gradient coloring between oscillator and baseline (50) visualizes current momentum intensity - stronger color indicates greater distance from neutral.
Extreme Bands (15/85): Upper and lower extreme zones with strength-modulated transparency reveal momentum extremity - darker shading during powerful moves, lighter during moderate momentum.
Divergence Lines: Connect price and oscillator pivots when divergence pattern detected, appearing on both price chart and oscillator pane for confluence identification.
Reversal Markers (✦): Diamond signals appear at 80+ (bearish extreme) and sub-15 (bullish extreme) levels, marking potential exhaustion zones independent of regime state.
Percentile context, divergence confirmation, and regime persistence outweigh isolated oscillator readings.
Signal Logic & Visual Cues
Adaptive RSI presents four primary interaction signals:
Regime Switch - Long : Oscillator crosses above upper percentile threshold after previously being in bearish or neutral regime, suggesting momentum strength shift favoring bullish continuation.
Regime Switch - Short : Oscillator crosses below lower percentile threshold after previously being in bullish or neutral regime, indicating momentum weakness shift favoring bearish continuation.
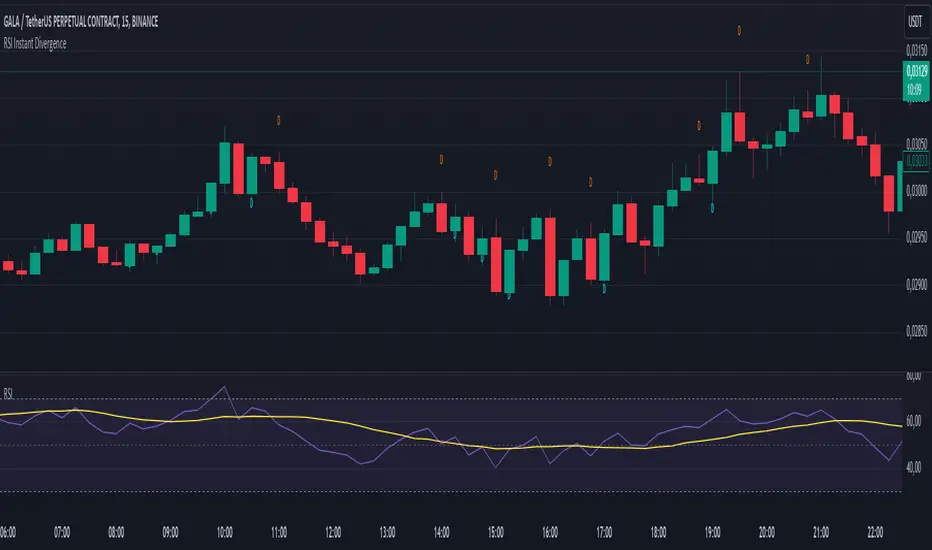
Regular Bullish Divergence (𝐁𝐮𝐥𝐥) : Price forms lower low while oscillator forms higher low, revealing positive momentum divergence during downtrends - often precedes reversal or consolidation.
Regular Bearish Divergence (𝐁𝐞𝐚𝐫) : Price forms higher high while oscillator forms lower high, revealing negative momentum divergence during uptrends - often precedes reversal or correction.
Alert generation covers regime switches, threshold crossings, and divergence detection for systematic monitoring.
Strategy Integration
Adaptive RSI fits within momentum-informed and mean-reversion trading approaches:
Adaptive Regime Following : Use threshold crossings as primary trend inception signals where momentum confirms directional breakouts within statistical context.
Divergence-Based Reversals : Enter counter-trend positions when divergence patterns appear at extreme oscillator levels (above 80 or below 20) for high-probability mean-reversion setups.
Threshold-Aware Scaling : Recognize that tighter percentile spreads (e.g., 45/50) generate more signals suitable for ranging markets, while wider spreads (e.g., 30/70) filter for stronger trend confirmation.
Extreme Zone Confluence : Combine reversal markers (✦) with divergence signals for maximum-conviction exhaustion entries.
Multi-Timeframe Regime Alignment : Apply higher-timeframe regime context to filter lower-timeframe entries, taking only setups aligned with dominant momentum direction.
Smoothing Optimization : Increase smoothing length in choppy markets to reduce false signals, decrease in trending markets for faster response.
Technical Implementation Details
Core Engine : HMA-preprocessed RSI with configurable smoothing (SMA, HMA, EMA, WMA, DEMA, RMA, LINREG, TEMA)
Adaptive Model : Rolling percentile calculation over confirmed oscillator values with size-limited historical buffer
Threshold Construction : Linear interpolation percentile extraction from sorted distribution array
Regime Detection : State-persistent threshold crossing logic with confirmed bar validation
Divergence Engine : Pivot-based pattern matching with range filtering and duplicate prevention
Visualization : Gradient-filled regime zones, adaptive threshold lines, strength-modulated extreme bands, dual-pane divergence lines
Performance Profile : Optimized for real-time execution with efficient array management and minimal computational overhead
Optimal Application Parameters
Timeframe Guidance:
1 - 5 min : Micro-structure momentum detection for scalping and intraday reversals
15 - 60 min : Intraday regime identification with divergence-validated turning points
4H - Daily : Swing and position-level momentum analysis with macro divergence context
Suggested Baseline Configuration:
RSI Length : 18
Source : Close
Smooth Oscillator : Enabled
Smoothing Length : 20
Smoothing Type : SMA
Adaptive Lookback : 1000
Upper Percentile : 50
Lower Percentile : 45
Divergence Pivot Left : 15
Divergence Pivot Right : 15
Min Pivot Distance : 5
Max Pivot Distance : 60
These suggested parameters should be used as a baseline; their effectiveness depends on the asset's volatility profile, momentum characteristics, and preferred signal frequency, so fine-tuning is expected for optimal performance.
Parameter Calibration Notes
Use the following adjustments to refine behavior without altering the core logic:
Too many whipsaw signals : Widen percentile spread (e.g., 40/60 instead of 45/50) to demand stronger momentum confirmation, or increase "Smoothing Length" to filter noise.
Missing legitimate regime changes : Tighten percentile spread (e.g., 48/52 instead of 45/50) for earlier detection, or decrease "Smoothing Length" for faster response.
Oscillator too choppy : Increase "Smoothing Length" for cleaner readings, or switch "Smoothing Type" to RMA/TEMA for heavier smoothing.
Thresholds not adapting properly : Reduce "Adaptive Lookback" to emphasize recent behavior (500-800 bars), or increase it for more stable thresholds (1500-2000 bars).
Too many divergence signals : Increase "Pivot Left/Right" values to demand stronger swing confirmation, or widen "Min Pivot Distance" to space out detections.
Missing significant divergences : Decrease "Pivot Left/Right" for faster pivot detection, or increase "Max Pivot Distance" to compare more distant swings.
Prefer different momentum sensitivity : Adjust "RSI Length" - lower values (10-14) for aggressive response, higher values (21-28) for smoother trend confirmation.
Divergences appearing too late : Reduce "Pivot Right" parameter to detect divergences closer to current price action.
Adjustments should be incremental and evaluated across multiple session types rather than isolated market conditions.
Performance Characteristics
High Effectiveness:
Markets with mean-reverting characteristics and consistent momentum cycles
Instruments where momentum extremes reliably precede reversals or consolidations
Ranging environments where percentile-based thresholds adapt to volatility contraction
Divergence-driven strategies targeting momentum exhaustion before price confirmation
Reduced Effectiveness:
Extremely strong trending markets where oscillator remains persistently extreme
Low-liquidity environments with erratic momentum readings
News-driven or gapped markets where momentum disconnects from price temporarily
Markets with regime shifts faster than adaptive lookback can recalibrate
Integration Guidelines
Confluence : Combine with BOSWaves structure, volume analysis, or traditional support/resistance
Threshold Respect : Trust signals that occur after clean threshold crossings with sustained momentum
Divergence Context : Prioritize divergences appearing at extreme oscillator levels (80+/15-) over those in neutral zones
Regime Awareness : Consider whether current market regime matches historical momentum patterns used for calibration
Multi-Pattern Confirmation : Seek divergence patterns coinciding with reversal markers or threshold rejections for maximum conviction
Disclaimer
Adaptive RSI is a professional-grade momentum and divergence analysis tool. It uses percentile-based threshold calculation that adapts to recent market behavior but cannot predict future regime shifts or guarantee reversal timing. Results depend on market conditions, parameter selection, lookback period appropriateness, and disciplined execution. BOSWaves recommends deploying this indicator within a broader analytical framework that incorporates price structure, volume context, and comprehensive risk management.
Pine Script® 인디케이터