JRien Position Sizer (Real-Time) — ATR / LOD / Manual % $ RiskReal time position sizing based on real time potential entry price and calculations based on max risk. Usable on multi timeframes. You can also input manually your entry and stop based on your own discretion. I usually use a spreadsheet to calculate these things but wanted a way to see this in real time without needing to type out Entry, ATR, Stops, etc - TradingView has all this information already so why not just have it automatically update!
4 Stop Types:
ATR Based Stop
Based on the stocks ATR (mainly used on daily charts but options if you use other timeframe ATR) and uses a multiple of that ATR to base the plot. Many traders use less than 0.6ATR to base your stop as a rule and max entry 60% from LOD as another rule.
Manual Percent Stop
You're able to input your desired % stop and this will dynamically move with the current entry (last) price.
Manual Price Stop
You're able to input your desired price $ stop and this will dynamically move with the current entry (last) price.
Low of Day (LOD) Stop
Calculates your position based on if you were to have your stop at LOD and also calculates % of ATR away from LOD. Many swing traders use LOD for their stop so this moving dynamically with the current LOD and automatically calculating this is useful.
Calculates:
Entry (Last)
ATR (14 | D)
ATR Stop Price
Manual Stop Percent
Manual Stop Price
Final Stop
Risk per Share ($)
Shares by Risk
Shares by Stake
Final Shares
Final Position Cost
Potential Stop Loss
LOD Price
Loss at LOD
LOD Risk % of Account
LOD dist as % of ATR
Customizable table - can hide items, change color and size.
Also an option to hide historical data - so plots start at market open!
Let me know if any calculations are incorrect, good luck!
- JRien
Riskmanagementtool

Multi-Entry Fibonacci CalculatorMulti-Entry Fibonacci Calculator
This tool is a comprehensive trade calculator designed for discretionary traders who plan to scale into positions. It automates the complex task of position sizing across up to three separate entries while ensuring your total risk exposure remains fixed. By inputting your desired entry, stop loss, and initial profit target levels, the script calculates the precise quantity for each entry and provides a dynamic, real-time view of your trade's vitals.
The primary goal of this script is to allow for disciplined risk management in multi-entry trade plans. Whether you are averaging into a position or adding on pullbacks, this tool ensures your total predefined risk is never exceeded, even if all entries are filled.
Key Features
Multi-Entry Position Sizing: Automatically calculates the share/contract size for up to three entries based on their distance from the stop loss and user-defined weights.
Fixed Risk Management: Define your total risk as a percentage of your account. The script ensures that a full stop-out across all filled entries will result in a loss equal to this predefined amount.
Dynamic Take Profit: The take-profit level automatically adjusts based on your current average entry price to preserve the original target profit amount in dollars.
Real-Time Info Panel: A customizable on-chart panel displays all critical trade data, including current quantity, average price, projected P&L, and trade status.
Visual Trade Plan: Plots all your defined price levels (entries, stop loss, take profit) directly on the chart with informative labels.
Trade State Tracking & Alerts: The script monitors the price and will trigger alerts when entries are hit, or when the stop loss or take profit levels are reached.
How to Use
Configure Account & Risk: In the settings, enter your "Account Size" and the "Risk per Trade (%)" you are willing to take on the entire position.
Set Trade Direction: Choose either "LONG" or "SHORT".
Input Price Levels: Manually enter the prices for your entries (Entry 1, 2, 3), your "Stop Loss Price," and an "Initial TP Reference." The initial TP is used to calculate the target profit in dollars.
Distribute Position Weight: Assign weights to each entry (e.g., 50% for Entry 1, 30% for Entry 2, 20% for Entry 3). The total should sum to 100.
Monitor the Trade: Use the info panel and on-chart visuals to track the trade's progress. The script will show your average price as entries are filled and update the dynamic take-profit level accordingly.
Understanding the Calculations
Weighted Position Sizing: The script calculates sizes for each entry so that if all entries are filled and the stop loss is hit, your total loss will equal your predefined risk amount. It intelligently allocates size based on the distance of each entry from the stop loss and the weight you assign to it.
Dynamic Take Profit: The "Initial TP Reference" is used only to calculate a target profit in dollars based on your first entry's size. The script then calculates a dynamic TP line on your chart. This line adjusts based on your average entry price as positions are filled, ensuring that if price reaches this level, you will realize your original target dollar profit, regardless of how many entries were filled.
On-Chart Elements
Price Lines: Blue lines for entries, a red line for the stop loss, and a green line for the dynamic take profit.
Labels: Display the calculated quantity for each entry, the total risk amount at the stop loss, and the target profit amount at the take profit.
Average Price: Yellow circles plot your live average entry price as the position is built.
Info Panel: A comprehensive table showing live trade status, current quantity, average price, and projected profit/loss. The panel changes color to green on a TP hit and red on an SL hit.

Pi Cycle BTC Top + Pre-Alert BandsPi Cycle BTC Top + Pre-Alert Bands is an advanced implementation of the classic Pi Cycle Top model, designed for Bitcoin cycle analysis on higher timeframes (especially 1D BTCUSD/BTCUSD·INDEX).
The original Pi Cycle Top uses two moving averages:
• 111-day SMA (short MA)
• 350-day SMA ×2 (long MA)
A Pi Top is signaled when the 111 SMA crosses above the 350×2 SMA. Historically, this has occurred near major BTC cycle highs.
This script extends that idea with a 3-step early-warning sequence:
• Pi Green – early compression: short/long MA ratio crosses upward into the green band (convergence from below is required).
• Pi Yellow – mid-cycle warning: only fires if a valid Green has already occurred in the same cycle.
• Pi Cycle Top – final top: the classic Pi Cycle cross, limited to one top signal per cycle. After a top, no new Yellow or Top signals can appear until a new Green event starts the next cycle.
Background shading shows the active phase (Green / Yellow / late-cycle zone), so you can see at a glance where BTC is within its Pi-based macro structure.
All logic is non-repainting: request.security() uses lookahead_off and no future data is accessed.
Typical use
This indicator is intended as a macro-cycle timing and risk-awareness tool, not a stand-alone entry system. Many traders use it to:
• Watch for Pi Green as the start of a potential late-cycle advance.
• Treat Pi Yellow as a rising-risk environment and tighten risk management.
• Use the Pi Cycle Top as a historical high-risk zone where large profit-taking or hedging may be considered.
Always combine this with your own analysis (trend, volume, on-chain, macro) before making decisions.
How to set alerts
Add the indicator to your chart (1D BTCUSD or BTCUSD·INDEX recommended).
Click Alerts → Condition → Pi Cycle BTC Top + Pre-Alert Bands.
Choose one of:
• Pi Cycle – Green Pre-Alert (early convergence)
• Pi Cycle – Yellow Pre-Alert (after Green only)
• Pi Cycle – TOP (Single per Cycle, after Green)
Use “Once per bar close” for higher-timeframe reliability.
Disclaimer
This tool is for educational and analytical purposes only. The Pi Cycle concept is based on historical behavior and does not guarantee future results. This is not financial advice; always do your own research and manage risk appropriately.

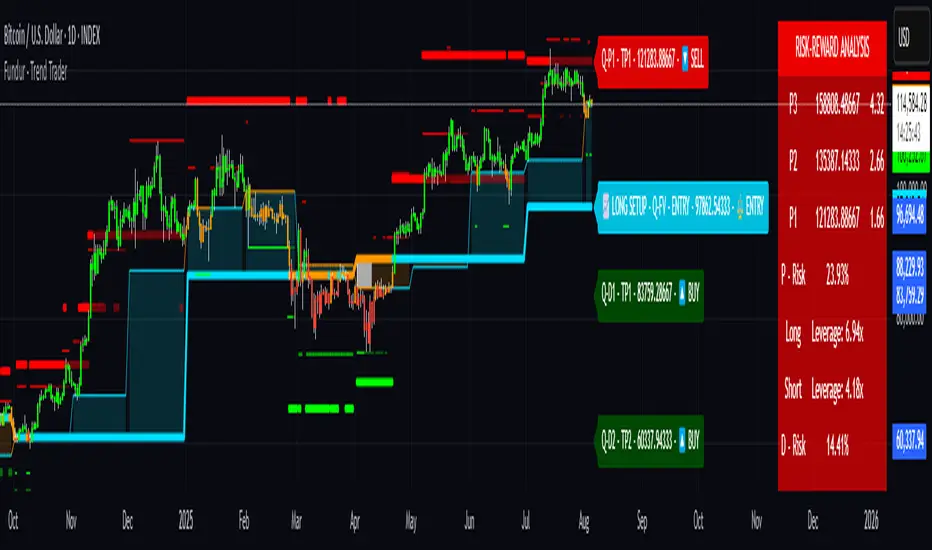
Fundur - Trend TraderFundur - Trend Trader: Complete Trading Indicator Guide
Indicator Overview
The Fundur - Trend Trader is a comprehensive dual-timeframe analysis indicator that combines fair value structure analysis, risk-reward calculations, and dynamic trend identification into one powerful trading tool. This indicator is designed to provide traders with precise entry and exit points while offering complete risk management insights.
What Makes Trend Trader Unique?
The Trend Trader goes beyond traditional pivot point indicators by introducing Fair Value Structure Analysis - a methodology that analyzes the relationship between two timeframes to determine market bias and optimal trading opportunities. Unlike static indicators, Trend Trader provides dynamic analysis that adapts to market conditions in real-time.
Core Methodology
The indicator operates on the principle that markets oscillate between Premium (overvalued) and Discount (undervalued) zones relative to fair value levels. By analyzing these zones across multiple timeframes, traders can identify high-probability trade setups with clearly defined risk-reward parameters.
Key Features
🎯 Dual-Timeframe Fair Value Analysis
Higher Timeframe Structure : Primary trend direction and major levels
Lower Timeframe Structure : Refined entry opportunities and micro-trend analysis
Dynamic Relationship : Real-time analysis of timeframe alignment
📊 Comprehensive Level System
Fair Value (FV) : Central equilibrium level for entries
Premium Levels (P1, P2, P3) : Sell zones with increasing distance from fair value
Discount Levels (D1, D2, D3) : Buy zones with increasing distance from fair value
🧠 Intelligent Trend Detection
Session-to-Session Analysis : Compares current vs previous session fair values
Trend Signals : Clear LONG/SHORT setup identification
Structure Bias : Bullish/Bearish fair value structure determination
⚖️ Advanced Risk-Reward System
Real-Time R:R Calculations : Dynamic risk-reward ratios for all levels
Leverage Recommendations : Optimal position sizing based on measured risk
Risk Percentage Display : Precise risk calculations for informed decisions
🎨 Smart Visual Features
Level Hit Tracking : Automatically darkens touched levels during session
Squeeze Detection : Identifies low-volatility periods with special bar coloring
Dynamic Highlighting : Price-responsive level emphasis
Zone Fills : Visual premium and discount area identification
Setup Guide
Step 1: Adding the Indicator
Open TradingView and navigate to your desired chart
Click the "Indicators" button or press "/" key
Search for "Fundur - Trend Trader"
Add the indicator to your chart
Step 2: Basic Configuration
Timeframe Settings
Higher Timeframe : Default is Weekly (W), adjust based on your trading style:
Scalping : Use 4H for higher timeframe
Day Trading : Use Daily (D) for higher timeframe
Short-Term Swing Trading : Use Weekly (W) for higher timeframe
Long-Term Swing Trading : Use Monthly (M) for higher timeframe
Position Trading : Use Quarterly (3M) or Yearly (12M) for higher timeframe
History Bars :
Higher Timeframe: 10 bars (recommended)
Lower Timeframe: 50 bars (recommended)
Visual Settings
Line Widths : Adjust for visibility preference
Zone Fills : Enable for better visual zone identification
Bar Coloring : Enable structure and squeeze coloring
Step 3: Label Configuration
Essential Labels (Recommended Settings)
✅ Show All Labels: ON
✅ Show Trend Direction: ON
✅ Show Higher Timeframe Labels: ON
⚠️ Show Lower Timeframe Labels: OFF (avoid clutter initially)
✅ Show Price Values: ON
Label Style Options
Use Short Names : ON (P1, D2, FV instead of full names)
Combine Timeframe & Description : ON (creates compact labels like "W-FV")
Label Style : Choose between Modern or Classic
Step 4: Risk-Reward Setup
✅ Show Risk-Reward Analysis: ON
✅ Show Measured Risk Values: ON
✅ Apply Leverage to Calculations: ON
Leverage Multiplier : Start with 1.0, adjust based on your risk tolerance
Basic Trading Guide
Understanding Fair Value Structure
The indicator's foundation is the Fair Value Structure - the relationship between higher and lower timeframe fair value levels:
Bullish Structure (🔵)
Condition : Lower timeframe FV above higher timeframe FV
Bias : Look for LONG opportunities
Focus : Fair Value Structure for entries (continuation strategy)
Strategy : Enter long positions at Fair Value, take profits at Premium levels (P1, P2, P3)
Bearish Structure (🟠)
Condition : Lower timeframe FV below higher timeframe FV
Bias : Look for SHORT opportunities
Focus : Fair Value Structure for entries (continuation strategy)
Strategy : Enter short positions at Fair Value, take profits at Discount levels (D1, D2, D3)
Entry Strategies
Primary Strategy: Fair Value Continuation Entries
Setup : Price approaches fair value level with established structure bias
Entry : In Fair Value Structure (in between the lower timeframe and higher timeframe fair value)
Direction : Follow the structure bias (long in bullish structure, short in bearish structure)
Stop Loss: Two approaches available:
Advanced Method : Place stop shy of liquidation point to avoid liquidation
Hassle-Free Method : Previous high/low OR just beyond higher timeframe Fair Value
For Long Positions : Stop below higher timeframe Fair Value
For Short Positions : Stop above higher timeframe Fair Value
Profit Taking Strategy:
For Long Positions (Bullish Structure):
75% profits at Premium 1 (P1) - highest probability target
50% of remaining position at Premium 2 (P2)
Close entire position at Premium 3 (P3)
Move stop loss to break even after first profits
For Short Positions (Bearish Structure):
75% profits at Discount 1 (D1) - highest probability target
50% of remaining position at Discount 2 (D2)
Close entire position at Discount 3 (D3)
Move stop loss to break even after first profits
Alternative Strategy: Structure Transition Entries
Setup : Structure changes from bearish to bullish (or vice versa)
Entry : At new fair value level after structure confirmation
Risk Management : Tight stops during structure transition periods
Targets : Follow primary profit-taking methodology above
Risk Management Framework
Position Sizing Using Leverage Recommendations
The indicator calculates optimal leverage based on measured risk:
Conservative : Use 50% of recommended leverage
Moderate : Use 75% of recommended leverage
Aggressive : Use 100% of recommended leverage
Never exceed : 150% of recommended leverage
Stop Loss Placement
Follow the methodology outlined in the Primary Strategy section:
Advanced Method : Place stop shy of liquidation point to avoid forced liquidation
Hassle-Free Method : Use structural levels for clear invalidation
Long Positions : Stop below higher timeframe Fair Value
Short Positions : Stop above higher timeframe Fair Value
Alternative : Previous significant high/low levels
Analysis Setups
Setup 1: Scalping Configuration (1-5 minute charts)
Timeframe Settings:
Higher Timeframe: 4H (240)
Lower Timeframe: 1H (auto-calculated)
History: 5 bars for higher, 20 bars for lower
Visual Settings:
Enable all visual features for quick decision making
Use Classic label style for cleaner appearance
Enable squeeze coloring for volatility awareness
Trading Approach:
Focus on fair value continuation entries
Quick entries in fair value structure
Tight risk management using R:R table
Target P1/D1 levels for primary profits (75% position)
Setup 2: Day Trading Configuration (5-15 minute charts)
Timeframe Settings:
Higher Timeframe: Daily (D)
Lower Timeframe: 4H (auto-calculated)
History: 10 bars for higher, 30 bars for lower
Visual Settings:
Enable zone fills for clear premium/discount identification
Show both timeframe labels
Enable level hit tracking
Trading Approach:
Use structure bias for directional bias
Enter in fair value structure for continuation trades
75% profits at P1/D1, scale out to P2/D2, close at P3/D3
Hold positions across multiple sessions following structure
Setup 3: Short-Term Swing Trading Configuration (1-4 hour charts)
Timeframe Settings:
Higher Timeframe: Weekly (W)
Lower Timeframe: Daily (auto-calculated)
History: 15 bars for higher, 50 bars for lower
Visual Settings:
Emphasize higher timeframe levels
Show trend direction signals
Enable complete risk-reward analysis
Trading Approach:
Primary focus on higher timeframe structure
Patient entries in fair value structure
Follow standard profit-taking: 75% at P1/D1, scale to P3/D3
Use lower timeframe for refined fair value entries
Setup 4: Long-Term Swing Trading Configuration (4H charts)
Timeframe Settings:
Higher Timeframe: Monthly (M)
Lower Timeframe: Weekly (auto-calculated)
History: 20 bars for higher, 75 bars for lower
Visual Settings:
Clean label setup focusing on major levels
Enable trend direction for bias confirmation
Simplified visual approach for clarity
Trading Approach:
Monthly structure provides major trend direction
Entries in fair value structure
Hold positions for several weeks
Apply standard profit-taking methodology at premium/discount zones
Setup 5: Position Trading Configuration (Daily/Weekly charts)
Timeframe Settings:
Higher Timeframe: Quarterly (3M) or Yearly (12M)
Lower Timeframe: Monthly or Quarterly (auto-calculated)
History: 25 bars for higher, 100 bars for lower
Visual Settings:
Clean label setup focusing on key levels
Enable all alert systems
Simplified color scheme
Trading Approach:
Structure changes signal major macro trend shifts
Very patient entries in fair value structure confirmation
Long-term continuation trades targeting extended premium/discount levels
Hold positions for months to years following structure bias
Focus on major market cycles and long-term trend continuations
Setup 6: Multi-Asset Analysis Configuration
For Forex Pairs:
Adjust decimal precision for pip accuracy
Focus on daily/weekly structure
Use tight risk management due to leverage
For Crypto Assets:
Higher volatility requires wider stops
24/7 markets need continuous monitoring
Structure breaks often lead to extended moves
For Stock Indices:
Respect market hours for structure analysis
Economic events can override technical levels
Seasonal patterns affect structure behavior
Visual Components
Level Indicators
Solid Lines : Active levels based on current price position
Highlighted Levels : Levels within current price range
Darkened Levels : Previously touched levels during current session
Zone Fills
Red Zones : Premium areas (selling opportunities)
Green Zones : Discount areas (buying opportunities)
Cloud Fill : Area between dual timeframe fair values
Bar Coloring
Purple Bars : Squeeze conditions (low volatility)
Structure Colors : Based on price position relative to fair value levels
Labels and Information
Level Labels : Price values and targets for each level
Trend Signals : Clear LONG/SHORT setup indications
Risk-Reward Table : Comprehensive analysis panel
Risk Management
Built-in Risk Controls
Measured Risk System
The indicator automatically calculates risk percentages based on:
Distance from fair value to premium/discount levels
Current price position
Leverage settings applied
Optimal Leverage Calculations
Long Positions : Based on discount risk measurement
Short Positions : Based on premium risk measurement
Dynamic Adjustment : Changes with market conditions
Risk-Reward Ratios
Each level displays its R:R ratio considering:
Entry point (fair value or current price)
Target level
Stop loss level
Applied leverage
Recommended Risk Parameters
Conservative Trading
Maximum 1-2% risk per trade
Use 50% of recommended leverage
Target R:R ratios above 2:1
Focus on high-probability setups only
Moderate Trading
Maximum 2-3% risk per trade
Use 75% of recommended leverage
Accept R:R ratios above 1.5:1
Trade multiple setups with correlation awareness
Aggressive Trading
Maximum 3-5% risk per trade
Use up to 100% of recommended leverage
Accept R:R ratios above 1:1
Active management required
Alert System
Structure Alerts
Fair Value Structure Bullish : When structure turns bullish
Fair Value Structure Bearish : When structure turns bearish
Level Interaction Alerts
For each premium and discount level:
Touch Alerts : When price reaches the level
Cross Above : When price breaks above the level
Cross Below : When price breaks below the level
Range Alerts
Rising into FV : Price enters fair value range from below
Falling into FV : Price enters fair value range from above
Rising Above FV : Price breaks above fair value range
Falling Below FV : Price breaks below fair value range
Setting Up Alerts
Enable desired alert types in indicator settings
Create TradingView alerts using the indicator
Configure notification methods (email, SMS, app)
Test alerts with historical data first
Customization Options
Color Schemes
Fair Value Colors : Customize based on structure bias
Premium/Discount Colors : Match your chart theme
Dynamic Coloring : Automatically adjusts based on price position
Label Customization
Text Transparency : Adjust readability
Background Transparency : Control label prominence
Size Options : From tiny to large based on chart size
Position Options : Multiple screen positions available
Table Settings
Position : 9 different screen positions
Size : 4 size options for different screen resolutions
Transparency : Adjust for chart readability
Best Practices
Chart Setup Recommendations
Screen Real Estate Management
Use larger timeframes for cleaner appearance
Minimize lower timeframe labels on smaller screens
Position risk-reward table to avoid price action interference
Multi-Timeframe Analysis
Keep one chart with higher timeframe focus
Use secondary chart for lower timeframe entries
Synchronize timeframe selection across charts
Trading Psychology Integration
Patience with Structure
Wait for clear structure bias before trading
Avoid trading during structure transition periods
Respect the higher timeframe bias
Risk Management Discipline
Never ignore the calculated risk percentages
Use leverage recommendations as guidelines, not rules
Adjust position sizes based on market conditions
Entry Timing
Use lower timeframes for precise entries
Wait for price to reach significant levels
Confirm entries with additional confluence factors
Common Mistakes to Avoid
Over-Analysis
Don't wait for perfect setups that may never come
Focus on high-probability scenarios
Accept that not every level will hold
Ignoring Structure Bias
Don't fight the overall structure direction
Adjust strategies when structure changes
Respect multi-timeframe alignment
Poor Risk Management
Never risk more than the indicator suggests
Don't ignore stop loss levels
Avoid emotional position sizing
Advanced Techniques
Structure Transition Trading
Identify when structure is changing
Position for new bias direction
Use tight risk management during transitions
Level Confluence
Look for multiple level alignments
Combine with support/resistance
Use volume analysis for confirmation
Seasonal and Market Hour Awareness
Adjust for different market sessions
Consider seasonal patterns in structure
Account for economic calendar events
Conclusion
The Fundur - Trend Trader indicator represents a comprehensive approach to modern technical analysis, combining traditional pivot point methodology with advanced fair value structure analysis. By following the guidelines in this manual and adapting the settings to your trading style, you can harness the full power of this indicator for more informed and profitable trading decisions.
Remember that no indicator is perfect, and the Trend Trader should be used as part of a complete trading strategy that includes fundamental analysis, risk management, and proper psychology. Start with conservative settings and gradually increase sophistication as you become more familiar with the indicator's behavior in different market conditions.
For best results, practice with the indicator in demo accounts first, understand its behavior in various market conditions, and always prioritize risk management over profit potential.
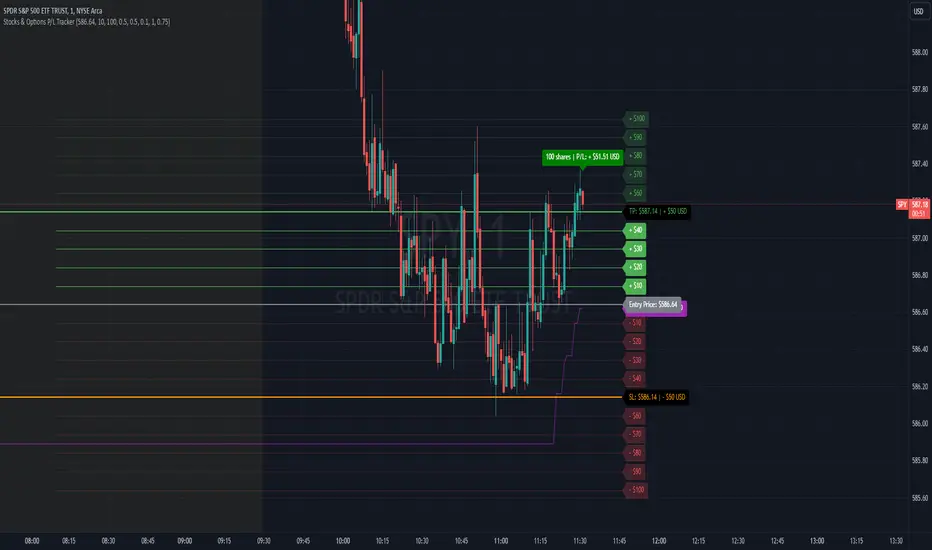
Stocks & Options P/L TrackerOverview:
The Stocks & Options P/L Tracker is a custom TradingView indicator developed to offer traders precise tracking of stocks & options trades’ profit and loss in real-time. It features a detailed display of P/L intervals, stop-loss and take-profit levels, and an adaptable trailing stop mechanism to help traders manage risk and optimize their trading strategies. This tool is particularly useful for active traders who seek immediate visual feedback on their trades’ performance.
Key Features:
Real-Time P/L Display: Computes and displays the P/L per contract/share and total P/L dynamically on the chart based on the specified entry price, relative to the current market price, and number of contracts or shares.
Configurable Take Profit and Stop Loss: Users can set take-profit and stop-loss amounts, and the indicator will visually mark these levels with corresponding dollar amounts for easy reference.
Trailing Stop Functionality: Offers an option to enable a trailing stop that automatically adjusts based on price movements.
Interval-Based P/L Tracking: Uses customizable intervals to display projected P/L levels above and below the entry price, helping users understand potential profit or loss scenarios at a glance.
Dynamic Labeling and Alerts: Visual labels are used to mark P/L, take-profit, stop-loss, trailing stop, and entry levels. These labels update dynamically on each new price bar to provide immediate insights into trade performance. NOTE: Due to TradingView's limitations with server-side alerts on fixed prices, dynamic alerts (for Take Profit, Stop Loss, and Trailing Stop) that adjust with price changes are not yet available. Alerts must be manually reset to your desired price each time.
Clean and Responsive Design: Utilizes color-coded labels and lines for P/L intervals, making it easy to distinguish profit, loss, stop, and take-profit zones. Colors adjust automatically to the current price to maintain clarity.
User Input Validation: Ensures appropriate input values for items like entry price, contract/share size, and profit/loss intervals to prevent errors and optimize performance.
Efficient Object Management: Implements object reusability for lines and labels to stay within Pine Script's object limits, ensuring smooth operation and maximum accuracy in real-time tracking.
Automatic Adjustments Based on Market Changes: Calculates and adjusts trailing stop levels dynamically based on highest price movement, which provides traders flexibility while maintaining risk controls.
Trader Benefits:
This indicator empowers traders with a robust tool to manage their trades visually and strategically on TradingView. The real-time feedback and customization options help traders make informed decisions, minimize risks, and maximize potential profits.
Happy Trading! :)
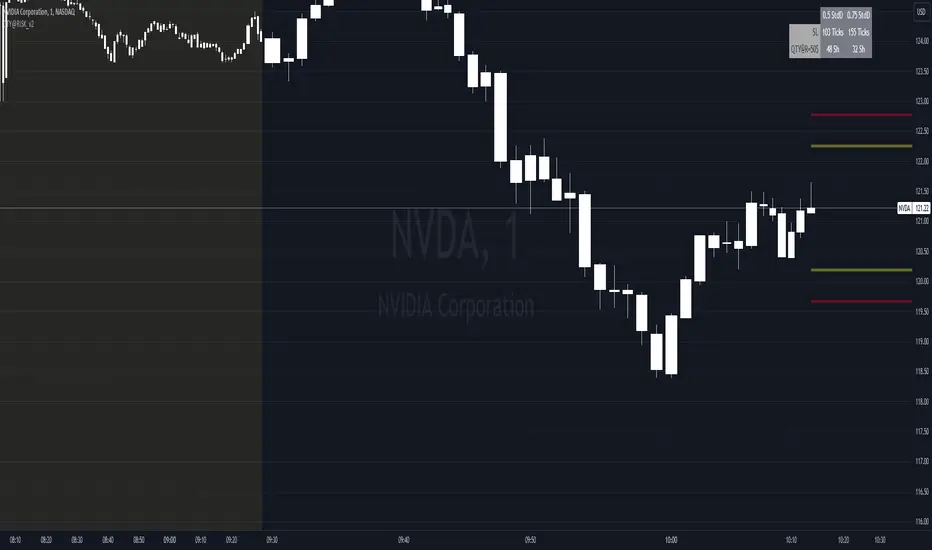
QTY@RISK VWAP based calculationVWAP Volatility-Based Risk Management Calculator for Intraday Trading
Overview
This script is an innovative tool designed to help traders manage risk effectively by calculating position sizes and stop-loss levels using the Volume Weighted Average Price (VWAP) and its standard deviation (StdDev). Unlike traditional methods that rely on time-based calculations, this approach is time-independent within the intraday timeframe, making it particularly useful for traders seeking precision and efficiency.
Key Concepts
VWAP (Volume Weighted Average Price): VWAP is a trading benchmark that represents the average price a security has traded at throughout the day, based on both volume and price. It provides insight into the average price level over a specific period, helping traders understand the market trend.
StdDev (Standard Deviation): In the context of VWAP, the standard deviation measures the volatility around the VWAP. It provides a quantifiable range that traders can use to set stop-loss levels, ensuring they are neither too tight nor too loose.
How the Script Works
1. VWAP Calculation: The script calculates the VWAP continuously as the market trades, integrating both price and volume data.
2. Volatility Measurement: It then computes the standard deviation of the VWAP, giving a measure of market volatility.
3. Stop-Loss Calculation: Using user-defined StdDev factors, the script calculates two stop-loss levels. These levels adjust dynamically based on market conditions, ensuring they remain relevant throughout the trading session.
4. Position Sizing: By incorporating your risk tolerance, the script determines the appropriate position size. This ensures that your maximum loss per trade does not exceed your predefined risk value.
How to Use the Calculator
1. Select Two VWAP StdDev Factors: Choose two standard deviation factors for calculating stop-loss levels. For example, you might choose 0.5 and 0.75 to set conservative and aggressive stop-losses respectively.
2. Set Your Trading Account Size: Enter your total trading capital. For example, $50,000.
3. Maximum Lot Size: Define the maximum number of shares you are willing to trade in a single position. For instance, 200 shares.
4. Risk Value per Trade: Input the maximum amount of money you are willing to risk on a single trade. For instance, $50.
5. Plotting Options: If you wish to visualize the stop-loss levels, enable the plot option and choose the price base for the plot, such as the closing price or the average of the high and low prices (hl2).
Example of Use
1. Initial Setup: After the market opens, wait for at least 15 minutes to ensure the VWAP has stabilized with sufficient volume data.
2. Parameter Configuration: Input your desired parameters into the calculator. For instance:
- VWAP StdDev Factors: 0.5 and 0.75
- Trading Account Size: $50,000
- Maximum Lot Size: 200 shares
- Risk Value per Trade: $50
- Plot Option: On, using "hl2" or "close" as the price base
3. Execution: Based on the inputs, the script calculates the position size and stop-loss levels. If the calculated stop-loss falls within the selected VWAP StdDev range, it will provide you with precise stop-loss prices.
4. Trading: Use the calculated position size and stop-loss levels to execute your trades confidently, knowing that your risk is managed effectively.
Advantages for Traders
- Time Independence: By relying on VWAP and its StdDev, the calculations are not dependent on specific time intervals, making them more adaptable to real-time trading conditions.
- Focus on Strategy: Novice traders can focus more on their trading strategies rather than getting bogged down with complex calculations.
- Dynamic Adjustments: The script adjusts stop-loss levels dynamically based on evolving market conditions, providing more accurate and relevant risk management.
- Flexibility: Traders can tailor the calculator to their risk preferences and trading style by adjusting the StdDev factors and risk parameters.
By incorporating these concepts and using this risk management calculator, traders can enhance their trading efficiency, improve their risk management, and ultimately make more informed trading decisions.
Curved Management (Zeiierman)█ Overview
The Curved Management (Zeiierman) is a trade management indicator tailored for traders looking to visualize their entry, stop loss, and take profit levels. Unique in its design, this indicator doesn't just display lines; it offers rounded or curved visualizations, setting it apart from conventional tools.
█ How It Works
At its core, this indicator leverages the power of the Average True Range (ATR), a metric for volatility, to establish logical stop-loss levels based on recent price action. By incorporating the ATR, the tool dynamically adapts to the market's changing volatility. What sets it apart is the unique curved visualization. Instead of the usual straight lines representing entry/sl levels, users can choose between rounded and straight edges for their take profit and stop loss levels. This aesthetic tweak gives the chart a cleaner look and offers a more intuitive understanding of risk management.
█ How to Apply the Indicator
Upon initially loading the indicator, a label appears that reads, "Set the 'xy' time and price for 'Curved Management (Zeiierman).'" This prompts you to click on the chart at your entry point. After selecting your entry point on the chart, the indicator will load. Ensure you adjust the trend direction in the settings panel based on whether you took a long or short position.
█ How to Use
Use the tool to manage your active position.
Long Entry
Short Entry
█ Settings
The indicator comes packed with various settings allowing customization:
Trade Direction
Decide the direction of the trade (long/short).
Reward multiplier
Sets the ratio for take profit relative to stop loss. Increasing this value will set your take profit further from the entry, and decreasing it will bring it closer.
Risk multiplier
Multiplier for calculating stop loss based on the ATR value. Increasing this makes your stop loss further from the entry, while decreasing brings it closer.
█ Related Free Scripts
Trade & Risk Management Tool
-----------------
Disclaimer
The information contained in my Scripts/Indicators/Ideas/Algos/Systems does not constitute financial advice or a solicitation to buy or sell any securities of any type. I will not accept liability for any loss or damage, including without limitation any loss of profit, which may arise directly or indirectly from the use of or reliance on such information.
All investments involve risk, and the past performance of a security, industry, sector, market, financial product, trading strategy, backtest, or individual's trading does not guarantee future results or returns. Investors are fully responsible for any investment decisions they make. Such decisions should be based solely on an evaluation of their financial circumstances, investment objectives, risk tolerance, and liquidity needs.
My Scripts/Indicators/Ideas/Algos/Systems are only for educational purposes!

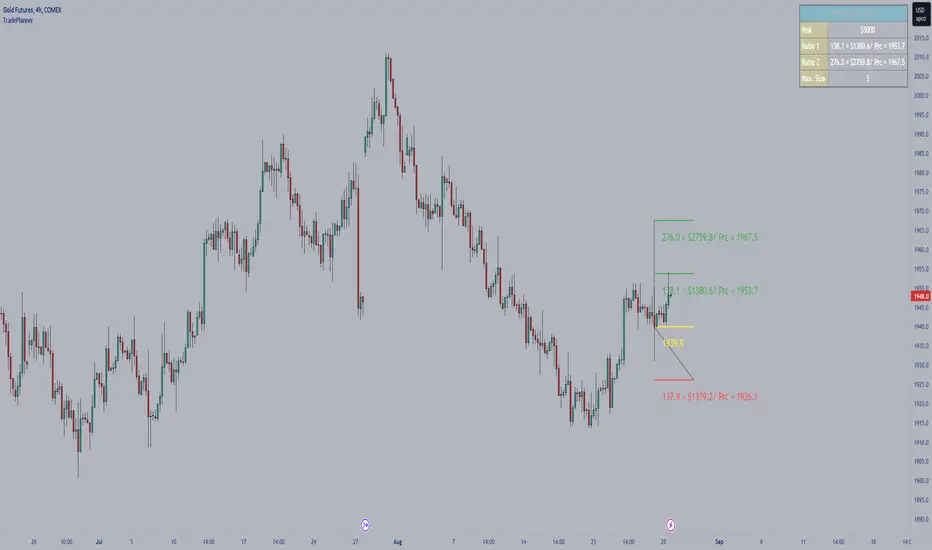
TradePlannerTradePlanner is trade planning tool which helps to map out your trade plan by displaying an entry line, a stop line, and multiple target lines (up to 5 targets) right on the chart. Each line can be configured to display the distance from the entry in terms of both number of ticks as well as the profit/loss in currency terms. An on-screen table quantifies and summarizes the entire trade plan information plus it calculates and displays the maximum lot size given the specified amount of risk you want to take per trade, which is totally customizable, all of which takes the guesswork out of trade planning.
Stop loss and position size calculator (ATR)Calculates and plots Stop Loss and Position Size, based on desired ATR factor.
Displays Stop Loss Price, SL Distance Percent and Position Size overlayed in the chart and plots a stop loss line.
Additionally Stop Loss, ATR, SL Distance and Position Size are also displayed in the Data Window.
Available settings:
Trade - long / short
ATR timeframe - Allows to use ATR based on different timeframe than the current chart.
ATR factor - Stop Loss will be calculated by multiplying ATR with this factor.
Show last - Amount of previous stop loss lines to plot
Line Offset - Positions previous sl calculation under/above current price.
Calculation Offset - Displays calculation based on price action of previous bar(s).
Label Display Distance - Defines position of label relative to current bar.
Risk - Amount you are going to risk if stop loss is hit.

Scalper's toolkit - ATR WidgetWidget specifically designed for scalping. Many settings to fit the instrument and view preferences to make it fit into your chart window how you like, even on mobile.
** I have 5 other features to add into this in the very near future, as I use this as my primary tool for Risk reward. This script will be updated in the near future as more features are coded into it. See bottom for notes on plans
Features:
Displays a quick view of the ATR value on the chart, in decimal PIPs or directly in Points - a key value for scalping using the DOM for point value settings and one click trading on fast time frames.
Automatic calculation of stop and target distance for a predetermined Risk Reward Ratio (Set with the settings panel), and then also displayed in PIPs or Points for easy use in quick trading.
Works on most all instruments/pairs/cryptos with multiple precision levels for correct values to be shown in the widget.
Fully customizable -
ATR period Base setting, just like a normal ATR indicator
Display in : PIPs or Points
ATR based stop distance, using a multiplier. 2 is the most common multiplier used, and the default setting.
Risk Reward Calculation using the Stop Loss value.
-Quickly helps with proper target and stop sizing for the volatility in the price on the current trade entry point.
-Set to any ratio you wish, from 1:0.1 all the way to 1:100 or more, unlimited R ratio settings to fit your strategy and risk tolerances.
Position anywhere on the chart window with 9 preset locations available (Pine script limitation)
Show as a column layout or a row layout
Customize the Size, with 5 preset widget sizes, from tiny to huge (Pine script limitation)
-Mobile Friendly - Tiny or Small may be too small on PC, but can be used for Mobile so the widget does not become too large over the chart.
Custom text, background, and boarder colors
Custom Boarder Size - 0 size is no boarder
Set up:
-Open the settings panel.
First section is the basic settings for the ATR - the length (Default is 14) and to use a PIP value display, or Point value display.
Here you also see a "Precision" Setting. **Because each instrument returns different precision ATR values, it is difficult to determine with code what those values will be ahead of time to do the math in the background. Even some 2 decimal instruments return 5 decimal ATR values, so this setting filters that** Just use the dropdown and choose how many decimal places the instrument has from 2 - 5 decimals
The second section is for risk and reward calculations, and can be disabled if you do not want to see these values.
The first value is the "ATR Multiplier" Typically, a 2x multiplier is used on the ATR to determine how far away to place your stop loss from the entry, placing it out of harm's way from normal market activity.
The second value is the Reward target distance, based from the stop loss size. This quickly calculates your target to match your intended reward ratio, saving some manual work to calculate this by hand every trade.
** Note: because of the math used in the code, you may see odd values on some instruments, like indexes. If you have the precision correct, try changing the "Show in Pips" to "Show in Points", as this may solve the issue.
The last two sections are purely for how the widget looks and how/where it shows on the screen. These can be set however you like. To have no boarder, just set the "Frame size" value to 0.
Additional Updates planned:
Pip value calculation (2 feature uses)
-This will serve 2 purposes. The widget will calculate the value of the trade based on the lot size. It will also have a risk limit, so if the ATR get's too high for the current risk settings, It will show red to warn you of a high risk situation before you trade.
Example, you have a set limit of 3 dollars per trade using .02 lot sizing. If the ATR get's too high, The Stop value will be more risk than you would like to use at that trade sizing. Reduce the trade size, or wait for ATR to come lower.
Purpose 2: lot size calculation, so if you wanted to maximize the use of risk available. If you wanted to risk 600 for example, it would use the ATR you have set for the risk, and determine the proper lot size for the amount of volatility in the market. This way, you Risk Exactly, or as close as possible to 600 for the the current trade conditions.
Extra use for this value: Show the Current trade amounts at risk and for gain in money values on the side of the pip/point value. Know what you're risking and also trading for in monetary value.
ATR candle Comparison- Early momentum Detection (2 feature uses)
Will show an additional section on the bottom of the widget to show how each candle compares to the one before, up to the last 5, and show if ATR went down, up, or stayed the same over the last 5 candles.
Show an additional symbol to indicate the current candle status in comparison to the close of the last candle. Real time of if the ATR is getting larger, smaller, or staying the same.

RISK MANAGEMENTHi dear Traders,
Here I would present you my 'Risk Management' tool which is based on your buy orders, trading fees and your desired benefit.
Easily, fulfill the price and volume of each entries. Add to this, you can prepare the info about your next proposed entries, just let them not check at first and by meeting the prices then active the check-box beside it.
Two line will be presented on your candle-plot, one of the indicate the place that without any lose/win you can exit and also the desired exit position by considering user defined benefit.
Use it for free but please do not forget to boost the script.
Best regards and happy trading.
Shakib

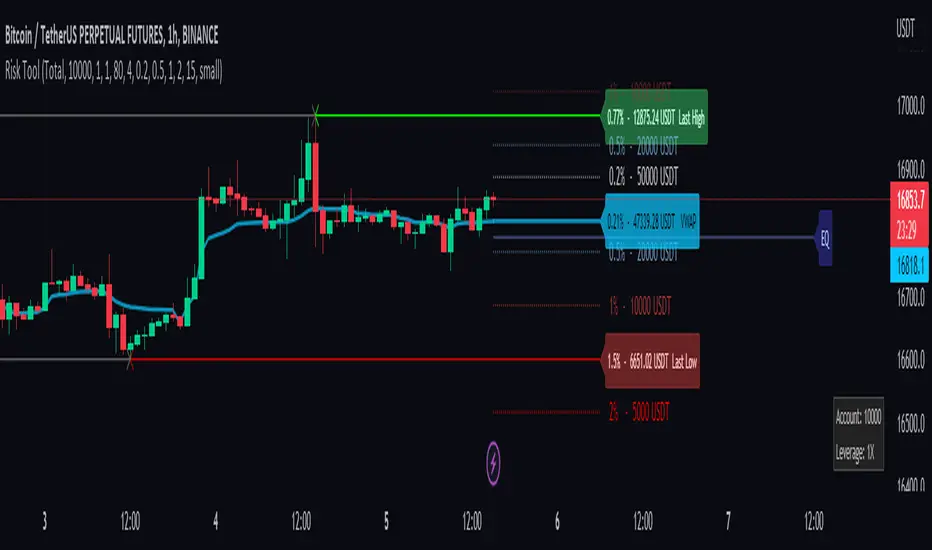
Risk Management ToolThis tool is a good way to get quick position sizing. No need to use your calculator and find that your price asset is already out of your range.
It works best with Cryptocurrencies Exchange way to manage position size calculation.
Really useful when scalping. This tool tracks the last high and low following your custom lookback bars number. It also follows the VWAP level.
You also have 4 custom ranges around the current price with the calculated position size. You set the desired percentage distance from the current price and you get the position size you need.
1. You choose the type of order
2. Account balance
3. Leverage if you use the cost base orders type
4. Amount to risk
and you get real-time risk management.
Value At Risk Channel [AstrideUnicorn]The Value at Risk Channel (VaR Channel) is a trading indicator designed to help traders control the level of risk exposure in their positions. The user can select a time period and a probability value, and the indicator will plot the upper and lower limits that the price can reach during the selected time period with the given probability.
CONCEPTS
The indicator is based on the Value at Risk (VaR) calculation. VaR is an important metric in risk management that quantifies the degree of potential financial loss within a position, portfolio or company over a specific period of time. It is widely used by financial institutions like banks and investment companies to forecast the extent and likelihood of potential losses in their portfolios.
We use the so-called “historical method” to compute VaR. The algorithm looks at the history of past returns and creates a histogram that represents the statistical distribution of past returns. Assuming that the returns follow a normal distribution, one can assign a probability to each value of return. The probability of a specific return value is determined by the distribution percentile to which it belongs.
HOW TO USE
Let’s assume you want to plot the upper and lower limits that price will reach within 4 hours with 5% probability. To do this, go to the indicator Settings tab and set the Timeframe parameter to "4 hours'' and the Probability parameter to 5.0.
You can use the indicator to set your Stop-Loss at the price level where it will trigger with low probability. And what's more, you can measure and control the probability of triggering.
You can also see how likely it is that the price will reach your Take-Profit within a specific period of time. For example, you expect your target level to be reached within a week. To determine this probability, set the Timeframe parameter to "1 week" and adjust the Probability parameter so that the upper or lower limit of your VaR channel is close to your Take-Profit level. The resulting Probability parameter value will show the probability of reaching your target in the expected time.
The indicator can be a useful tool for measuring and managing risk, as well as for developing and fine-tuning trading strategies. If you find other uses for the indicator, feel free to share them in the comments!
SETTINGS
Timeframe - sets the time period, during which the price can reach the upper or lower bound of the VaR channel with the probability, set by the Probability parameter.
Probability - specifies the probability with which the price can reach the upper or lower bound of the VaR channel during the time period specified by the Timeframe parameter.
Window - specifies the length of history (number of historical bars) used for VaR calculation.

Trade & Risk Management Tool (Expo)█ Trade & Risk Management Tool (Expo) is a sophisticated and complete trading tool that helps traders manage their position and risk. This tool makes risk and trade management simple and convenient; literally, anyone can use it. The key feature is its ability to set the stop-loss automatically.
█ The key feature of this tool is that it sets the stop loss automatically depending on the current market characteristics; in other words, it's a stop-loss that adapts dynamically and optimizes to suggest the best possible stop-loss at that time. In addition, the user can set the preferred risk-reward, and the tool will automatically calculate the RR and Take Profit Levels for you. There is also a possibility to add up to 4 take profit levels, all based on your set RR.
The Auto Stop-loss feature comes with even more customization, and the trader can enable a trailing stop and set a custom stop-loss instead of using the default one.
█ The Trade & Risk Management Tool also calculates the current position P&L in points/pips or %. Positions size is automatically calculated based on the account size and % of the capital you want to risk. In addition, we have added Expected Return in % for the active position. This is a feature that experienced traders commonly use. Set the Probability of Gain and the Probability of Loss, and the tool will calculate the expected return based on the SL and TP. The probability of gain/loss can be calculated using historical data or for experienced traders by making an educated guess.
█ Why is this tool needed?
Trade & Risk management is a key concept to grasp and use in your trading, and it's one of the most critical aspects that will determine your long-term success in this industry. The market is uncertain, and it's impossible to know what the future holds. The only way to take control of the unknown is to have a sound risk management system that ensures you don't blow your account in one trade. Therefore all traders need to understand the importance of using a risk- and money management tool that calculates and provides stop-loss and take-profit levels in real-time. This way, you will always know where to take your stop-loss and secure profit.
The position size calculator prevents you from taking too much risk and the predefined stop-loss and take-profit levels help you manage your position. The tool makes sure you maximize the profit potential while minimizing the losses. It also prevents you from taking too much risk.
It all comes down to managing the risk and managing profit. Make sure that you always know how much you can risk at each trade, where to put your stop-loss, and take profit. A general rule is to find a good balance between reward and risk (RR), preferably a risk-reward ratio of 2:1 or 3:1, where your targeted profits are always double that of your maximum losses.
█ This trading tool makes something so important so easy for you, and it's a must-have to succeed in trading for the long term.
█ HOW TO USE
Use the tool to manage your active position.
-----------------
Disclaimer
Copyright by Zeiierman.
The information contained in my Scripts/Indicators/Ideas/Algos/Systems does not constitute financial advice or a solicitation to buy or sell any securities of any type. I will not accept liability for any loss or damage, including without limitation any loss of profit, which may arise directly or indirectly from the use of or reliance on such information.
All investments involve risk, and the past performance of a security, industry, sector, market, financial product, trading strategy, backtest, or individual's trading does not guarantee future results or returns. Investors are fully responsible for any investment decisions they make. Such decisions should be based solely on an evaluation of their financial circumstances, investment objectives, risk tolerance, and liquidity needs.
My Scripts/Indicators/Ideas/Algos/Systems are only for educational purposes!

RealTime Max LeverageEver wanted a script that could tell you what is the maximum reasonably safe leverage if you were to open a trade and hold it for a given number of candles? This is it!
Using rate of change based volatility and the maximum expected number of candles/periods you will hold your trade for, based on your risk profile this indicator will tell you what is the maximum reasonable leverage.
Stop losses / take profits or some other prudent exit strategy should not be avoided. The idea is effectively to prevent yourself from using leverage that is too risky for the current market conditions on whatever timeframe you are entering your trade based on.
If you have any suggestions on how to improve the indicator, please leave a comment below!

Rob Hoffman's 50/80/90/Price Trailing Stop LossA trailing stop loss method by Rob Hoffman.
Set your entry, TP, and SL.
Once price is 50% of its way to the TP, set your stop loss at the gray line.
Once price is 80% of its way to the TP, set your stop loss at the light gray line.
Once price is 90% of its way to the TP set your stop loss at the white line.

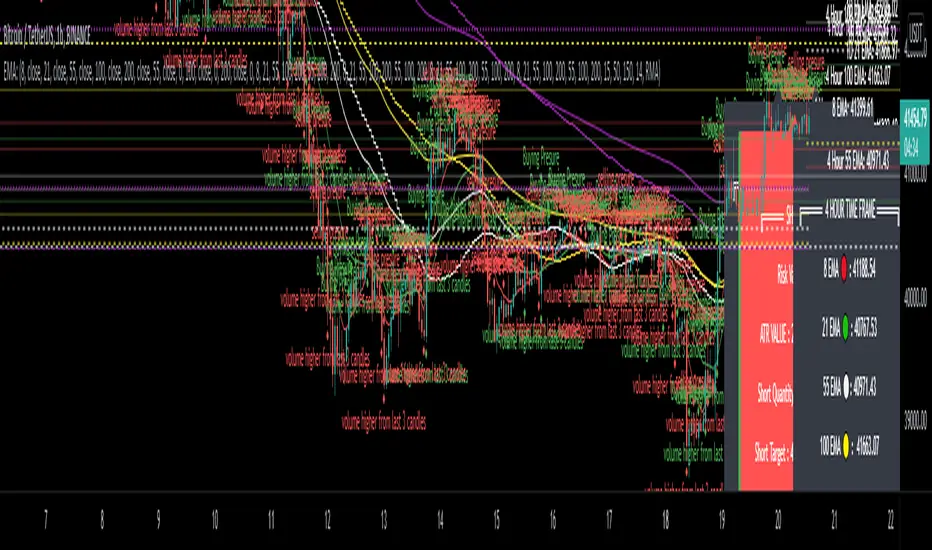
EMA - MA 21/55/100/200 with Horizontal Lines and LabelsThis indicator will help you to get dynamic support lines of EMA 21,55,100,200 and MA 55,100,200. You can get the Price of EMA And MA in Labels also.
SOLID LINES - 4 HOUR
DOTTED LINES - 1 DAY
DASHED LINE - 1 HOUR
Hope It will help you.
Trade with your own risk. I am not liable for any loss and profit based on this indicator.
Thank you.