Institutional Scanner FixHere is a professional Pine Script (Version 5) for TradingView. It is optimized to precisely identify the "Absorption" and "Reversal" signals.
What this script does for you:
Auto-Fibonacci: It automatically calculates the 0.618 Golden Ratio of the last 50 candles.
Volume Delta Check: It calculates the delta (buy volume minus sell volume) per candle.
Signal: It marks a "Buy Absorption" when the price touches the 0.618 level but the delta turns positive (green arrow).
The Volume Multiplier is your scanner's "sensitivity knob." It determines how much more volume compared to the average must flow for a signal to be classified as institutionally relevant. Here is the bank standard for calibration, based on your trading strategy and the asset's liquidity:
The rule-of-thumb values for the multiplier
Strategy Type | Recommended Value | Logic
Conservative (High Conviction) | 2.0 to 2.5 | Only extreme volume spikes are marked. Good for swing trades on a daily basis.
Standard (Day Trading) | 1.5 to 1.8 | The "sweet spot." Marks volume that is approximately 50-80% above average.
Aggressive (Scalping) | 1.2 to 1.3 | Reacts very quickly to small order flow changes but produces more "noise" (false signals).
Reversal-signals

AI Reversal Signals Custom [wjdtks255]📊 Indicator Overview: AI Reversal Signals Custom
This indicator is a comprehensive trend-following and reversal detection tool. It combines the long-term trend bias of a 200 EMA with highly sensitive RSI-based reversal signals and momentum visualization. It is designed to capture market bottoms and tops by identifying exhaustion points in price action.
Key Features
200 EMA (Trend Filter): A gold line representing the long-term institutional trend. It helps traders distinguish between "buying the dip" and "catching a falling knife."
Reversal Buy/Sell Labels: Real-time signals that appear when the market recovers from extreme overbought or oversold conditions.
Dynamic Background Clouds: Visual indicators of trend strength changes, highlighting potential entry zones.
Momentum Histogram: Internal calculations mimic the "Bottom Bars" seen in professional suites to track the velocity of price movement.
📈 Trading Strategy (How to Trade)
1. High-Probability Long Setup (Buy)
Trend Confirmation: Price should ideally be trading above the 200 EMA for the highest success rate.
Signal: Wait for the "BUY" label to appear below the candle.
Momentum: Confirm with the Light Green background or histogram shift indicating recovery.
Entry: Enter on the close of the signal candle.
2. High-Probability Short Setup (Sell)
Trend Confirmation: Price should ideally be trading below the 200 EMA.
Signal: Wait for the "SELL" label to appear above the candle.
Momentum: Confirm with the Red background or histogram fading from green to red.
Entry: Enter on the close of the signal candle.
3. Risk Management
Stop Loss: Place your Stop Loss slightly below the recent swing low for Buy orders, or above the recent swing high for Sell orders.
Take Profit: Exit when the price reaches a major support/resistance level or when an opposing signal appears.
💡 Professional Tip
For the best results, use this indicator on the 15-minute or 1-hour timeframes. The most powerful "Ultimate Reversal" signals occur when there is a Bullish Divergence (Price making lower lows while the RSI makes higher lows) followed by a confirmed "BUY" label.

CCI [Hash Adaptive]Adaptive CCI Pro: Professional Technical Analysis Indicator
The Commodity Channel Index is a momentum oscillator developed by Donald Lambert in 1980. CCI measures the relationship between an asset's price and its statistical average, identifying cyclical turns and overbought/oversold conditions. The indicator oscillates around zero, with values above +100 indicating overbought conditions and values below -100 suggesting oversold conditions.
Standard CCI Formula: (Typical Price - Moving Average) / (0.015 × Mean Deviation)
This indicator transforms the traditional CCI into a sophisticated visual analysis tool through several key enhancements:
Implements dual exponential moving average smoothing to eliminate market noise
Preserves signal integrity while reducing false signals
Adaptive smoothing responds to market volatility conditions
Dynamic Color Visualization System
Continuous gradient transitions from red (bearish momentum) to green (bullish momentum)
Real-time color intensity reflects momentum strength
Eliminates discrete color jumps for fluid visual interpretation
Adaptive Intelligence Features
Dynamic overbought/oversold thresholds adapt to market conditions
Reduces false signals during high volatility periods
Maintains sensitivity during low volatility environments
Momentum Vector Analysis
Incorporates velocity calculations for early trend identification
Crossover detection with momentum confirmation
Advanced signal filtering reduces market noise
Extreme Level Analysis
Values above +100: Strong overbought conditions, potential reversal zones
Values below -100: Strong oversold conditions, potential buying opportunities
Zero-line crossovers: Momentum shift confirmation
Optimization Parameters
CCI Period (Default: 14)
Shorter periods (10-12): Increased sensitivity, more signals
Standard periods (14-20): Balanced responsiveness and reliability
Longer periods (21-30): Reduced noise, stronger signal confirmation
Smoothing Factor (Default: 5)
Lower values (1-3): Maximum responsiveness, suitable for scalping
Medium values (4-6): Balanced approach for swing trading
Higher values (7-10): Institutional-grade smoothness for position trading
Signal Sensitivity (Default: 6)
Conservative (7-10): High-probability signals, reduced frequency
Balanced (5-6): Optimal risk-reward ratio
Aggressive (1-4): Maximum signal generation, requires additional confirmation
Strategic Implementation
Oversold reversals in red zones with momentum confirmation
Zero-line breaks with sustained color transitions
Extreme readings followed by momentum divergence
Risk Management
Use extreme levels (+100/-100) for position sizing decisions
Monitor color intensity for momentum strength assessment
Combine with price action analysis for comprehensive market view
Market Context Application
Trending markets: Focus on momentum direction and extreme readings
Range-bound markets: Utilize overbought/oversold levels for mean reversion
Volatile markets: Increase smoothing parameters and signal sensitivity
Professional Advantages
Instantaneous momentum assessment through color visualization
Reduced cognitive load compared to traditional oscillators
Professional presentation suitable for client reporting
Adaptive Technology
Self-adjusting parameters reduce manual optimization requirements
Consistent performance across varying market conditions
Advanced mathematics eliminate common CCI limitations
The Adaptive CCI Pro represents the evolution of momentum analysis, combining Lambert's foundational CCI concept with modern computational techniques to deliver institutional-grade market intelligence through an intuitive visual interface.

Session Gap Fill [LuxAlgo]The Session Gap Fill tool detects and highlights filled and unfilled price gaps between regular sessions. It features a dashboard with key statistics about the detected gaps.
The tool is highly customizable, allowing users to filter by different types of gaps and customize how they are displayed on the chart.
🔶 USAGE
By default, the tool detects all price gaps between sessions. A price gap is defined as a difference between the opening price of one session and the closing price of the previous session. In this case, the tool uses the opening price of the first bar of the session against the closing price of the previous bar.
A bullish gap is detected when the session open price is higher than the last close, and a bearish gap is detected when the session open price is lower than the last close.
Gaps represent a change in market sentiment, a difference in what market participants think between the close of one trading session and the open of the next.
What is useful to traders is not the gap itself, but how the market reacts to it.
Unfilled gaps occur when prices do not return to the previous session's closing price.
Filled gaps occur when prices come back to the previous session's close price.
By analyzing how markets react to gaps, traders can understand market sentiment, whether different prices are accepted or rejected, and take advantage of this information to position themselves in favor of bullish or bearish market sentiment.
Next, we will cover the Gap Type Filter and Statistics Dashboard.
🔹 Gap Type Filter
Traders can choose from three options: display all gaps, display only overlapping gaps, or display only non-overlapping gaps. All gaps are displayed by default.
An overlapping gap is defined when the first bar of the session has any price in common with the previous bar. No overlapping gap is defined when the two bars do not share any price levels.
As we will see in the next section, there are clear differences in market behavior around these types of gaps.
🔹 Statistics Dashboard
The Statistics Dashboard displays key metrics that help traders understand market behavior around each type of gap.
Gaps: The percentage of bullish and bearish gaps.
Filled: The percentage of filled bullish and bearish gaps.
Reversed: The percentage of filled gaps that move in favor of the gap
Bars Avg.: The average number of bars for a gap to be filled.
Now, let's analyze the chart on the left of the image to understand those stats. These are the stats for all gaps, both overlapping and non-overlapping.
Of the total, bullish gaps represent 55%, and bearish ones represent 44%. The gap bias is pretty balanced in this market.
The second statistic, Filled, shows that 63% of gaps are filled, both bullish and bearish. Therefore, there is a higher probability that a gap will be filled than not.
The third statistic is reversed. This is the percentage of filled gaps where prices move in favor of the gap. This applies to filled bullish gaps when the close of the session is above the open, and to filled bearish gaps when the close of the session is below the open. In other words, first there is a gap, then it fills, and finally it reverses. As we can see in the chart, this only happens 35% of the time for bullish gaps and 29% of the time for bearish gaps.
The last statistic is Bars Avg., which is the average number of bars for a gap to be filled. On average, it takes between one and two bars for both bullish and bearish gaps. On average, gaps fill quickly.
As we can see on the chart, selecting different types of gaps yields different statistics and market behavior. For example, overlapping gaps have a greater than 90% chance of being filled, whereas non-overlapping gaps have a less than 40% chance.
🔶 SETTINGS
Gap Type: Select the type of gap to display.
🔹 Dashboard
Dashboard: Enable or disable the dashboard.
Position: Select the location of the dashboard.
Size: Select the dashboard size.
🔹 Style
Filled Bullish Gap: Enable or disable this gap and choose the color.
Filled Bearish Gap: Enable or disable this gap and choose the color.
Unfilled Gap: Enable or disable this gap and choose the color.
Max Deviation Level: Enable or disable this level and choose the color.
Open Price Level: Enable or disable this level and choose the color.

Estimated Manipulation Movement Signal [AlgoPoint]Follow the Footprints of Whale Movements That Drive the Market
Overview
The market is not always driven by natural supply and demand. Large players—often called "whales" or institutions—can create artificial price movements to trigger stop-losses, induce panic or FOMO, and build their large positions at favorable prices. These events are known as "stop hunts" or "liquidity grabs."
The EMMS indicator is a specialized tool designed to detect these specific moments of potential market manipulation. It does not follow trends in a traditional sense; instead, it identifies high-probability reversal points created by the calculated actions of Smart Money trapping other market participants.
How It Works: The 3-Module Logic
The indicator uses a multi-stage confirmation process to identify a potential stop hunt:
1. Anomaly Detection: The engine first scans the chart for "Anomaly Candles." These are candles with unusually high volume and a very long wick relative to their body. This combination signals a sudden, forceful, and potentially unnatural price push.
2. Liquidity Zone Detection: The indicator automatically identifies and tracks recent significant swing highs and lows. These levels are considered "Liquidity Zones" because they are areas where a large number of stop-loss orders are likely clustered. These are the "hunting grounds" for whales.
3. The Stop Hunt Signal: A final signal is generated only when these two events align in a specific sequence:
An Anomaly Candle (high volume, long wick) spikes through a previously identified Liquidity Zone.
The same candle then reverses, closing back inside the previous price range.
This sequence confirms that the move was likely a "trap" designed to engineer liquidity, and a reversal in the opposite direction is now highly probable.
How to Interpret & Use This Indicator
BUY Signal: A BUY signal appears after a sharp price drop that pierces a recent swing low (taking out the stops of long positions) and then aggressively reverses to close higher. This suggests that Smart Money has absorbed the panic selling they just induced. The signal indicates a potential move UP.
SELL Signal: A SELL signal appears after a sharp price spike that pierces a recent swing high (taking out the stops of short positions) and then aggressively reverses to close lower. This suggests that Smart Money has sold into the FOMO buying they just created. The signal indicates a potential move DOWN.
This indicator is best used as a high-probability confirmation tool, ideally in conjunction with your understanding of the overall market trend and structure.

Momentum Trail Oscillator [AlgoAlpha]🟠 OVERVIEW
This script builds a Momentum Trail Oscillator designed to measure directional momentum strength and dynamically track shifts in trend bias using a combination of smoothed price change calculations and adaptive trailing bands. The oscillator aims to help traders visualize when momentum is expanding or contracting and to identify transitions between bullish and bearish conditions.
🟠 CONCEPTS
The core idea combines two methods. First, the script calculates a normalized momentum measure by smoothing price changes relative to their absolute values, which creates a bounded oscillator that highlights whether moves are directional or choppy. Second, it uses a trailing band mechanism inspired by volatility stops, where bands adapt to the oscillator’s volatility, adjusting the thresholds that define a shift in directional bias. This dual approach seeks to address both the magnitude and persistence of momentum, reducing false signals in ranging markets.
🟠 FEATURES
The momentum calculation applies Hull Moving Averages and double EMA smoothing to price changes, producing a smooth, responsive oscillator.
The trailing bands are derived by offsetting a weighted moving average of the oscillator by a multiple of recent momentum volatility. A directional state variable tracks whether the oscillator is above or below the bands, updating when the momentum crosses these dynamic thresholds.
Overbought and oversold zones are visually marked between fixed levels (+30/+40 and -30/-40), with color fills to highlight when momentum is in extreme areas. The script plots signals on both the oscillator pane and optionally overlays markers on the main price chart for clarity.
🟠 USAGE
To use the indicator, apply it to any symbol and timeframe. The “Oscillator Length” controls how sensitive the momentum line is to recent price changes—lower values react faster, higher values smooth out noise. The “Trail Multiplier” sets how far the adaptive bands sit from the oscillator mid-line, which affects how often trend state changes occur. When the momentum line rises into the upper filled area and then crosses back below +40, it signals potential overbought exhaustion. The opposite applies for the oversold zone below -40. The plotted trailing bands switch visibility depending on the current directional state: when momentum is trending up, the lower band acts as the active trailing stop, and when trending down, the upper band becomes active. Trend changes are marked with circular symbols when the direction variable flips, and optional overlay arrows appear on the price chart to highlight overbought or oversold reversals. Traders can combine these signals with their own price action or volume analysis to confirm entries or exits.

Fibonacci Entry Bands [AlgoAlpha]OVERVIEW
This script plots Fibonacci Entry Bands, a trend-following and mean-reversion hybrid system built around dynamic volatility-adjusted bands scaled using key Fibonacci levels. It calculates a smoothed basis line and overlays multiple bands at fixed Fibonacci multipliers of either ATR or standard deviation. Depending on the trend direction, specific upper or lower bands become active, offering a clear framework for entry timing, trend identification, and profit-taking zones.
CONCEPTS
The core idea is to use Fibonacci levels—0.618, 1.0, 1.618, and 2.618—as multipliers on a volatility measure to form layered price bands around a trend-following moving average. Trends are defined by whether the basis is rising or falling. The trend determines which side of the bands is emphasized: upper bands for downtrends, lower bands for uptrends. This approach captures both directional bias and extreme price extensions. Take-profit logic is built in via crossovers relative to the outermost bands, scaled by user-selected aggressiveness.
FEATURES
Basis Line – A double EMA smoothing of the source defines trend direction and acts as the central mean.
Volatility Bands – Four levels per side (based on selected ATR or stdev) mark the Fibonacci bands. These become visible only when trend direction matches the side (e.g., only lower bands plot in an uptrend).
Bar Coloring – Bars are shaded with adjustable transparency depending on distance from the basis, with color intensity helping gauge overextension.
Entry Arrows – A trend shift triggers either a long or short signal, with a marker at the outermost band with ▲/▼ signs.
Take-Profit Crosses – If price rejects near the outer band (based on aggressiveness setting), a cross appears marking potential profit-taking.
Bounce Signals – Minor pullbacks that respect the basis line are marked with triangle arrows, hinting at continuation setups.
Customization – Users can toggle bar coloring, signal markers, and select between ATR/stdev as well as take-profit aggressiveness.
Alerts – All major signals, including entries, take-profits, and bounces, are available as alert conditions.
USAGE
To use this tool, load it on your chart, adjust the inputs for volatility method and aggressiveness, and wait for entries to form on trend changes. Use TP crosses and bounce arrows as potential exit or scale-in signals.

Equal High/Low (EQH/EQL) [AlgoAlpha]OVERVIEW
This script detects and visualizes Equal High (EQH) and Equal Low (EQL) zones—key liquidity areas where price has previously stalled or reversed. These levels often attract institutional interest due to the liquidity buildup around them. The indicator is built to highlight such zones using dynamic thresholding, overbought/oversold RSI filtering, and adaptive mitigation logic to manage zone relevance over time.
CONCEPTS
Equal Highs/Lows are price points where the market has repeatedly failed to break past a certain high or low, hinting at areas where stop orders and pending interest may be concentrated. These areas are often prime targets for liquidity grabs or reversals. By combining this with RSI filtering, the script avoids false signals during neutral conditions and instead focuses on zones where market pressure is more directional.
FEATURES
Detection Logic: The script identifies EQH and EQL zones by comparing the similarity between recent highs or lows with a dynamic volatility threshold. The `tolerance` input allows users to control how strict this comparison is.
RSI Filtering: If enabled, it only creates zones when RSI is significantly overbought or oversold (based on the `state_thresh` input). This helps ensure zones form only in meaningful market conditions.
Zone Display: Bullish (EQL) zones are shown in grey, while bearish (EQH) zones are in blue. Two horizontal lines mark the zone using wick and body extremes, and a filled area visualizes the zone between them.
Zone Management: Zones automatically extend with price until they’re invalidated. You can choose whether a zone is removed based on wick or body sweeps and whether it requires one or two candle confirmations. Zones also expire after a customizable number of bars.
Alerts: Four alert conditions are built in—when a new EQH/EQL is formed and when one is mitigated—making it easy to integrate into alert-based workflows.
USAGE
Equal highs/lows can be used as liquidity markers, either as entry points or as take-profit targets.
This tool is ideal for liquidity-based strategies and helps traders map out possible reversal or sweep zones that often precede aggressive moves.

[SHORT ONLY] ATR Sell the Rip Mean Reversion Strategy█ STRATEGY DESCRIPTION
The "ATR Sell the Rip Mean Reversion Strategy" is a contrarian system that targets overextended price moves on stocks and ETFs. It calculates an ATR‐based trigger level to identify shorting opportunities. When the current close exceeds this smoothed ATR trigger, and if the close is below a 200-period EMA (if enabled), the strategy initiates a short entry, aiming to profit from an anticipated corrective pullback.
█ HOW IS THE ATR SIGNAL BAND CALCULATED?
This strategy computes an ATR-based signal trigger as follows:
Calculate the ATR
The strategy computes the Average True Range (ATR) using a configurable period provided by the user:
atrValue = ta.atr(atrPeriod)
Determine the Threshold
Multiply the ATR by a predefined multiplier and add it to the current close:
atrThreshold = close + atrValue * atrMultInput
Smooth the Threshold
Apply a Simple Moving Average over a specified period to smooth out the threshold, reducing noise:
signalTrigger = ta.sma(atrThreshold, smoothPeriodInput)
█ SIGNAL GENERATION
1. SHORT ENTRY
A Short Signal is triggered when:
The current close is above the smoothed ATR signal trigger.
The trade occurs within the specified trading window (between Start Time and End Time).
If the EMA filter is enabled, the close must also be below the 200-period EMA.
2. EXIT CONDITION
An exit Signal is generated when the current close falls below the previous bar’s low (close < low ), indicating a potential bearish reversal and prompting the strategy to close its short position.
█ ADDITIONAL SETTINGS
ATR Period: The period used to calculate the ATR, allowing for adaptability to different volatility conditions (default is 20).
ATR Multiplier: The multiplier applied to the ATR to determine the raw threshold (default is 1.0).
Smoothing Period: The period over which the raw ATR threshold is smoothed using an SMA (default is 10).
Start Time and End Time: Defines the time window during which trades are allowed.
EMA Filter (Optional): When enabled, short entries are only executed if the current close is below the 200-period EMA, confirming a bearish trend.
█ PERFORMANCE OVERVIEW
This strategy is designed for use on the Daily timeframe, targeting stocks and ETFs by capitalizing on overextended price moves.
It utilizes a dynamic, ATR-based trigger to identify when prices have potentially peaked, setting the stage for a mean reversion short entry.
The optional EMA filter helps align trades with broader market trends, potentially reducing false signals.
Backtesting is recommended to fine-tune the ATR multiplier, smoothing period, and EMA settings to match the volatility and behavior of specific markets.

FVG Channel [LuxAlgo]The FVG Channel indicator displays a channel constructed from the averages of unmitigated historical fair value gaps (FVG), allowing to identify trends and potential reversals in the market.
Users can control the amount of FVGs to consider for the calculation of the channels, as well as their degree of smoothness through user settings.
🔶 USAGE
The FVG Channel is constructed by averaging together recent unmitigated Bullish FVGs (contributing to the creation of the upper bands), and Bearish unmitigated FVGs (contributing to the creation of the lower bands) within a lookback determined by the user. A higher lookback will return longer-term indications from the indicator.
The channel includes 5 bands, with one upper and one lower outer extremities, as well as an inner series of values determined using the Fibonacci ratios (respectively 0.786, 0.5, 0.236) from the channel's outer extremities.
An uptrend can be identified by price holding above the inner upper band (obtained from the 0.786 ratio), this band can also provide occasional support when the price retraces to it while in an uptrend.
Breaking below the inner upper band with an unwillingness to reach above again is a clear sign of hesitation in the market and can be indicative of an upcoming consolidation or reversal.
This can directly be applied to downtrends as well, below are examples displaying both scenarios.
Uptrend Example:
Downtrend Example:
🔹 Breakout Levels
When the price mitigates all FVGs in a single direction except for 1, the indicator will display a "Breakout Level". This is the level that price will need to cross in order for all FVGs in that direction to be mitigated, because of this they can also be aptly called "Last Stand Levels".
These levels can be considered as potential support and resistance levels, however, should always be monitored for breakouts since a substantial push above or below these points would indicate strong momentum.
🔹 Signals
The indicator includes Bullish and Bearish Signals, these signals fire when all FVGs for a single direction have been mitigated and an engulfing candle occurs in the opposite direction. These are reversal signals and should be used alongside other indicators to appropriately manage risk.
Note: When all FVGs in a single direction have been mitigated, the candles will change colors accordingly.
🔶 DETAILS
The script uses a typical identification method for FVGs. Once identified, the script collects and stores the mitigation levels of the respective bullish and bearish FVGs:
For Bullish FVGs this is the bottom of the FVG.
For Bearish FVGs this is the top of the FVG.
The data is managed to only consider a specific amount of FVG mitigation levels, determined by the set "Unmitigated FVG Lookback". If an FVG is mitigated, it frees up a spot in the memory for a new FVG, however, if the memory is full, the oldest will be deleted.
The averages displayed (Channel Upper and Lower) are created from 2 calculation steps, the first step involves taking the raw average of the FVG mitigation levels, and the second step applies a simple moving average (SMA) smoothing of the precedent obtained averages.
Note: To view the mitigation levels average obtained in the first step, the "Smoothing Length" can be set to 1.
🔶 SETTINGS
Unmitigated FVG Lookback: Sets the maximum number of Unmitigated FVG mitigation levels that the script will use to calculate the channel.
Smoothing Length: Sets the smoothing length for the channel to reduce noise from the raw data.

MTF Williams Vix Market Bottoms [CryptoSea]MTF Williams Vix Fix Indicator is a dynamic tool tailored for traders looking to capture market extremes with high precision. This multi-timeframe indicator leverages the concept of the Williams Vix Fix to spot potential reversals before they occur.
Key Features
Multi-Timeframe Analysis: Provides simultaneous visibility across multiple timeframes, enabling traders to assess market conditions comprehensively from a single chart.
Advanced Volatility Detection: Utilizes a modified Vix Fix formula to highlight extreme price deviations, which often precede significant market reversals.
Customizable Settings: Offers extensive input options to tweak the lookback periods, percentile thresholds, and visibility settings, aligning with various trading strategies.
Visual Band Indicators: Features upper bands and range highs that signal potential overbought and oversold conditions, enhancing trading decision-making.
Below, you can see how the indicator performs across different timeframes, providing valuable insights into market behavior.
How it Works
Vix Fix Calculation: Determines the worst-case 'panic' sell-offs in price as a percentage of the high, capturing the emotional extremes of the market.
Statistical Bands: Employs Bollinger bands over the Vix Fix values to define normal and extreme volatility conditions.
Color-Coded Indicators: Uses color differentiation to instantly highlight when readings surpass critical upper band or range high thresholds, signaling key trading opportunities.
For instance, in the analysis provided below, notice how the indicator flags significant market moves, allowing traders to anticipate potential entry or exit points.
Application
Risk Management: Aids in identifying extreme market conditions where prices may revert, helping in effective position sizing and risk management.
Strategic Planning: Enhances strategic trading plans by identifying not only when but also where market extremes may occur, considering multiple timeframes.
Customization: Adapts seamlessly to different market environments with adjustable settings for volatility thresholds and visual display preferences.
The MTF Williams Vix Fix Indicator by is an essential tool for traders aiming to leverage market volatility for optimal entry and exit, ensuring they are well-equipped to handle market extremes with confidence.

Reversal Signals [LuxAlgo]The Reversal Signals indicator is a technical analysis tool that aims to identify when a trend is fading and potentially starting to reverse.
As a counter-trend tool, the Reversal Signals indicator aims to solve the problem of several technical analysis indicators that perform well during trending markets but struggle in ranging markets. By understanding the key concepts and applications of the tool, traders can enhance their market timing and improve their trading strategies.
Note: It's important to explore the settings of the indicator to customize to your own usage & display as there are various options available as covered below.
🔶 USAGE
The Reversal Signals indicator is comprised of two main phases: Momentum Phase and Trend Exhaustion Phase . These phases help identify potential trend reversals in bullish, bearish, and ranging markets.
🔹The Momentum Phase
The momentum phase consists of a 9-candle count and in rare cases 8-candle count. In a bullish trend, a starting number ‘1’ is plotted if a candle closes higher than the close of a candle four periods ago. In a bearish trend, a starting number ‘1’ is plotted if a candle closes lower than the close of a candle four periods ago.
The following numbers are plotted when each successive candle satisfies the four-period rule. The potential reversal point comes when the Reversal Signals plot a label on top of a candle in a bullish trend or at the bottom of a candle in a bearish trend. The momentum phase is immediately canceled if, at any point, a candle fails to satisfy the four-period rule.
Based on the extremes of the momentum phase, the Reversal Signals generate support & resistance levels as well as risk/stop levels.
🔹 The Trend Exhaustion Phase
The trend exhaustion phase starts after completing the momentum phase and consists of a 13-candle count. In a bullish trend exhaustion phase, each candle’s close is compared to the close of two candles earlier, and the close must be greater than the close two periods earlier. In a bearish trend exhaustion phase, each candle’s close is compared to the close of two candles earlier, and the close must be lower than the close two periods earlier.
The trend exhaustion phase does not require a consecutive sequence of candles; if the order of candles is interrupted, the trend exhaustion phase is not canceled. The trend exhaustion phase generates stronger trading signals than the momentum phase, with the potential for longer-lasting price reversals.
🔹 Trading Signals
The Reversal Signals script presents an overall setup and some phase-specific trade setup options, where probable trades might be considered. All phase-specific trade setups, presented as options, are triggered once the selected phase is completed and followed by a price flip in the direction of the trade setup.
Please note that those setups are presented for educational purposes only and do not constitutes professional and/or financial advice
- Momentum: Enter a trade at momentum phase completion, and search for buy (sell) when the bullish (bearish) momentum phase pattern is complete. Ideally, the momentum phase completion should close near its support/resistance line but shall not be above them, which indicates continuation of the trend
- Exhaustion: Enter a trade on trend exhaustion phase completion, and search for buy (sell) when the bullish (bearish) trend exhaustion phase is complete
- Qualified: Buy (sell) when a bullish (bearish) trend exhaustion phase combined with another bullish (bearish) momentum phase sequence is complete
Long trade setups are presented with "L" label and short trade setups with "S" label, where the content of the label displays details related to the probable trade opportunity
Once a phase-specific trade setup is triggered then the Reversal Signals script keeps checking the status of the price action relative to the phase-specific trade setups and in case something goes wrong presents a caution label. Pay attention to the content of the caution labels as well as where they appear. A trade signal, followed immediately by a warning indication can be assumed as a continuation of the underlying trend and can be traded in the opposite direction of the suggested signal
It is strongly advised to confirm trading setups in conjunction with other forms of technical and fundamental analysis, including technical indicators, chart/candlestick pattern analysis, etc.
🔶 DETAILS
The Reversal Signals script performs the detection of the phases by counting the candlestick meeting the specific conditions, which includes:
- Detection of the 8th and 9th candle perfection during the momentum phase
- In some cases, the 8th count will be assumed as momentum phase completion
- Trend exhaustion phase counting stops in case any type of momentum phase completion is detected during the counting process
- Postponing the last count of the trend exhaustion phase, the 13th candle must be below/above the 8th candle and if not the candles will be indicated with '+' sign under them and the script continues to search for a 13th candle at the next ones until the conditions are met
🔶 ALERTS
When an alert is configured, the user will have the ability to be notified in case;
Momentum / Trend Exhaustion phase completion
Support & Resistance level cross detection
Stop / Risk level cross detection
Long / Short Trade Setups are triggered
Please note, alerts are available with 'any alert() function call' and the alerts will be received only for the features that are enabled during alert configuration
🔶 SETTINGS
🔹 Momentum Phase
Display Phases: displays the momentum phases, where the Completed option allows the display of only completed momentum phases. The detailed option allows the display of the entire process of the momentum phase processes
Support & Resistance Levels: Toggles the visibility of the Support & Resistance Levels and Line Styling options
Momentum Phase Risk Levels: Toggles the visibility of the momentum phase Stop/Risk Levels and Line Styling options
For color options please refer to the options available under the style tab
🔹 Trend Exhaustion Phase
Display Phases: displays the trend exhaustion phases, where the Completed option allows the display of only completed trend exhaustion phases. The detailed option allows the display of the entire process of the trend exhaustion phase processes
Trend Exhaustion Phase Risk Levels: Toggles the visibility of the trend exhaustion phase Stop/Risk Levels
Trend Exhaustion Phase Target Levels: Toggles the visibility of the trend exhaustion phase Target Levels
For color options please refer to the options available under the style tab
🔹 Trade Setups
Overall Trend Direction & Trade Setup: displays the overall trend and probable trade setup levels, the users should search for a price flip and confirm with other means of technical and fundamental analysis for the trade setups once the label is plotted
Phase-Specific Trade Setup Options
Momentum: Searches for a trade setup after momentum phase completion
Exhaustion: Searches for a trade setup after trend exhaustion phase completion, stronger trend reversal possibility compared to momentum phase setup
Qualified: Searches for a trade setup after the trend exhaustion phase followed by a momentum phase completion
None: No trade setups are presented
Price Flips against the Phase Specific Trade Setups: enables checking the price action relative to the phase-specific trade setups
🔶 RELATED SCRIPTS
Here are the scripts that may add additional insight during potential trading decisions.
Buyside-Sellside-Liquidity
Support-Resistance-Classification

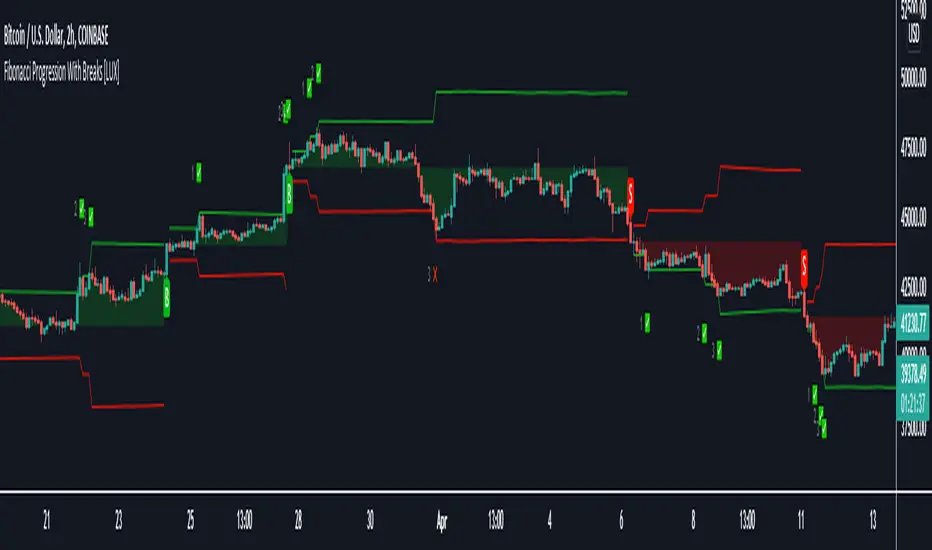
Fibonacci Progression with Breaks [LuxAlgo]This indicator highlights points where price significantly deviates from a central level. This deviation distance is determined by a user-set value or using a multiple of a period 200 Atr and is multiplied by successive values of the Fibonacci sequence.
Settings
Method: Distance method, options include "Manual" or "Atr"
Size: Distance in points if the selected method is "Manual" or Atr multiplier if the selected method is "Atr"
Sequence Length: Determines the maximum number of significant deviations allowed.
Usage
The indicator allows highlighting potential reversal points, but it can also determine trends using the central level, with an uptrend detected if the central level is higher than its previous value and vice versa for a downtrend.
When an uptrend is detected, and the price deviates significantly upward from it a first checkmark will be highlighted alongside the Fibonacci sequence used as a multiplier, if the price deviates downward, a cross will be shown instead, then the distance threshold will be multiplied by the next value in the Fibonacci sequence.
If the price deviates from the central level such that the length of the sequence is greater than the user set Sequence Length , a break label will be shown alongside a new central level with a value determined by the current closing price, while the Fibonacci multiplier will be reset to 1.
Upper and lower extremities made from the central level and threshold distance are highlighted and can be used as support and resistances.