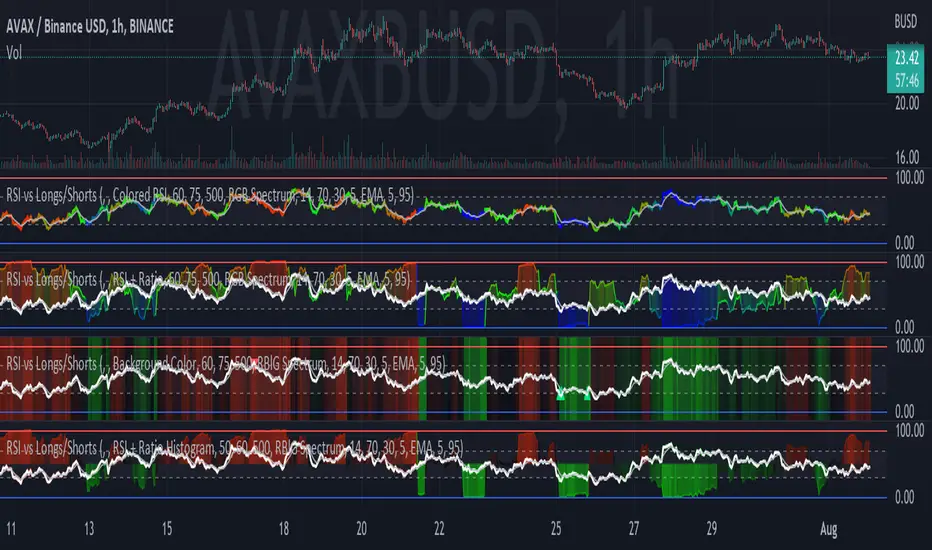
RSI vs Longs/Shorts Margin Ratio Percentage RankThis indicator plots the RSI of the current token and the percentage rank, of the RSI, of the ratio of a long margined token to a short margined token.
By default it plots the RSI of the current token with a color based on percentage rank the RSI of BITFINEX:BTCUSDLONGS divided by BITFINEX:BTCUSDSHORTS, so the assumption is that you are using it on a BTC chart. While you can select any Tradingview symbol for your Long and Short tokens I don't think you will get meaningful results unless you select a long and short margined token that matches your chart symbol, such as BITFINEX:ETHUSDLONGS and BITFINEX:ETHUSDSHORTS if you're trading ETHUSD. Even using margined tokens the results may not be meaningful, if there is not enough trade volume in the token, or if they are being manipulated, so you must backtest everything.
The three plot options are:
• Colored RSI - RSI plotted with colors based on the Longs/Shorts ratio
• Background Color - White RSI plot with Longs/Shorts ratio as background color
• RSI + Ratio - White RSI with Longs/Shorts ratio plotted in color
The chart shows all three options on an hourly BITFINEX:SOLUSD chart with BITFINEX:SOLUSDSHORTS and BITFINEX:SOLUSDLONGS.
By default it also plots a short term moving average and it can also plot the raw ratio rather than the percentage rank if selected.
This script started out as "RSI vs BITFINEX BTC Longs/Shorts Margin Ratio Percentage Rank" by me. I was interested in the ratio of BITFINEX:BTCUSDLONGS to BITFINEX:BTCUSDSHORTS as a measure of market sentiment and how that sentiment would magnify RSI changes. The volatility of the BTCUSDLONGS : BTCUSDSHORTS ratio was too low to get a good read, using a percent rank of the RSI of the ratio made the results more visible. After a discussion with @jason5480 I saw how opening it up to all margined Long / Short pairs was the best way forward. Unfortunately the name no longer matched the script, so I had to publish a new script.
상대강도지수 (RSI)
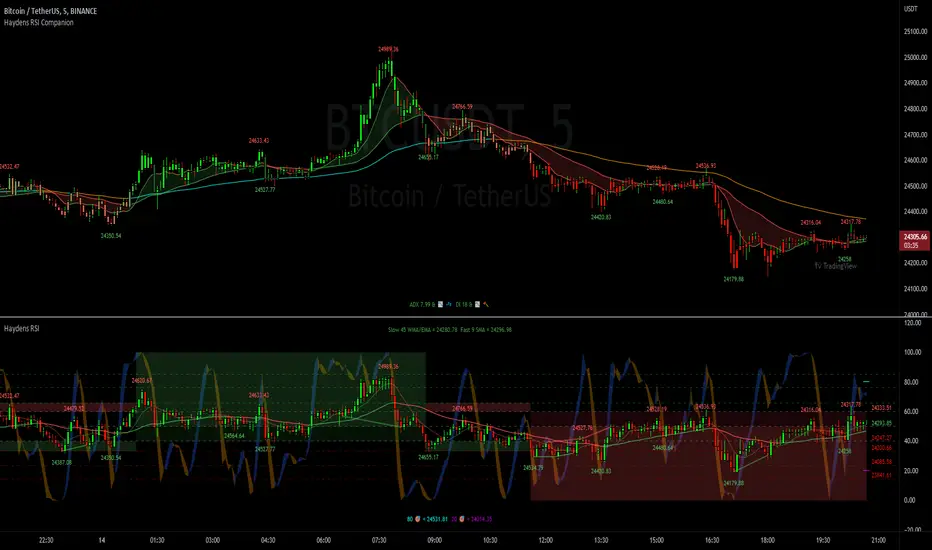
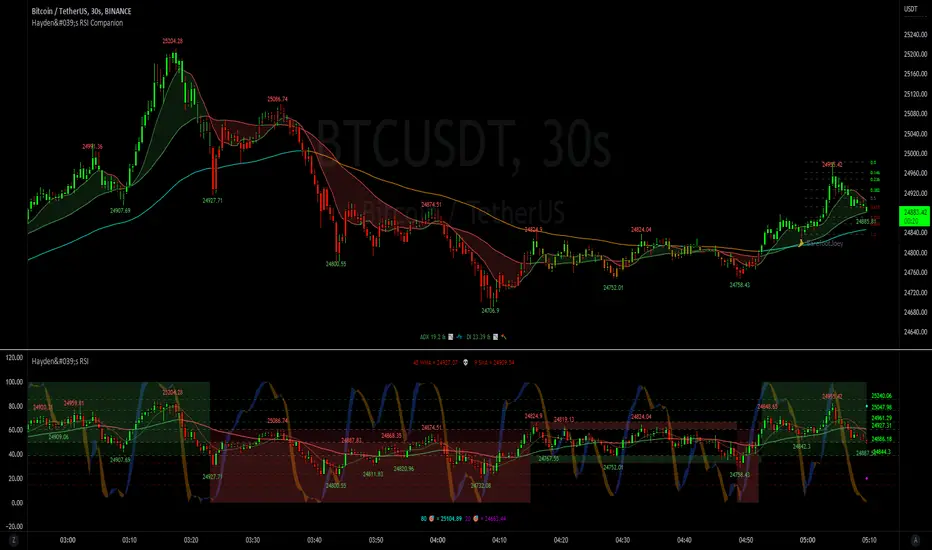
Haydens RSI CompanionPreface: I'm just the bartender serving today's freshly blended concoction; I'd like to send a massive THANK YOU to all the coders and PineWizards for the locally-sourced ingredients. I am simply a code editor, not a code author. The book that inspired this indicator is a free download, plus all of the pieces I used were free code from the community; my hope is that any additional useful development of The Complete RSI is also offered open-source to the community for collaboration.
Features: Fibonacci retracement plus targets. Advanced dual data ticker. Heiken Ashi or bar overlay. Hayden, BarefootJoey, Tradingview, or Custom watermark of choice. Trend lines for spotting wedges, triangles, pennants, etc. Divergences for spotting potential reversals and Momentum Discrepancy Reversal Point opportunities. Percent change and price pivot labels with advanced data & retracement targets upon hover.
‼ IMPORTANT: Hover over labels for advanced information, like targets. Google & read John Hayden's "The Complete RSI" pdf book for comprehensive instructions before attempting to trade with this indicator. Always keep an eye on higher/stronger timeframes. See the companion oscillator here:
⚠ DISCLAIMER: DYOR. Not financial advice. Not a trading system. I am not affiliated with TradingView or John Hayden; this is my own personally PineScripted presentation of a suitable RSI chart companion to use when trading according to Hayden's rules.
About the Editor: I am a former-FINRA Registered Representative, inventor/patent-holder, and self-taught PineScripter. I mostly code on a v3 Pinescript level so expect heavy scripts that could use some shortening with modern conventions.
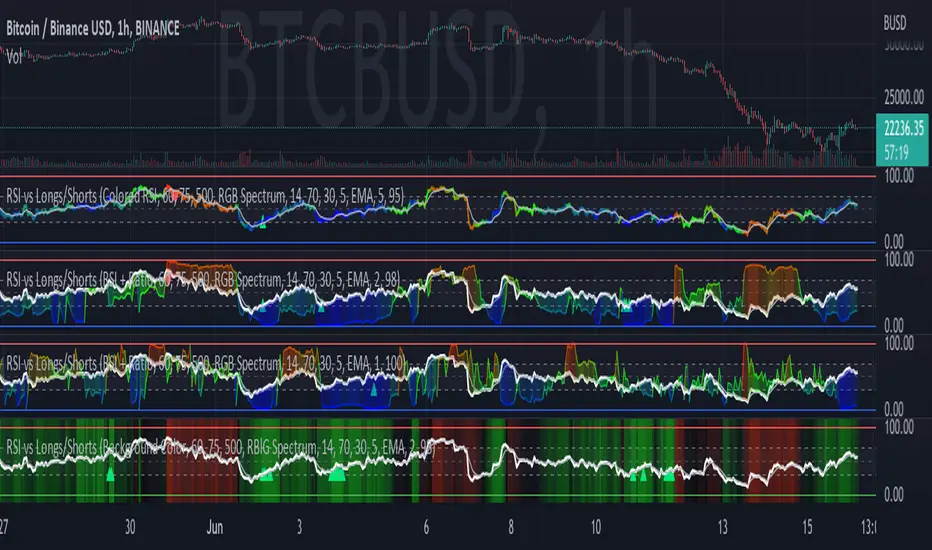
RSI vs BITFINEX BTC Longs/Shorts Margin Ratio Percentage RankThis indicator plots the RSI of the current token with a color based on percentage rank of the RSI of BITFINEX:BTCUSDLONGS divided by BITFINEX:BTCUSDSHORTS, with a plot of the moving average of the RSI. It can optionally plot the RSI in white and the ratio RSI in color, or the ratio as background color. It can also plot the raw ratio rather than the percentage rank if selected.
I was interested in the ratio of BITFINEX:BTCUSDLONGS to BITFINEX:BTCUSDSHORTS as a measure of market sentiment and how that sentiment would magnify RSI changes. The volatility of the BTCUSDLONGS : BTCUSDSHORTS ratio was too low to get a good read, using a percent rank of the RSI of the ratio made the results more visible.
This indicator should be used on a BTC chart.
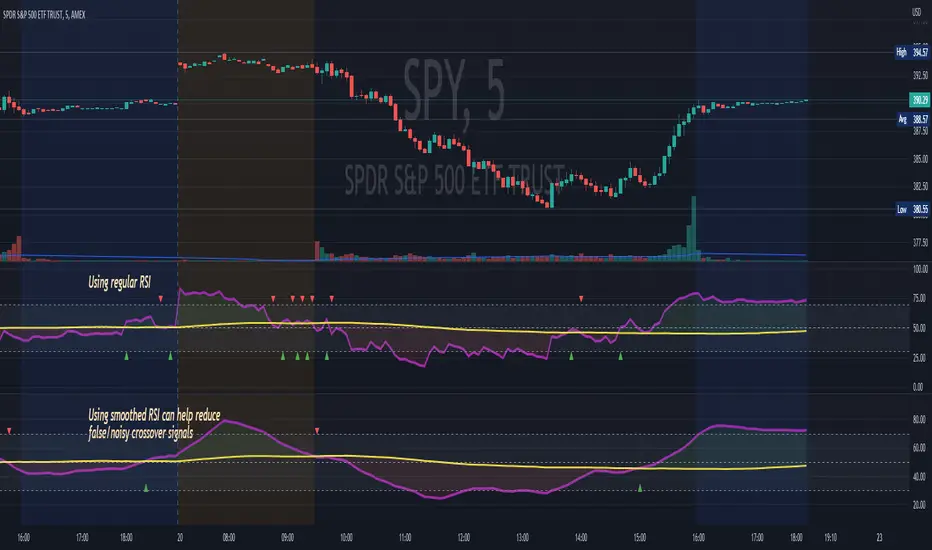
RSI Scalping & Swing Signals With AlertsThis RSI indicator shows a green or red ribbon when the smoothed RSI is bullish or bearish. It also includes a long moving average for overall trend confirmation. Wait until the ribbon holds above or below the long moving average and take positions in that direction.
To get an easier to read RSI indicator, I smoothed the RSI out and paired it next to a short term RMA. These two together form the ribbon that will show you early reversals and trend direction. The long moving average is used as an overall trend detector and confirmation for longer term trends.
***HOW TO USE***
Scalping: Enter longs when the ribbon turns green and enter shorts when the ribbon turns red. Exit positions when the ribbon turns the opposite color or crosses the long moving average.
Swing Trading: When the ribbon holds above the long moving average or breaks out and retests it, look for long positions and exit when the ribbon turns red or crosses the long moving average. When the ribbon holds below the long moving average or breaks down and retests it, look for short positions and exit when the ribbon turns green or crosses the long moving average.
***DETAILS***
This indicator gives early reversal signals very well and waiting for the RSI ribbon to cross the long moving average helps to get you into positions when the market is ready to really move while filtering out some of the noise.
The ribbon and background will change to green or red depending on whether it is currently bullish or bearish.
There is also a label that changes colors and tells you if RSI is bullish or bearish and also whether the RSI ribbon is above or below the long moving average.
Green or red circles will appear on the indicator when there is a bullish or bearish cross of the RSI ribbon and the long moving average.
It also has alerts that trigger when RSI is turning bullish/bearish or when the RSI ribbon is crossing the long moving average.
***CUSTOMIZATION***
Each piece of this indicator can be customized to suit your preferences including the RSI source, length, smoothing length, short moving average length and long moving average length. You can also turn off the labels, signals and long moving average. All of these settings can be managed within the indicator settings input tab.
***MARKETS***
This indicator can be used as a signal on all markets, including stocks, crypto, futures and forex.
***TIMEFRAMES***
This RSI Scalping & Swing Signals indicator can be used on all timeframes.
***TIPS***
Try using numerous indicators of ours on your chart so you can instantly see the bullish or bearish trend of multiple indicators in real time without having to analyze the data. Some of our favorites are Trend Friend Scalp & Swing Trade Signals, Volume Spike Scanner, Buy & Sell Pressure Volume Profile, and Momentum Scalper in combination with this RSI indicator. They all have real time Bullish and Bearish labels as well so you can immediately understand each indicator's trend.

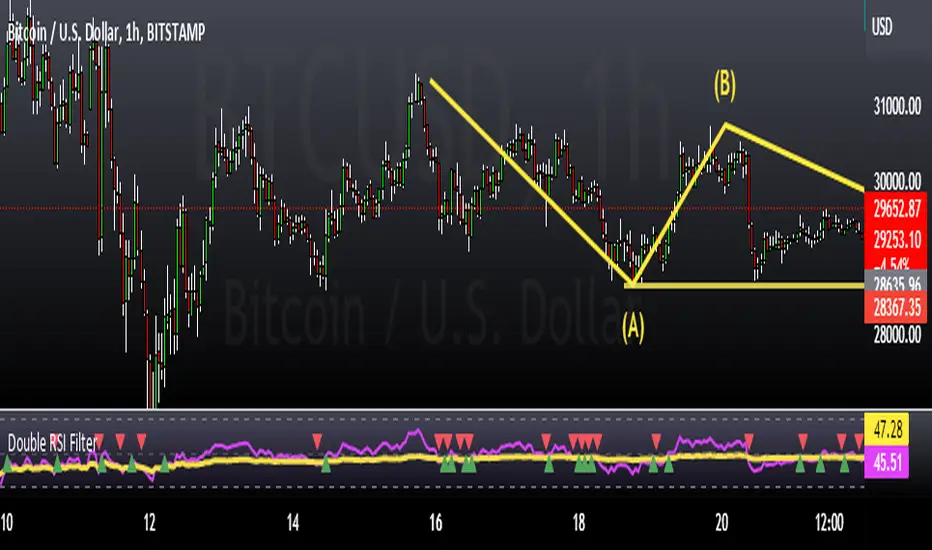
Double RSI FilterI've seen several youtubers using 2 RSI's on top of one another to filter trades for their strategies. I figured I would just code it up as an all-in-one indicator for people who have the basic package. This way they have an extra slot for another indicator if they need one and also for convenience.
Longs only when RSI 1 is above RSI 2 and shorts only when opposite. The arrows show where crosses of the RSI's occur.
Let me know if there is something else like this where it would just be very convenient to have 2 indicators on one window or other such things and I'll see if I can do something for you guys in my spare time. I'm just an amateur coder, but learning as I do more of these for people.
Thank you!
Hope this helps someone! :)
Floating RSI IndicatorThe Simple Floating Relative Index Strength Indicator to analysis the real time value of RSI along with High Minus Low of Day , Week and Monthly candle value and Real time Candle Body size. Simple indications of colors i.e. green indicates bullish and red indicates Bearish

Double RSI For KateDouble RSI for scalping and trend recognition. Green for longs, red for shorts. Based on close. ;)

Ribbon Relative Strength IndexDescription
Ribbon RSI is the base on of the original RSI.
In RSI (dark color) and RSI-base MA (light color), we added short (12-day) and long (26-day) periods to show these crossovers, including crossovers between the RSI and the RSI-base MA, We've also added a trend period (50-day) RSI section that shows this section in the background.
And because Stochastic is a momentum indicator as well. It is therefore included as a guide to support RSI in another way.
How to Setting
— You can adjust the Short (12 days), Long (26 days) and Trend (50 days) periods from Settings: Input page in the RSI Setting section.
— You can adjust the RSI-base MA interval (9 days) on the Settings: Input page in the MA Setting section.
— You can display the lines of RSI, RSI-base MA at Setting: Style in RSI…
— You can display the Stochastic lines on the Settings: Style page in the Stochastic…

Multiple RSI Strategies [MoonKoder]In this script you can find multiple strategies to optimize your trading.
Here you have multiple RSI Strategies in only one indicator. The tool tips are self explenatory, so you don't have to worry to kon how to work with it.
I hope you enjoy it, and don't forget to like the script, so I can get supported to continue to work on more indicators. :)
Have fun :D

Trend & Momentum V2Declutter your charts. Simple indicator combining trend and momentum using Moving Average (currently default to 9-day EMA) and RSI (default length of 8). A long signal is generated when the price closes above the moving average and the moving average color turns red to green which indicated that the momentum measured using RSI is greater than 50. A short signal is generated when the price closes below the moving average and the moving average color turns green to red indicating RSI is below 50. Confirmation is done if there is no reversal on the next candle. For best results use multiple timeframe charts to trade on the right side of trend and momentum.

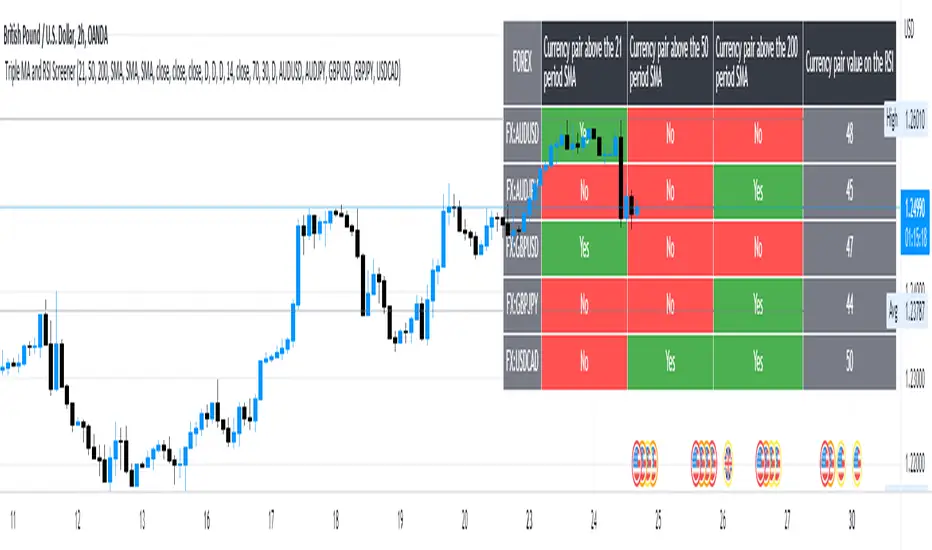
5 Symbol screener with triple MA and RSIBelow is a simple screener script fitted with 5 different symbols in the first column and in the other 4 columns the screener displays the respective moving averages and the RSI, the user has the ability to change between timeframes and different moving averages such as the SMA, EMA, RMA and WMA .
Weighted Relative Strength IndexWRSI uses 3 different user defined time frames with user defined weight on each time frame to give a final RSI value
Default values:
RSI 1 = 5 minute timeframe with a weightage of 9:14
RSI 2 = 15 minute timeframe with a weightage of 4:14
RSI 1 = 60 minute timeframe with a weightage of 1:14
Works best on a 15 min chart.
Please note this indicator will show exactly same values on all time frame charts so if you are looking at a daily chart you may want to change to 60 min, Daily & Weekly RSI time frame in settings.
The weights used here are basically sqaures of 1,2,& 3, you may choose any numbers that work for you.
The RSI length taken here is 27 (count of nakshatras)
The RSI MA length taken here is 28 (count of nakshatras + Abhijit Nakshatra)
You can obviously change it to what works best for you.

RSI MA CrossBuilding onto the standard RSI indicator, with the following modification and improvements:
- Added signals for RSI moving average crossovers, which usually indicator a bull or bear trend
- Added option to use smoothed RSI line
- Added alert for crossover signals
Enjoy~~~!
Custom Multi-Timeframe IndicatorIt's a pretty simple example of a nice custom screener you can run for multiple timeframes. This is an RSI screener, but you can easily change the function for your own Indicator.
Screener displays:
Last value of the instrument
RSI value for up to 10 instruments / 4 timeframes.
In Parameters you can change:
4 timeframes
10 instruments
Parameters for RSI
Styling parameters for table
If the selected timeframe will be lower than the current one you will receive a warning message in a table.
Thanks to @MUQWISHI to help me code it.
Disclaimer
Please remember that past performance may not be indicative of future results.
Due to various factors, including changing market conditions, the strategy may no longer perform as well as in historical backtesting.
This post and the script don’t provide any financial advice.

Hayden's Advanced Relative Strength Index (RSI)Preface: I'm just the bartender serving today's freshly blended concoction; I'd like to send a massive THANK YOU to @iFuSiiOnzZ, @Koalafied_3, @LonesomeTheBlue, @LazyBear, @dgtrd and the rest of the PineWizards for the locally-sourced ingredients. I am simply a code editor, not a code author. The book that inspired this indicator is a free download, plus all of the pieces I used were free code from the PineWizards; my hope is that any additional useful development of The Complete RSI trading system also is offered open-source to the community for collaboration.
Features: Fixed & Custom price targeting. Triple trend state detection. Advanced data ticker. Candles, bars, or line RSI . Stochastic of over 20 indicators for adjustable entry/exit signals. Customizable trader watermark. Trend lines for spotting wedges , triangles, pennants , etc. Divergences for spotting potential reversals and Momentum Discrepancy Reversal Point opportunities. RSI percent change and price pivot labels. Gradient bar coloring on-chart.
‼ IMPORTANT: Hover over labels for additional information. Google & read John Hayden's "The Complete RSI" pdf book for comprehensive instructions before attempting to trade with this indicator. Always keep an eye on higher/stronger timeframes.
⚠ DISCLAIMER: DYOR. Not financial advice. Not a trading system. I am not affiliated with TradingView or John Hayden; this is my own personally PineScripted presentation of a suitable RSI to use when trading according to Hayden's rules.
About the Editor: I am a former-FINRA Registered Representative, inventor/patent-holder, and self-taught PineScripter. I mostly code on a v3 Pinescript level so expect heavy scripts that could use some shortening with modern conventions.
Hayden's RSI Rules:
📈 An Uptrend is indicated when:
1. RSI is in the 80 to 40 range
2. The chart shows simple bearish divergence
3. The chart shows Hidden bullish divergence
4. The chart shows Momentum Discrepancy Reversal Up
5. Upside targets being hit
6. 9-bar simple MA is greater than the 45-bar EMA on RSI
7. Counter-trend declines do not exceed 50% of the previous rally
🔮 An Uptrend is in danger when:
1. Longer timeframe fading rally
2. a) Multiple long-term bearish divergences. b) Upside targets not being hit.
3. 9-bar simple MA is less than the 45-bar EMA on RSI
4. Hidden bearish divergence, or simple bullish divergence
5. Deep counter-trend retracements greater than 50%
📉 A Downtrend is indicated when:
1. RSI is in the 60 to 20 range
2. The chart shows simple bullish divergences.
3. The chart shows Hidden bearish divergence
4. The chart shows Momentum Discrepancy Reversal Down
5. Downside targets being hit
6. 9-bar simple MA is less than the 45-bar EMA on RSI
7. Counter-trend rallies do not exceed 50% of the previous decline
🔮 A Downtrend is in danger when:
1. Longer timeframe fading decline
2. a) Multiple long-term bullish divergences. b) Downside targets not being hit.
3. 9-bar simple MA is greater than the 45-bar EMA on RSI
4. Hidden bullish divergence , or simple bearish divergence
5. Steep counter-trend retracements greater than 50%
Divergence Macd+RSI Fast[RSU] -- No RepaintThis indicator combines the divergence of rsi and macd and displays it on the candlestick chart.
RSI:
1. When rsi is at a high point, once it falls by 1 k line, it will detect the divergence from the previous high point. This can quickly find the divergence that has taken effect and help you quickly capture the trend before a sharp decline or rise.
The difference between other RSI divergence indicators: the official divergence indicator is to detect the 5 and the k line, which may lead to a large amount of decline.
2. This indicator detects the previous high and the previous low of 5, 10, 20 lengths at the same time, instead of only detecting a fixed length, so that more deviations can be found.
MACD:
1. When MACD-diff line(orange color) is at a high point, once it falls by 1 k line, it will detect the divergence from the previous high point. This can quickly find the divergence that has taken effect and help you quickly capture the trend before a sharp decline or rise.
2. This indicator detects the previous high and the previous low of 5, 10, 20, 40 , 60 lengths at the same time, instead of only detecting a fixed length, so that more divergences can be found.
Notice:
Because it is a quick divergence detection, it is recommended to confirm that the divergence takes effect after the current k is completely closed first. I have identified this state in the indicator as "k not end".
Disadvantages and Risks:
Since it is a quick discovery, there will be error identification. Error divergences will recolor to grey.
Suggestion:
Use Alert catching divergence occurrences.
Please do not:
Don't go short in the uptrend, don't go long in the downtrend.
Top divergences that occur because of a strong uptrend are usually only temporary pullbacks. Bottom divergences in persistent declines are also temporary rallies. Do not attempt to trade such low-return trades.
It is recommended to use the divergence indicator when the stock price has made a new high and retraced, and once again made a new high, because this often leads to the end of the trend.
Divergence how to use:
1. After the previous candlestick was completely closed, a bottom divergence was found.
2. Open an long order at the beginning of the second bar, or as close to the bottom as possible (because the stop loss will be smaller).
3. Break the stop loss price below the previous low where the divergence occurred, which already means that the divergence is wrong.

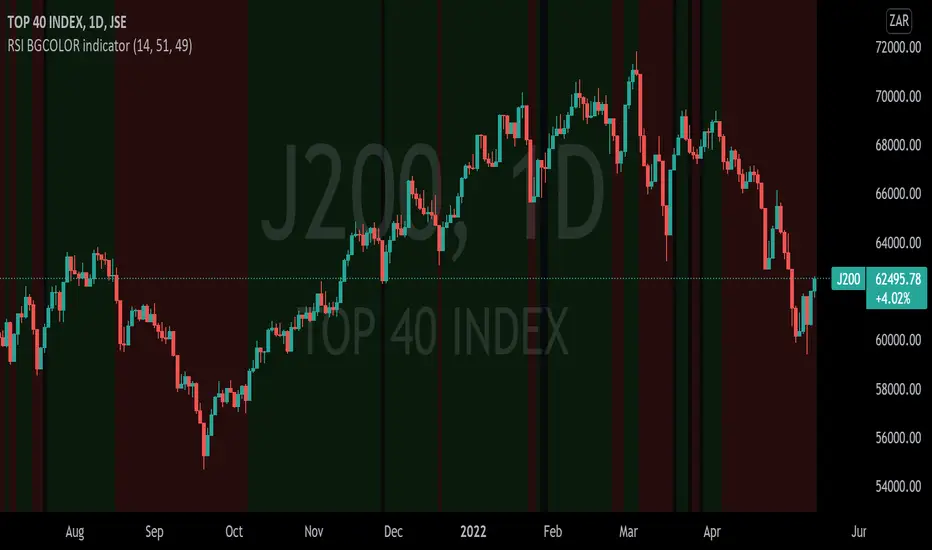
RSI BGCOLOR indicatorHi
This is a standard RSI indicator.
It changes the background color to green if the RSI reading is greater than the RSI bullish value and it changes to red if the RSI is below the RSI bearish value.
It will turn black for values between RSI bullish value and RSI bearish value.
You can tweak it to your liking, for example if you'd like to detect long only trades that are above 30 then you set RSI bearish value to 0 and RSI bullish value to 30 and it will only get long signals.
P.S More confirmation indicators will be necessary
RSI5+RSI9+RSI14 EMA [MTF - Multi Time Frame] Zero54This indicator has a fast RSI (RSI 5). Slower RSI (RSI 9) and a smoothened RSI14 EMA. When both RSI5 and RSI9 are above the RSI14 EMA, then the trend is bullish. When both RSI5 and RSI9 are below the RSI14 EMA, then the trend is bearish. This indicator also shows you the trend in upto 6 time frames! This MTF analysis gives you the conviction to take or skip the trade. Inspired by the concept taught by @AsitPati
The numbers you see in the MTF grid is the RS14 EMA for the respective time frame.
Hope you find this useful. Comments and feedback welcome. Like this if you find this useful.
NSE:HINDUNILVR

Vix FIX / Stochastic Weights StrategyThis script is based off of Chris Moody's Vix Fix Indicator modified by OskarGallard and BigBitsIO's Stochastic Weights.
This script is a compilation of several different stochastic indicators (and RSI ) where the K value of each indicator is equally weighted. The purpose of the indicator is to combine many indicators together in a fashion that weights them easier. By default, the Stochastic and Stochastic RSI are both enabled - the idea is to speed up the relatively slower Stochastic and to slow down the relatively fast Stochastic RSI . BigBitsIO's Stochastics are also available that can also be added to the weighted calculation. Only the K value is weighted, as the D value is just a moving average of the weighted K.
- Why is this modifed stochastic useful?
- To weight multiple indicators together so that you can attempt to find optimal values shared amongst the indicators. Ex: If Stochastic RSI is 100 and Stochastic is 50, K would be 75 and not particularly high. If you add in a 50 RSI , the K would be 67 in this example. If we weight indicators together that all have a high value they could potentially help find elements that align together to produce a stronger signal.
In this script we have the red "S" triangles which are Exits (overbought stochastic crosses).
Added alerts for stochastic exit signals. Alerts are Pre-Set to only Alert on Bar Close.
The "Williams Vix Fix" is one of the most reliable indicators in history for finding market bottoms. The Vix Fix is simply a code from Larry Williams creating almost identical results for creating the same ability the Vix has to all assets.
The VIX has always been much better at signaling bottoms than tops. Simple reason is when market falls retail traders panic and increase volatility , and professionals come in and capitalize on the situation. At market tops there is no one panicking... just liquidity drying up.
The FE green triangles are "Filtered Entries".
The AE green triangles are "Aggressive Filtered Entries".
Added Alerts to Williams Vix Fix (Aggressive Entry and Filtered Entry). Alerts are Pre-Set to only Alert on Bar Close.
Added "Ehlrers StochCCI" indicator of user @glaz
The Ehlrers StochCCI is a variation of Ehlers Stochastic RSI replaced with CCI.
The John Ehlers' article in August, 2006, "Modeling The Market = Building Trading Strategies," describes a process for extracting trend and cyclic elements from market data, then recombining them for trading purposes. He used the Stochastic RSI denoted the cyclic elements.
Added ability to show Dots when StochCCI Crosses.
Sell: fuchsia dots.
Buy: green dots.
Added alerts for (Buy / Sell) StochCCI. Alerts are Pre-Set to only Alert on Bar Close.
DISCLAIMER: For educational and entertainment purposes only. Nothing in this content should be interpreted as financial advice or a recommendation to buy or sell any sort of security or investment including all types of crypto. DYOR, TYOB.

Z-Score DeltaHeavily modified from Z Score by jwammo12
Compares the z-score of two assets, the onscreen one and the reference one configured. If you're familiar, you can think of it as Bollinger Band Percent of Onscreen Asset minus the Bollinger Band Percent of Reference Asset.
It's compared off a simple moving average, due to how standard deviation is calculated.
I view this a more literal meaning of relative strength.
Has the ability to offset or delay in time one to another.
TODO: add MAD and MAD/STD.DEV views
Not my greatest work, but it's functional.

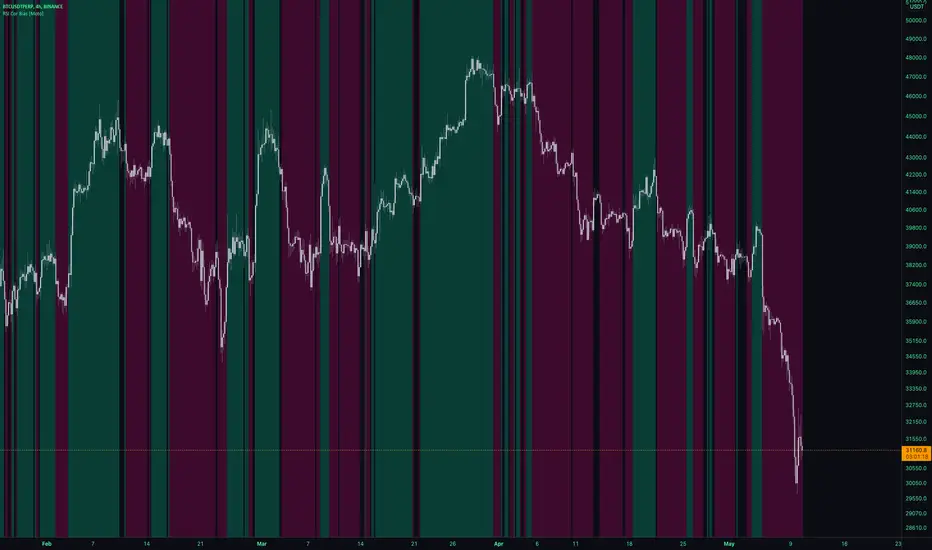
RSI Cor Bias [Moto]Hello traders,
This is a pretty simple script. It gives a background directional bias color respective to RSI levels from input thresholds in the settings. Users can choose the upper and lower thresholds and the symbol that the RSI is from.
For example, by default, the upper threshold is 52 and the lower 48. If Bitcoins RSi is above 52, the background color will be green, below 48 it's pink, between and no color will be applied.
Generally, buying should be occurring in pink to green transition or in green, and conversely selling should be occurring in green to pink transition or in pink.
Thanks,
Moto
BB-RSI-ADX Entry PointsThis is a combination of indicators used to find oversold and overbought entry points for possible reversion.
A Green arrow will appear when all condition are met for an ENTER LONG position.
A Red arow will appear when all condition are met for an ENTER SHORT position.
You can modify all of these condition parameters from the indicator's settings.
How does the indicator work
The signals are using Bollinger Bands , BB %B , RSI and ADX indicators to try and find points of reversal
Enter LONG Conditions
Current candle low is below BB lower band.
The BB %B is more than 0.
RSI > 30
ADX > 25
Enter SHORT Conditions
Current candle high is above BB upper band.
The BB %B is less than 1.
RSI < 70
ADX > 25
Those are the default settings that seem to work for me but you can customize all of these from the indicator settings.
I find this strategy to best work on a 3 minute timeframe
Note: The bb %B is calculated for stDev - 1. This will help you see a change happening faster.

LOKEN (v4) BULLISH SMART MONEYThis indicator is based on Smart Money MCDX
(Pine editor @v4)
Indicator built for cryptocurrencies.
Best for day trading.
The coin seems overbought but still pump? Check this indicator
This indicator help you see when institutional buyer enter/exit trade and is a good combination with RSI + Stochastic RSI .
This indicator focus on buying activity by big players and is built for LONG or SPOT, shorter can still use it to determine when to exit short (if smart money appear on a significant TF you may not enter/stay in a short).
Banker plot show strong buyer activities (appear generally when RSI already overbought but still increasing).
It appear as a Histogram with a color code to better see the fading strength of the institutional activity :
Light Blue Bar = Institutional presence ( bullish )
Green Bar = Pump candle (very bullish ), (Banker > Banker MA)
Orange Bar = Retest candle = natural decline after a growth (Banker < Banker MA)
Black Bar = Down candle = progressive exit of institutional leads to this candle, you must have TP before.
Red Bar = Dump candle = steep decline, the institutional take profit hard. You better be out before that one.
Hot-Money plot show momentum and react fast to price action.
It appear as a filled zone (red or green) depending on the plot position compared to its average.
In a downtrend you may only see this one.
Key-Signals:
"Bullish signal 𓃓" = open a long
"Sell signal 💲" = close the long
I recommend you don't keep all the signals enabled at first.
(feel free to ask me the use of the other signals)
It seemed to me that SMART MONEY MCDX was counter-intuitive and archaic,
So i made this one for personal use,
I'm happy if this indicator helps you,
Have a good trade
