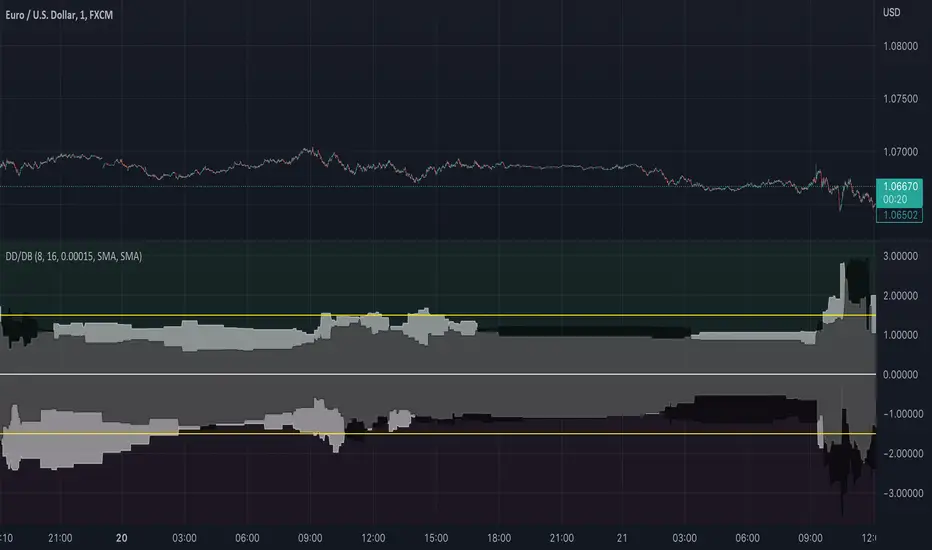
Drawdown and Drawback || Ranging Hey!
So this indicator tries to spot ranges;
Above the zero line is the data from green candles and below the zero line is the data from the red candles;
When the white area is > than the black area, it indicates that the DrawBack is higher than the DrawDown;
This might work counterintuitively for some people because, for a bullish candle, this means it has to go down for the indicator to recognize it as “good”/ see it as a DrawBack value;
The same is true for a bearish candle, the price has to move up after for it to be seen as a DrawBack value;
There are a few input values:
Length_: This is how many bars a candle gets for the price to move in, the default is 8 bars, so after a bar is formed, from the following 8 bars the DrawBack/DrawDown is saved;
EMA_Length: This is the EMA length, you can change the EMA length and also the MA variant, so you have full flexibility about what might work best for you;
RB_Size: This is how many points a Real Body of a candle has to have before it gets registered within the indicator, what I found it, is that if you put this too low your data gets ruined by candles that have 1-5 points if you use it on a low TimeFrame, but if you want to use it on higher timeframes you maybe have to make the default a bit higher.
Everything is plotted with an Offset of 1, I like it this way so you get a realistic view of the market as you will -most likely- place trades on the next candle either way not on the current candle. But that is just my opinion.
I also added 2 yellow Hlines for visual purposes to see if they were within a certain boundary, see if these add anything for yourself, because they can also make it look a bit messy;
If you have any questions about the code or the indicator itself, feel free to ask them!
I hope it helps at least one person ;)
Ranging-market
Range Detector Indicator [Misu]█ This indicator shows an upper and lower band based on Highs and Lows.
Depending on this, the indicator interprets a ranging market, an uptrend or a downtrend.
█ Usages:
The purpose of this indicator is to identify when the price is ranging.
It's also used to identify changes in trends, breaking points, and trend reversals.
But it can also be used to show resistance or support levels.
█ Features:
> Price Action Change Alerts
> Price Action Change Labels
> Color Bars
> Show Bands
█ Parameters:
Deviation: A parameter used to calculate pivots.
Depth: A parameter used to calculate pivots.
Activate Range Detection: Check the box to activate range detection.
Band% Offset: A factor that is used to vary the bands offset.

Market Bias (CEREBR)Hello Everyone. I hope you are all doing great. It's been a long time since I posted my first script here, and I got a lot of response from that.
So, I thought I should share this script also to everyone, and anyone that may find it useful. Personally, I use it to tell the general market conditions.
Here's how I works : The script tries to determine the overall direction of the market, using smoothed Heiken Ashi candles. The coloring system (using bright and dark colors) is an attempt to detect strong market and weak market conditions. There's also an oscillator within the script, but for now it isn't plotted. Credits to @jackvmk, I used part of his open-script code in this indicator.\
I have considered using the slope of the indicator plot as a filter for ranging market conditions. The plot goes relatively flat in 'flat' markets. However, I have not done anything about that yet. Maybe some other time.
I hope you find this useful. If you find a way to use this, please share it with the community in the comment section.
NOTE: THIS IS BY NO MEANS FINANCIAL ADVICE. You'll have to make your studies and come up with a way to apply this indicator to your trading style and strategy.
By the way, I would be going with the name 'CEREBR' for any subsequent scripts I release from now on.
Happy Trading, guys.

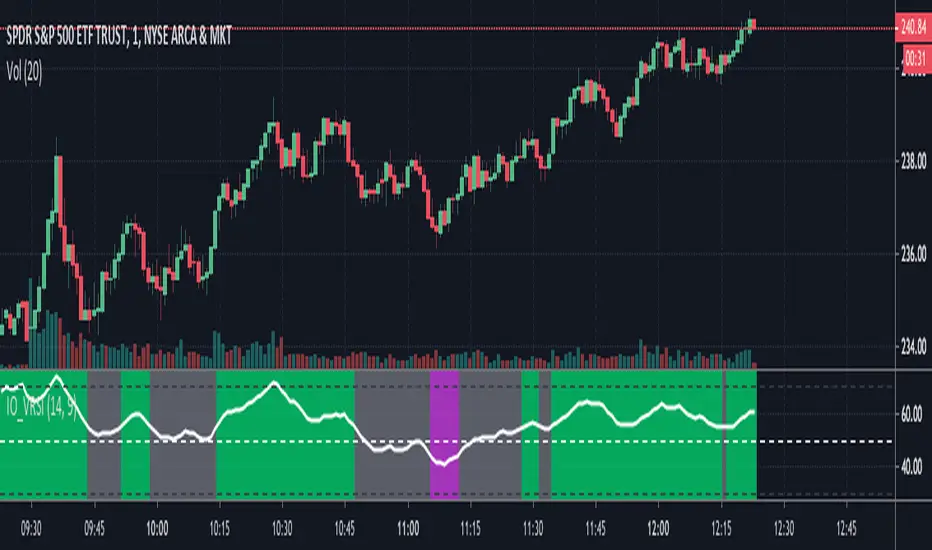
IO_VRSIOriginal Idea by Invsto
In this indicator, I explore the core concepts of RSI and extend it with smoothening to determine volatility.
Usage:
LIME/GREEN : High Volatility and BULLISH trend
RED/FUCHSIA : High Volatility and BEARISH trend
GRAY: Low volatility/Potential Chop Zone
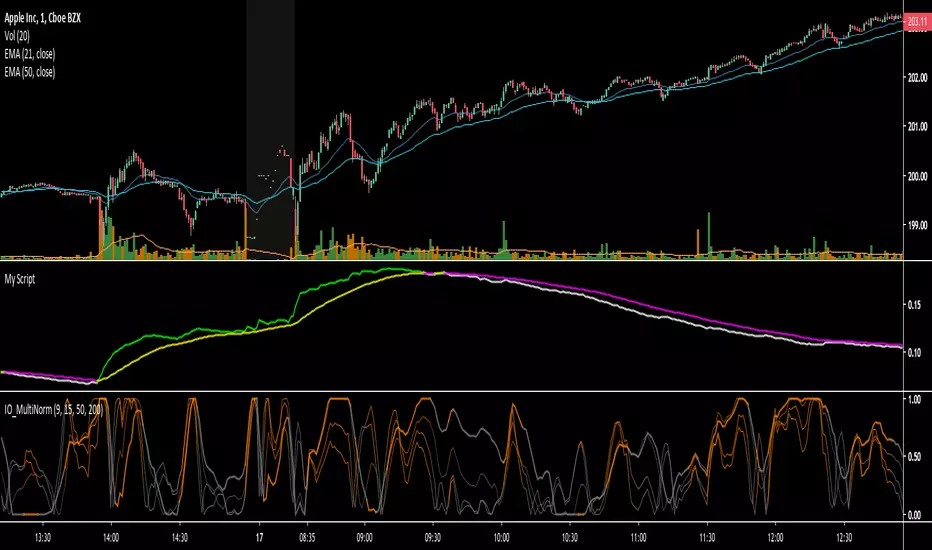
IO_MultiNormMultiNorm is an oscillator used for trend and volatility analysis.
Original Idea by Invsto.
IO_EMA_Delta_OscillatorThis is a EMA Delta Oscillator: An attempt to show ranging markets based on the slope of the EMA.
Green = Bullish Market
Blue = Ranging Market
Red = Bearish Market
The EMA Slope is normalized to make it work like an oscillator with values between 0 and 1.
Bar colors show the oscillator colors, bar borders show the actual candle colors.
- Invsto
(sarangab)
