Triple ATR Adaptive MAs + VWAP Option + Clouds + Candle Trend V2Another one of my experiences ... combining things...
📘 Indicator Description – Triple ATR Adaptive Moving Averages with VWAP Influence
This indicator plots three adaptive moving averages whose behavior changes dynamically based on market volatility (ATR) and optionally VWAP deviation.
Because they adapt in real time to both volatility and VWAP pressure, their movement, slope, and reaction speed differ significantly from traditional moving averages.
🔶 1. ATR-Adaptive Moving Averages
Each of the three MAs uses a custom adaptive formula:
ATR (Average True Range) is measured over a chosen period.
Higher ATR → more volatility → the MA becomes more reactive and moves closer to price.
Lower ATR → stable market → the MA becomes smoother and slower.
This creates a volatility-aware smoothing factor, making the MA expand, contract, and respond to market conditions in ways a classic SMA, EMA, or HMA cannot.
🔷 2. Optional VWAP Influence
Each MA has an independent toggle allowing it to be influenced by VWAP.
When enabled:
The MA is gently “pulled” toward VWAP.
The strength of this attraction is determined by the VWAP Influence parameter (0–1).
This causes the moving averages to behave differently from normal MAs:
In trending markets, the ATR and price push the MA away from VWAP.
In mean-reverting or balanced conditions, VWAP pulls the MA back toward fair value.
The result is an MA that reflects both trend pressure and fair-value pressure.
🔶 3. Visual Behavior: Non-Traditional Movement
Because each MA is simultaneously influenced by volatility, trend magnitude, and VWAP deviation, their shape is often very distinct from normal moving averages.
They may:
Respond faster during high volatility
Flatten out earlier during consolidation
Curve toward VWAP when price becomes extended
Separate or compress depending on ATR strength
This is intentional and essential, since the goal is to show:
✔ Volatility expansion
✔ Trend exhaustion
✔ Overextended price relative to VWAP
✔ Dynamic trend confirmation
Rather than simply smoothing past price.
🔷 4. Three Independent Adaptive Lines
Each of the three moving averages has:
Its own ATR length
Its own sensitivity multiplier
Its own optional VWAP influence
Its own color and trail
This allows the user to combine:
a fast volatility-adaptive trend line
a mid-range adaptive baseline
a slow adaptive long-trend MA
All adapting independently to volatility and VWAP conditions.
🔶 5. Optional Candle Coloring
The indicator can color candles according to trend strength derived from the fast/slow MAs.
Stronger trends produce more vivid colors. Neutral or conflicting trends produce softer colors.
This adds a visual layer to identify:
Trend direction
Trend strength
Volatility state
Market compression
at a glance.
📌 Summary
This indicator does not behave like standard SMAs or EMAs because each line dynamically adapts to:
🔸 ATR (volatility)
🔸 VWAP (fair value)
This makes the indicator extremely responsive to market conditions while still reducing noise during stable phases.
It provides a more realistic, context-aware, and intelligent representation of price behavior compared to traditional moving averages.
R-VWAP

SMAs TimePortalPlots 5× SMAs from 3 different timeframes - plus current chart timeframe
Plots 2× VWAPs with bands.
Meant for personal use, but maybe you can find it useful too.
Disclaimer: Beware I might update this with big changes in the future.

Luxy VWAP Magic - MTF Projection EngineThis indicator transforms the classic VWAP into a comprehensive trading system. Instead of switching between multiple indicators, you get everything in one place: multi-timeframe analysis, statistical bands, momentum detection, volume profiling, session tracking, and divergence signals.
What Makes This Different
Traditional VWAP indicators show a single line. This tool treats VWAP as a foundation for complete market analysis. The indicator automatically detects your asset type (stocks, crypto, forex, futures) and adjusts its behavior accordingly. Crypto traders get 24/7 session tracking. Stock traders get proper market hours handling. Everyone gets institutional-grade analytics.
Anchor Period Options
The anchor period determines when VWAP resets and recalculates. You have three categories of options:
Time-Based Anchors:
Session - Resets at market open. Best for intraday stock trading where you want fresh VWAP each day.
Day - Resets at midnight UTC. Standard option for most traders.
Week / Month / Quarter / Year - Longer reset periods for swing traders and position traders who want broader context.
Rolling Window Anchors:
Rolling 5D - A sliding 5-day window that never resets. Solves the Monday problem where weekly VWAP equals daily VWAP on first day of week.
Rolling 21D - Approximately one month of trading data in continuous calculation. Excellent for crypto and forex markets that trade 24/7 without clear session breaks.
Event-Based Anchors:
Dividends - Resets on ex-dividend dates. Track institutional cost basis from dividend events.
Splits - Resets on stock split dates. Useful for analyzing post-split trading behavior.
Earnings - Resets on earnings report dates. See where volume-weighted trading occurred since last quarterly report.
Standard Deviation Bands
Three sets of bands surround the main VWAP line:
Band 1 (Aqua) - Plus and minus one standard deviation. Approximately 68% of price action occurs within this range under normal distribution. Touches suggest minor extension.
Band 2 (Fuchsia) - Plus and minus two standard deviations. Only 5% of trading should occur outside this range statistically. Touches here indicate significant overextension and high probability of mean reversion.
Band 3 (Purple) - Plus and minus three standard deviations. Touches are rare (0.3% probability) and represent extreme conditions. Often marks climax moves or panic selling/buying.
Each band can be toggled independently. Most traders show Band 1 by default and add Band 2 and 3 for specific setups or volatile instruments.
Multi-Timeframe VWAP System
The MTF section plots previous period VWAPs as horizontal support and resistance levels:
Daily VWAP - Previous day's final VWAP value. Key intraday reference level.
Weekly VWAP - Previous week's final VWAP. Important for swing traders.
Monthly VWAP - Previous month's final VWAP. Institutional benchmark level.
Quarterly VWAP - Previous quarter's final VWAP. Major support/resistance for position traders.
Previous Day VWAP - Yesterday's closing VWAP specifically, separate from current daily calculation.
The Confluence Zone percentage setting determines how close multiple VWAPs must be to trigger a confluence alert. When two or more timeframe VWAPs converge within this threshold, you get a high-probability support/resistance zone.
Session VWAPs for Global Markets
For forex, crypto, and futures traders who operate in 24/7 markets, the indicator tracks three major global sessions:
Asia Session - UTC 21:00 to 08:00. Gold colored line. Typically lower volatility, range-bound action that sets overnight levels.
London Session - UTC 08:00 to 17:00. Orange colored line. Often determines daily direction with high volume European participation.
New York Session - UTC 13:00 to 22:00. Blue colored line. Highest volume session globally. Sharp directional moves common.
Previous session VWAP values display as horizontal lines when each session closes, acting as intraday support and resistance. The table shows which sessions are currently active with checkmarks.
On-Chart Labels and Signals
The indicator plots several types of labels directly on price action when significant events occur:
Volume Spike Labels
Fire when current bar volume exceeds configurable thresholds relative to both the previous bar and the 20-bar average. Default settings require 300% of previous bar AND 200% of average volume. Green labels indicate bullish candles. Red labels indicate bearish candles. These spikes often mark institutional entry points.
Momentum Shift Labels
Appear when VWAP acceleration changes direction. The Slowing label warns when an active trend loses steam, often preceding reversal. The Accelerating label confirms trend continuation or potential bottom during downtrends. Filters available to show only reversal signals in existing trends.
VWAP Squeeze Labels
Detect when standard deviation bands contract relative to ATR (Average True Range). Low volatility compression often precedes explosive breakout moves. When the squeeze fires (releases), a label appears with directional prediction based on VWAP slope.
Divergence Labels
Mark price/volume divergences using CVD (Cumulative Volume Delta) analysis:
Bullish divergence: Price makes lower low, but CVD makes higher low. Hidden accumulation despite price weakness.
Bearish divergence: Price makes higher high, but CVD makes lower high. Hidden distribution despite price strength.
Dynamic VWAP Coloring
The main VWAP line changes color based on its slope direction:
Green - VWAP is rising. Institutional buying pressure. Volume-weighted price increasing.
Red - VWAP is falling. Institutional selling pressure. Volume-weighted price decreasing.
Gray - VWAP is flat. Consolidation or balance between buyers and sellers.
This coloring can be disabled for a static blue line if you prefer cleaner visuals. The VWAP label next to the line shows the current trend direction and delta percentage.
Calculated Projection Cone
One of the most powerful features is the Calculated Projection Cone. Unlike traditional extrapolation methods that simply extend a trend line forward, this system analyzes what actually happened in similar market conditions throughout the chart's history.
How It Works:
The system classifies each bar into one of 27 unique market states:
Z-Score Level - LOW (oversold), MID (fair value), or HIGH (overbought) based on configurable thresholds
Trend Direction - DOWN, FLAT, or UP based on VWAP slope
Volume Profile - LOW (below 80%), NORMAL (80-150%), or HIGH (above 150%) relative volume
When you look at the current bar, the indicator:
1. Identifies the current market state (e.g., LOW Z-Score + UP Trend + HIGH Volume)
2. Searches through all historical bars on the chart that had the same state
3. Calculates what happened in those bars X bars later (where X is your projection horizon)
4. Shows you the probability of up/down and the average move size
Visual Elements:
Probability Cone - Colored green (bullish probability above 55%), red (bearish below 45%), or gold (neutral). The cone width represents the historical range of outcomes (roughly the 20th to 80th percentile).
Center Line - Shows the average expected price based on historical outcomes in similar conditions.
Probability Label - Displays direction probability and average move. Example: "67% UP (+0.8%)" means 67% of similar past cases moved up, averaging 0.8% gain.
Fallback System:
When the exact 27-state match has insufficient historical data:
First fallback: Uses Z-Score plus Trend only (9 broader states, ignoring volume)
Second fallback: Uses Z-Score only (3 states)
When fallback is active, confidence automatically adjusts
Settings:
Projection Horizon - How many bars forward to analyze outcomes (5, 10, 15, or 20 bars, default 10)
Lookback Period - Historical data window in days (30-252, default 60)
Minimum Samples - Cases needed before using fallback (5-30, default 10)
Z-Score Threshold - Bucket boundary for LOW/MID/HIGH classification (1.0, 1.5, or 2.0 sigma)
Cloud Transparency - Adjust visibility (50-95%)
Colors - Customize bullish, bearish, and neutral cone colors
Confidence Levels:
HIGH - 30 or more similar historical cases found
MEDIUM - 15-29 similar cases
LOW - Fewer than 15 cases (more uncertainty)
IMPORTANT DISCLAIMER:
The Calculated Projection is based on past patterns only. It is NOT a price prediction or financial advice. Similar market states in the past do not guarantee similar outcomes in the future. The probability shown is historical frequency, not a guarantee. Always combine with other analysis and never rely solely on projections for trading decisions.
Alert Conditions
The indicator includes over 20 pre-built alert conditions:
Price vs VWAP:
Price crosses above VWAP
Price crosses below VWAP
Band Touches:
Price touches plus or minus one sigma band
Price touches plus or minus two sigma band (extreme)
Price touches plus or minus three sigma band (very extreme)
Z-Score Extremes:
Z-Score crosses above plus two (overbought extreme)
Z-Score crosses below minus two (oversold extreme)
Momentum and Trend:
Momentum slowing
Momentum accelerating
Trend turns bullish/bearish/neutral
Volume:
Volume spike detected
CVD Direction:
Buyers take control
Sellers take control
High Probability Signals:
Bullish reversal signal (oversold plus accelerating momentum)
Bearish reversal signal (overbought plus slowing momentum)
MTF and Special:
MTF confluence zone entry
VWAP squeeze fired
Bullish/Bearish divergence detected
Any significant signal (catch-all)
All signals use confirmed bar data to prevent false alerts from incomplete candles.
Settings Overview
Settings are organized into logical groups:
VWAP Settings
Anchor Period selection
Show/Hide VWAP line
Dynamic coloring toggle
VWAP label visibility
Bands Visibility
Toggle each of three bands independently
Info Table
Show/Hide table
Table position (9 options)
Text size
Volume spike label settings with adjustable thresholds
Momentum label settings with filters
Signal labels limited to 5 most recent (auto-managed)
Probability engine lookback period
Multi-Timeframe VWAP
Enable/Disable MTF system
Show MTF in table
Show MTF lines on chart
Individual timeframe toggles
Confluence zone threshold
Squeeze detection toggle
Session VWAPs
Enable/Disable session tracking
Apply to all assets option
Show session labels
Divergence Detection
Enable/Disable divergence
Pivot lookback period
Show divergence labels
Calculated Projection
Enable/Disable projection cone
Projection horizon (5, 10, 15, or 20 bars)
Lookback period in days (30-252)
Minimum samples threshold
Z-Score classification threshold (1.0, 1.5, or 2.0 sigma)
Cloud transparency adjustment
Bullish, bearish, and neutral colors
The Info Table - Your Trading Dashboard
The right side of your chart displays a compact table with up to twelve metrics.
Row-by-Row Breakdown:
Asset and Period - Shows what the indicator detected (US Stock, Crypto, Forex, etc.) and your selected anchor period. The detection happens automatically based on exchange data, so VWAP resets and calculations match your actual trading instrument.
Delta Percentage - How far current price sits from VWAP, expressed as a percentage. Positive means price trades above fair value. Negative means below. Large delta values (beyond 1-2%) often precede mean reversion moves. Day traders watch this for overextension.
Z-Score - Statistical deviation from VWAP measured in standard deviations. Unlike raw delta, Z-Score accounts for volatility. A 2% move in a volatile biotech stock differs from 2% in a stable utility. Z-Score normalizes this. Values beyond plus or minus two sigma occur only 5% of the time statistically.
Trend Direction - Whether VWAP itself is rising, falling, or flat. Rising VWAP means the volume-weighted average price is increasing, which indicates institutional accumulation. Falling VWAP suggests distribution. This differs from price trend since it weights by volume.
Momentum State - Is the trend accelerating or slowing down? This measures the rate of change in VWAP slope. When an uptrend shows slowing momentum, it often precedes reversal. Accelerating momentum in a downtrend can signal capitulation and potential bottom.
Relative Volume - Current bar volume compared to the 20-bar average, shown as percentage. Values above 150% indicate above-average activity. Spikes above 200-300% often mark institutional involvement. Low volume (below 80%) warns of potential fake moves.
MTF Bias - Four checkmarks or X marks showing whether price sits above or below Daily, Weekly, Monthly, and Quarterly VWAP. Four checkmarks means strong bullish alignment across all timeframes. Four X marks indicates bearish alignment. Mixed readings suggest consolidation or transition.
Band Probabilities - Historical statistics showing how often price touched each standard deviation band over your lookback period. This helps you understand if mean reversion or trend following works better for your specific instrument.
Session Status - Which global trading sessions are currently active (Asia, London, New York). Shows checkmarks for active sessions. Important for forex and crypto traders who need to know when major liquidity windows open and close.
Divergence State - Whether the indicator detects bullish or bearish divergence between price and cumulative volume delta. Bullish divergence occurs when price makes lower lows but buying pressure (CVD) makes higher lows, suggesting hidden accumulation.
Confidence Score - A weighted composite of all factors displayed as a progress bar and percentage. Combines MTF alignment, Z-Score, trend direction, volume delta, momentum, and relative volume into a single 0-100 score. Higher scores indicate stronger conviction setups.
Calculated Projection - When the Projection Cone is enabled, shows the historical probability of price direction and expected move. For example: "▲ 67% (+0.8%)" means in similar market states historically, price moved up 67% of the time with an average gain of 0.8%. The system analyzes 27 unique market states based on Z-Score, Trend, and Volume conditions.
Recommended Use Cases
Day Trading Stocks:
Use Session anchor with Band 1 visible. Watch for price returning to VWAP after morning move. Volume spikes near VWAP often mark institutional accumulation zones.
Swing Trading:
Use Weekly or Rolling 21D anchor. Enable MTF lines for Daily and Weekly levels. Trade pullbacks to these levels in direction of MTF bias.
Crypto and Forex:
Enable Session VWAPs. Use Rolling anchors to avoid artificial resets. Monitor session transitions for breakout opportunities.
Mean Reversion:
Focus on Z-Score reaching plus or minus two. Add Band 2 visibility. Combine with slowing momentum for highest probability reversals.
Trend Following:
Watch MTF bias alignment. Four checkmarks plus accelerating momentum plus high volume confirms trend continuation setups.
Projection Planning:
Enable the Calculated Projection to see what happened historically in similar market conditions. Use 5-10 bars for intraday setups, 15-20 bars for swing trade planning. Focus on high probability readings (above 60%) with HIGH confidence (30 or more samples). The cone shows the probable range of outcomes based on actual historical data. Combine with other factors like MTF alignment and volume for higher conviction setups.
Important Notes
The indicator does not repaint. MTF values use previous period's confirmed data.
Rolling VWAP works best on 15-minute timeframes and above due to bar lookback requirements.
Session VWAPs apply to global markets by default (forex, crypto, futures). Enable the all-assets option for stocks if desired.
Volume data for forex represents tick volume, not actual traded volume.
All alert conditions fire only on confirmed (closed) bars to prevent false signals.
The Calculated Projection updates each bar as market state changes. This is expected behavior. The projection shows probabilities based on similar past conditions, not a fixed prediction.
Q AND A
Q: Does this indicator repaint?
A: No. The main VWAP calculation uses standard TradingView VWAP methodology. Multi-timeframe values use previous period's confirmed data with appropriate lookahead settings. All alert signals require bar confirmation.
Q: Why does my Rolling VWAP look different on 1-minute versus 15-minute charts?
A: Rolling VWAP calculates across a fixed number of trading days. On very short timeframes, the bar lookback may hit TradingView limits. For best Rolling VWAP accuracy, use 15-minute or higher timeframes.
Q: Can I use this on any instrument?
A: Yes. The indicator automatically detects asset type and adjusts behavior. Stocks use standard market hours. Crypto uses 24/7 calculations. Forex uses tick volume. Everything adapts automatically.
Q: What does the Confidence Score actually measure?
A: The score combines six weighted factors: MTF alignment (25%), Z-Score position (20%), Trend direction (20%), CVD pressure (15%), Momentum state (10%), and Relative volume (10%). Higher scores indicate more factors aligned in one direction.
Q: Why are Session VWAPs not showing on my stock chart?
A: Session VWAPs apply to 24-hour markets by default (forex, crypto, futures). For stocks, enable the Use for All Assets option in Session VWAP settings.
Q: The Divergence labels appear delayed. Is this a bug?
A: Divergence detection requires pivot confirmation, which needs bars on both sides of the pivot point. The label appears at the actual pivot location (several bars back) once confirmed. This is intentional and prevents false signals.
Q: Can I change the band colors?
A: Yes. Each of the three bands has its own color input setting. You can customize Band 1, Band 2, and Band 3 colors to match your preferences. The defaults are Aqua, Fuchsia, and Purple. The main VWAP line color adapts dynamically based on slope direction or can be set to static blue.
Q: How do I set up alerts?
A: Right-click on the chart, select Add Alert, choose this indicator, and select your desired condition from the dropdown. All conditions include descriptive alert messages with relevant data.
Q: What is the Probability Engine lookback period?
A: This setting determines how many trading days the indicator analyzes to calculate band touch rates and mean reversion statistics. Default is 60 days (approximately 3 months). Longer periods provide more stable statistics but may miss recent behavior changes.
Q: Why do I see fewer labels than expected?
A: Signal labels (Volume, Momentum, Squeeze, Divergence) are limited to 5 most recent labels on the chart to keep it clean. When a new label appears, the oldest one is automatically removed. Additionally, momentum labels have several filters: check the slope multiplier setting (higher values require stronger trends) and the Only Reversal Signals option (when enabled, labels only appear for potential reversals, not trend confirmations).
Q: What is the Calculated Projection and how accurate is it?
A: The Calculated Projection analyzes what happened in past market conditions similar to the current state. It classifies each bar by Z-Score level, Trend direction, and Volume profile (27 unique states), then shows the historical probability of up vs down and the average move size. It is NOT a price prediction or guarantee. The probability shown is how often similar conditions led to up/down moves historically, not a future guarantee. Always use it as one input among many.
Q: Why does the Projection probability change?
A: The projection updates on each bar as market state changes. If Z-Score moves from LOW to MID, or trend shifts from UP to FLAT, the system looks up a different historical category. This is expected behavior. The projection shows what happened in similar past conditions to the current bar's state.
Q: The Projection shows LOW confidence. What does that mean?
A: Confidence levels indicate sample size: HIGH means 30 or more historical cases found, MEDIUM means 15-29 cases, LOW means fewer than 15 cases. When sample size is low, the system uses a fallback: first aggregating by Z-Score plus Trend only (ignoring volume), then by Z-Score only. LOW confidence means less statistical reliability, so weight other factors more heavily in your decision.
Q: Why does the cone sometimes show 50/50 probability?
A: A 50/50 reading means that in similar past market states, price moved up roughly half the time and down half the time. This indicates a neutral or balanced condition where historical patterns provide no directional edge. Consider waiting for a higher probability setup or using other analysis methods.
CREDITS AND ACKNOWLEDGMENTS
Methodology Foundation:
VWAP (Volume Weighted Average Price) - Standard institutional benchmark calculation, widely used since the 1980s for algorithmic execution and fair value assessment
Standard Deviation Bands - Statistical volatility measurement applying normal distribution principles to price deviation from mean
Z-Score Analysis - Classic statistical normalization technique for comparing values across different volatility regimes
Cumulative Volume Delta (CVD) - Order flow analysis concept measuring aggressive buying versus selling pressure
Concept Integration:
Mean reversion probability engine - Custom historical statistics tracking for band touch rates
Momentum acceleration detection - Second derivative analysis of VWAP slope changes
VWAP Squeeze - Volatility compression concept adapted from TTM Squeeze methodology applied to VWAP bands versus ATR
Confidence scoring system - Weighted composite scoring combining multiple technical factors
Calculated Projection Cone - Probability-based projection using 27-state market classification (Z-Score, Trend, Volume) with historical outcome analysis and weighted fallback system
All calculations use standard public domain formulas and TradingView built-in functions. No proprietary third-party code was used.
For questions, feedback, or feature requests, please comment below or send a private message.
Happy Trading!

Session VWAPs [cryptalent]This indicator provides a more granular and timely analysis of market structure compared to traditional daily Volume Weighted Average Price (VWAP). It splits the 24-hour trading day into four distinct, customizable sessions (T1, T2, T3, T4), calculating an independent Session VWAP and Standard Deviation Bands for each segment.
🌟 Key Features and Functionality
1. Segmented VWAP Calculation
Purpose: To track the true Volume Weighted Average Price (Fair Value) specific to the participants and trading activities within different global market sessions (e.g., Asian, European, US sessions).
Design: By default, the 24 hours (based on UTC time) are divided into T1 (00:00-06:00), T2 (06:00-12:00), T3 (12:00-20:00), and T4 (20:00-00:00).
Mechanism: The VWAP calculation resets at the start of each designated session, offering a clearer, segment-specific view of market consensus and volume absorption.
2. Standard Deviation Bands
Calculation: Each Session VWAP line is accompanied by upper and lower standard deviation bands.
Control: The width of these bands is controlled by the user input "Band Multiplier" (default is 1.0, representing one standard deviation).
Application: These bands measure the Volume-Weighted Volatility and define the expected "normal" trading range for the current session.
- Price within the bands suggests consolidation or a normal auction process.
- Price breaking out of the bands indicates strong directional momentum or an extreme/overbought/oversold condition for that specific session.
3. High Customization (User Inputs)
Session Timing: All four session start and end times (in UTC) are customizable, allowing traders to align the indicator with specific market hours or individual trading strategies.
Price Source: The source price used for the VWAP calculation is selectable (default is close).
💡 Trading Applications
1. Fair Value Identification: The VWAP line serves as the "Fair Value" or "Volume-Weighted Consensus Cost" for the active session.
Price above VWAP: Buyers are in control during that session.
Price below VWAP: Sellers are in control during that session.
2. Dynamic Support & Resistance: Both the VWAP and the Standard Deviation Bands often act as reliable dynamic support and resistance levels.
3. Volatility Assessment: The width of the bands reflects the volume-weighted volatility of the current session. Narrow bands suggest range-bound trading; wide bands imply strong directional activity.
4. Trend Strength: Sustained price action outside of the standard deviation bands is a key measure of the strength and commitment behind a current trend.

Session Dynamics & Pivot Overlay (Arjo)## **OVERVIEW**
The **Session Dynamics & Pivot Overlay (Arjo)** is a visual analysis tool that displays session-based price ranges, anchored volume-weighted averages, daily pivot levels, and smoothed trend conditions on the chart. It highlights how price interacts with custom sessions, midpoint levels, and dynamic ranges, providing a structured visual layout that helps users observe market behavior over time without implying any form of prediction or trading signal.
## **CONCEPTS**
This indicator incorporates several widely used analytical concepts:
- **Session Ranges:** Identifies user-defined time windows and visually displays their high, low, and midpoint behavior throughout the session.
- **VWAP (Morning Session):** Shows volume-weighted average price calculations for a defined morning period, assisting with visual comparison between price and weighted averages.
- **Daily Pivot Levels:** Displays R1–R2, S1–S2, central pivot, and associated levels derived from prior daily price data.
- **Trend Smoothing:** Uses SuperSmoother filtering and an additional EMA to highlight whether the smoothed trend is rising or falling.
- **EMA + ATR Bands:** Plots a 20-period EMA with upper and lower ATR-derived bands to help visualize short-term price displacement relative to average true range.
All of these elements are presented solely for structural and comparative chart analysis.
## **FEATURES**
- **Custom Session Visualization:** Automatically draws session boxes, capturing the evolving high, low, and midpoint throughout the defined intraday window.
- **Dynamic Midline Calculation:** A midpoint line is updated continuously during the session to visually anchor price within the session’s range.
- **Morning Session VWAP:** Displays a dedicated VWAP line for the morning window with adjustable source and configuration options.
- **Daily Pivot Lines:** Automatically plots pivot, BC/TC, R1–R2, and S1–S2 levels with customizable colors, widths, and line styles.
- **Trend-Responsive Pivot Display:** Optionally toggles visibility of R2 or S2 depending on the direction of the smoothed trend.
- **EMA + ATR Zones:** Renders a 20-EMA and ATR-based support/resistance zone using filled regions for enhanced visual clarity.
- **Full Customization:** Multiple color, transparency, line-style, and display options allow users to adapt the presentation to their charting preferences.
- **Overlay Compatible:** Designed to work directly on price charts without obstructing candles or other overlays.
## **HOW TO USE**
Users can interact with the indicator entirely through the settings panel:
- Adjust session timings to match preferred market hours or custom internal zones.
- Enable or disable the display of pivot levels, VWAP, or the ATR/EMA zone.
- Customize colors and line styles to improve visibility according to the chart background or personal preference.
- Observe how price behaves relative to the session box, midpoint, VWAP, and pivot levels for contextual understanding.
- Utilize the smoothed trend condition to see when the indicator chooses to display certain pivot extensions.
These elements help users interpret chart structure, volatility, and intraday behavior in a visually organized manner.
## **CONCLUSION**
The ** Session Dynamics & Pivot Overlay (Arjo) ** indicator offers a consolidated view of session structure, pivot levels, VWAP, and smoothed trend conditions. Its purpose is to improve visual clarity and assist users in understanding market context without issuing directives or trade suggestions. It functions as an educational tool that enhances chart interpretation and supports structured analysis.
---
## **DISCLAIMER**
This indicator is for educational and visual analysis purposes only. It does not provide trading signals, financial advice, or guaranteed outcomes. Users should conduct their own research and consult a licensed financial professional when necessary. All trading decisions are solely the responsibility of the user.
Happy Trading (Arjo)

Aydan ScalperBy when EMA 8 cross EMA 21 from Below to Abouve and SELL when EMA 21 cross EMA 8 from Abouve to Belove

VWAP 1SD 2SD yasurferThis custom intraday indicator is designed to provide a detailed understanding of market equilibrium, volatility expansion, and trend structure by combining Session VWAP, Standard Deviation bands, and multi-timeframe EMAs. The script calculates cumulative volume-weighted price data throughout the trading day and automatically resets at the start of each new session. This ensures that the Session VWAP reflects only current-day trading activity, making it highly relevant for scalpers, day traders, and intraday swing setups.
The ±2 Standard Deviation bands illustrate where price is statistically stretched. These zones often act as areas of exhaustion, liquidity grabs, or potential momentum continuation points. By tracking variance around VWAP, the indicator helps traders quickly identify whether price is trading within a normal distribution or pushing into extreme territory.
A dynamic label displays the real-time percentage distance from VWAP, allowing traders to assess how far price has deviated from fair value. This is particularly useful for identifying overextended moves, mean-reversion opportunities, or breakout conditions.
The addition of EMA 50, EMA 200, and EMA 325 provides structural trend context—helping traders evaluate higher-timeframe alignment and potential confluence with VWAP levels. Overall, this indicator enhances clarity, timing, and decision-making by blending statistical tools with traditional trend analysis.

Institutional VWAP Suite (Lite Compatible)The **Institutional VWAP Suite (Lite Compatible)** brings true institutional volume-weighted price analysis to every trader — even on TradingView Lite/Free accounts where standard VWAP tools are restricted.
This script recreates the most important VWAP models used by banks, funds, and high-frequency desks, including:
• **Daily VWAP** (exchange-accurate)
• **Weekly VWAP** (manually accumulated)
• **Monthly VWAP** (manually accumulated)
• **Rolling Window VWAP** (array-based, fully Lite-compatible)
All calculations avoid blocked functions like `ta.sum` or session-restricted VWAP calls. Everything is built manually from volume and price to ensure accuracy across all accounts and all markets.
### Features
• Multi-timeframe VWAPs (Daily/Weekly/Monthly)
• Manual Rolling VWAP with adjustable length
• Optional VWAP bands (Lite-safe)
• Clean visuals with color-coded levels
• Optimized arrays for fast, stable performance
• Free-tier compatible — no premium functions required
This tool is designed for traders who want institutional structure, premium-level VWAP calculations, and consistent execution regardless of plan level. Perfect for scalpers, day traders, futures traders, and anyone who uses intraday volume profiles.
### Recommended Use
• Map directional bias using Daily vs Weekly VWAP
• Use Monthly VWAP for macro trend context
• Track intraday mean reversion with Rolling VWAP
• Use VWAP bands as dynamic support/resistance zones
A simple, powerful, no-restrictions VWAP engine — built for everyone.

FAIRPRICE_VWAP_RDFAIRPRICE_VWAP_RD
This script plots an **anchored VWAP (Volume Weighted Average Price)** that resets
based on the user-selected anchor period. It acts as a dynamic “fair value” line
that reflects where the market has actually transacted during the chosen period.
FEATURES
- Multiple anchor options: Session, Week, Month, Quarter, Year, Decade, Century,
Earnings, Dividends, or Splits.
- Intelligent handling of the “Session” anchor so it works correctly on both 1m
(resets each new day) and 1D (continuous, non-resetting VWAP).
- Manual VWAP calculation using cumulative(price * volume) and cumulative(volume),
ensuring the line is stable and works on all timeframes.
- Optional hiding of VWAP on daily or higher charts.
- Offset input for horizontal shifting if desired.
- VWAP provides a true “fair price” reference for trend, mean-reversion,
and institutional-level analysis.
PURPOSE
This indicator solves the common problem of VWAP behaving incorrectly on higher
timeframes, on synthetic data, or with unusual anchors. By implementing VWAP
manually and allowing flexible reset conditions, it functions reliably as
an institutional-style fair value benchmark across any timeframe.

Custom MTF VWAP 5x This is a combination of all VWAPs I use to find high probability trade setups and targets by only taking trades when different VWAPs align

Volume Weighted Average Price - 6 band by buckstrdrstandard VWAP improved to allow 6 bands as standard

Moving VWAP-KAMA CloudMoving VWAP-KAMA Cloud
Overview
The Moving VWAP-KAMA Cloud is a high-conviction trend filter designed to solve a major problem with standard indicators: Noise. By combining a smoothed Volume Weighted Average Price (MVWAP) with Kaufman’s Adaptive Moving Average (KAMA), this indicator creates a "Value Zone" that identifies the true structural trend while ignoring choppy price action.
Unlike brittle lines that break constantly, this cloud is "slow" by design—making it exceptionally powerful for spotting genuine trend reversals and filtering out fakeouts.
How It Works
This script uses a unique "Double Smoothing" architecture:
The Anchor (MVWAP): We take the standard VWAP and smooth it with a 30-period EMA. This represents the "Fair Value" baseline where volume has supported price over time.
The Filter (KAMA): We apply Kaufman's Adaptive Moving Average to the already smoothed MVWAP. KAMA is unique because it flattens out during low-volatility (choppy) periods and speeds up during high-momentum trends.
The Cloud:
Green/Teal Cloud: Bullish Structure (MVWAP > KAMA)
Purple Cloud: Bearish Structure (MVWAP < KAMA)
🔥 The "Reversal Slingshot" Strategy
Backtests reveal a powerful behavior during major trend changes, particularly after long bear markets:
The Resistance Phase: During a long-term downtrend, price will repeatedly rally into the Purple Cloud and get rejected. The flattened KAMA line acts as a "concrete ceiling," keeping the bearish trend intact.
The Breakout & Flip: When price finally breaks above the cloud with conviction, and the cloud flips Green, it signals a structural regime change.
The "Slingshot" Retest: Often, immediately after this flip, price will drop back into the top of the cloud. This is the "Slingshot" moment. The old resistance becomes new, hardened support.
The Rally: From this support bounce, stocks often launch into a sustained, multi-month bull run. This setup has been observed repeatedly at the bottom of major corrections.
How to Use This Indicator
1. Dynamic Support & Resistance
The KAMA Wall: When price retraces into the cloud, the KAMA line often flattens out, acting as a hard "floor" or "wall." A break of this wall usually signals a genuine trend change, not just a stop hunt.
2. Trend Confirmation (Regime Filter)
Bullish Regime: If price is holding above the cloud, only look for Long setups.
Bearish Regime: If price is holding below the cloud, only look for Short setups.
No-Trade Zone: If price is stuck inside the cloud, the market is traversing fair value. Stand aside until a clear winner emerges.
3. Multi-Timeframe Versatility
While designed for trend confirmation on higher timeframes (4H, Daily), this indicator adapts beautifully to lower timeframes (5m, 15m) for intraday scalping.
On Lower Timeframes: The cloud reacts much faster, acting as a dynamic "VWAP Band" that helps intraday traders stay on the right side of momentum during the session.
Settings
Moving VWAP Period (30): The lookback period for the base VWAP smoothing.
KAMA Settings (10, 10, 30): Controls the sensitivity of the adaptive filter.
Cloud Transparency: Adjust to keep your chart clean.
Alerts Included
Price Cross Over/Under MVWAP
Price Cross Over/Under KAMA
Cloud Flip (Bullish/Bearish Trend Change)
Tip for Traders
This is not a signal entry indicator. It is a Trend Conviction tool. Use it to filter your entries from faster indicators (like RSI or MACD). If your fast indicator signals "Buy" but the cloud is Purple, the probability is low. Wait for the Cloud Flip

Volume weighted average price band strategy [Kevin-Patrick]VWAP Bands strategy, Credit
VWAP Machine Learning Bands is an advanced indicator designed to enhance trading analysis by integrating VWAP with a machine learning-inspired adaptive smoothing approach. This tool helps traders identify trend-based support and resistance zones, predict potential price movements, and generate dynamic trade signals.
Key Features
Adaptive ML VWAP Calculation: Uses a dynamically adjusted SMA-based VWAP model with volatility sensitivity for improved trend analysis.
Forecasting Mechanism: The 'Forecast' parameter shifts the ML output forward, providing predictive insights into potential price movements.
Volatility-Based Band Adjustments: The 'Sigma' parameter fine-tunes the impact of volatility on ML smoothing, adapting to market conditions.
Multi-Tier Standard Deviation Bands: Includes two levels of bands to define potential breakout or mean-reversion zones.
Dynamic Trend-Based Colouring: The VWAP and ML lines change colour based on their relative positions, visually indicating bullish and bearish conditions.
Custom Signal Detection Modes: Allows traders to choose between signals from Band 1, Band 2, or both, for more tailored trade setups.
+ Strategy setting by Kevin-Patrick

Dynamic Fair-Value Ribbon Pro @darshakssc1. What This Indicator Is (In Simple Terms)
The Dynamic Fair-Value Ribbon Pro is a visual tool that helps you see how price behaves around a statistically derived “fair-value zone”:
A colored ribbon/cloud marks a central “fair” area.
Areas above the ribbon are labeled as “Unfair High Zone”.
Areas below the ribbon are labeled as “Unfair Low Zone”.
A small state panel tells you where price currently sits relative to this ribbon.
All calculations are based only on historical price, volume, and volatility.
It does not predict future price, does not give buy/sell signals, and is not financial advice.
2. Adding the Indicator
Open a chart on TradingView.
Click on Indicators .
Search for “Dynamic Fair-Value Ribbon Pro” .
Click to add it to your chart.
You will see:
A cloud/ribbon around price.
Colored bars when price is outside the ribbon.
A panel in the top right describing the current state.
3. Core Concept: Fair vs Unfair Zones (Analytical Only)
The indicator tries to answer a descriptive question:
“Where is price trading relative to a historically derived central area?”
It does this by:
Calculating a central value (“fair mid”).
Building a band around that mid.
Coloring the chart depending on whether price is inside or outside that band.
It is not claiming that:
Price “must” return to the band.
Price is “overvalued” or “undervalued”.
Any state is good or bad.
It is simply a visual classification tool .
4. Engine Modes — How the Ribbon Is Calculated
Under “Fair-Value Engine” you can choose:
4.1 Mode 1: Range
Looks back over a chosen number of bars (default: 100).
Finds the highest high and lowest low in that window.
Defines a central “slice” of that range as the fair-value ribbon :
Range Mode: Lower Percent → bottom boundary of the slice (e.g., 30%).
Range Mode: Upper Percent → top boundary of the slice (e.g., 70%).
Effect:
The ribbon represents a middle portion of the historical range .
Above the ribbon = “Unfair High Zone” (analytical label only).
Below the ribbon = “Unfair Low Zone”.
This is purely statistical — it does not mean price is wrong or will revert.
4.2 Mode 2: VWAP + Stdev
In this mode, the central value is based on VWAP :
VWAP (Volume-Weighted Average Price) is used as the midline.
A standard deviation envelope is built around VWAP:
VWAP Mode: Stdev Multiplier controls how wide that envelope is.
Effect:
The ribbon shows where price is trading relative to a volume-weighted average .
Again, areas above and below are just described as “unfair” zones in a visual, analytical sense , not a predictive one.
5. ATR Adaptive Width — Making the Ribbon React to Volatility
Under “ATR Adaptive Width” :
Use ATR Adaptive Width:
On: the band width scales with volatility.
Off: band width stays fixed based on Range or VWAP settings.
ATR Length: how many bars to use for ATR.
Reference ATR (% of price): a reference level for normal volatility.
Min Width Scale / Max Width Scale: clamps the scaling so that the band doesn’t get too narrow or too wide.
What this does (analytically):
When volatility (ATR) is higher than the reference, the band can become wider .
When volatility is lower , the band can become narrower .
This is a mathematical rescaling only and does not imply any optimal levels or performance.
6. Visual Elements — What You See on the Chart
6.1 Fair-Value Ribbon (Cloud)
The cloud between Fair Ribbon Low and Fair Ribbon High is the fair zone .
Color can be changed via “Fair Ribbon Color” .
6.2 Midline
If “Show Center Line” is enabled:
A line runs through the middle of the ribbon.
In Range mode, this is the average of the upper and lower band.
In VWAP mode, it’s essentially the VWAP-based mid.
This line is for visual reference only and makes no claims about support, resistance, or reversion.
6.3 Bar Colors
Unfair High Zone: bars are colored with Unfair High Bar Color.
Unfair Low Zone: bars are colored with Unfair Low Bar Color.
Inside the ribbon:
If “Fade Bars Inside Fair Zone” is ON, bars may be more faded/neutral.
These colors are simply classification highlights ; they do not tell you what to do.
6.4 State Panel (Top Right)
If “Show State Panel” is enabled, you’ll see a small box that displays:
Current engine:
Range or VWAP+Stdev.
Current price state:
Inside Ribbon (Fair Zone)
Above Ribbon (Unfair High Zone)
Below Ribbon (Unfair Low Zone)
This is a quick summary of where price sits relative to the computed ribbon.
7. Typical Ways to Use It (Informational Only)
The indicator can help you visually:
See when price is spending time inside a historically defined central zone.
Notice when price is frequently trading outside that zone.
Compare different timeframes (e.g., 5m vs 1h vs 4h) to see how the fair zone shifts.
Experiment with:
Range length (shorter vs longer lookback).
VWAP vs Range mode.
ATR adaptation on/off.
Important:
Any interpretation of these visuals is entirely up to the user.
The script does not tell you to buy, sell, hold, or do anything specific.
8. Limitations and Important Notes
All calculations use past data only (price, volume, volatility).
The ribbon does not guarantee:
that price will revert,
that zones will hold,
or that any outcome will occur.
There are no built-in signals such as “long/short” or automatic entries/exits.
The script is best used as a supporting, visual layer alongside other tools or methods you choose.
9. Disclaimer
This indicator is:
Strictly informational and educational.
Not a trading system or strategy.
Not financial advice or a recommendation.
Not guaranteed to be accurate, complete, or suitable for any specific purpose.
Users should always perform their own research and due diligence.
Past behavior of any visual pattern or zone does not guarantee future behavior.

Volume Weighted Average Price AdvancedVWAP (Advanced) with Multi‑Venue Aggregation and Historical Value Areas
Core: Anchored VWAP with configurable anchor (session/week/month/quarter/year/decade/century or corporate events), offset, and up to three standard-deviation bands.
Multi‑Venue Aggregation: Optionally pull price/volume from up to 5 additional exchanges/symbols (pair-matched by default). VWAP/σ are computed on the aggregated price*volume.
Value Area Blocks: Each completed anchor draws a block from the chosen basis (±1σ or ±2σ) or an optional percentile-based range (default 20–80%). Blocks project to the exact next anchor boundary, or you can extend them to the latest bar. Prior-period VWAP lines are shown inside the blocks.
Volume Gate: Optionally skip drawing prior blocks when the anchor’s aggregated volume is below a median/mean baseline times a multiplier.
HTF Context: Optional higher-timeframe VWAP overlay; can filter the current VWAP/bands so they only show when aligned with the HTF VWAP.
Venue Health: Label shows how many extra venues were included (non‑na) and median venue volume; flags divergence when primary volume is below venue median × threshold.
Alerts: Price in current value area (VWAP ±1σ) and price crossing the most recent prior VWAP.
Styling: Bands and fills are minimal; HTF VWAP is a distinct line; value-area blocks are shaded with prior VWAP lines inside.
Configure via the grouped inputs: VWAP Settings, Additional Exchange Sources, Historical Value Areas, HTF Context, and Bands Settings.

Daily & Average Dollar VolumeCalculates the daily and average (20D) $ volume.
Fully customizable appearence and can be placed in any corner.

RSI VWAP EMA ON CHART1. Understand the components
VWAP (Volume Weighted Average Price)
Green: price is above VWAP → bullish trend
Red: price is below VWAP → bearish trend
Blue: price exactly at VWAP → neutral
Acts as a dynamic trend line and support/resistance.
4 Moving Averages (MA1–MA4)
Customizable lengths and type (SMA or EMA).
Useful for trend confirmation and dynamic support/resistance.
Typically:
MA1 = fastest (short-term)
MA4 = slowest (long-term)
When price is above multiple MAs → strong bullish trend; below → bearish trend.
RSI Overlay with VWAP Alignment
RSI line normalized to price scale.
Background shading indicates momentum aligned with VWAP trend:
Green shading: RSI > 50 and price above VWAP → bullish momentum
Red shading: RSI < 50 and price below VWAP → bearish momentum
Gray areas: neutral or momentum does not align with VWAP.
2. Basic usage workflow
Trend Confirmation
Look at VWAP color: price above → bullish, below → bearish.
Check RSI + VWAP shading: green confirms bullish momentum, red confirms bearish momentum.
Check MA alignment: shorter MAs above longer MAs = stronger bullish trend; vice versa for bearish.
Entry Signals (Scalping)
Long (Buy) Setup
Price above VWAP (green)
RSI green shading (RSI > 50)
Shorter MAs above longer MAs (trend support)
Short (Sell) Setup
Price below VWAP (red)
RSI red shading (RSI < 50)
Shorter MAs below longer MAs
Exits / Stops
Exit if price closes against VWAP trend (e.g., price drops below VWAP during a bullish trade).
Use nearest MA support/resistance as stop-loss or take-profit zones.
3. Optional adjustments for scalping
RSI length / thresholds
Shorter RSI (7–10) → faster response for scalping.
Standard RSI (14) → smoother, fewer false signals.
MA lengths
Short-term: 20–50
Medium-term: 50–100
Long-term: 100–200
Can tweak for the timeframe you trade (1m, 5m, 15m).
Timeframe
VWAP works best on intraday charts (1m, 5m, 15m).
Use higher timeframe (e.g., 15m or 1h) for trend direction and lower timeframe (1m–5m) for entries.
4. Example Scalping Setup
Bullish setup (buy):
Price above VWAP → VWAP green
RSI > 50 and green shading
Shorter MAs above longer MAs
Enter on small pullback or breakout
Stop: below nearest MA or VWAP
Bearish setup (sell):
Price below VWAP → VWAP red
RSI < 50 and red shading
Shorter MAs below longer MAs
Enter on minor bounce or breakdown
Stop: above nearest MA or VWAP
5. Visual cues summary
Element Interpretation
VWAP Green Price above VWAP → bullish trend
VWAP Red Price below VWAP → bearish trend
RSI Green Shading Bullish momentum aligns with VWAP
RSI Red Shading Bearish momentum aligns with VWAP
MA Alignment Trend strength (short above long = bullish, short below long = bearish)

VWAP + 4 MAs with RSI Overlay & VWAP Alignment1. Understand the components
VWAP (Volume Weighted Average Price)
Green: price is above VWAP → bullish trend
Red: price is below VWAP → bearish trend
Blue: price exactly at VWAP → neutral
Acts as a dynamic trend line and support/resistance.
4 Moving Averages (MA1–MA4)
Customizable lengths and type (SMA or EMA).
Useful for trend confirmation and dynamic support/resistance.
Typically:
MA1 = fastest (short-term)
MA4 = slowest (long-term)
When price is above multiple MAs → strong bullish trend; below → bearish trend.
RSI Overlay with VWAP Alignment
RSI line normalized to price scale.
Background shading indicates momentum aligned with VWAP trend:
Green shading: RSI > 50 and price above VWAP → bullish momentum
Red shading: RSI < 50 and price below VWAP → bearish momentum
Gray areas: neutral or momentum does not align with VWAP.
2. Basic usage workflow
Trend Confirmation
Look at VWAP color: price above → bullish, below → bearish.
Check RSI + VWAP shading: green confirms bullish momentum, red confirms bearish momentum.
Check MA alignment: shorter MAs above longer MAs = stronger bullish trend; vice versa for bearish.
Entry Signals (Scalping)
Long (Buy) Setup
Price above VWAP (green)
RSI green shading (RSI > 50)
Shorter MAs above longer MAs (trend support)
Short (Sell) Setup
Price below VWAP (red)
RSI red shading (RSI < 50)
Shorter MAs below longer MAs
Exits / Stops
Exit if price closes against VWAP trend (e.g., price drops below VWAP during a bullish trade).
Use nearest MA support/resistance as stop-loss or take-profit zones.
3. Optional adjustments for scalping
RSI length / thresholds
Shorter RSI (7–10) → faster response for scalping.
Standard RSI (14) → smoother, fewer false signals.
MA lengths
Short-term: 20–50
Medium-term: 50–100
Long-term: 100–200
Can tweak for the timeframe you trade (1m, 5m, 15m).
Timeframe
VWAP works best on intraday charts (1m, 5m, 15m).
Use higher timeframe (e.g., 15m or 1h) for trend direction and lower timeframe (1m–5m) for entries.
4. Example Scalping Setup
Bullish setup (buy):
Price above VWAP → VWAP green
RSI > 50 and green shading
Shorter MAs above longer MAs
Enter on small pullback or breakout
Stop: below nearest MA or VWAP
Bearish setup (sell):
Price below VWAP → VWAP red
RSI < 50 and red shading
Shorter MAs below longer MAs
Enter on minor bounce or breakdown
Stop: above nearest MA or VWAP
5. Visual cues summary
Element Interpretation
VWAP Green Price above VWAP → bullish trend
VWAP Red Price below VWAP → bearish trend
RSI Green Shading Bullish momentum aligns with VWAP
RSI Red Shading Bearish momentum aligns with VWAP
MA Alignment Trend strength (short above long = bullish, short below long = bearish)

CCI ±100 Price Deviation with SMA & VWAP Trend ColorIndicator Synopsis: CCI ±100 Price Deviation with SMA & VWAP
Purpose:
This indicator combines trend filtering, momentum smoothing, and dynamic price bands to help identify intraday trading opportunities. It’s designed for:
15-minute chart → trend identification
1–2 minute chart → precise entries based on dynamic bands
Components:
SMA of Typical Price (smaTP)
Smooth average of the current bar’s typical price (hlc3).
Acts as a dynamic midpoint for the ±100 deviation bands.
±100 Deviation Bands
Calculated using a modified CCI formula:
Upper = SMA TP + 0.015 × MAD × 100
Lower = SMA TP - 0.015 × MAD × 100
Works as dynamic support/resistance and potential reversal zones.
SMA of CCI length (scaled to price)
Smooths the CCI momentum signal to the price scale.
Acts as a confirmation filter for trade direction near bands.
Optional toggle and customizable color/line width.
VWAP (Volume Weighted Average Price)
Optional overlay with trend-based coloring:
Price above VWAP → bullish → green
Price below VWAP → bearish → red
Acts as primary trend filter.
How to Use the Indicator
Step 1: Determine Trend (15-minute chart)
Check VWAP trend:
Price > VWAP → bullish trend → only consider long trades
Price < VWAP → bearish trend → only consider short trades
Confirm with SMA TP slope:
Rising SMA → bullish bias
Falling SMA → bearish bias
This ensures you only trade in the direction of the intraday trend.

VWAP TrendSignalVWAP TrendSignal
VWAP (Volume-Weighted Average Price) is the market’s true fair value — the benchmark institutions use to see when price is balanced, extended, or trending with real intent.
Price often snaps back when it moves too far (mean reversion), and only shows genuine strength when it holds above or below VWAP.
VWAP TrendSignal makes this insight effortless by color-coding VWAP direction:
Yellow = VWAP rising → bullish pressure
Red = VWAP falling → bearish pressure
No bands. No noise. Just pure directional clarity.
Anchor VWAP to the Session, Week, Month, Quarter, or Year, and tailor the Slope Smoothing Filter to your timeframe:
1–2 smoothing → fast & reactive (1–5m scalping)
3–5 smoothing → clean & stable (5–15m intraday)
6–10 smoothing → slow flips (1H–4H swings)
10–15 smoothing → macro bias only (Daily/Weekly)
The line adapts to how you trade.
How to Use It
Mean Reversion
When price stretches far from VWAP, expect pullbacks or snapbacks.
Trend Direction
Yellow supports long bias, red supports short bias.
Simple, reliable, instantly visible.
Balance Zones
Price sitting near VWAP = compression, buildup, or chop.
A perfect signal to wait or prepare for a breakout.
Why It Works
VWAP TrendSignal distills institutional logic into a clean, single-line tool.
It shows fair value, trend slope, and balance all at once — making your chart clearer and your decisions faster.
Once you get used to reading it, trading without it feels blind.

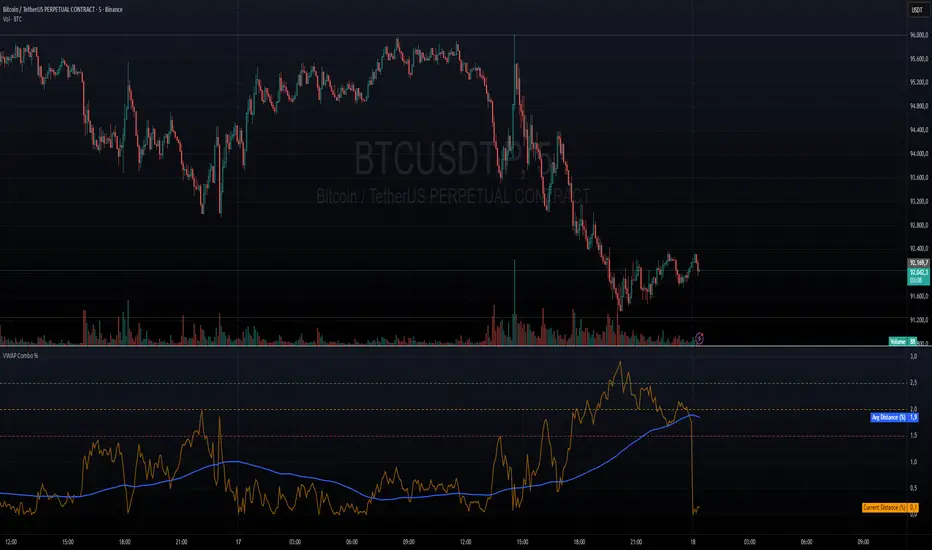
VWAP + VWAP Distance Avg + Alert Lines (%)VWAP Distance & Average Distance Indicator – Detailed Description
The VWAP + VWAP Distance Avg + Alert Lines (%) indicator is designed to measure the distance of the current price from the VWAP (Volume Weighted Average Price), as well as the average distance over a specified period. This tool is particularly useful for traders who use the VWAP as a magnet for price, helping to identify potential trend changes and areas where price may revert toward the VWAP.
Key Features
Current Distance (%)
Calculates the absolute percentage difference between the current price and the VWAP
This line shows how far the price has moved away from the VWAP at any given moment.
Average Distance (%)
Calculates a simple moving average (SMA) of the distance over a specified lookback period.
This provides a reference for typical price deviations from the VWAP, helping traders assess whether the current distance is unusually high or low.
Alert Lines (%)
Allows up to three customizable horizontal alert lines, which can be turned on or off individually.
Each line can be configured with:
Value in percent.
Color.
Line thickness.
These lines serve as visual thresholds, helping traders detect extreme deviations from the VWAP that may precede trend reversals.
Use Case – Detecting Potential Trend Changes
Traders often treat the VWAP as a price magnet, where price tends to revert after significant deviations.
When the current distance exceeds typical average levels or crosses an alert line, it can signal that the price may revert toward the VWAP, potentially indicating a shift in trend or a high-probability mean-reversion scenario.
Disclaimer
This indicator is provided for educational and analytical purposes only. It does not constitute financial advice, and trading decisions are always the sole responsibility of the individual trader. Users should carefully evaluate market conditions and their own risk tolerance before taking any trade.
Better used with VWAP on chart , and be careful around the end of session, for now this works just for session...
still improving on this....
Advanced Intraday Darvas BoxThis indicator applies a modern Darvas Box strategy for intraday traders, using non-repainting pivot detection combined with strong filters to reduce chart noise:
Confirmed swing highs and lows: Boxes only form when genuine swing pivots appear, ensuring fully non-repainting signals.
Minimum box height: Small, "noise" boxes are filtered out using ATR multiples for meaningful zones.
Trend filter: Choose EMA, SMA, or VWAP to lock boxes and breakouts to market direction.
Volume confirmation: Boxes are only confirmed when volume is above a user-defined threshold, highlighting high-participation moves.
Breakout filter: Signals trigger only if the breakout candle closes substantially beyond the box, reducing false breakouts.
Limited box display: Recent boxes only, keeping your chart clean and readable.
Features & Inputs
Pivot sensitivity: Set the number of bars for swing calculation.
Box filtering: Specify the minimum ATR multiple for box size.
Trend selection: EMA, SMA, VWAP, or None.
Volume filter & threshold: Activate for greater breakout confidence.
Breakout/Breakdown strength: Set how far price must close beyond the box to signal power.
Maximum boxes: Control the number of active boxes to keep the chart clear.
How to Add and Use
Add to Chart:
Click the “Add to Favorite Scripts” star to mark this indicator.
Open your desired intraday chart (1m–30m works best).
Click “Indicators,” search for “Advanced Intraday Darvas Box,” and add to your chart.
Customize Inputs:
Use the settings gear ⚙️ to adjust pivot sensitivity, trend logic, box filtering, and volume confirmation.
Lower minimum box height or pivot length for more frequent signals. Raise them for sparser, higher conviction setups.
Reading Darvas Boxes:
Box Edges: Horizontal lines mark resistance (top) and support (bottom) of detected zones.
Shaded regions: Highlight the most relevant trading zones and where price could coil before breakout.
Breakout labels (↑/↓): These appear only when price makes a powerful, confirmed move beyond the box edge—aligned with trend.
Alerts: Turn on chart alerts using the “Strong Bullish Breakout” or “Strong Bearish Breakdown” alert conditions for automated signal monitoring.
Best Practices:
Use Darvas boxes to complement price action analysis. Combine with candlestick patterns, volume spikes, and other price structure.
Only trade strong breakout signals confirmed by volume and market direction.
Avoid excessive boxes—adjust "Max Boxes" and filters for your instrument and timeframe.
Important
This indicator is non-repainting and built for display clarity and clean signals.
No brokerage automation, no external linking, and pure price/volume logic—fully compliant with TradingView House Rules.
Always test settings and confirmations before using for live decision-making.

Smoothed VWAP Bands + EMAsSmoothed VWAP bands
With my script, you take the raw standard deviation and apply an EMA (exponential moving
Advantages:
1. Less noise:
* The bands don’t jump around with every tiny price spike.
* Makes it easier to judge real price extremes.
2. Better zone visualization:
* Inner and outer bands are smoother and more visually “stable.”
* Easier to see meaningful trends, support/resistance, and breakout zones.
3. Fewer fakeouts:
* Traders can filter out small false signals because smoothed bands only move when volatility actually changes.
4. Dynamic to volatility:
* EMA smoothing keeps the bands adaptive:
* In quiet periods, bands tighten.
* In volatile periods, bands expand.
* But it avoids extreme jitter caused by every micro-move.
Safe Zone Rules
1. Long entries (green zone):
* Price above VWAP (trend bullish).
* Price inside inner band ±1σ (not touching outer extremes).
* Optional: candle close confirmation (price fully above inner band).
2. Short entries (red zone):
* Price below VWAP (trend bearish).
* Price inside inner band ±1σ.
* Optional: candle close confirmation.
3. Outer bands (±2σ):
* Considered overextended zones → avoid entries to reduce fakeouts.
4. Visual cues:
* Safe zones shaded lightly green/red inside inner band.
* Outer bands remain unshaded (for context).
Here’s a cheat sheet for trading the Smoothed VWAP Bands + EMAs that shows safe entry zones and trend alignment clearly.
Smoothed VWAP Bands + EMAs Cheat Sheet
Price Action Relative to Bands & EMAs
+2σ (Outer Upper Band)
----------------
Extreme volatility zone
Avoid entries here
+1σ (Inner Upper Band)
----------------
Safe zone limit for longs
Consider profit taking here
VWAP Line (Green = Bullish, Red = Bearish)
==================
Core trend indicator
Only trade in VWAP trend direction
-1σ (Inner Lower Band)
----------------
Safe zone limit for shorts
Good for entries in trend direction
-2σ (Outer Lower Band)
----------------
Extreme volatility zone
Avoid entries here
1️⃣ Trend Direction with VWAP & EMAs
* VWAP → shows the overall session trend.
* Price above VWAP → bullish
* Price below VWAP → bearish
* EMA 5 (blue) → short-term momentum
* EMA 20 (orange) → medium-term trend
Rule: Only take trades in the direction of the trend:
* Long trades → price > VWAP and EMA 5 > EMA 20
* Short trades → price < VWAP and EMA 5 < EMA 20
This prevents chasing trades against the trend and reduces fakeouts.
2️⃣ Entry Zones Using Smoothed VWAP Bands
* Inner band (±1σ) → “safe entry zone”
* Outer band (±2σ) → volatility extremes → avoid entries here
Rule: Enter longs inside the inner band above VWAP and shorts inside the inner band below VWAP.
Best used on intraday timeframes.
15, 5, 2, 1 min charts.
