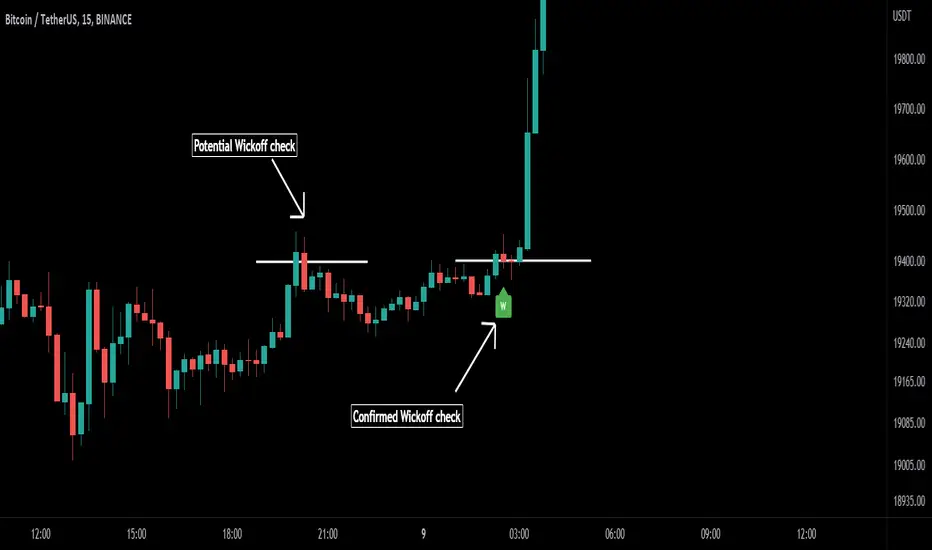
Wick-off Check Pattern [Misu]█ This Indicator shows a wick-off check pattern.
This pattern appears when a candle goes below a level (support or resistance) and closes above it OR when it goes above a level and finishes below it. This causes a wick to go through the level: a wick-off check .
This can confirm a pullback or a breakout.
█ Usages:
This indicator can be used to validate a resistance or support level.
It can also be used to validate breaking levels.
█ Parameters:
Deviation: Parameter used to calculate pivots.
Depth: Parameter used to calculate pivots.
Wickoff Mode: Mode used to detect Wickoff check pattern.
> counter pattern: only shows "pullback" wickoff check.
> breakout pattern: only shows "breakout moves" wickoff check.
> both: shows both.
Lenght Avg Body: Lenght used to calculate the average body size.
First Breakout Factor:
Lenght Avg Wick Validation: This factor multiplied by the "body avg" filters out the non-significant breakout.
Factor Avg Wick Validation: Lenght used to calculate the average wick size.
Max Bars Wickoff: This factor multiplied by the "wick avg", filters out the non-significant wickoff signals.
Priceaction
SBS AlgoHello traders, I am here again with a new and improved indicator.
This indicator is based on a pivot breakout algorithm which gives buy and sell signals according to the breakout of trendline. This is an advanced version of another script. It also takes price action into consideration along with some basic indicators like MACD and ADX to give good entry signals.
NOTE: This indicator is not designed to take entries completely based on signals it gives. Please use it along with your trading strategy to add more confluence to your trading system and maximize your profits.
I hope you guys will like this one too .Enjoy 👍
In case you find any bug, please do report in comment section .Thank you.

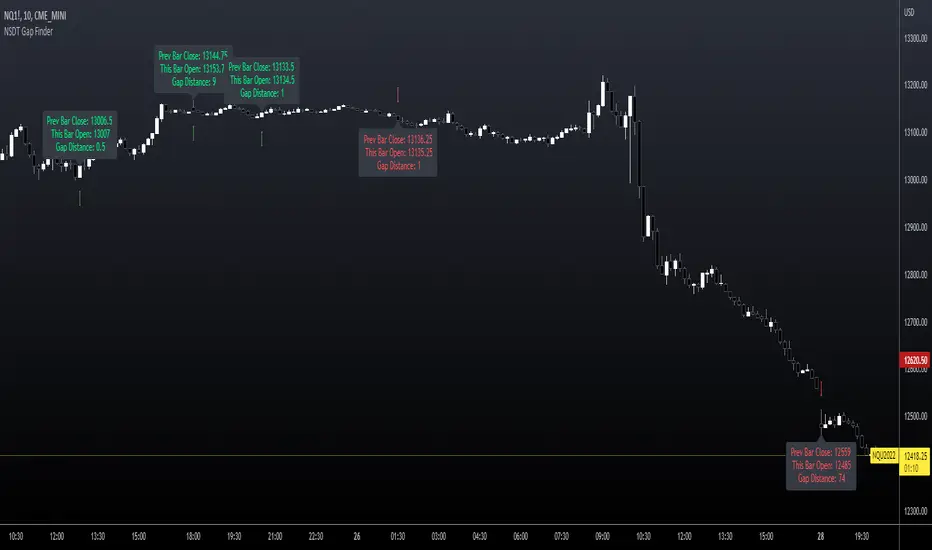
NSDT Gap FinderThis script plots gaps between candles.
It uses the "round_to_mintick" feature in the Pinescript code, so it works on any instrument out to 3 decimal places.
If there is a Gap Up (open of current candle is greater than the close of previous candle) it will plot a green arrow under the current candle and plot a label above the current candle to show the Gap Amount.
If there is a Gap Down (open of current candle is less than the close of previous candle) it will plot a red arrow over the current candle and plot a label below the current candle to show the Gap Amount.
You can turn the label and/or the arrow on and off.
I created this indicator to more easily identify gaps in the market. The probability of a gap being filled is extremely high. Some are right away (intraday candle to candle), some take a while (gap from previous day close to current day open), and some make take a long time (close at end of previous week to open at beginning of current week).
This is published free to use and open source code.
Please see my other similar Gap Indicators.
Daily Gap Range
USA Session - Previous Day Close Gap to Current Day Open
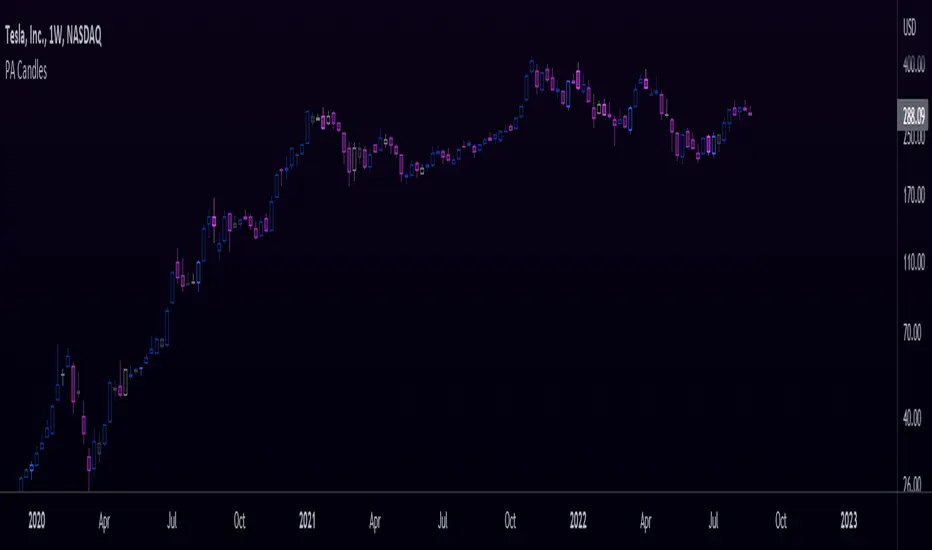
Price Action CandlesThis simple script provides a visual aid for price action traders by coloring outside & inside candles, which in effect leaves the trader with 6 possible candle colors:
-Regular bullish candle
-Outside bullish candle
-Inside bullish candle
-Regular bearish candle
-Outside bearish candle
-Inside bearish candle
These candlesticks may provide powerful signals when used in conjunction with key levels, market structure and chart patterns.
Make sure to disable the regular candlesticks (body, borders and wicks) in the symbol tab inside the configuration menu!
Hope it can help someone!
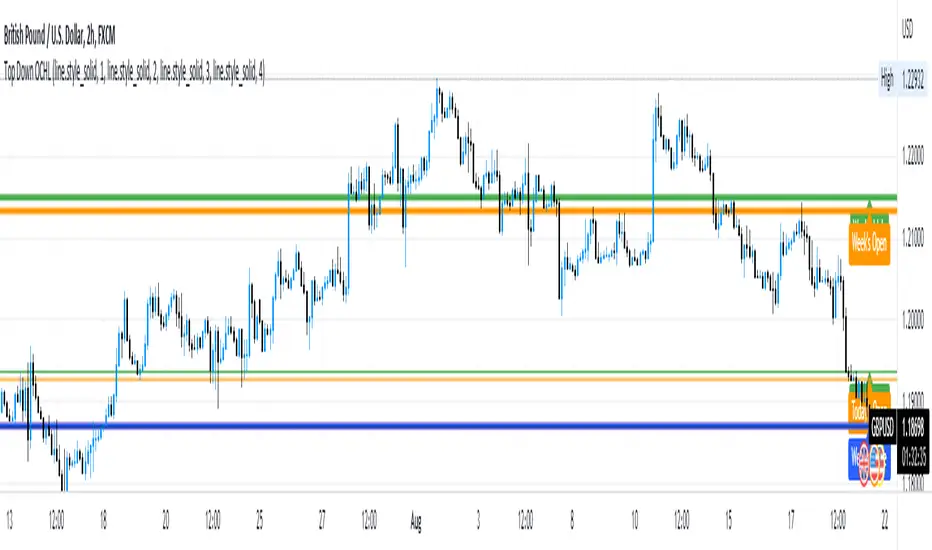
Opens, Closes, Highs and Lows.Hello Traders, the script below is designed to display the monthly, weekly, previous days' and current days' open, close, high and low.
I designed it to assist in top down analysis by knowing the monthly and weekly opens and closes it makes it a lot easier to make trading decisions on the lower timeframes.
As the user you can choose which price values you'd like displayed on the chart by selecting them in the user inputs.
Enjoy!!
Inside Bar SetupScript Details
- This script plots Inside Bar for given day in selected time-frame (applicable only for Timeframes < Day)
- Basis plotted inside bar, relevant targets are marked on the chart
- Targets can be customised from script settings. Example, if range of mother candle is 10 points, then T1 is 10 * x above/below mother candle and T2 is 10 * y above/below mother candle. This x & y are configured via script settings
How to use this script ?
- This script works well on 10-15 mins timeframe for stocks, 15/30 mins timeframe for nifty index and 30/60 mins time frame for bank nifty index
- If mother candle high is broken, take long trade with SL of mother candle low and if low is broken, take short trade with SL of mother candle high
Remember:
1. Above logic is to be combined with support/resistances i.e. price action. This script is an add-on to price action analysis giving you more conviction.
2. If range of mother candle is very high, it is recommended to avoid the trade.
3. Basis inside bar formed on higher time frame, take trade on basis of lower time frame i.e if inside bar is formed on 60 mins, take trade on the basis of 10-15 mins time frame
Example:
1. As seen in the chart, Nifty is near it's resistance and we are seeing Inside Bar being formed, In such scenario, even if High of Mother Candle is broken, we should be more interested to short as we are near resistance and probability of getting our targets in long side is less.
2. So, if I see breakdown of mother candle i.e. price going below low of mother candle, we will short with SL of high of mother candle.
3. As seen in the chart, both the targets are achieved.
Additional Info:
1. Targets on Long/Short Side can be configured via settings. For indices 1 times/1.5 times the range works well.
2. This script plots targets basis the first inside bar formed in the day for selected time frame.
3. Inside bars formed through out the day are coloured separately but lines are plotted only on the basis of 1st formed inside bar as this strategy works well for the first formed inside bar)
4. Don't forget to check volume in case of breakout/breakdown.
Note:
1. Mother Candle - First Candle of Inside Bar
2. Child Candle - Candle formed inside Mother Candle (Second Candle of Inside Bar)
Happy Trading :)

Fibonacci + Support/Resistant + Trendline (Price action)This is opening source code version: Fibonacci + Support/Resistant + Trendline (One of Advanced Price action Analysis).
How it works:
It find entry Long/Short by combining: Fibonacci + Support/Resistant + Trendline
1. Find Impulse wave:
To findind Impulse wave, It uses Pivot High/Low to find Impulse wave. In case find entry Long, If having Pivot High higher Pivot High before, it will draw an Impulse wave.
2. Find entry at Fibonacci levels:
Draw Fibonacci fibonacci retracement from Pivot Low to Pivot High. A Fibonacci retracement forecast is created by taking two extreme points on a chart and dividing the vertical distance by important Fibonacci ratios. 0% is considered to be the start of the retracement, while 100% is a complete reversal to the original price before the move. Horizontal lines are drawn in the chart for these price levels to provide support and resistance levels. Common levels are 23.6%, 38.2%, 50%, and 61.8%
3. Find entry at Support/Resistant Zone:
Support/Resistant Zone drawed from Pivot High before, which price just breaken and return to retest.
4. Find entry at Trendline:
Trendline drawed from Pivot High/Low before, which price just breaken and return to retest.
How do use it:
+ You can customize the thickness of the lines.
+ You can set up an alert when the price touchs important areas.

Impactful pattern and candles pattern AlertThe Alertion indicator!
impactful pattern:
pattern that happen near the zone or in the zone at lower timeframe and give us entry and stop limit price.
It is helpful for price action traders and those who want to decrease their risk.
There are 3 IP patterns:
Quasimodo
Head and shoulder
whipsaw engulfing
These patterns may occur near the zone or may not occur but by them, you can decrease your trading risk for example you can
trade with half lot before IP pattern and enter with other half after pattern.
how to use?
for example:
you find zone at 1h timeframe for short position
when price enter to your zone
you run this indicator and choose your lower timeframe, for example 15m and click on short position.
Then make the alert by right-click on your chart and choose the add alert and at condition box choose the impactful pattern and then click on create
now wait for message :)
Candles pattern:
like reversal bar, key reversal bar, exhaustion bar, pin bar, two-bar reversal, tree-bar reversal, inside bar, outside bar
these occur when the trend turn, so it is usable when the price enter to your zone or near your zone.
This pattern can decrease your risk.
Inside bar and outside bar:
if this pattern engulf up, it is bullish pattern and if engulf down, it is bearish pattern.
what does this indicator do?
this indicator is for making alert
it helps you to decrease your risk and failure.
You optimize it to alert you when IP pattern happen or candle pattern happen or inside bar or outside bar engulfing or all of them.
For IP pattern, it will message you entry and stop limit price.
It works at 2 different timeframes, so you can make alert for example in 1h TF for candles pattern and 15m TF for IP pattern.
Indicator will alert you for candles pattern at your chart timeframe and for IP pattern at timeframe you've chosen when you run the indicator, and it is changeable
in setting.
setting options
TIMEFRAME
IP: select the timeframe for IP patterns it means when IP pattern happen at that timeframe the indicator will alert you
example = your TF is 1h, you found the supply zone and want to trade, note that IP pattern happen in lower TF, so you select 15m TF or TF lower than 1h.
Short position: select it if you want to make short position.
BUFFERING
indicator send you entry and stop limit price
you can change it by amount of percent
it is your strategy to change your entry and stop loss or not
example= in head and shoulder pattern at short position, the stop limit is high price of head in pattern
so the indicator will message you the exact price but if you want to put
your stop limit 5 percent upper than exact price you can enter 5 in front of stop loss
or you want to enter 5 percent lower than exact high price of shoulder, you can optimize it.
ALERTION
you choose what alert you want
IP alert or candle alert or inside and outside bar alert
type your text for alert
you can write additional text for your message
ADVANCE
IP alert frequency option:
1. Once per bar : indicator will alert you for IP pattern once at your chat timeframe bar, and you should wait til next bar for next alert.
2. Once per bar close : alert you when your chart timeframe bar closed and next alert will happen when next bar is closed.
3. All: alert you all the times IP pattern happen
pivot left and right bars: lower will find smaller pattern
at the END:
this indicator is not strategy
it is part of your strategy that help you to increase your winning rate.
It is helpful for scalping and candle patterns finding.
After you make an alert, you can delete the indicator or change your timeframe or make another alert, your previous alert won’t change.
Thank you all.

PT OrderBlockVersion 1.0 of the PT OrderBlock indicator was developed to visually identify supply & demand zones within price. This indicator can be used on all timeframes. My preferred method is swing trading the higher timeframe.
Orderblocks are formed when there is a break in structure once a big buy/sell candle has formed. These "blocks" will eventually get revisited on a retest acting as major support/resistance. An orderblock for a demand zone is populated on the chart when there is a bearish candle before a swift move to the top side (opposite direction). The same goes for the orderblock that is formed for a supply zone, it is the last bullish candle before a swift move to the downside. Once you see such behavior, the indicator will populate the orderblock for you. When an orderblock gets mitigated (tapped into) the indicator will change colors of the block to allow you to distinguish between a fresh and already taped supply/demand zone. It has been proven effective to enter entries based on retests of the orderblocks which take place AFTER a break in market structure.
*PT OB Features:
-OBs that have been partially filled will remove a portion of the background zone to indicate how much of the orderblock is left to fill in the full zone (Toggle Highlight remaining OB).
-OB trigger can be switched between candle open & wick. I prefer wick because it increases the probability of catching a low/high.
Video with strategy will be uploaded shortly! It is included as part of the library. Just message us for access!

Average Price LineThis was published in substitute of the original AVG price line that was already implemented into TradingVIew.
Get the average price in the desired range you want.

Extreme Bars"Extreme Bars" is a simple but useful indicator that marks overbought and oversold candles. This indicator paints candles that fall far above the average red, and the candles that rise above the average green. Of course, they can change these colors if they want. "Extreme Bars" can be interpreted in many different ways. The starting points of colored candles can often be good support or resistance. In addition, it would be wise to close the positions opposite the colored candles and to maintain the positions compatible with the colored candles. It is also possible that the gaps formed by the colored candles will be closed in the future. The sensitivity of the indicator can be changed in the settings section.

JPY PPLPsychological Price Levels for JPY Pairs (Price Action Institutional Levels 1, 0.200, 0.500, 0.800, 1)
Applicable for forex Yen Pairs.
Levels are configurable for color, style.
Comments, Suggestions and Feedback are appreciated.

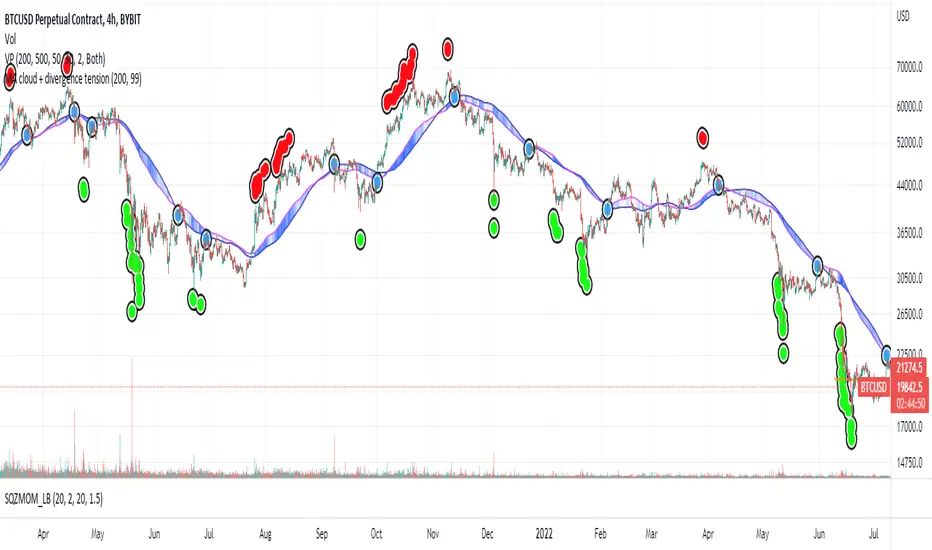
MA cloud + divergence tensionI noticed how well BTC often bounces off the 200 Moving Averages on the 4HR so started investigating ways of visualising the ongoing relationship between price and MAs.
Firstly, this draws a cloud which is made up of the SMA and the EMA, and it colours the cloud based on how far the price is diverging from the middle of the cloud. If the price is the most extreme distance out of the set (by default, the past 200) the cloud will be coloured dark blue. If it's the closest, it will be transparent.
I then looked at plotting these extremes. If the price passes the sensitivity threshold (default 99 - I will look at adding more sensitivity in the future), and by that I mean the price is more divergent than that percentage of other prices inspected in the range, it plots a circle - green if it's oversold, red if it's overbought.
These signal maximum tension between the price and the moving averages. Though when I say maximum, I'm only referring to the historic range! As you can see, often price diverges even further and so more signals are placed. But usually, this tension is resolved, either by the MA cloud moving towards the price or the price moving towards the cloud. With confluence from other indicators, these could be good points to start taking dollar cost averaging, or start taking profits.
Once that tension is released, and the price and cloud converge closely again, we get a blue "relief signal", which could signal that the price action is about to rebound again.
Please be careful with this, it's only for fun. Not investment advice!
If you have any suggestions, comments, criticism, I'd love to hear them,
Thanks
Smart Money ConceptSmart Money Concept is being used to understand the Market Structure, Demand/Supply, and Risk Management.
- Lines represent BoS and CHoCH.
- X-cross and Diamond shapes represent Peak and Trough.
- Numbers represent the Spread Percentages.

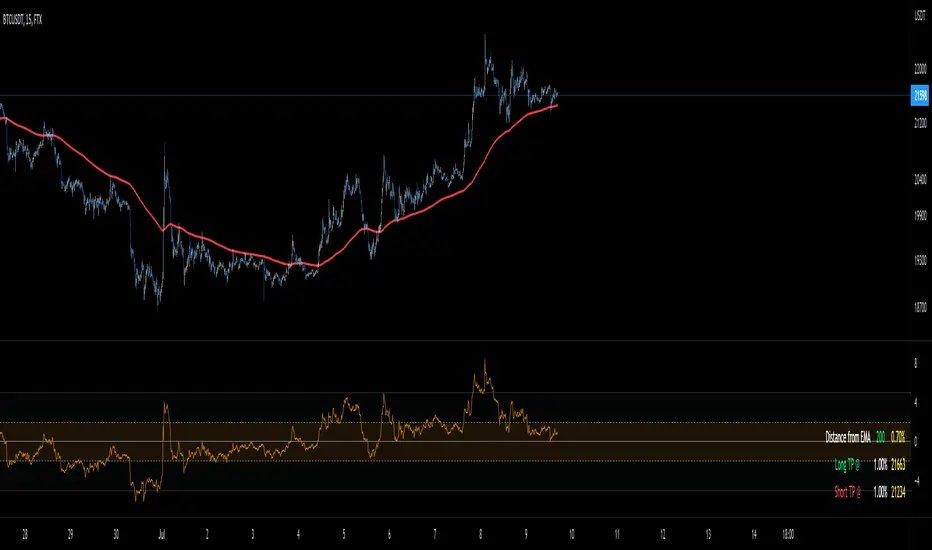
Distance From EMA (%) with TP TableThe indicator will help you to identify where an asset might change direction or where to take profit.
For scalping or day trading is very useful to know where to take profits.
When the price is too far from an EMA a reversal is very likely to occur.
You can set up your own EMA and the percentage where you want to take profits
Magnifying Glass (LTF Candles) by SiddWolf█ OVERVIEW
This indicator displays The Lower TimeFrame Candles in current chart, Like Zooming in on the Candle to see it's Lower TimeFrame Structure. It plots intrabar OHLC data inside a Label along with the volume structure of LTF candle in an eloquent format.
█ QUICK GUIDE
Just apply it to the chart, Hover the mouse on the Label and ta-da you have a Lower Timeframe OHLC candles on your screen. Move the indicator to the top and shrink it all the way up, because all the useful data is inside the label.
Inside the label: The OHLC ltf candles are pretty straightforward. Volume strength of ltf candles is shown at bottom and Volume Profile on the left. Read the Details below for more information.
In the settings, you will find the option to change the UI and can play around with Lower TimeFrame Settings.
█ DETAILS
First of all, I would like to thank the @TradingView team for providing the function to get access to the lower timeframe data. It is because of them that this magical indicator came into existence.
Magnifying Glass indicator displays a Candle's Lower TimeFrame data in Higher timeframe chart. It displays the LTF candles inside a label. It also shows the Volume structure of the lower timeframe candles. Range percentage shown at the bottom is the percentage change between high and low of the current timeframe candle. LTF candle's timeframe is also shown at the bottom on the label.
This indicator is gonna be most useful to the price action traders, which is like every profitable trader.
How this indicator works:
I didn't find any better way to display ltf candles other than labels. Labels are not build for such a complex behaviour, it's a workaround to display this important information.
It gets the lower timeframe information of the candle and uses emojis to display information. The area that is shown, is the range of the current timeframe candle. Range is a difference between high and low of the candle. Range percentage is also shown at the bottom in the label.
I've divided the range area into 20 parts because there are limitation to display data in the labels. Then the code checks out, in what area does the ltf candle body or wick lies, then displays the information using emojis.
The code uses matrix elements for each block and relies heavily on string manipulation. But what I've found most difficult, is managing to fit everything correctly and beautifully so that the view doesn't break.
Volume Structure:
Strength of the Lower TimeFrame Candles is shown at the bottom inside the label. The Higher Volume is shown with the dark shade color and Lower Volume is shown with the light shade. The volume of candles are also ranked, with 1 being the highest volume, so you can see which candle have the maximum to minimum volume. This is pretty important to make a price action analysis of the lower timeframe candles.
Inside the label on the left side you will see the volume profile. As the volume on the bottom shows the strength of each ltf candles, Volume profile on the left shows strength in a particular zone. The Darker the color, the higher the volume in the zone. The Highest volume on the left represents Point of Control (Volume Profile POC) of the candle.
Lower TimeFrame Settings:
There is a limitation for the lowest timeframe you can show for a chart, because there is only so much data you can fit inside a label. A label can show upto 20 blocks of emojis (candle blocks) per row. Magnifying Glass utilizes this behaviour of labels. 16 blocks are used to display ltf candles, 1 for volume profile and two for Open and Close Highlighter.
So for any chart timeframe, ltf candles can be 16th part of htf candle. So 4 hours chart can show as low as 15 minutes of ltf data. I didn't provide the open settings for changing the lower timeframe, as it would give errors in a lot of ways. You can change the timeframe for each chart time from the settings provided.
Limitations:
Like I mentioned earlier, this indicator is a workaround to display ltf candles inside a label. This indicator does not work well on smaller screens. So if you are not able to see the label, zoom out on your browser a bit. Move the indicator to either top or bottom of all indicators and shrink it's space because all details are inside the label.
█ How I use MAGNIFYING GLASS:
This indicator provides you an edge, on top of your existing trading strategy. How you use Magnifying Glass is entirely dependent on your strategy.
I use this indicator to get a broad picture, before getting into a trade. For example I see a Doji or Engulfing or any other famous candlestick pattern on important levels, I hover the mouse on Magnifying Glass, to look for the price action the ltf candles have been through, to make that pattern. I also use it with my "Wick Pressure" indicator, to check price action at wick zones. Whenever I see price touching important supply and demand zones, I check last few candles to read chart like a beautiful price action story.
Also volume is pretty important too. This is what makes Magnifying Glass even better than actual lower timeframe candles. The increasing volume along with up/down trend price shows upward/downward momentum. The sudden burst (peak) in the volume suggests volume climax.
Volume profile on the left can be interpreted as the strength/weakness zones inside a candle. The low volume in a price zone suggests weakness and High volume suggests strength. The Highest volume on the left act as POC for that candle.
Before making any trade, I read the structure of last three or four candles to get the complete price action picture.
█ Conclusion
Magnifying Glass is a well crafted indicator that can be used to track lower timeframe price action. This indicator gives you an edge with the Multi Timeframe Analysis, which I believe is the most important aspect of profitable trading.
~ @SiddWolf

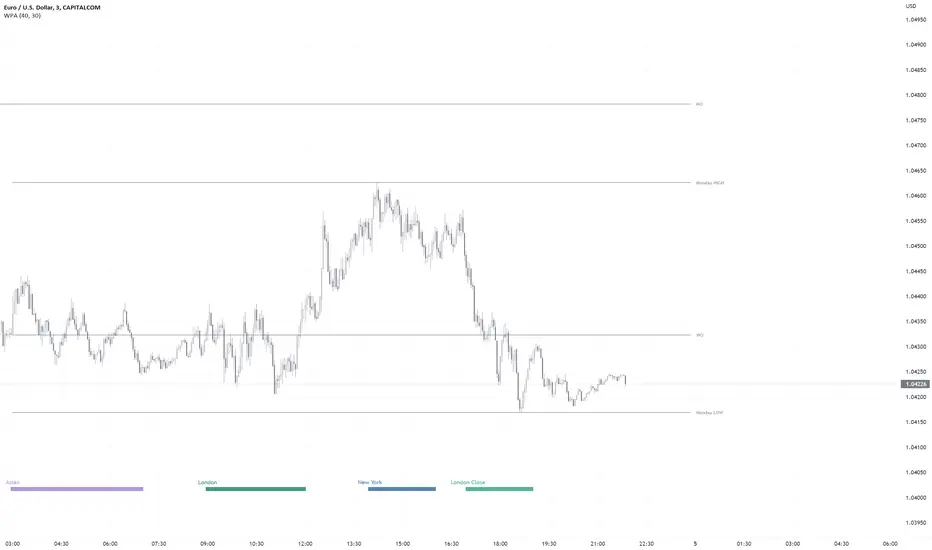
WPA OpeningsFeatures
- Displays the now and previous days, weeks, months, years (opens&highs&lows&eq)levels, Monday Range (high&low&eq), ATH Level.
PA Levels on every timeframe(It's like PYO in 1minutes chart)
Settings:
Hide and show separately.
Change color.
Line extension.
- Displays London/NY/Asian Killzones very simplified way ***w/Unique Concept.
Killzones only on timeframes lower than 30minutes (you can modify this in the settings as you wish).
It's not depended on your tradingview accounts time settings, so the killzones always stay at the right place in the chart.
The times of each killzone come from the education material of ICT.
Closed during weekends.
Settings:
Hide and show separately.
Change color separately.
- Only (All-In-One)Price Action indicator you need.
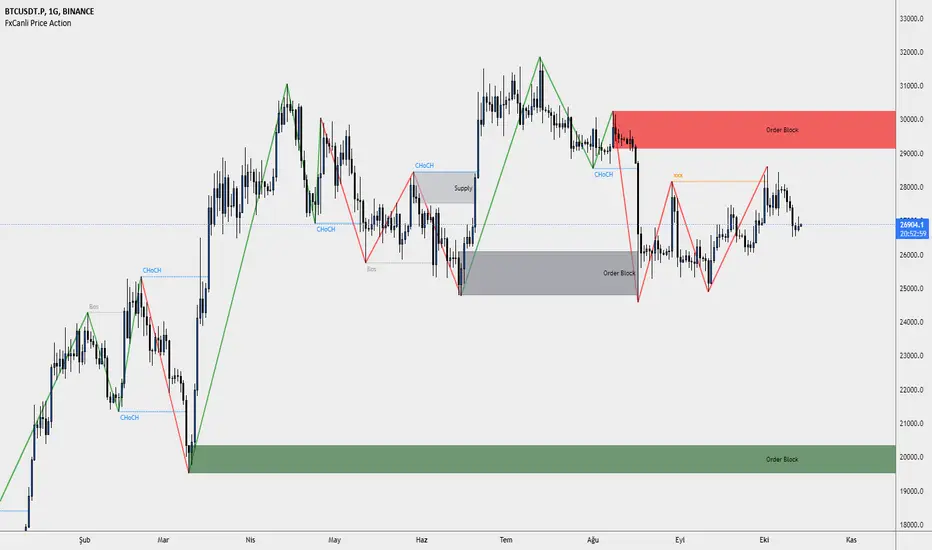
FxCanli Price ActionEN - FxCanli TradingView Price Action indicator can draw and alert at;
Break of Structure (BOS),
Change of Character (CHoCH),
Liquidity,
Order Block,
Power Zone.
TR - FxCanli TradingView Price Action indikatörü grafiklerinizde;
Break of Structure (BOS)
Change of Characte (CHoCH)
Liquidity
Order Block
Power Zone seviyelerini otomatik olarak çizer ve alarm verir.
FEATURES & EXAMPLES / ÖZELLİKLER & ÖRNEKLER
**************************************************************
Market Structure;
EN - You can easly follow market structure, Up Trend with green waves, Down trend with Red waves
TR - Market yapısını kolayca takip edebilirsiniz. Yukarı trendi yeşil dalgalar ile, Aşağı trendi kırmızı dalgalar ile.
Change of Character (CHoCH)
*************************************
EN - Shows trend reversals
TR - Trend dönüşümlerini gösterir
Break of Structure (BOS)
******************************
EN - Shows trend continuations
TR - Devam eden trendleri gösterir
Liquidity
***********
EN - Shows Liquidity levels
TR - Likidite seviyelerini gösterir
Order Block
***************
EN - Shows Order Block levels which is a technical analysis technique that tracks the accumulation of orders (when bullish) and distribution of orders (when bearish) of banks and institutional traders.
TR - Bankaların ve kurumsalların emir birikimini (yükseliş olduğunda) ve emir dağılımını (düşüş olduğunda) Order Block olarak gösterir.
Bobbin DetectorENGLISH
BOBBINS (cluster)
BOBBINs can also be called clusters. In the region where the price sees an up and down
similar to side-by-side BOBBINs formed by clustering. The decision is the region.
In the BOBBIN formation, the bars are not taken into account much at first. with BOBBINs
When using other formations, attention should be paid to the needles.
through
Sellers dominate from above, price falls; price with more buyers below
comes out again. Until either side gives up or one side of a buy or sell order
This go-and-go movement continues until it ends. When finished, the BOBBIN dissolves and destroys
The movement towards the shadow continues.
Often the BOBBINs are voluminous untied. A strong candle with momentum
bar is formed. This is where Supdems, that is, supply-demand drawings come into play.
TÜRKÇE
BOBİNLER
Bobinlere küme de denilebilir. Fiyatın bir yukarı bir aşağı doğru giderek aynı bölgede
kümelenmesiyle oluşur, yan yana dizilmiş bobinlere benzer. Karar bölgesidir.
Bobin oluşumunda barların iğneleri ilk başta çok dikkate alınmaz. Bobinler ile birlikte
başka formasyonlar kullanılırken iğnelere dikkat edilir.
Yukarıdan satıcılar baskın çıkar, fiyat düşer; aşağıda alıcıların fazla olmasıyla fiyat
tekrar çıkar. İki taraftan biri pes edinceye kadar ya da alış ya da satış emirlerinin bir tarafı
bitinceye kadar bu git-gel hareketi devam eder. Bittiği zaman bobin çözülür ve yok ettiği
gölgeye doğru hareket devam eder.
Çoğu zaman bobinler hacimli bir şekilde çözülür. Momentumlu, kuvvetli bir mum
çubuk oluşur. İşte burada da Supdem’ler yani arz-talep çizimleri devreye girer.
kaynak:
Price Action TR

HorseShoe - At NalıHorseShoe - At Nalı
English
HORSEHOE FORMATION
It is actually a kind of bobbin. As with the bobbin, the needles of the candles are not taken into account much.The difference is that there are only four candlesticks in this formation. There is no limit to this in the bobbin.In addition, it is important which of the bars forming the bobbin is longer or shorter than which.is not. This is very important in a horseshoe. There is a rule for the length and shortness of the bars.Candlesticks in a horseshoe showing the bearish sequentially rising, falling, rising and repeatingin the form of falling bars. Also the lengths of the first and fourth bars, i.e. price opening andThe differences between the closing must be longer than the second and third bar. So those on the sideshould be clearly larger than the middle ones. For the rise, the bars are falling-rising-falling in order.The rising candle should be in the form of a bar. Likewise the first and last barsshould be longer than the middle ones.Of the first and fourth bars, it is better if the fourth bar is longer than the first.was the signal. But the fact that they are equal or the first one is long does not mean this formation. Attentionthe first and last bars that need to be beat are clearly longer than the middle onesrequired. A millimeter long means a very weak signal.
It is valid for every price and parity. But this is not a magic wand, so every horseshoemay not be the correct signal. Trend, Supdem, Correlation and other similar components are alsois involved, a highly efficient signal is formed. Well reviewed onexperience must be gained. More like an indicator to show the direction of the price rather than a signalshould be used.
Turkish
AT NALI FORMASYONU
Aslında bir tür bobindir. Bobinde olduğu gibi mumların iğneleri çok dikkate alınmaz. Farkı, bu oluşumda sadece dört mum çubuk vardır. Bobinde bunun sınırı yoktur. Ayrıca bobini oluşturan barların hangisinin hangisinden uzun ya da kısa olduğu önemli değildir. At nalında bu çok önemlidir. Barların uzunluğu kısalığı ve sırasında bir kural vardır. Düşüşü gösteren at nalında mum çubuklar sırayla yükselen düşen yükselen ve tekrar düşen barlar şeklindedir. Ayrıca birinci ve dördüncü barların uzunlukları, yani fiyat açılış ve kapanışı arasındaki farkları, ikinci ve üçüncü bardan daha uzun olmalıdır. Yani kenardakiler ortadakilerden net bir şekilde büyük olmalı. Yükseliş için ise barlar sırayla düşen-yükselen düşen-yükselen mum çubuk şeklinde olmalıdır. Aynı şekilde ilk ve son barlar ortadakilerden uzun olmalıdır. Birinci ve dördüncü barlardan dördüncü barın birinciden uzun olması daha güze bir sinyaldi. Fakat eşit olmaları ya da birincinin uzun olması da bu oluşumu bozmaz. Dikkat edilmesi gereken ilk ve son barların açık bir şekilde ortadakilerden uzun olması gerekmektedir. Milim farkla uzun olması çok zayıf bir sinyal olması anlamına gelir.
kaynak:
Price Action TR

COSMO TREND👉 What is this indicator ?
This indicator is made up with the help of Multiple SuperTrend and Price Action , In this awesome indicator, The buy and sell entry is taken by comparing the trend using our secret logic.
👉 What is special about this indicator ?
More than Ten Takeprofit price points can be seen in this indicator , The Stoploss price point can be seen as well . You can simply adjust take profit percentage and stop loss percentage in indicator settings
👉 What kind of Take Profit signal is there on this indicator ?
Ten types of take profit signals are displayed on this indicator, each marked as TP1,TP2,TP3,TP4,TP5,TP6,TP7,TP8,TP9 and TP10 respectively. The take profit signals available for both buy and sell entries. The take profit of the buy entry is shown in Green Color and the take profit of the sell entry is shown in Red Color.
👉 What kind of Exit signal is there on this indicator ?
Exit signals can be seen at the end of the trend
👉 How many alarms does this indicator have ?
This indicator has 13 types of alarm for Buy , Sell , Take Profit and Exit signal, and it is best to set the alarm by selecting the Alert Once Bar Close option to avoid repaint.
👉 On which coins can this indicator be used ?
This indicator is best used on all cryptocurrencies, forex markets and stocks , This indicator is very helpful to get high returns on all cryptocurrencies with low price and high voltality
Note : This indicator only works well in all time frames ( 1s,5s,10s,1m,5m,1h etc...) , Use appropriate values when using other coins. If you have difficulty finding the value, you can contact us.
Default Setup Instructions 👇
Time Frame : 1 Minute
Default Coin : C98USDT
The following settings can be found in this indicator
You can simply adjust take profit percentage and stoploss percentage in indicator settings
Orgin Factor : This is the ATR Factor Value for High Time Frame trend. You can change this value according to the volatility , the ATR Factor value is also used to reduce the chance of a fake signal
Mid Factor : This is the ATR Factor Value for Low Time Frame trend. You can change this value according to the volatility , the ATR Factor value is also used to reduce the chance of a fake signal
Low Factor : This is the ATR Factor Value for Second Low Time Frame trend.
Take Profit - TP1 Percentage : Give What percentage for take First TP
Take Profit - TP2 Percentage : Give What percentage for take Second TP
Take Profit - TP3 Percentage : Give What percentage for take Third TP
Take Profit - TP4 Percentage : Give What percentage for take Fourth TP
Take Profit - TP4 Percentage : Give What percentage for take Fifth TP
Take Profit - TP4 Percentage : Give What percentage for take Sixth TP
Take Profit - TP4 Percentage : Give What percentage for take Seventh TP
Take Profit - TP4 Percentage : Give What percentage for take Eighth TP
Take Profit - TP4 Percentage : Give What percentage for take Nineth TP
Take Profit - TP4 Percentage : Give What percentage for take Tenth TP

PT FVG ImbalancesVersion 1.0 of the PT FVG Gaps & Flat Opens was developed to visually identify any imbalances in price. This indicator can be used on all timeframes.
Fair Value Gaps are a key component when trading price action. They are derived from zones in liquidity where price moved quickly in a certain direction leaving gaps behind. These areas tend to act as magnets to price throughout the trading session of that timeframe.
PT FVG Features:
-Gaps that have been partially filled will shade darker to show price has already attempted to fill that gap before (Toggle Highlight Gap Fill).
-Gaps that have been partially filled will remove a portion of the background zone to indicate how much gap is left to fill in the full zone (Toggle Highlight Remaining Gap).
Flat Open Candles are derived from candles that open without a wick (wickless candles). Price more often than not tends to gravitate towards these areas in the near future to fill the wickless candle before continuing on with the trend. Can be used on all timeframes, but the higher the timeframe holds more weight.
PT Flat Open Features:
-Flat open sensitivity would recommend keeping it around 30-50. If scalping keep it sub 30. This feature determines how many flat opens you want on your chat at one time.
-Delete flat open line allows us to delete the line once price has filled the wickless candle.
Video with strategy will be uploaded shortly! It is included as part of the library. Just message us for access!

Intraday Candle Finder (Works on all Markets!!!) Todays scripts is for the INTRADAY Traders who would use a timeframe setup like (3m,5m,10,15m)
This script is a candle filter for Pulllbacks, Rally Candle, Hammers.
Ive added a new condition = RSI Overbought for the Rally Candle and Oversold for the Pullback to eliminate weak candles.
Also there is a ema filter if you want to only use the pullbacks above '50ema' etc...
Rules
1) Price action must be in place before we look for the signals
2) Trade in high probably areas such as Demand and Supply zones /// Support and Resistance zones
3) Dont trade Pullbacks when sentiment is Bearish
4) Dont trade Rallys when sentiment is Bullish
Pullback candle on INTRADAY TIMEFRAME
This was taken from ADA/USDT 31/05/2022 (Recent)
10M chart
Forex Example
Rally Candle on INTRADAY TIMEFRAME
This was taken from AXS/USDT 31/05/2022 (Recent)
Forex Example
How to trade this candles.
Stop loss = ATR *1 minimum
Take Profit = RR of either 4/5 when the market is trending // When the market is ranging - look to key levels for take profit
Im open to ideas to improve this script for the INTRADAY Traders as I'm more of a Swing Trader
If you enjoy this script please leave a like and comment as your support is much appreciated.
