Base Candle NewBase / Imbalance Candle
It automatically highlights the candle color to yellow (default) where there is imbalance between buyers and sellers or in other words, a base or fight between buyers and sellers. When you identify this base candle, you can mark the demand and supply zones easily.
Priceaction
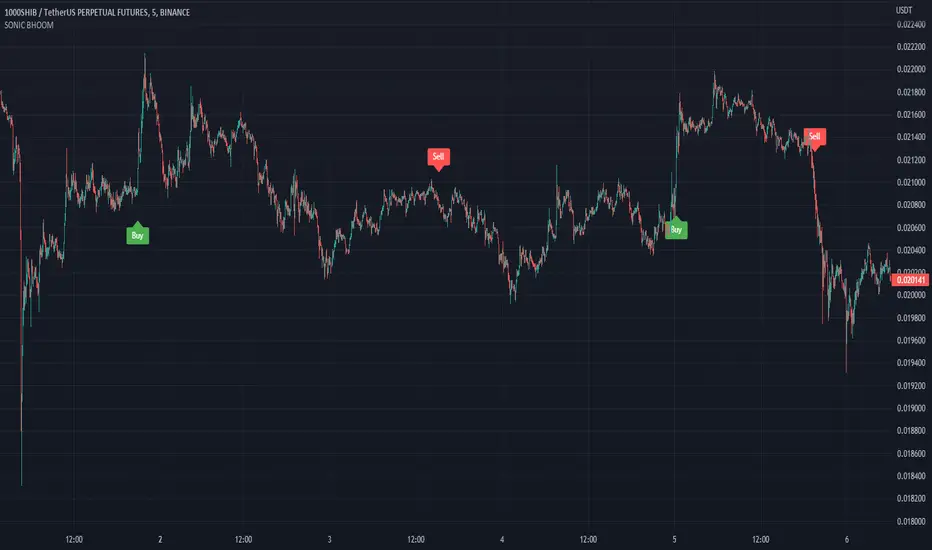
SONIC BHOOM👉 What is this indicator ?
This indicator is made up of Trend and Moving Average, The idea used in this indicator is to understand the current trend and take buy sell entry based on moving average
👉 How many alarms does this indicator have ?
This indicator has two types of alarm for buy signal and sell signal, and it is best to set the alarm by selecting the Alert Once Bar Close option to avoid repaint.
👉 On which coins can this indicator be used ?
This indicator is best used on all cryptocurrencies and forex markets, You can use this indicator with any Time Frame, and this indicator is set to the 1000SHIBUSDT Coin, 5min Time Frame by default. Use appropriate values when using other coins. If you have any difficulty in finding the Value, you can contact us.
Default Setup Instructions 👇
Duration: 5 Minute
Default Coin : 1000SHIBUSDT
The following settings can be found in this indicator
Trend Length :This is an average True change value, Average True Range (ATR) is the average of True ranges over the specified period. ATR measures volatility, taking into account any gaps in the price movement.
Trend High : This is the ATR Factor Value. You can change this value according to the volatility, the ATR Factor value is also used to reduce the chance of a fake signal
Threshold :
The Threshold is the difference between price and moving average. Changing the value of this option will change the accuracy of the trading signal
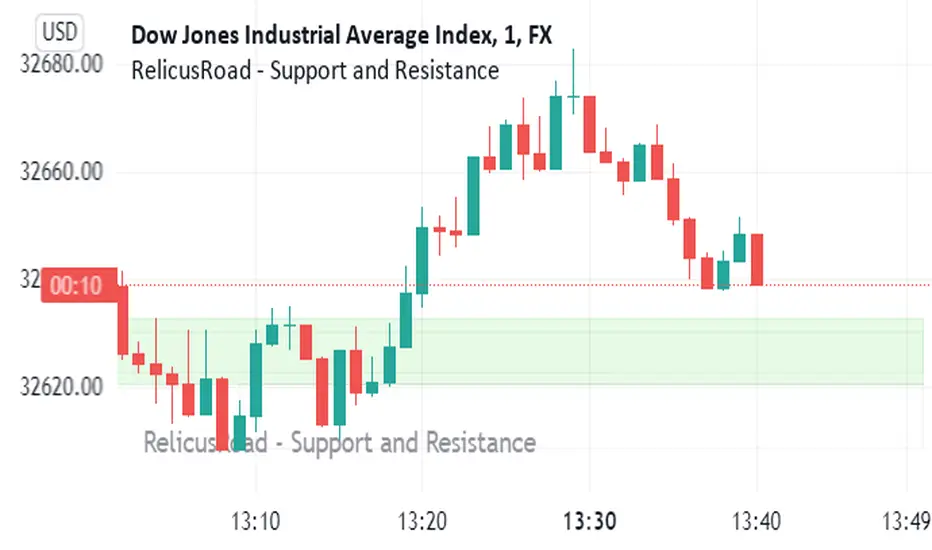
RelicusRoad - Support and ResistanceWe bring you dynamically created fundamental support and resistance analysis required for any instrument a trader trades.
Support & Resistance Concept
The concepts of trading level support and resistance are undoubtedly two of the most highly discussed attributes of technical analysis . As part of analyzing chart patterns, these terms are used by traders to refer to price levels on charts that tend to act as barriers, preventing the price of an asset from getting pushed in a certain direction.
At first, the explanation and idea behind identifying these levels seem easy, but as you'll find out, support and resistance can come in various forms, and the concept is more difficult to master than it first appears, this is where RelicusRoad - Support and Resistance comes in and draws them for you.
Technical analysts use support and resistance levels to identify price points on a chart where the probabilities favor a pause or reversal of a prevailing trend.
Support occurs where a downtrend is expected to pause due to a concentration of demand.
Resistance occurs where an uptrend is expected to pause temporarily, due to a concentration of supply.
Market psychology plays a major role as traders and investors remember the past and react to changing conditions to anticipate future market movement.
Support and resistance areas can be identified on charts using trendlines and moving averages.
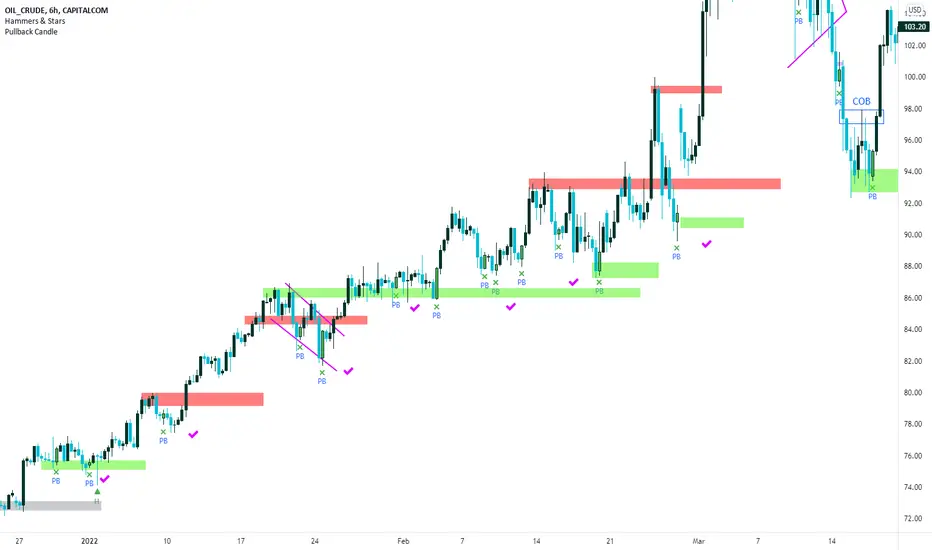
Pullback Candles (Candlestick Analysis) Guaranteed Winners!!!!Pullback Candle will signal when price is at the end of a pullback and entering a balance phase in the market (works on all markets)
Also we can expect a Pullback Candle during flash crashes as the theory of this script is when there is a turning point in momentum - this candle will appear and we can look long from this signal.
This candle will only work in Swing Low areas and appear when below an moving average which can be changed in the settings.
This candle will work on all timeframes - HTF provided very good rexpectancy whereas the LTF has a slightly less expectancy.
This candle can be alerted to signal the Pullback Candle when the bar is confirmed and not during.
The way i trade this candle is
1) Candle signal must be in probably area to increase efficiency.
2) Enter on the second candle after candle IS CONFIRMED
3) Set stop loss below Pullback Candle or use ATR value
4) Trade with the trend ie only bullish price action
5) This candle can catch falling knifes - we had one on LUNA before the rally to $7.50
6) Trading with a confluence along with the Pullback is better than solely trading this candle
Please leave a comment.
If we get to 100 likes i will publish the script.
Have a good weekend :)
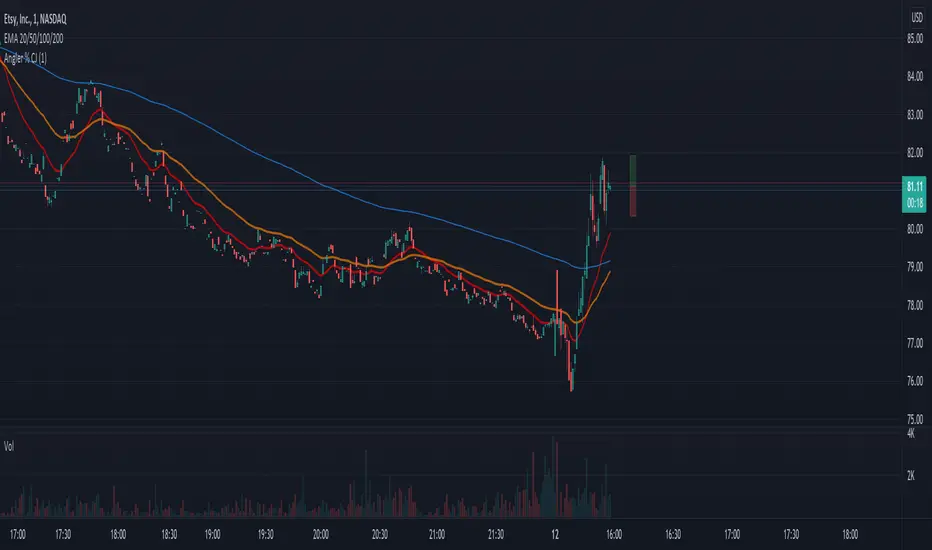
Front Angler Percent CJA nice little gadget.
Can be used to visually hint on volatility.
Will show a leading vertical bar which shows percentage of price, both up and down, in relation to current price.
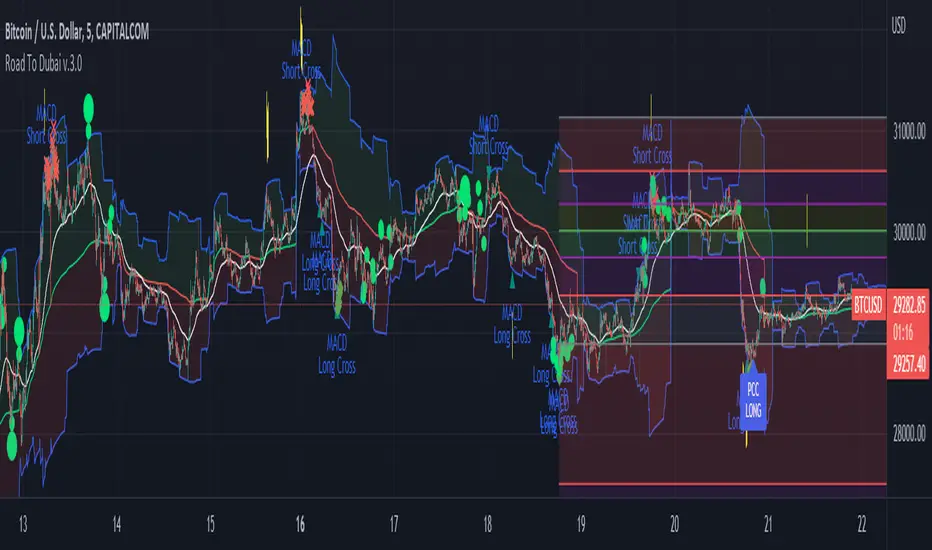
Road To Dubai v.2.99.4ROAD TO DUBAI 2.99.4
Usueful for daily trading over all type of asset, from Stock to Crypto, Forex and Commodities. It works best with 5min to 1hr graphs, if you are a intraday trader.
This is not a simple mashup of indicators, because you can add them as your own.
This script is more like a tool to understand price action based on indicators position. Thanks to cross call based on MACD, RSI with EMA applied and few index realtime mapping, this tool will let you reduce time effort for graph analysis.
As extra feature it will let you to try different strategies all fully customizable.
I've tried my best to keep it readble, and easy to use.
STANDARD FEATURES
VWAP : Green/Red line. It will reset everyday at 00.00.
EMA80 : White Line
BLUELINES : Positive and negative overextend value from VWap. This is based on a range of bar and it will extend on the opposite side the lower or higher candle. Useful for understading where price can arrive, expecially if a spike will appear.
Those indicators are quite useful for understading trends, price positions and maximum price range.
RSI EMA10 OVERBOUGHT / OVERSOLD
Yellow arrow marks where RSI arrived at his Top or Bottom. If on different timeframes (5min, 30min and 60min) something similar happen area is filled with Red or Green.
This is base on EMA10 applied to RSI (I usually refer at it as Yellow Line on my indicator HighFreq Trader)
To find good values please try High Freq Trader 1.3
RSI EMA80 CALL
Red Cross or Green Square advice for a really potential inversion of trend. When a Silver bar appear, this means the same call was triggered on different Timeframe in the sametime.
This is based on EMA80 applied to RSI (I usually refer at it as Blue Line on my indicator HighFreq Trader).
To find good values please try High Freq Trader 1.3
MACD CALL
Based on MACD with standard settings. When triggered, a lime Triangle appears. Differents size based on timeframe (5min smaller, 60min bigger). If the same call is triggered on the same place a Lime Bar appear on the opposite side of trend (this is a graphical contents, bacause with all enabled, standard use, can be difficult to read signals).
In Menu Settings you will be able to set your best parameter for your asset.
MACD FIBONACCI EXTRA FEATURE
If you want you can enable a Fibonacci draw based on MACD. This works at his best (on my opinion) with 30min MACD
EXAMPLE
NATURAL GAS
In this chart 30min you can see all calls triggered for a Short. Yellow RSI Arrow, Red Cross, Macd Triangle and Colored Red, Lime and Silver Bars are all calling for Short.
In this way you can see in notime if this can be a perfect moment for take position
ORDER PLANNER
This feature will help you to understand a better way to place order, where Stop Loss and Take Profit could be place. It can be manual or Automatic (based on price position if above or below VWap)
VIX VXN DXY CALLS
If VIX, VXN is triggered a small Green Dot will appear. If both are in the same time a bigger Dot appear. Very useful to find trend inversion.
If DXY is triggered a Red Dot will appear (only on Daily Chart). Very Useful to understand trend inversion on whole market.
VOLUMES REMINDERS
Find if there was an High Volume traded (HV) or Low Volume Traded (LV) in the near past. Useful to understand if some tricky situation could happen (like a sudden sell, an accumulation or distribution)
Best TradingView Strategy - For NASDAQ and DOW30 and other IndexThe script is totally based on momentum , volume and price. We have used :
1: Bollinger Band Squeezes to know when a breakout might happen.
2: Used Moving Averages(SMA and EMA) to know the direction.
3: The success Rate of this strategy is above 75% and if little price action is added it can easily surpass 90% success mark.
4: Do not worry about drawdowns , we have implemented trailing SL ,so you might see a little extra drawdown but in reality its pretty less.
5: I myself have tested this strategy for 41 days with a 250$ account and right now I have 2700$.

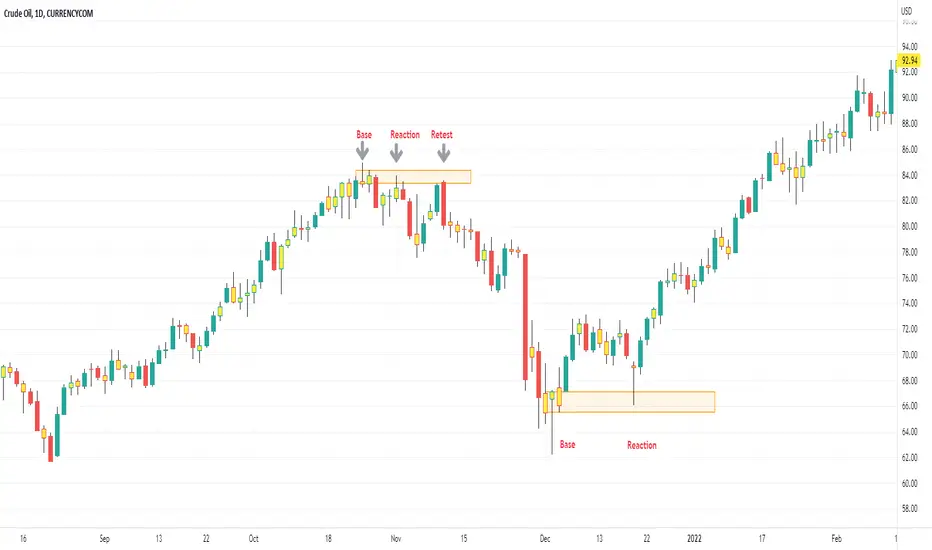
Supply and Demand - Order Block - Energy CandlesSupply and Demand - Order Block - Energy Candles
Description
An experimental script, designed as a visual aid, to highlight the last up or down candle before a fractal break. We can assume these candles where the point of origin that generated enough strength to break recent structure. By using them as reference points, traders are expected to follow their own set of rules and mark higher probability supply and demand zones in the area.
How to use:
Expect a potential retest in these areas, and if they fail, a potential retest in the opposite direction. The greater the number of times a zone is tested, the more likely it is to break. A fresh zone that has not yet been tested will have a higher probability of a bounce.
Fractal period and candle break type can be personalised in settings. Can be used on all timeframes (higher the better).
Indicator in use:
Extras:
An option to flip candle colours if current price is above or below them has been added.

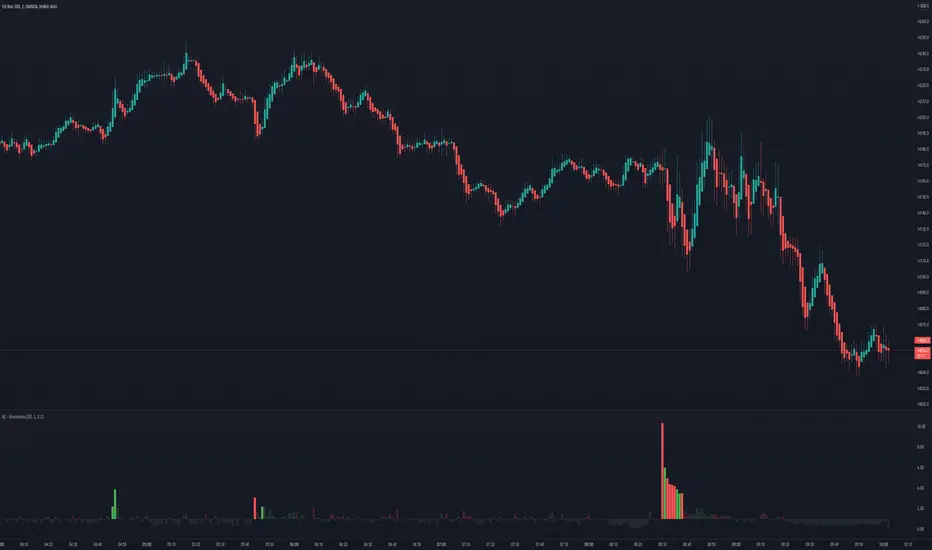
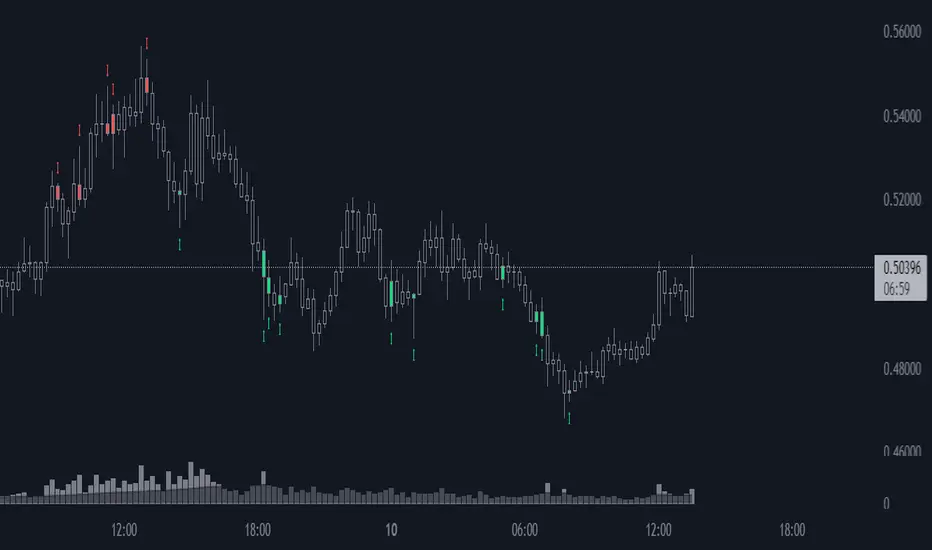
Candle Colored by Volume Z-score [Morty]This indicator colors the candles according to the z-score of the trading volume. You can easily see the imbalance on the chart. You can use it at any timeframe.
In statistics, the standard score (Z-score) is the number of standard deviations by which the value of a raw score (i.e., an observed value or data point) is above or below the mean value of what is being observed or measured. Raw scores above the mean have positive standard scores, while those below the mean have negative standard scores.
This script uses trading volume as source of z-score by default.
Due to the lack of volume data for some index tickers, you can also choose candle body size as source of z-score.
features:
- custom source of z-score
- volume
- candle body size
- any of above two
- all of above two
- custom threshold of z-score
- custom color chemes
- custom chart type
- alerts
default color schemes:
- green -> excheme bullish imbalance
- blue -> large bullish imbalance
- red -> excheme bearish imbalance
- purple -> large bearish imbalance
- yellow -> low volume bars, indicates "balance", after which volatility usually increases and tends to continue the previous trend
Examples:
* Personally, I use dark theme and changed the candle colors to black/white for down/up.
Volume as Z-score source
Any as Z-score source, more imbalances are showed

Bogdan Ciocoiu - GreuceanuDescription
This indicator is an entry-level script that simplifies volume interpretation for beginning traders.
It is a handy tool that removes all the noise and focuses traders on identifying potential smart money injections.
Uniqueness
This indicator is unique because it introduces the principle of a moving average in the context of volume and then compares it with tick-based volume.
Its uniqueness is reflected in the ability to colour code each volume bar based on the intensity of each relevant (volume) unit whilst comparing it with the volume moving average.
Another benefit of this indicator is the colour coding scheme that removes volume below a particular threshold (default set to 1) under the volume moving average.
In addition to the above features, the indicator differentiates the colour of each bar by price direction.
Open source re-use
To achieve this functionality several open source indicators have been used an integrated within the current one.
Volume DeltaVolume Delta is the difference between buying and selling power. Volume Delta is calculated by taking the difference of the volume that traded at the offer price and the volume that traded at the bid price. If delta is greater than 0 you have more buying than selling pressure. If delta is less than 0, you have more selling than buying pressure. This indicator also has a pivots and alarms. Before i create this indicator i'd try all off them on market but all off them seems doing wrong calculation. Price - Some people say "Price Action is King but actually DELTA is King!
By default, this indicator displays “Delta Volume and can be set to:
Plot Levels
Volume
Default TF:
1M
Strategy:
If you get 3 gren delta in a row its buying signal and visa versa for short. You can also use more confirmation with overbought\oversold level.

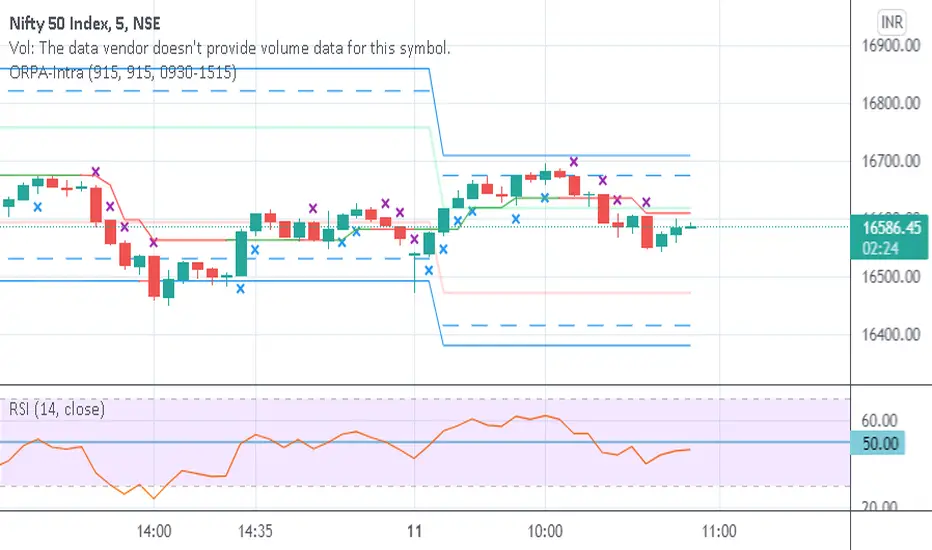
Opening Range-Price Action IntradayThis combines Opening Range of 15 min and Price Action in one script. Crosses are marked on candles for upside and downside. Break of High/Low of cross marked candles gives direction of market.
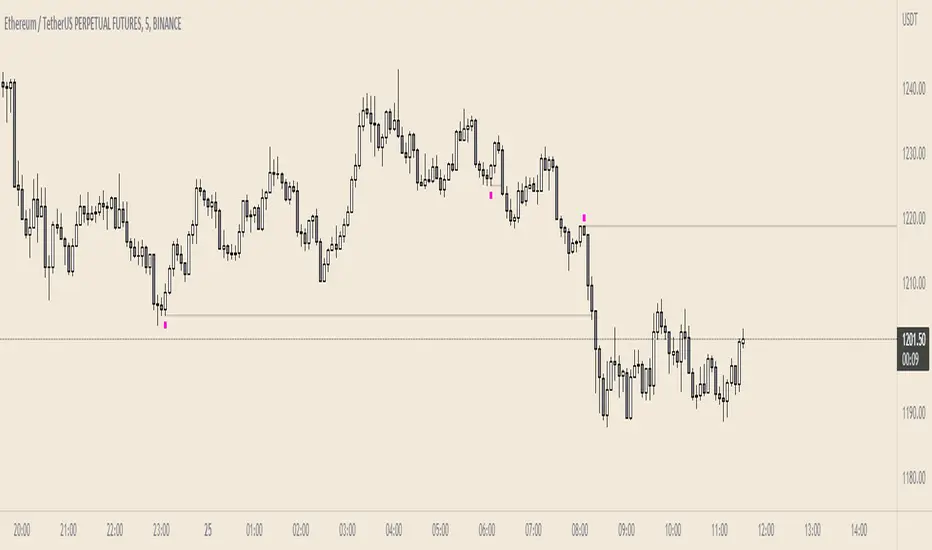
Failed AuctionAs we know, buyers and sellers take part in the market auction.
A failed auction is where price could not tick above or below a specific price. This means that there were no buyers willing to buy or sellers willing to sell beyond that price. Price then moves away in the other direction.
The failed auction acts as a magnet and becomes a target to revisit sooner or later. The failed auction is a successful/finished auction once it has been satisfied.
On the indicator, two adjacent candles with the exact same high or low are marked. The icon will appear on the high or low of the 2nd candle. This notifies us that there was a failed auction.
If you are in a trade, you can use the failed auction to hold onto the trade longer. If you are not in a trade, you should be cautious if a failed auction rests above or below you limit order.
Icons and colours are customisable. An option to have plotted lines for the failed auction is included.
Works on all timeframes.
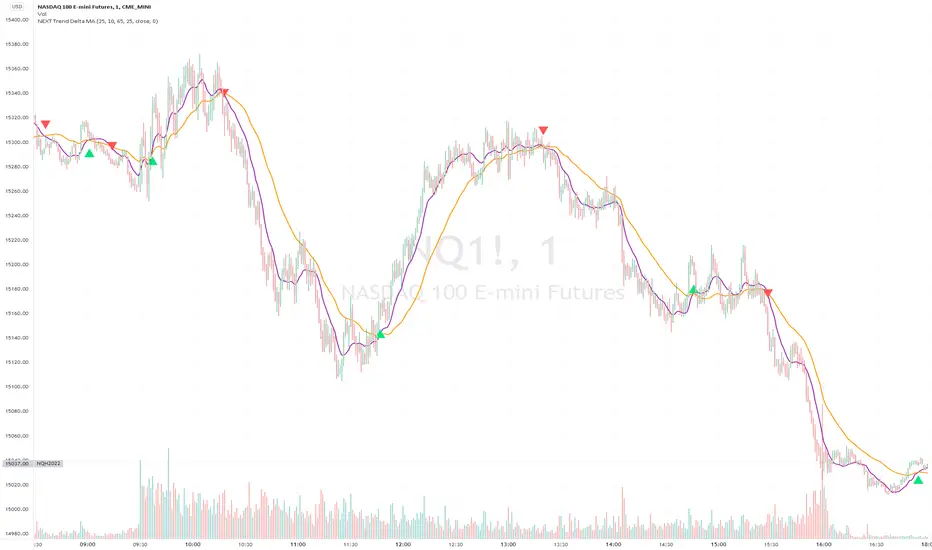
NEXT Trend Delta Moving AverageOverview:
Trend Delta Moving Average (TDMA) is a composite moving average, driven by an algorithm that tracks real-time trends in price, volume, and various changes (delta) between the two. TDMA is low lagging but filtered (smoothed) MA type, with a sometimes predictive slope (via price divergence). This indicator allows you to plot one or two TDMA lines, as well as their crossovers, expressed in the form of long/short signals.
NASDAQ 100 Futures ( CME_MINI:NQ1! ) 1-minute
This Nasdaq futures example shows both TDMA lines and their crossover signals.
Tesla ( NASDAQ:TSLA ) 1-minute
If you trade price / MA crossovers or use moving averages as part of a broader trading system, you have the option of displaying a single TDMA line without any crossover signals (arrows) by ticking Plot TDMA1 Only checkbox and unticking Plot TDMA Crossovers . Great for breakout stocks like TSLA.
TDMA vs Other Moving Averages
We spent a good amount of effort developing and differentiating Trend Delta Moving Average (TDMA) from other moving averages. We wanted a responsive MA algo that considered price and action, and that incoporated user-controlled lagless filtering (smoothing). Below is a comparison between TDMA (purple) and several popular MA types, including Exponential (blue), Simple (red), and Hull (teal). All MA lengths set to 50.
Lagless Smoothing
You may use the Trendiness input parameter to control the amount of smoothing applied to individual or both TDMA lines. Lower values (emphasis on more recent trends) produce vertically tighter slopes, with TDMA following price action more closely, while higher values (emphasis on more longer term trends) relax the slope, without introducing horizontal (time) lag.
Input Parameters:
Length TDMA1 - length of the first Trend Delta Moving Average (TDMA)
Length TDMA2 - length of the second TDMA
Trendiness TDMA1 - the amount of trend weighting added to the first TDMA line (lower = more recent trend, higher = longer term trend)
Trendiness TDMA2 - the amount of trend weighting added to the second TDMA line (lower = more recent trend, higher = longer term trend)
Source - data used for calculating the MAs, typically Close, but can be used with other price formats and data sources as well.
Offset - shifting of the TDMA lines forward (+) or backward (-).
Plot TDMA1 Only - when checked, will only plot a single TDMA line (TDMA1)
Plot TDMA Crossovers - when checked, will plot an up arrow (long signal) when TDMA1 crosses over TDMA2, and a down arrow (short signal) when TDMA1 crosses under TDMA2.
Alerts
Here is how to set price crossing TDMA1 (or TDMA2) alerts: open a TradingView chart, attach NEXT Trend Delta Moving Average (TDMA), right-click on chart -> Add Alert. Condition: Symbol (e.g. NQ) >> Crossing >> NEXT Trend Delta Moving Average (TDMA) >> TDMA1 >> Once Per Bar Close.
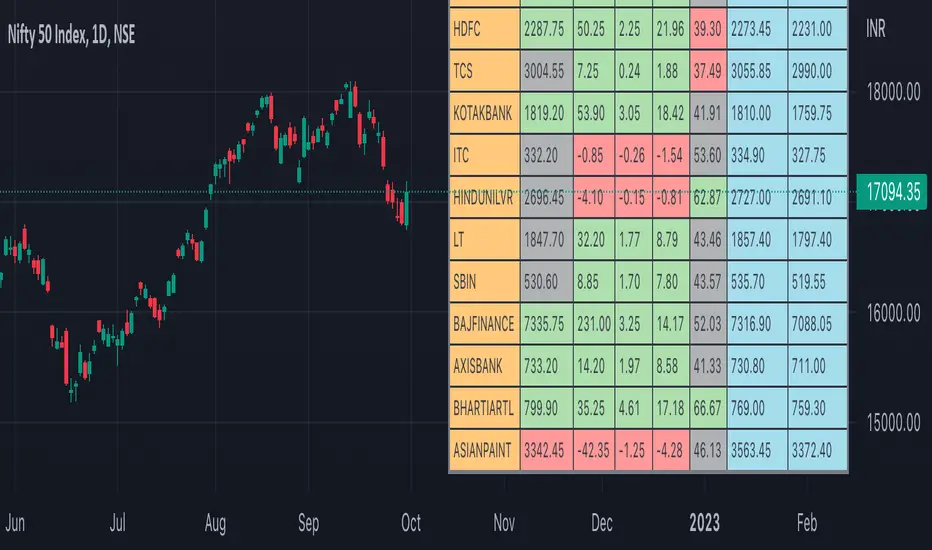
Nifty50 Participants - Top 25Nifty50 Index is calculated based on the movements of its participants. Every time you think of why is Index going up/down, who is actively dragging the index either ways, this Indicator gives you answer for the same in realtime!
This indicator will help you in pre-planning your trades based on the movements shown by different stocks of various sectors in Index calculation.
RSI column is an add-on to the participation table which will help you in getting RSI values of different stocks of Nifty 50 at a glance. You will see values getting updated in realtime in live market.
Checkout for customisations in indicator settings.
Note:
1. Participants present in this indicator and their participation percentage is taken from the official NSE website.
2. Table shows Top 25 participants by default. If you want to see less than 25 rows, you can update the input via indicator settings.
Feel free to contribute/comment changes if any! Comment in case of any suggestions :)
- Published by Soham Dixit
GBTT AWS IndicatorThis script reviews previous candle volatility and price action relative the time period chosen and creates pivots/levels/prices to watch for on each candle. This indicator can be run on any time period, but it was meant for longer intraday periods such as the 30m or 1 hour. The entry points are meant to only be valid on the candle in which they are created, once a new candle is created, the previous data is no longer valid. Thus trying to use this on a faster time period could be very difficult. Also the longer the candle has been in place, the less strength given to the entry points.

RVOL Relative Volume - IntradayHello All,
Relative Volume is one of the most important indicators and Traders should check it while trading/analyzing. it is used to identify whether the volume flows are increasing or decreasing. Relative volume measures current volume in relation to the “usual” volume for this time of the day. What is considered “usual"? For that, we have to use a historical baseline known as the average daily volume. That means how much volume a security does on a daily basis over a defined period. (This scripts runs on the time frames greater or equal 1 minute and less than 1 day)
The common definition for real-time relative volume is: Current volume for this time of day / Average volume for this time of day. It does not mean taking the volume (for example) from 10:30 am to 10:45 am and comparing it to what it does from 10:30 am to 10:45 am every day. What it truly means is to compare cumulative volumes. Therefore, this is the precise definition of real-time relative volume:
Current cumulative volume up to this time of day / Average cumulative volume up to this time of day
What should we understand while checking RVOL;
- Relative volume tell us if volume flows are increasing or decreasing
- A high relative volume tells us that there is increased trading activity in a security today
- Increased volume flows often accompany higher volatility i.e. a significant price move
Let see an example:
P.S. if you want to get more info about RVOL/Relative Volume then you can search it on the net. While developing the script this was used as reference, you can also check it for more info.
Enjoy!

[MattLet] Relative Volume for VSAThe Volume Spread Analysis (VSA) methodology focus at the relationship between price, spread, and volume, trying to identify the variations that the price of an asset may have bar by bar, candle by candle.
This indicator is based on calculates on the average volume of the bars in a close environment, that indicates when the volume is Ultrahigh, Very high , High , Normal and low.
The configuration setted is based on personal study. You can configurate the volume ratios per level, and try different results.
The indicator colors the volume bars and candles according to the volume traded.
Base colors configuration is a kind of heat map (don't forget to check the option to paint candles), but you can customize it as you wish.
Good Luck!

Favorite Signals w/EMA FilterThe script combines my favorite signals then filters them with three EMAs.
Via the Style tab, you can choose to either have the signals color the bar and/or plot a shape above/below.
All signals can be turned off via the Inputs tab, which will remove the bar color and/or shape (if not already off in the Style tab) as well as remove the pattern from the alerts function.
Remember when using TV alerts, if you change the script settngs, you must create a new alert if you wish to be alerted for the changes you've made.
LONG/SHORT SIGNALS INCLUDED FOR:
- TD8s
- TD9s
- Hammer
- Shooting Star
- Bullish Harami
- Bearish Harami
- RSI Divergences
EMA FILTER LOGIC LONGS:
- Price < Fast EMA & Med EMA > Slow EMA = Possible Long Entry
- Price > Fast EMA & Med EMA > Slow EMA = Possible Reversal, Tighten Stop or Reduce Position
EMA FILTER LOGIC SHORTS:
- Price > Fast EMA & Med EMA < Slow EMA = Possible Short Entry
- Price < Fast EMA & Med EMA < Slow EMA = Possible Reversal, Tighten Stop/Reduce Position
Big up to @spdoinkal, @HPotter, @LonesomeTheBlue, for writing the originals scripts for the signals above.
Enjoy!
Price Action [Morty]This price action indicator uses the higher timeframe SSL channel to identify trends.
The long entry signal is a bullish candlestick pattern when the price retraces to EMA20 in an uptrend.
The short entry signal is a bearish candlestick pattern when the price retraces to the EMA20 in a downrend.
Currently, this indicator shows engulfing patterns, pin bar patterns, 2 bar reversal patterns and harami patterns.
It also shows a volatility squeeze signal when the Bollinger bands is within the Kelter channels.
The buy and sell signal can also be filter by the ADX indicator greater than a threshold.
You can set your stoploss to the previous low/high when you go long/short.
The risk/reward ratio could be 1 to 1.5.
This indicator can be used in any market.

NSDT Bearish-Bullish CandlesThis is another interesting take on candlesticks . These Bearish-Bullish Candles do not show the wicks. Instead, the upper wick is made into a Red body and the lower wick is made into a Green body. If you match the candle body color in the chart settings (or turn off the candles completely), you get a unique way of seeing how Bearish or how Bullish a candle is because the wick will now match the body size and color.
This indicator is very similar to our NSDT Special High-Low Candles.

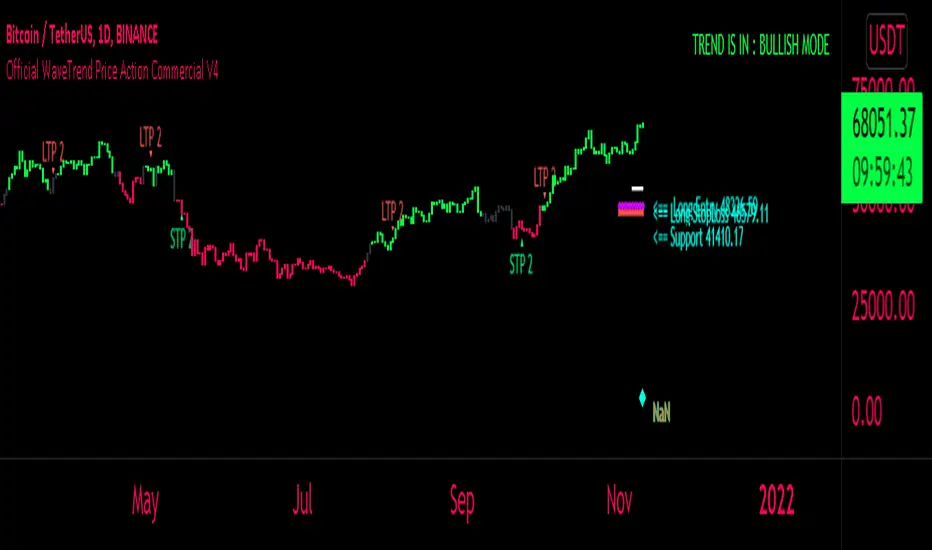
FaizanN Official WaveTrend Price Action Commercial PINEV4Hello Traders,
Here i bring you my first Price Action WaveTrend based Indictor combined with fib entry and exit trailing levels with minimum risk and maximum profit , as we must have seen at times as we enter the trend reverse and hits our stoploss . Keeping that in mind as i too struggled and made losses so i decided and focused more on minimizing the loss and only on confirmation Long or Short trade is been initiated along with Stoploss as explaned in the images below , why should we give market our money ;) as we are here to make money :D .. There is no holy grail as Stop loss wont be hit but yes it will be way less and all alerts are based on candle close ... One can use this on any chart and any timeframe and its very good for scalping too . Better results are on 15m and above . Hope you guys will like it and comment if you have any doubts..
-----------------
Disclaimer
Copyright by FaizanNawazz.
The information contained in my scripts/indicators/strategies/ideas does not constitute financial advice or a solicitation to buy or sell any securities of any type. I will not accept liability for any loss or damage, including without limitation any loss of profit, which may arise directly or indirectly from the use of or reliance on such information.
All investments involve risk, and the past performance of a security, industry, sector, market, financial product, trading strategy, or individual’s trading does not guarantee future results or returns. Investors are fully responsible for any investment decisions they make. Such decisions should be based solely on an evaluation of their financial circumstances, investment objectives, risk tolerance, and liquidity needs.
My scripts/indicators are only for educational purposes!
Happy Trading!
Aurora Candle with AlertThe indicator is derived from the concept of Aurora Candles (Credit to RK Arora)
Description
The script instantly calculates and highlights the largest candle (from high to low) in a user specified lookback period. It then plots the expected support, resistance, supply and demand levels. When a larger candle is printed, it will immediately plot the new levels.
How To Use
Use the indicator to find the largest candle in a specified lookback period.
• As soon as the Aurora candle is printed, future levels are plotted.
• If a larger candle is printed it will reset and create a new roadmap as big money dictates the market.
• The Aurora candle will mirror itself above and below X amount of times based on your settings.
• Colours, levels and lookback period are customizable.
• There is only 1 look back period. You can add more than one indicator if you want to set different lookback periods for long and short term levels.
• Alert function has been added
Access the indicator
• Contact me on TradingView
