PRICE ACTION TRAKKERThis indicator isolates the core price-phase engine from the full Price Action Tracker (PAT) system.
It identifies and visualises structural phases of price, including:
Upper phase boundary (dynamic resistance)
Lower phase boundary (dynamic support)
Phase average (mean-reversion anchor)
Pivot markers (LPH, LPL, oLPH, oLPL)
The phase engine dynamically adapts to evolving market structure using pivot behaviour and structural breaks. This creates a real-time visual map of how price is organising itself — independent of time-based indicators and without the lag associated with classical moving averages.
This version focuses exclusively on price action structure, making it clean, fast, and ideal as a core tool on its own.
However, it is also designed as a foundation for more advanced analysis and will expand over time as additional modules are released.
This phase engine works exceptionally well in combination with my other indicators, such as moving-average structure tools, volume-weighted frameworks, and trend-strength models. Together, they provide a layered view of market behaviour:
phase structure → trend bias → volume confirmation → entry logic.
This makes the indicator valuable for:
Intra-day and swing traders
Wyckoff and liquidity-based traders
Mean-reversion and range-trading strategies
Understanding where accumulation/distribution behaviour is forming
Identifying when a phase is likely ending or breaking
Future updates will add modular expansion paths (trend scoring, VWAP phase weighting, multi-phase confluence, and signal logic), while maintaining the simplicity and reliability of this core engine.
Works Best With:
This indicator is part of a broader toolkit designed to analyse structure, trend, and behaviour.
When used alongside my other published tools — such as trend-strength MAs, VWMA frameworks, and higher-timeframe bias indicators — it provides a complete, multi-layered view of market conditions.
Phases

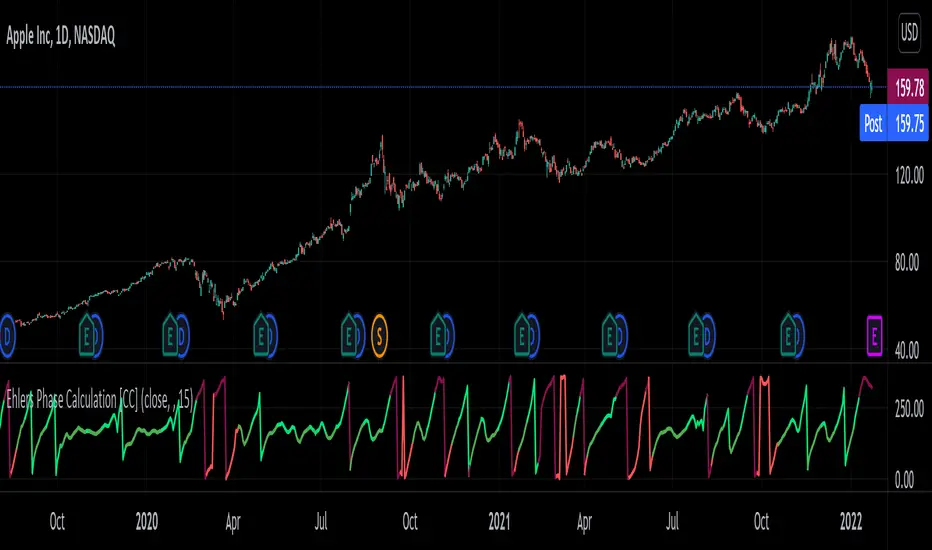
Phase CalculationPhase Calculation was authored by John F. Elders in the Stocks and Commodities Magazine 11/1996
This indicator will tell you if the stock is in a uptrend or downtrend. A phase number with a low number means it is in a uptrend and a phase number with a high number means it is in a downtrend.
Let me know if you want to see me write code for different indicators!
Market ModeThe Market Mode indicator seeks to identify trends and rebounds by identifying “phases” according to the principles of John Ehlers.
- When the oscillator passes above the top line, the market is in an uptrend.
- When the oscillator goes below the bottom line, the market is in a downtrend.
- Between these two levels, the market is calmer and could rebound in the direction of the initial trend and / or phase of trend change.

market phases - JDThis indicator shows the relation of price against different period ma's.
When put in daily Timeframe it gives the 1400 Day (= 200 Weekly) and the 200 ,100 an 50 Daily.
The lines show the 200,100 and 50 ma in relation to the 1400 ma.
JD.
#NotTradingAdvice #DYOR

Dow Phases MA V2 [ROCHA]Update Dow Phases MA for Version 2
Reformulation colors dow panic and euphoria

Dow Phases MA [ROCHA]phases of dow theory
1 - recuperation
2 - accumulation
3 - buy
4 - attention
5 - distribution
6 - sell

Hurst Exponent Market Phases [DW]This study is an experiment designed to identify market phases using changes in an approximate Hurst Exponent.
The exponent in this script is approximated using a simplified Rescaled Range method.
First, deviations are calculated for the specified period, then the specified period divided by 2, 4, 8, and 16.
Next, sums are taken of the deviations of each period, and the difference between the maximum and minimum sum gives the widest spread.
The rescaled range is calculated by dividing the widest spread by the standard deviation of price over the specified period.
The Hurst Exponent is then approximated by dividing log(rescaled range) by log(n).
The theory is that a system is persistent when the Hurst Exponent value is above 0.5, and antipersistent when the value is below 0.5.
The color scheme indicates 4 different phases I found to be significant in this formula:
- Stabilization Phase
- Destabilization Phase
- Chaos Increase Phase
- Chaos Decrease Phase
This script includes two visualization types to choose from:
- Bar Counter Mode, which displays the number of bars the exponent is consecutively in each phase.
- Hurst Approximation Mode, which displays the approximated exponent value.
Custom bar colors are included.
Please note: This is a rough estimate of the Hurst Exponent. It is not the actual exponent. Numerous approximations exist, and their results all differ slightly.
